Abstract
In the present study, a recently developed improved Self-Adaptive Turbulence Eddy Simulation (SATES) turbulence model (marked as SATES-Mixed), is validated for the simulation of complex multiple swirling turbulent flows. The new SATES-Mixed method aims to enhance both the performances in the wall region as well as the free shear layer region. For comparisons, the Large Eddy Simulation (LES) with WALE and Smagorinsky sub-grid model is also conducted with the same numerical setups. Compared with the original widely used SATES model, the SATES-Mixed model inherits the low grid sensitivity and high accuracy for free turbulence while improving the calculation accuracy in the near-wall regions. Therefore, the prediction ability of the SATES-Mixed model is validated in challenging complex swirling flows encountered in multi-stage swirl combustion chambers. Good overall agreement between SATES-Mixed and experiments is observed with relatively coarse mesh, which is even better than the LES-WALE results. The SATES-Mixed model accurately captures the typical single-vortex tube PVC evolution characteristics in a double swirling combustor (GTMC) and effectively models the complex interactions between single/double vortex tubes in a three-stage swirling combustor, including their intertwined twisting motions and mutually evolving processes.
1. Introduction
Swirling flow, as one common flow pattern, can produce a stable recirculation zone, which can return high-temperature combustion products upstream and further stabilize the combustion process [1,2]. At the same time, swirling flow has strong turbulent fluctuation and three-dimensional characteristics, which are convenient for improving the mixing efficiency of fuel and oxidants [3]. In addition, it can also achieve stable ignition under high speed conditions [4]. The Precessing Vortex Core (PVC) in the swirling flow, as a periodically moving vortex structure, can not only improve the mixing efficiency of fuel and air but also arouse the pressure fluctuation of the flow field, which is of great significance for studying the combustion coupling resonance effect [5,6]. Due to the narrow regime of single flow control and the low mixing efficiency and weak pollutant control ability of single-stage swirl, it is difficult to meet the development requirements of high-temperature-rise, advanced gas turbines. Multi-stage swirl, through the independent regulation of the inner and outer layers of the swirlers, shows significant advantages in flexibility, efficiency, and environmental protection, and it has become popular in current designs. Thus, the swirling flow is widely used in combustion chambers of various power engines. With the development of modern aero-engines, in recent industrial applications, it is more and more common to use multi-stage swirling flow [7,8] or the combination of swirling flow and jet flow.
Swirl is the inherently complex flow, which is largely due to swirl-induced separated flow and instability. Unsteadiness in swirl features in various forms, and it is triggered by many factors including flow geometry, swirl intensity, and coupling with heat release. In a swirling flame, not only does the vortex shedding process exist, but also a three-dimensional helical vortex structure is often observed, which is called the Precessing Vortex Core (PVC) structure. The PVC structure plays a crucial role in the stable combustion of swirling flames under most working conditions. Additionally, the amplitude of precessional oscillations exhibits a decreasing trend with enhanced swirling intensity. Wu et al. [9] conducted an in-depth investigation into single-swirling premixed vortex flame characteristics under varying exit contraction ratios using Large Eddy Simulation (LES). The findings indicate that vortex core development exhibits a positive correlation with exit contraction ratio variations. Specifically, increasing the contraction ratio amplifies axial flow instability while inducing pronounced core distortion. Similarly, Liu et al. [10] conducted numerical investigations on the influence of outlet contraction ratios in swirling combustors using LES. The simulation results demonstrated a comparable trend: the contraction configuration at the combustor exit effectively enhanced the formation intensity of the central vortex core. However, the resulting hydrodynamic instability has a significant impact on the instability of the combustion process [11,12]. Therefore, swirling flow and combustion constitute a complex unsteady three-dimensional phenomenon [13], and it poses an important challenge to high-fidelity numerical calculation.
Traditional experimental methods mostly rely on contact sensors, which have poor applicability to unsteady three-dimensional turbulent flows. Moreover, it is difficult to obtain the full flow field data by experiments [14,15]. With the rapid development of numerical simulation methods, they have become important auxiliary tools in the study of unsteady flow and combustion, which allow the reliable design of complex gas turbines or aero-engines. The large-scale turbulent motion is anisotropic, and the small-scale turbulent motion is isotropic. Efficient resolution for those multi-scale turbulent scales is one of the difficulties in numerical simulation technology [16]. There are three main methods for the numerical simulation of turbulence flows, RANS, LES, and DNS. DNS and LES require a large amount of computing resources, especially for high Reynolds number, wall-bounded flows. Thus, it is still difficult for LES to be widely used in industry [17,18]. The RANS method can obtain the time-averaged flow field by means of modeling the turbulence at all scales. However, for strong unsteady swirling flows, the RANS models have difficulty producing highly accurate predictions [19,20]. To sum up, effective and high-fidelity numerical simulations require the integration of high-fidelity turbulence and combustion models to address the challenges in industrial multi-stage swirling combustors [21,22,23,24].
The multi-scale turbulence modeling method has been developed rapidly in recent years, due to its advantages in balancing the accuracy and efficiency [25]. The Detached Eddy Simulation (DES) method [26] stands as one of the most widely adopted hybrid turbulence modeling techniques. It is characterized by its transition from Reynolds-Averaged Navier–Stokes (RANS) to Large-Eddy Simulation (LES) behavior, governed by specific criteria rooted in the turbulent length scale, and has extensive application in simulating diverse turbulent flows. The numerical simulation study conducted by Paik et al. [27] investigated the axisymmetric sudden expansion swirling flows at two distinct Reynolds numbers with varying swirling numbers using the Detached Eddy Simulation (DES) model. The results demonstrate a fundamental linear correlation between the precession frequency of the Central Recirculation Zone (CRZ) and the swirling number within confined spaces. A primary limitation of the zonal hybrid model, however, lies in the empirical connecting interface between the RANS and LES regions, where the turbulence model transitions without continuity—an issue that complicates the method significantly [28].
One idea of the multi-scale turbulence model is to realize the seamless coupling of unsteady RANS, LES, and DNS by introducing the resolution control function [29]. It can achieve that using one single turbulence model to cover multiple basic modeling methods, which overcomes the gap between the typically unsteady RANS and LES. In recent years, emerging self-adaptive turbulence models—such as Very-Large-Eddy Simulation (VLES) [30,31], Partially-Averaged Navier–Stokes (PANS) [32,33], and Partially-Integrated Transport Method (PITM) [34]—have garnered increasing attention within the hybrid RANS-LES framework, particularly for addressing complex industrial-relevant turbulent flow problems. Thus, it can be used for complex configurations with good accuracy and computational efficiency [35]. Xia et al. [36] conducted comprehensive model validation studies on single-stage sudden expansion swirling flows using the Very Large Eddy Simulation (VLES) method. The results demonstrated the superiority of VLES over Reynolds-Averaged Navier–Stokes (RANS) in terms of predictive accuracy for such swirling flow configurations.
As previously noted, the majority of numerical simulation studies have focused on the application of LES to single-stage swirler flow in a combustor. In contrast, studies on two-stage and three-stage swirling combustors relevant to industrial-scale applications remain relatively limited, especially using the hybrid turbulence model. It has been verified that the VLES method has good performance in high Reynolds number turbulence flow simulation [30,31]. Based on the previous work on VLES, the aim of the present study is to further develop the VLES method. Han et al. [30,31] proposed the VLES method, which has been termed Self-Adaptive Turbulence Eddy Simulation (SATES) [37] in subsequent applications. Following further development, the new model is designated as SATES-Mixed in the present study, which was renamed to avoid ambiguity and confusion. Two different isothermal turbulent flows in a confined laboratory scale multi-swirling burner are selected as test cases. Comparing the SATES-Mixed results with LES and experiments, the prediction accuracy of the new SATES-Mixed method is assessed, and the characteristics of complex multi-swirling flow are analyzed. Section 2 delineates the technical specifications of the newly developed SATES-Mixed model and provides a comprehensive presentation of the test cases alongside detailed numerical configurations. The SATES-Mixed and LES comparisons are presented and discussed in the following Section 3. The core contributions of this paper primarily reside in two key contributions. Firstly, it validates the advanced development of an enhanced SATES-Mixed model for complex swirling flows. Secondly, this work presents a systematic investigation of an industrial-relevant multi-stage swirl combustion chamber flow. Ultimately, this study aims to provide valuable insights for the applications of reliable, high-efficiency, and high-accuracy turbulence models for complex swirling flows.
2. Modeling Approach
2.1. The Early-Stage SATES Model
Notably, regarding the early versions of the SATES method developed by Han and coworkers [30,31,36,37], the method followed the name of the predecessor Speziale [38] and was called the VLES method. Meanwhile, Pope classified turbulence models in his classic work on turbulence (P. 560), and the VLES method was described as follows, “the filter and grid are too coarse to resolve 80% of the energy”. However, nearly all of the numerical calculation results of the method developed by Han et al. [30,31] showed that the directly resolved turbulent kinetic energy was larger than 90%, even on coarse grids. That is, the VLES method developed previously is fundamentally different from the “VLES” method defined by Pope. In fact, the performance of the method is similar to that of the traditional LES method defined by Pope. Based on these, this study refers to the turbulence model developed here as the Self-Adaptive Turbulence Eddy Simulation (SATES) method. This term is more suitable for the nature of the model in real applications.
Speziale [38] firstly proposed to dynamically adjust the RANS Reynolds stresses via a resolution control function to generate sub-grid-scale turbulent stresses. The original form of the resolution control function, , proposed by Speziale is:
where and are the model constants. denotes the Kolmogorov length scale, defined as:
where is the kinematic viscosity and is the dissipation rate. When the local grid is coarse, , and approaches 1, with local turbulence modeling manifesting as Reynolds-Averaged Navier–Stokes (RANS). When the local grid is extremely fine, , and Fr approaches zero, with local turbulence modeling manifesting as Direct Numerical Simulation (DNS). When lies between these two extremes, local turbulence modeling manifests as Very-Large Eddy Simulation (VLES). This constitutes the foundational framework of the original Very Large Eddy Simulation (VLES) model [38].
The function, , proposed by Speziale [38] exhibits the following shortcomings. First, the Reynolds stress decays too rapidly, failing to properly evolve into the RANS mode under local grid conditions, and its wall modeling remains inadequate. Second, reaching both the RANS and DNS limits cannot guarantee a correct LES mode between them.
Han et al. [30,31] have proposed a new formula of as follows:
where denotes the minimum value between the variables x and y. and are model constants, with assigned values of and [30,31]. and are the cut-off length scale and integral length scale, respectively. The variables , , and represent the local grid scales in three-dimensional spatial coordinates. When , will exceed 1.0. Therefore, the value of is ultimately constrained by a maximum limit of 1.0. The model coefficient, , is determined based on the assumption that the turbulent eddy viscosity coefficients of the RANS model and the LES Smagorinsky model are equal when , as shown below:
where and are parameters inherent to the Smagorinsky sub-grid turbulence model and the RANS model. Assuming the balance between turbulence generation and dissipation within the inertial subrange, the following derivation is presented for homogeneous shear turbulence:
The VLES model proposed by Han et al. [30,31], as referenced above, has undergone extensive validation in channel turbulence and single swirl flows [30,31,36,37].
In subsequent studies, it has been renamed as the SATES model [37]. Consequently, within the aforementioned framework, the SATES model is equivalent to the VLES model developed by Han et al. [30,31].
2.2. The Newly Developed SATES-Mixed Model
The previous SATES model with has achieved favorable validation outcomes in cases where mainstream regional flow development exerts a dominant influence. However, industrial multi-stage swirling is characterized by numerous narrow channels and curved walls, which have significant wall effects. This implies that in industrial simulation applications, the improved SATES model must effectively accommodate both turbulence prediction near the wall regions and the unsteady free flow prediction far away from the walls.
It is well known that the WALE (Wall-Adapting Local Eddy-viscosity) sub-grid LES model [39] works well for near-wall flow and that the Smagorinsky LES model [40] works well for free shear layer flows. Thus, it will be good to combine the two sub-grid models into one framework, aiming to establish new model parameters. The enhanced SATES model shown in this work is termed the SATES-Mixed model. This systematic adaptation enables the model to demonstrate robust performance in modeling both the near-wall turbulent flows and strongly unsteady free shear flows.
To combine the WALE and Smagorinksy model, the core is to introduce a new discriminant function , as shown in Equation (10).
where and are the strain tensor and velocity gradient, respectively. In Equation (10), is the empirical limiter constant defined in the new SATES-Mixed, and = 2.0 is adopted in order to ensure that the wall region is resolved by the WALE-like model. Otherwise, in other regions, the model is switched to the Smagorinsky model. To this end, the main model parameter in the method, , in Equation (9) is formulated as:
with Equations (10) and (11), it can be known that for the regions where , i.e., close to the wall, the regions will be solved using the WALE-like model, i.e., . Otherwise, for other regions away from the walls, is satisfied in the regions near the mainstream shear layers. It achieved the Smagorinsky-like model, i.e., .
The parameter , as shown in Equation (12), is designed to realize the combination of the two typical LES methods, where is the classical model constant and in the SATES-Mixed model. In the context of model development, serves as the model correction coefficient to ensure that the freestream region of the new SATES-Mixed model remains consistent when converted to the Smagorinsky-like model framework, thereby aligning with the coefficient range established by the classical Smagorinsky formulation.
In complex swirling flow applications, it is essential to consider potential local low Reynolds number flow regimes in the systems mainly near the walls. Accordingly, this study incorporates a low Reynolds number correction function into the newly developed SATES-Mixed model, thereby further enhancing the robustness of the proposed methodology. The specific damping function form is given as follows.
In the present study, the form of the underlying RANS modeling in SATES-Mixed is the , and the governing equations are adopted with a damping function. The transport equations of modeled turbulence kinetic energy, , and the dissipation rate, , are shown as follows,
where , , , and ref. [41] can be referred to for other details.
Within the SATES-Mixed model, the resolution control function, , continues to follow the form specified in Equation (4). The parameter, , developed through a three-scale framework, demonstrates a well-defined physical interpretation as the ratio between unresolved turbulent kinetic energy and the total turbulent kinetic energy. The resolution control function, , varies from 0 to 1 across the domain, which determines how much of the turbulence is modeled. As shown in Figure 1, the SATES-Mixed model can switch smoothly between different turbulence models as the local grid resolution changes, covering from URANS to LES and finally approaching DNS mode in a single modeling framework.
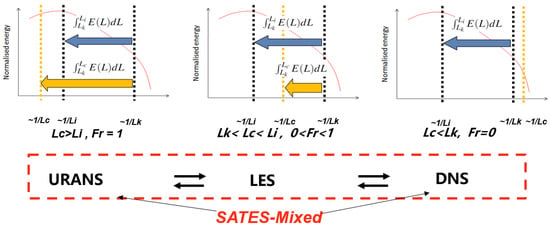
Figure 1.
Schematic diagram of different turbulence modeling modes in the SATES-Mixed framework.
From the foregoing analysis, SATES-Mixed couples the WALE and Smagorinsky sub-grid scale models. Evidently, compared to flow without heat transfer, the near-wall modeling of turbulence models demands higher requirements when heat transfer is involved. Therefore, SATES-Mixed is applied to the classical square cylinder flow with heat transfer to validate the improved computational accuracy, comparing to the early SATES and two LES models.
As shown in Figure 2, the square cylinder with a side length of d = 10 mm and a spanwise length of 4 d is used. To minimize inlet and outlet boundary effects, the center of the cylinder is positioned 10 d upstream and 15 d downstream of the inlet and outlet, respectively. The height of the computational domain is set to 14 d to maintain the same blockage ratio as in the experimental study [42]. The average value of is less than 1.0 in the direction perpendicular to the wall of the square cylinder. Two sets of computational grids with different resolutions, M1-1.5 million and M2-3.0 million, are employed. For the square cylinder case, the velocity inlet boundary condition is applied based on the corresponding Reynolds number of with a uniform temperature of 300 K. It should be noted that inflow turbulence generation techniques are important for some turbulent flow cases [43]. Periodic boundary conditions are imposed along the spanwise direction. The surfaces of the square cylinder are treated as no-slip walls with an isothermal temperature of 330 K.
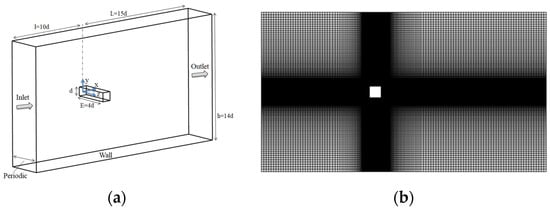
Figure 2.
Schematic diagram of the heat transfer case of flow over a square cylinder: (a) computational domain configuration; (b) local mesh detail.
As illustrated in Figure 3, the predictions of the mean Nusselt number (Numean) distribution on the square cylinder surface by various models are presented. The prediction differences of the two SATES models on the DA surface are generally small, which can be attributed to the weak turbulent flow and heat transfer characteristics on the windward surface. After passing through the DC and AB surfaces, the flow develops a recirculation zone under shear effects. At the flow-separated DC and AB surfaces as well as the leeward BC surface, the early SATES model yields notably lower heat transfer predictions. In contrast, the newly developed SATES-Mixed method demonstrates good agreement with experimental data, especially for the predictions on the leeward BC surface. In summary, the newly developed SATES-Mixed method shows improved numerical prediction capability near the wall region, especially in the coarse mesh.
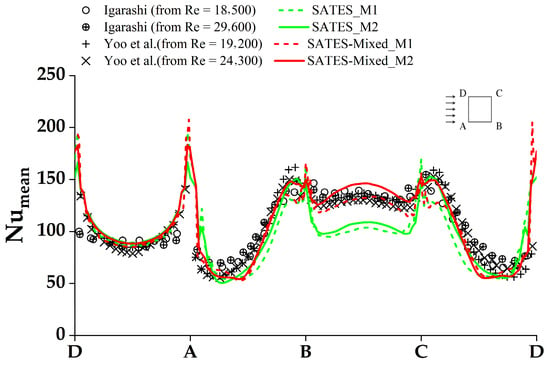
Figure 3.
Time-averaged Nusselt number predictions on square cylinder surfaces with available experimental data [42].
Furthermore, the instantaneous distribution of the resolution control function from both the SATES and SATES-Mixed model is shown in Figure 4. The resolution control function , one key parameter, effectively characterizes the distinguishing features of the model. In the early SATES model, primarily approaches 1.0 in near-wall regions and flow separation zones, manifesting the URANS mode; conversely, in the wake region where , it exhibits an LES-like mode. For the newly developed SATES-Mixed model, tends to 1.0 in both near-wall regions and the wake zone while assuming in flow shear separation regions, thus maintaining LES mode characteristics there. Consequently, compared to the SATES model, the SATES-Mixed model demonstrates a lower proportion of modeled resolution in wall-proximate separation regions but a higher proportion in the wake region.
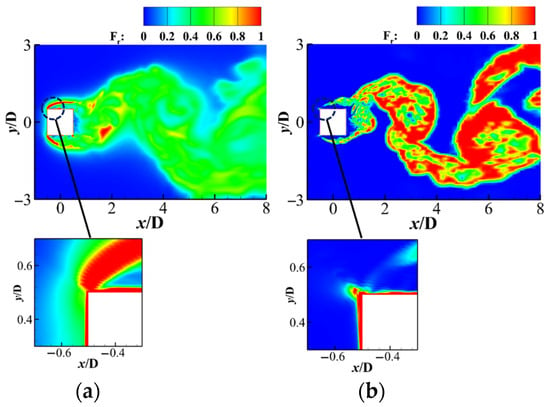
Figure 4.
Comparison of the distribution of resolution control function under fine grid M2: (a) SATES; (b) SATES-Mixed.
The SATES-Mixed offers several advantages in turbulence modeling, including the dynamically adaptive resolution of multi-scale turbulent structures commensurate with computational grid capabilities. The method exhibits low sensitivity to grid resolution variations while maintaining accuracy in complex turbulent flow simulations. SATES-Mixed simultaneously integrates the superior large-eddy modeling approaches of both the near-wall and mainstream regions, thereby exhibiting enhanced versatility and computational accuracy. This dual capability enhances its applicability for complex applications where conventional RANS approaches face limitations.
2.3. Swirling Flow Test Cases and Numerical Setup
In recent years, many gas turbine model combustors have been designed and described in detail in order to facilitate the verification and development of numerical simulation technology. In this study, the SATES-Mixed model is applied to two multi-swirling flows for verification and evaluation. One is the double swirling flow GTMC developed at DLR by Meier et al. [44,45]. This two-stage swirling burner has been used for several numerical studies [46,47,48,49].
The main structural features of the GTMC burner are two hydro cyclones and an annular fuel injection post sandwiched between them, as shown in Figure 5. The yellow area is the intake area, including the plenum, injections, and swirlers. The blue area is the combustion chamber. The red lines indicate the exact location of the follow-up data comparison, which are distributed downstream along the Y-axis and are marked as h = 2.5, 5.0, and 10 mm.
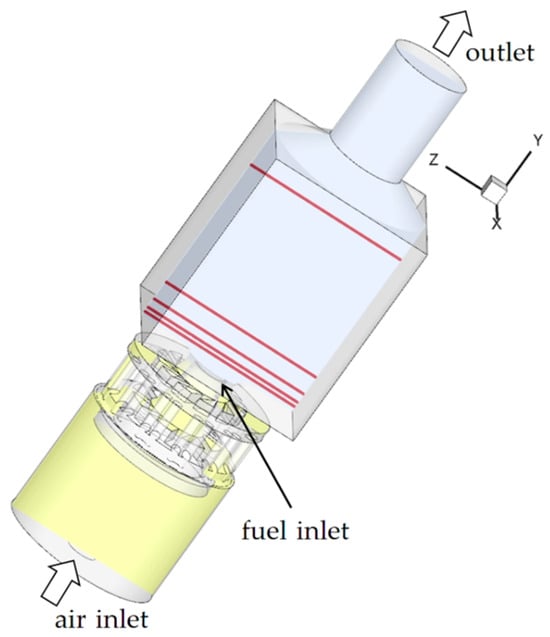
Figure 5.
Computational domain of the GTMC.
In this work, the isothermal flow of the stable CH4/air flame operates at the thermal power of Pth = 34.9 kW [45]. Especially, for non-reactive flow, air mass flow of a global equivalence ratio is injected through the fuel inlet instead of methane.
The velocity inlet boundary is adopted at both inlet boundaries and the 1/7 power distribution is used. By modifying the velocity distribution coefficient, it is ensured that the mass flow rate matching is 0.01974 kg/s for air inlet and 0.001256 kg/s for fuel inlet, which matches the experiment. For the outlet, the outflow boundary condition is used. The other geometric wall surfaces are no-slip adiabatic wall boundaries. The global hexahedron structured grid is used in GTMC, which contains about 3.2 million (coarse, marked M1) and 7.6 million (fine, marked M2) cells. Mesh M1 is shown in Figure 6.
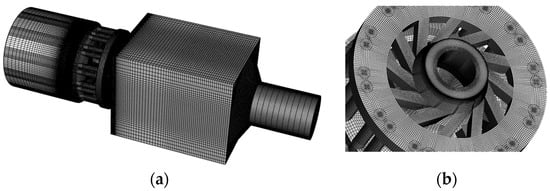
Figure 6.
Computational M1 grid schematic of the GTMC: (a) overall computational domain; (b) injections and swirlers.
Another test case is a model gas combustor with a three-stage swirling head whose main structural features are shown in Figure 7. The main structure of the three-stage swirling gas turbine is divided into two parts, the head and the combustion chamber. The head region mainly consists of the intake cavity, three-stage swirler, and other structures, and the length is 100 mm.
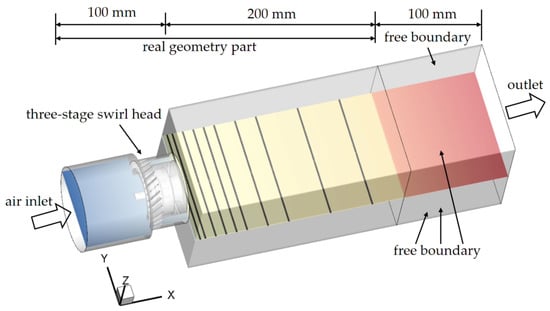
Figure 7.
Computational domain of the three-stage swirling combustor model.
The three-stage swirler is divided into two central stages. The combustion chamber is a square cavity of 200 mm in length. The distribution of the main data measured in the experiment is shown in Figure 7, marked as black lines along with the X-axis, where x = 5, 10, and 20 mm, respectively.
In the three-swirling gas turbine model, the mass flow boundary is used at the inlet, the outlet is the boundary of the pressure outlet, and the rest of the wall is adiabatic no-slip. The mass flow rate is 0.08 kg/s. The calculation domain of the three-stage swirling combustor model is discretized by two global structured grids, containing a total of 1.5 million (coarse, marked M1) and 4.0 million (fine, marked M2) cells. The M2 grid is shown in Figure 8.
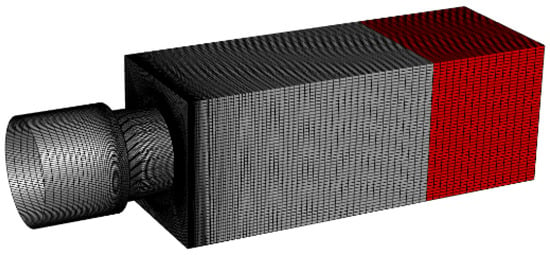
Figure 8.
Computational M2 grid schematic of the three-stage swirling combustor model.
The present SATES-Mixed model is implemented in the general purpose CFD solver, Fluent, based on the finite-volume method. For LES and SATES-Mixed simulation, the same numerical scheme and pressure–velocity coupling algorithm are used. The center difference scheme is adopted for the convective terms, the second-order upwind scheme for turbulent kinetic energy and the dissipation rate equation, and the second-order implicit Euler scheme is used for the temporal discretization. According to the criteria of stability and convergence of unsteady calculation, the time step of the GTMC model is set to be 5 × 10⁻⁶ s, and that of the three-swirling combustor model is set to be 3 × 10⁻⁶ s, which ensures that the courant number falls within a reasonable range. The statistical calculation begins after the fluid has gone through 6 cycles in the whole calculation domain. The characteristic time is estimated to be 0.04 s, and the statistical time is around 0.28 s.
3. Results and Discussion
3.1. Results of the Double Swirling Combustor (GTMC)
This section addresses the comparison of the numerical simulations of the DLR gas turbine model combustor for the SATES-Mixed and LES, including the WALE and Smag methods, with the experimental data from Widenhom et al. [49].
Figure 9 shows the axial mean velocity () and rms velocity () results for the GTMC test case. The negative axial velocity near the centerline indicates the existence of a central recirculation zone (IRZ). The distance between the two peak distributions of axial velocity can reflect the expansion angle of the swirling cup under the swirling effect. It is one of the important manifestations for verifying the swirling calculation accuracy and exploring the precession vortex core. The velocity near the wall gradually decays to zero, which represents the formation of the outer recirculation zone (ORZ) in the outermost corner of the swirling.
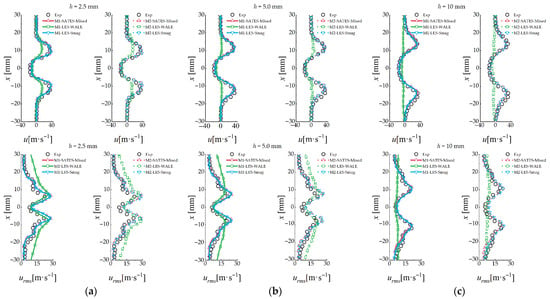
Figure 9.
Radial distributions of axial mean velocity () and rms velocity () at downstream locations, with comparisons to LES and experimental data: (a) h = 2.5 mm; (b) h = 5.0 mm; (c) h = 10 mm.
It can be seen that the SATES-Mixed and LES-Smag results agree well with the experiments and better than the LES-WALE model. Both SATES-Mixed and LES-Smag accurately predicted the double swirling characteristics of the GTMC at two computational meshes. The position of the swirling cup before h = 5.0 mm remains relatively stable, gradually expands after h = 10 mm, and the ORZ region gradually attenuates and disappears. The axial velocity results calculated by the SATES-Mixed and LES-Smag models show close alignment.
However, the LES-WALE model cannot accurately describe the swirling flow of the GTMC case on both the coarse and fine meshes. Overall, the core decay of precession vortices predicted by LES-WALE is very fast, the IRZ expansion region is large near h = 10 mm, the ORZ cannot be formed, and the flow appears to attach to the wall. The increase in mesh resolution to about 7.2 million cells did not result in a substantial improvement in the prediction accuracy for the LES-WALE model. The possible reason may be that the current mesh remains insufficient for the LES-WALE model requirements. Similarly, the LES-WALE model exhibits inaccuracies in predicting fluctuating velocity and demonstrates limited capability to effectively resolve turbulent fluctuations under the current computational conditions.
Figure 10 shows the radial mean velocity () and rms velocity () results, and Figure 11 shows the tangential mean velocity () and rms velocity () for the GTMC test case. The results are substantially consistent with the observations from Figure 9. Radial velocity plays a critical role in swirling flow. The core characteristic of a vortex is fluid rotation around an axis, with radial and tangential velocities jointly determining the angular momentum distribution. In Figure 10 and Figure 11, the increasing and decreasing trends of the radial velocity and tangential velocity are observed to exhibit a positive correlation. The LES-WALE model exhibits inaccuracies in predicting fluctuating velocities, which decay rapidly. This leads to significant discrepancies between the time-averaged velocities and experimental data. The SATES-Mixed and LES-Smag models both demonstrate high accuracy in predicting time-averaged velocity distributions. However, it is observed that in the refined M2 grid, the predictions of radial and tangential fluctuating velocities by both models were slightly higher near the upstream region at h = 10 mm compared to the coarse M1 grid. This indicates that the current SATES-Mixed model still exhibits certain sensitivity to spatial filtering scales. Furthermore, in the core shear flow regions, the SATES-Mixed model maintains the same adaptability as the LES-Smag model.
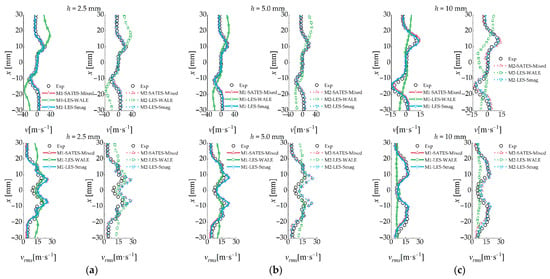
Figure 10.
Radial distributions of radial mean velocity () and rms velocity () at downstream locations, with comparisons to LES and experimental data: (a) h = 2.5 mm; (b) h = 5.0 mm; (c) h = 10 mm.
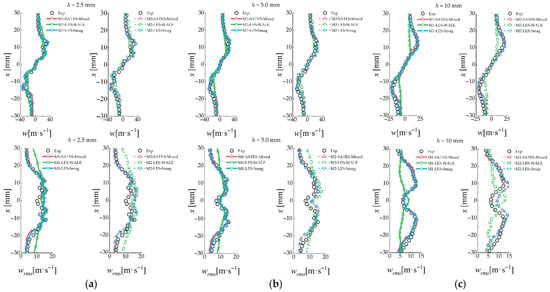
Figure 11.
Radial distributions of tangential mean velocity () and rms velocity () at downstream locations, with comparisons to LES and experimental data: (a) h = 2.5 mm; (b) h = 5.0 mm; (c) h = 10 mm.
Figure 12 provides a more intuitive visualization of the velocity distribution. The results clearly indicate that the SATES-Mixed model and LES-Smag model produce consistent predictions, while the LES-WALE model shows significant discrepancies. Specifically, two pairs of counter-rotating vortices form in the central and corner regions of the chamber. The Y-shaped central recirculation zone exhibits better continuity in both M1 and M2 meshes for the SATES-Mixed model. The LES-Smag model demonstrates improved prediction of this zone in the finer M2 mesh compared to M1. However, the LES-WALE model predicts excessive velocity attenuation, resulting in a larger M-shaped recirculation zone and failure to form the swirling cup downstream. Notably, LES-WALE fails to capture the outer recirculation zones near walls observed in the other two models. Further analysis reveals that the curved burner wall geometry (indicated by the red arrows in Figure 12a) combined with the coarse near-wall mesh resolution prevents proper LES-WALE performance. Under strong swirling-induced suction effects, the flow adheres to the wall surface, ultimately forming a Coandă flow pattern. This outcome significantly deviates from the actual physics expected in GTMC combustors.
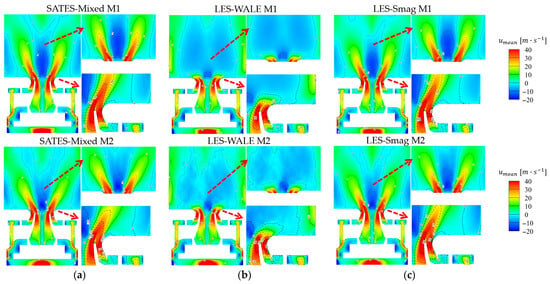
Figure 12.
Mean contours and iso-lines of the axial velocity at the mid-plane of the GTMC combustor chamber: (a) predictive distributions of SATES-Mixed; (b) predictive distributions of LES-WALE; (c) predictive distributions of LES-Smag.
To assess the quality of the numerical models, the resolution criterion suggested by Pope [50] is applied, i.e., the sum of the resolved turbulent kinetic energy, should contain at least 80%. This study compares the spatial scatter distributions of modeled turbulent kinetic energy () and directly resolved turbulent kinetic energy () from the SATES-Mixed model and the other two LES models, as shown in Figure 13. In the present LES simulations, is estimated by proposed by Lilly [51], while it is available directly in SATES-Mixed. The results indicate that the SATES-Mixed model demonstrates a higher proportion of directly resolved turbulence energy (), aligning with the grid sensitivity criteria. While both LES models show discrepancies in the kres ratios under coarse grids that improve with grid refinement, the LES model still requires finer meshing for optimal performance in complex combustion chambers such as GTMC. Through comparative analysis of and , supported by quantitative data from Figure 9, Figure 10 and Figure 11, the findings reveal that the SATES-Mixed model exhibits superior grid adaptability compared to LES. Its enhanced turbulence modeling in near-wall regions effectively reduces the prediction errors caused by grid quality variations in near-wall turbulence.
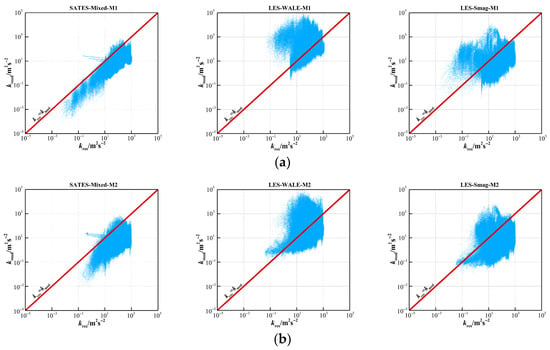
Figure 13.
Scatter plots of cell values for resolved vs. modeled turbulent kinetic energy in overall fluid of the GTMC combustor chamber: (a) results of three models under the M1 coarse mesh; (b) results of three models under the M2 fine mesh.
Swirling flows exhibit strong three-dimensional unsteady characteristics, necessitating further investigation into instantaneous fluid dynamics. Figure 14 presents large-scale Precessing Vortex Core (PVC) structures visualized through instantaneous pressure iso-surface comparisons among the three computational models. The observations reveal that the PVC forms a helical structure after entering the combustion chamber through the central vortex nozzle. As a representative large-scale vortex system in swirling flows, the PVC is successfully captured by all three models: SATES-Mixed, LES-WALE, and LES-Smag. Notably, the downstream expansion angles and forms have been found to be better predicted by SATES-Mixed and LES-Smag compared with the experimental data [45] than that of the larger angle predicted by LES-WALE. Additionally, the results predicted by the LES-WALE model failed to form well-defined helical structures and instead exhibited relatively stronger planar characteristics. This discrepancy may stem from the LES-WALE model’s less accurate prediction of the PVC near-wall region, potentially inducing Coandă effect anomalies.

Figure 14.
Iso-surface of instantaneous pressure (−4500 Pa) computed by different models, colored by mean axial velocity.
In summary, the developed SATES-Mixed turbulence simulation can effectively capture the large-scale coherent structures and their dynamic behaviors in the industrial-relevant dual-swirling combustor, i.e., GTMC.
3.2. Results of the Three-Stage Swirling Combustor
As discussed in Section 3.1, the SATES-Mixed model has demonstrated high-accuracy capabilities for three-dimensional unsteady swirling flows under coarse meshes in the double swirling flow. Furthermore, this section further applies the SATES-Mixed model to an industrial triple-swirling burner for additional validation while also investigating the flow evolution process under a three-stage swirler.
The flow patterns of the three-stage swirler exhibit greater complexity. As shown in Figure 15, the axial time-averaged velocity distributions calculated on two grid resolutions for all three models indicate that all models captured a central recirculation zone (CRZ) in the three-stage swirling combustor. The CRZ maintained a Y-shaped structure with sufficient downstream development before gradually narrowing. No recirculation zone formed between the 1-stage and 2-stage swirlers, where flows converged and mixed within the head cavity. A small recirculation zone appeared between the 2-stage and 3-stage swirlers. Such compact recirculation zones play a critical role in fuel–air mixing for multi-stage swirling combustors. The typical outer recirculation zone (ORZ) also developed between the 3-stage swirler and the combustor wall.
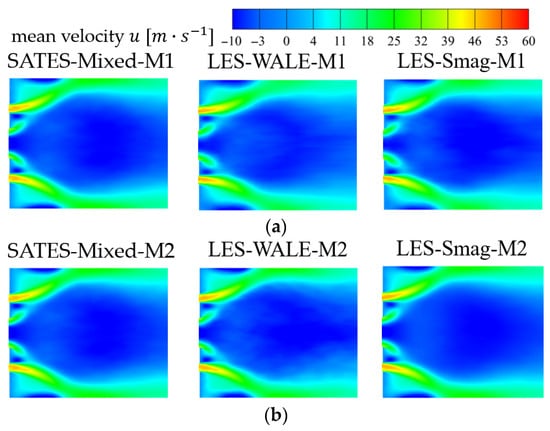
Figure 15.
Mid-section time-averaged axial velocity distribution of the three-stage swirling combustor: (a) results of three models under the M1 coarse mesh; (b) results of three models under the M2 fine mesh.
Furthermore, a detailed quantitative comparison of the flow field data for the three-stage swirling combustor is presented in Figure 16, Figure 17 and Figure 18. It can be seen that all three models demonstrate satisfactory accuracy in predicting time-averaged velocities in regions far from the wall, with velocity profiles exhibiting a typical bimodal structure that clearly identifies the locations of the three recirculation zones. The differences in computational accuracy among the models primarily manifest near the wall region. In the M1 coarse mesh, both the LES-WALE and LES-Smag models underestimate the axial and tangential time-averaged velocities while overestimating the radial time-averaged velocities within the near-wall region (−60 mm < r < −50 mm), resulting in discrepancies compared to experimental data. However, refined grids can significantly enhance the prediction accuracy of the LES model. All models show slight differences in predicting the velocity peak at r = −30 mm in mesh M1, likely due to the reduced accuracy in velocity fluctuation predictions under coarse mesh conditions. Overall, the SATES-Mixed model exhibits smaller discrepancies between the two mesh configurations, showing improved predictions near the wall region in mesh M1 compared to the other models. It should be noted that the LES model relies on a single spatial filtering scale, exhibiting high grid sensitivity and strong dependency between local flow conditions and mesh quality. This limitation becomes particularly prominent when the LES-WALE model is applied in near-wall regions, which may restrict its industrial applicability.

Figure 16.
Radial distributions of axial mean velocity () at downstream locations, with comparisons to the LES and experimental data: (a) x = 5 mm; (b) x = 10 mm; (c) x = 20 mm.

Figure 17.
Radial distributions of radial mean velocity () at downstream locations, and comparison of LES and experimental data: (a) x = 5 mm; (b) x = 10 mm; (c) x = 20 mm.

Figure 18.
Radial distributions of tangential mean velocity () at downstream locations, and comparison of LES and experimental data: (a) x = 5 mm; (b) x = 10 mm; (c) x = 20 mm.
These findings demonstrate that the newly developed SATES-Mixed model achieves reliable computational accuracy in coarse meshes, providing valuable insights for efficient and high-fidelity numerical simulations of industrial multi-stage swirling combustors.
Based on SATES-Mixed predictions from refined mesh M2, this study further investigates the vortex system evolution in a three-stage swirling combustor. Figure 19 illustrates the temporal evolution of PVC vortex precession in large-scale vortex structures, visualized through time-averaged axial velocity rendering with pressure iso-surface (−1250 Pa) as the reference. The analysis reveals the periodic evolutionary development of large-scale vortex cores, characterized by oscillatory behavior at their root regions and energy dissipation accompanied by vortex breakdown during downstream propagation. Notably, the SATES-Mixed model effectively captures the intertwined helical motion of two vortex tubes evolving into a merged single structure, providing critical insights into multi-stage swirling interactions. The interacting vortex tubes exhibit alternating cross-over patterns at the root regions and mid-section distortions. Even after merging into a unified vortex tube, the PVC evolution maintains characteristic precessional features. The enhanced SATES-Mixed model resolves the intricate precessing vortex core characteristics and predicts complex central recirculation zone vortex systems, offering substantial value for understanding the flow structures and the evolutionary mechanisms in industrial-relevant multi-stage swirling systems.
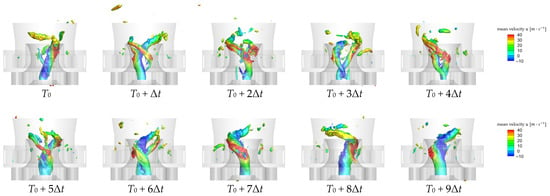
Figure 19.
Time varying on the iso-surface with instantaneous pressure (−1250 Pa) computed by SATES-Mixed in the fine mesh M2, colored by mean axial velocity.
4. Conclusions
In the present study, a newly developed SATES-Mixed method is validated for complex double swirling and triple swirling flow simulations. The new SATES-Mixed method realizes the combination of the WALE sub-grid model and the Smagorinsky sub-grid model, and they are active in different regions in the flow simulation. The two test cases show that the new SATES-Mixed method can well predict the flow field even based on the relatively low grid resolution. Additionally, an investigation into the swirling flow evolution characteristics was conducted using the computational results. The main conclusions are as follows:
- (1)
- The new SATES-Mixed model can effectively combine the advantages of the LES-Smag and LES-WALE sub-grid models at different flow regimes in swirling flow applications. It enables both high-accuracy and high-efficiency swirling turbulent flow simulation for multi-stage swirling combustors, providing a valuable reference for industrial applications.
- (2)
- The improved SATES-Mixed model shows better adaptability to complex flow features due to the complex geometric characteristics of the combustor. While maintaining sufficient accuracy, it reduces the grid sensitivity compared to conventional LES models.
- (3)
- In the dual-stage swirling combustor GTMC, the swirling flow structure exhibits a typical V-shaped configuration, and the PVC shows single-vortex-tube characteristics. The single-vortex-tube PVC demonstrates oscillation features at the root with periodic evolution of the vortex core. In the downstream region, the PVC structure evolves from large-scale vortex to small-scale vortex.
- (4)
- The three-stage swirler combustor flow features not only distinct PVC large-scale vortex structures but also strong unsteady flow characteristics including single-vortex-tube splitting into dual vortices and subsequent recombination. The interacting vortices exhibit temporal root-crossing and mid-section twisting interactions. The SATES-Mixed model accurately predicts these complex vortex systems, offering insights for flow field topology in industrial-relevant swirling combustors.
Author Contributions
Conceptualization, T.C. and X.H.; methodology, T.C.; software, Z.X.; validation, T.C. and B.W.; formal analysis, T.C. and Z.X.; investigation, Z.X. and B.W.; resources, X.H. and B.W.; data curation, T.C.; writing—original draft preparation, T.C.; writing—review and editing, T.C.; visualization, T.C.; supervision, X.H.; project administration, Z.X. and X.H. All authors have read and agreed to the published version of the manuscript.
Funding
This research was funded by the National Natural Science Foundation of China, grant number 52376114.
Data Availability Statement
The data presented in this study are available on request from the corresponding author due to privacy.
Conflicts of Interest
The authors declare no conflicts of interest.
References
- Stöhr, M.; Boxx, I.; Carter, C.; Meier, W. Dynamics of Lean Blowout of a Swirl-Stabilized Flame in a Gas Turbine Model Combustor. Proc. Combust. Inst. 2011, 33, 2953–2960. [Google Scholar] [CrossRef]
- Steinberg, A.M.; Arndt, C.M.; Meier, W. Parametric Study of Vortex Structures and Their Dynamics in Swirl-Stabilized Combustion. Proc. Combust. Inst. 2013, 34, 3117–3125. [Google Scholar] [CrossRef]
- Terhaar, S.; Oberleithner, K.; Paschereit, C.O. Impact of Steam-Dilution on the Flame Shape and Coherent Structures in Swirl-Stabilized Combustors. Combust. Sci. Technol. 2014, 186, 889–911. [Google Scholar] [CrossRef]
- Syred, N. A Review of Oscillation Mechanisms and the Role of the Precessing Vortex Core (PVC) in Swirl Combustion Systems. Prog. Energy Combust. Sci. 2006, 32, 93–161. [Google Scholar] [CrossRef]
- Spencer, A.; McGuirk, J.J.; Midgley, K. Vortex Breakdown in Swirling Fuel Injector Flows. J. Eng. Gas Turbines Power 2008, 130, 021503. [Google Scholar] [CrossRef]
- Candel, S.B. Combustion Dynamics and Control: Progress And Challenges. Proc. Combust. Inst. 2002, 29, 1–28. [Google Scholar] [CrossRef]
- Han, M.; Han, X.; Wang, X.; Li, L. Thermoacoustic Instabilities with Varying Geometries of the Main-Stage Exit in a Centrally Staged Burner. Phys. Fluids 2022, 34, 125112. [Google Scholar] [CrossRef]
- Paschereit, C.O.; Gutmark, E. The Effectiveness of Passive Combustion Control Methods. In American Society of Mechanical Engineers Digital Collection, Proceedings of the ASME Turbo Expo 2004: Power for Land, Sea, and Air, Vienna, Austria, 14–17 June 2004; American Society of Mechanical Engineers: New York, NY, USA, 2008; pp. 361–374. [Google Scholar]
- Wu, Y.; Carlsson, C.; Szasz, R.; Peng, L.; Fuchs, L.; Bai, X.S. Effect of Geometrical Contraction on Vortex Breakdown of Swirling Turbulent Flow in a Model Combustor. Fuel 2016, 170, 210–225. [Google Scholar] [CrossRef]
- Liu, T.; Bai, F.; Zhao, Z.; Lin, Y.; Du, Q.; Peng, Z. Large Eddy Simulation Analysis on Confined Swirling Flows in a Gas Turbine Swirl Burner. Energies 2017, 10, 2081. [Google Scholar] [CrossRef]
- Candel, S.; Durox, D.; Schuller, T.; Bourgouin, J.-F.; Moeck, J.P. Dynamics of Swirling Flames. Annu. Rev. Fluid Mech. 2014, 46, 147–173. [Google Scholar] [CrossRef]
- Al-Abdeli, Y.M.; Masri, A.R. Precession and Recirculation in Turbulent Swirling Isothermal Jets. Combust. Sci. Technol. 2004, 176, 645–665. [Google Scholar] [CrossRef]
- Al-Abdeli, Y.M.; Masri, A.R. Review of Laboratory Swirl Burners and Experiments for Model Validation. Exp. Therm. Fluid Sci. 2015, 69, 178–196. [Google Scholar] [CrossRef]
- Masri, A.R. Challenges for Turbulent Combustion. Proc. Combust. Inst. 2021, 38, 121–155. [Google Scholar] [CrossRef]
- Ren, Z.; Lu, Z.; Hou, L.; Lu, L. Numerical Simulation of Turbulent Combustion: Scientific Challenges. Sci. China Phys. Mech. Astron. 2014, 57, 1495–1503. [Google Scholar] [CrossRef]
- Mani, M.; Dorgan, A.J. A Perspective on the State of Aerospace Computational Fluid Dynamics Technology. Annu. Rev. Fluid Mech. 2023, 55, 431–457. [Google Scholar] [CrossRef]
- Bose, S.T.; Park, G.I. Wall-Modeled Large-Eddy Simulation for Complex Turbulent Flows. Annu. Rev. Fluid Mech. 2018, 50, 535–561. [Google Scholar] [CrossRef] [PubMed]
- Kawai, S.; Larsson, J. Wall-Modeling in Large Eddy Simulation: Length Scales, Grid Resolution, and Accuracy. Phys. Fluids 2012, 24, 015105. [Google Scholar] [CrossRef]
- Luo, G.; Dai, H.; Dai, L.; Qian, Y.; Sha, C.; Zhang, Y.; Wu, B. Review on Large Eddy Simulation of Turbulent Premixed Combustion in Tubes. J. Therm. Sci. 2020, 29, 853–867. [Google Scholar] [CrossRef]
- Benim, A.C.; Deniz Canal, C.; Boke, Y.E. A Validation Study for RANS Based Modelling of Swirling Pulverized Fuel Flames. Energies 2021, 14, 7323. [Google Scholar] [CrossRef]
- Komarek, T.; Polifke, W. Impact of Swirl Fluctuations on the Flame Response of a Perfectly Premixed Swirl Burner. J. Eng. Gas Turbines Power 2010, 132, 061503. [Google Scholar] [CrossRef]
- Sentyabov, A.V.; Gavrilov, A.A.; Dekterev, A.A. Investigation of Turbulence Models for Computation of Swirling Flows. Thermophys. Aeromech. 2011, 18, 73–85. [Google Scholar] [CrossRef]
- Zhou, L. A Review for Measurements and Simulations of Swirling Gas-Particle Flows. Exp. Comput. Multiph. Flow 2023, 5, 133–141. [Google Scholar] [CrossRef]
- Chaouat, B. The State of the Art of Hybrid RANS/LES Modeling for the Simulation of Turbulent Flows. Flow Turbul. Combust. 2017, 99, 279–327. [Google Scholar] [CrossRef] [PubMed]
- Spalart, P.R. Strategies for Turbulence Modelling and Simulations. Int. J. Heat Fluid Flow 2000, 21, 252–263. [Google Scholar] [CrossRef]
- Spalart, P.R. Detached-Eddy Simulation. Annu. Rev. Fluid Mech. 2009, 41, 181–202. [Google Scholar] [CrossRef]
- Paik, J.; Sotiropoulos, F. Numerical Simulation of Strongly Swirling Turbulent Flows through an Abrupt Expansion. Int. J. Heat Fluid Flow 2010, 31, 390–400. [Google Scholar] [CrossRef]
- Hamba, F. Log-Layer Mismatch and Commutation Error in Hybrid RANS/LES Simulation of Channel Flow. Int. J. Heat Fluid Flow 2009, 30, 20–31. [Google Scholar] [CrossRef]
- Guo, L.; Zhao, D.; Xu, J.; Tokhi, M.O.; Karimi, H.R. Predicting Unsteady Heat-Fluid Interaction Features and Nonlinear Acoustic Behaviors in Standing-Wave Thermoacoustic Engines Using Unsteady RANS, LES and Hybrid URANS/LES Methods. Int. Commun. Heat Mass Transf. 2023, 142, 106617. [Google Scholar] [CrossRef]
- Han, X.; Krajnović, S. An Efficient Very Large Eddy Simulation Model for Simulation of Turbulent Flow. Int. J. Numer. Methods Fluids 2013, 71, 1341–1360. [Google Scholar] [CrossRef]
- Han, X.; Krajnović, S. Validation of a Novel Very Large Eddy Simulation Method for Simulation of Turbulent Separated Flow. Int. J. Numer. Methods Fluids 2013, 73, 436–461. [Google Scholar] [CrossRef]
- Jeong, E.; Girimaji, S.S. Partially Averaged Navier–Stokes (PANS) Method for Turbulence Simulations—Flow Past a Square Cylinder. J. Fluids Eng. 2010, 132, 121203. [Google Scholar] [CrossRef]
- Foroutan, H.; Yavuzkurt, S. A Partially-Averaged Navier–Stokes Model for the Simulation of Turbulent Swirling Flow with Vortex Breakdown. Int. J. Heat Fluid Flow 2014, 50, 402–416. [Google Scholar] [CrossRef]
- Chaouat, B.; Schiestel, R. Hybrid RANS/LES Simulations of the Turbulent Flow over Periodic Hills at High Reynolds Number Using the PITM Method. Comput. Fluids 2013, 84, 279–300. [Google Scholar] [CrossRef]
- Lee, C.; Jiang, X. Flow Structures in Transitional and Turbulent Boundary Layers. Phys. Fluids 2019, 31, 111301. [Google Scholar] [CrossRef]
- Xia, Z.; Han, X.; Mao, J. Assessment and Validation of Very-Large-Eddy Simulation Turbulence Modeling for Strongly Swirling Turbulent Flow. AIAA J. 2020, 58, 148–163. [Google Scholar] [CrossRef]
- Wu, W.; Xie, N.; Min, Y.; Han, X.; Ma, Y.; Yan, Z. Self-Adaptive Turbulence Eddy Simulation for Complex Flows on a High-Order Finite Differencing PHengLEI-HyOrder Solver. Aeronaut. J. 2025, 129, 2036–2054. [Google Scholar] [CrossRef]
- Speziale, C.G. Turbulence Modeling for Time-Dependent RANS and VLES: A Review. AIAA J. 1998, 36, 173–184. [Google Scholar] [CrossRef]
- Nicoud, F.; Ducros, F. Subgrid-Scale Stress Modelling Based on the Square of the Velocity Gradient Tensor. Flow Turbul. Combust. 1999, 62, 183–200. [Google Scholar] [CrossRef]
- Johansen, S.T.; Wu, J.; Shyy, W. Filter-Based Unsteady RANS Computations. Int. J. Heat Fluid Flow 2004, 25, 10–21. [Google Scholar] [CrossRef]
- Shih, T.-H.; Liou, W.W.; Shabbir, A.; Yang, Z.; Zhu, J. A New k-ϵ Eddy Viscosity Model for High Reynolds Number Turbulent Flows. Comput. Fluids 1995, 24, 227–238. [Google Scholar] [CrossRef]
- Lyn, D.A.; Rodi, W. The Flapping Shear Layer Formed by Flow Separation from the Forward Corner of a Square Cylinder. J. Fluid Mech. 1994, 267, 353–376. [Google Scholar] [CrossRef]
- Bazdidi-Tehrani, F.; Bodaghi, D.; Kiamansouri, M. Large Eddy Simulation of Flow and Pollutant Dispersion in a Street Canyon: Analysis of Performance of Various Inflow Turbulence Generation Techniques. Environ. Fluid Mech. 2023, 23, 1283–1312. [Google Scholar] [CrossRef]
- Meier, U.; Heinze, J.; Freitag, S.; Hassa, C. Spray and Flame Structure of a Generic Injector at Aeroengine Conditions. J. Eng. Gas Turbines Power 2011, 134, 031503. [Google Scholar] [CrossRef]
- Meier, W.; Duan, X.R.; Weigand, P. Investigations of Swirl Flames in a Gas Turbine Model Combustor. Combust. Flame 2006, 144, 225–236. [Google Scholar] [CrossRef]
- Ali, A.B.S.; Kriaa, W.; Mhiri, H.; Bournot, P. Detached-Eddy Simulations (DES) of a Complex Swirl Stabilized Gas Turbine Model Combustor. Int. J. Energy Environ. 2016, 7, 397. [Google Scholar]
- Zhang, P.; Park, J.-W.; Wu, B.; Zhao, X. Large Eddy Simulation/Thickened Flame Model Simulations of a Lean Partially Premixed Gas Turbine Model Combustor. Combust. Theory Model. 2021, 25, 1296–1323. [Google Scholar] [CrossRef]
- Widenhorn, A.; Noll, B.; Aigner, M. Numerical Characterization of the Reacting Flow in a Swirled Gasturbine Model Combustor. In High Performance Computing in Science and Engineering ’08; Nagel, W.E., Kröner, D.B., Resch, M.M., Eds.; Springer: Berlin/Heidelberg, Germany, 2009; pp. 365–380. ISBN 978-3-540-88301-2. [Google Scholar]
- Widenhorn, A.; Noll, B.; Aigner, M. Numerical Study of a Non-Reacting Turbulent Flow in a Gas-Turbine Model Combustor. In Proceedings of the 47th AIAA Aerospace Sciences Meeting including The New Horizons Forum and Aerospace Exposition, Orlando, FL, USA, 5–8 January 2009. [Google Scholar]
- Pope, S.B. Ten Questions Concerning the Large-Eddy Simulation of Turbulent Flows. New J. Phys. 2004, 6, 35. [Google Scholar] [CrossRef]
- Lilly, D.K. The Representation of Small-Scale Tubulence in Numerical Simulation Experiments. In Proceedings of the IBM Scientific Computing Symposium on Environmental Sciences, Yorktown Heights, NY, USA, 14–15 November 1966; pp. 195–210. [Google Scholar]
Disclaimer/Publisher’s Note: The statements, opinions and data contained in all publications are solely those of the individual author(s) and contributor(s) and not of MDPI and/or the editor(s). MDPI and/or the editor(s) disclaim responsibility for any injury to people or property resulting from any ideas, methods, instructions or products referred to in the content. |
© 2025 by the authors. Licensee MDPI, Basel, Switzerland. This article is an open access article distributed under the terms and conditions of the Creative Commons Attribution (CC BY) license (https://creativecommons.org/licenses/by/4.0/).