Abstract
At present, various advanced technologies for field development based on gas-enhanced oil recovery (EOR) methods are widely applied worldwide. These include high-pressure gas injection (hydrocarbon gases, nitrogen, flue gases), water-alternating-gas (WAG) injection, and carbon dioxide (CO2) flooding. This study presents the results of filtration experiments investigating the application of gas EOR methods using core samples from a heavy oil reservoir. The primary objective of these experiments was to determine the oil displacement factor and analyze changes in interfacial tension upon injection of different gas agents. The following gases were utilized for modeling gas EOR processes: nitrogen (N2), carbon dioxide (CO2), and hydrocarbon gases (methane, propane). The core samples used in the study were obtained from the East Moldabek heavy oil field in Kazakhstan. Based on the results of the filtration experiments, carbon dioxide (CO2) injection was identified as the most effective gas EOR method in terms of increasing the oil displacement factor, achieving an incremental displacement factor of 5.06%. Other gas injection methods demonstrated lower efficiency.
1. Introduction
According to the 2024 World Energy Statistical Review by the Energy Institute, Kazakhstan’s oil production in 2023 amounted to 90 million tons, which is a 6.8% increase compared to the previous year []. A significant portion of Kazakhstan’s hydrocarbon resources consists of heavy crude oils, which are classified as oils with a viscosity greater than 30 mPa·s [,,]. According to the Kazakh Scientific Research Geological Exploration Oil Institute (KazSRGEOI), the primary reserves of such oils are concentrated in Western Kazakhstan, specifically in the Karazhanbas, Buzachi, Kalamkas, and Kenkiyak fields. These fields are geographically aligned from northeast to southwest. Overall, Kazakhstan has 47 heavy oil fields, with total geological reserves in categories A + B + C1 + C2 amounting to 1.32 billion tons. The remaining recoverable balance reserves of heavy oil in Kazakhstan are 934 million tons [,,,].
The distribution of enhanced oil recovery (EOR) methods used worldwide is presented in Figure 1. There is a clear trend towards increased application of gas-based EOR methods, including CO2 injection [,,,,].
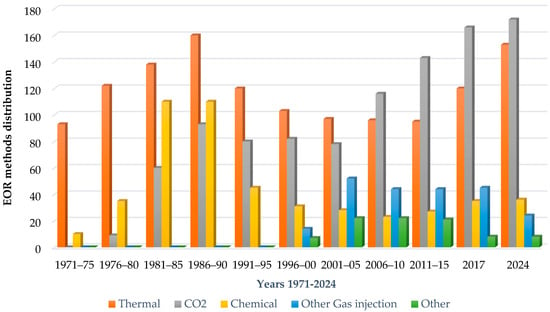
Figure 1.
Application of enhanced oil recovery methods worldwide [].
Currently, various effective reservoir development technologies based on gas-enhanced oil recovery (EOR) methods are actively applied worldwide. These methods include high-pressure gas injection (hydrocarbon gases, nitrogen, flue gases), water–gas injection, and carbon dioxide (CO2) injection [,,,,,,,,,,,]. In this approach, gas is injected into the reservoir to increase pressure, where it dissolves in the reservoir oil, thereby enhancing its mobility under reservoir conditions. Industrial tests have shown that at high pressures, almost all components of oil can dissolve in gas, with the exception of asphaltenes and other heavy constituents [,]. When pressure is reduced at the surface, the gas saturated with oil vapors condenses into valuable condensate. Thus, the principle of this method is based on artificially transforming the oil reservoir into a gas-condensate reservoir [].
Despite the aforementioned advantages, gas EOR methods have several drawbacks [,,,,,,,]:
- Very high pressure is required (40–80 MPa);
- Expensive equipment;
- Lower reservoir coverage compared to traditional waterflooding;
- Increased corrosive activity of the displacing agent.
Gas-enhanced oil recovery (EOR) methods are widely used to enhance oil production efficiency in mature fields []. Below is a table summarizing the main gas EOR methods, their advantages, disadvantages, and economic profitability (Table 1).

Table 1.
Summary of features of Gas-Enhanced Oil Recovery (EOR) methods.
Gas-Enhanced Oil Recovery (EOR) methods are predominantly applied in condensate gas reservoirs and offshore fields [,]. In Kazakhstan, the method of gas cycling or reverse gas injection is widely used in giant fields such as Tengiz and Kashagan due to the high sulfur content (H2S) of the oil and the lack of sufficient market opportunities for sulfur sales. The widespread application of EOR methods could increase the recoverable oil reserves by at least 5–15% [].
In the study by the authors [], pilot tests of CO2/N2 mixture injection were successfully conducted in a test well. After injecting 40,000 m3 of nitrogen (N2) and 300 tons of carbon dioxide (CO2), a production increase of 275 tons of oil was observed, which confirms the potential of this technology for enhancing the oil recovery of heavy oil.
In the case of nitrogen and flue gas injection, the authors [] identified the main applicability criteria as high reservoir pressures (over 30–35 MPa) and the presence of light oils in the reservoir. Under these conditions, oil displacement by nitrogen and flue gases occurs. At lower pressures, either piston-type oil displacement by nitrogen or displacement in conditions of limited solubility is possible.
The authors [] state that gas injection is an effective EOR technology for improving oil recovery in non-traditional oil-bearing reservoirs. The mechanisms for oil extraction when injecting gas within EOR methods include multi-contact miscibility, diffusion, and evaporative–condensing gas displacement, which is confirmed by the analysis of ternary diagrams and core modeling results.
This paper presents the results of filtration studies on the application of gas EOR methods on core samples from a heavy oil reservoir. The aim of the filtration studies was to determine the oil displacement factor and changes in interfacial tension when injecting gas agents. For modeling the gas EOR methods, the following gas agents were used: nitrogen (N2), carbon dioxide (CO2), and hydrocarbon gases (methane, propane). The filtration studies were conducted using core material from the Cretaceous reservoir of the East Moldabek field, Kazakhstan.
2. Equipment and Materials
The following section presents the technological process related to the preparation and analytical cycles applied during the laboratory experiments.
2.1. Sample and Core Preparation for Standard Laboratory Analysis
To clean the core samples, a Soxhlet apparatus (Büchi Labortechnik AG, Flawil, Switzerland) was used, followed by washing with organic solvents—a mixture of alcohol and benzene. A Soxhlet apparatus was employed to remove residual oil and bitumen from core samples after displacement experiments. The apparatus enables continuous solvent extraction by repeatedly washing the solid sample with boiling solvent vapors, which condense and percolate through the sample in a thimble.
After complete cleaning, all samples were dried in a drying oven (DKN 600, Yamato Scientific Co., Ltd., Tokyo, Japan) until a constant weight was achieved. The drying was performed at a controlled temperature of 60 °C for 24 h to ensure the complete removal of moisture or residual fluids. This oven provides uniform temperature distribution and high precision, which are critical for accurate mass measurements in fluid content analysis.
After determining the basic volume and weight parameters, the samples were placed in a glass desiccator to minimize atmospheric moisture adsorption and subsequently transferred for further standard core analysis (porosity and gas permeability determination).
2.2. Measurement of Oil and Water Viscosity at Atmospheric Pressure and Reservoir Temperature
The viscosity of the reservoir fluid (oil and water) was measured using an Anton Paar SVM™ 4001 viscometer (Anton Paar GmbH, Graz, Austria) (Figure 2). Before starting the measurements, the device is powered on and automatically calibrated. The measurement temperature is set to match the reservoir temperature (24–25 °C). The device provides high-precision viscosity readings across a wide temperature range and was used in this study to characterize crude oil and water viscosities at reservoir-simulated conditions. To prevent cross-contamination, the instrument’s measuring cell is cleaned before loading each sample. Oil and water samples are preconditioned to room temperature and, if necessary, purified from solid impurities before testing.
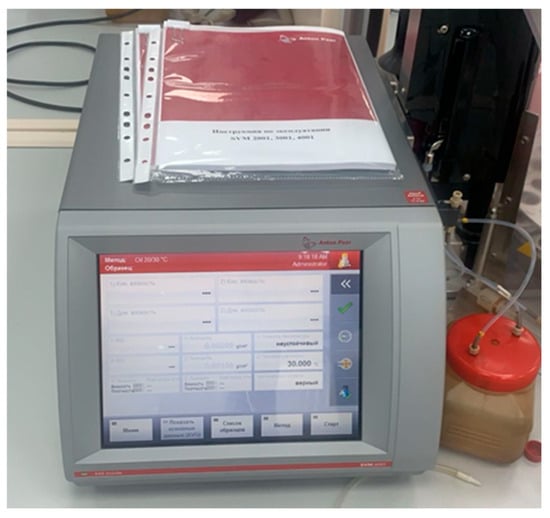
Figure 2.
Anton Paar SVM 4001 Viscometer.
For measurements, the sample is introduced into the measuring cell using a syringe or dispenser. The viscometer automatically determines the viscosity, and the results are displayed on the screen as values of both dynamic and kinematic viscosity. After each measurement, the measuring cell is cleaned using appropriate solvents to remove any sample residues, and the instrument is prepared for the next measurement.
Due to the limitations of standard rotational viscometers for gaseous media, the viscosities of CO2, CH4 (methane), C3H8 (propane), and N2 (nitrogen) were not measured experimentally using the Anton Paar SVM™ 4001 device. Instead, their values were estimated using the Ely and Hanley correlation, which has been extensively validated for predicting the viscosity of pure gases and gas mixtures under elevated pressure and temperature conditions [,,].
2.3. Measurement of Surface and Interfacial Tension of Liquids
Since the formation temperature of the field is 24–25 °C, which is close to standard conditions, the drop shape method (optical method) was used for measuring surface and interfacial tension. This method does not require the use of a tensiometer, and the formation pressure of 2–2.2 MPa was created using pumping equipment. This approach provides reliable results at moderate pressures. The drop shape method is used for measuring surface and interfacial tension in instruments for measuring contact angles in the DSA series. With standard optical equipment, the allowable measurement range is from 0.1 mN/m to several hundred mN/m.
2.4. Methodology for Measuring Surface and Interfacial Tension
1. Preparation for the Experiment
1.1. Clean all containers and capillaries of impurities.
1.2. Prepare the investigated samples of oil and water.
2. Measurement of Interfacial Tension Oil–Water (Drop Shape Method)
2.1. Place water in the research cell.
2.2. Form a drop of oil in the water using a syringe.
2.3. Photograph the shape of the drop using the optical system.
2.4. Analyze the drop parameters (radius, height) using software to calculate interfacial tension.
3. Measurement of Surface Tension Oil–Nitrogen or Water–Nitrogen (Maximum Bubble Pressure Method)
3.1. Fill the cell with the investigated liquid (oil or water).
3.2. Immerse a capillary with a known diameter into the liquid.
3.3. Connect the capillary to a nitrogen source and gradually increase the gas pressure.
3.4. Record the pressure at the moment the bubble begins to form.
3.5. Calculate the surface tension using the formula:
where P is the maximum bubble pressure, and r is the capillary radius.
4. Measurement of Interfacial Tension Oil–Nitrogen or Water–Nitrogen, Oil–CO2, Water–CO2, Oil–Methane, Water–Methane, Oil–Propane, Water–Propane.
4.1. Repeat steps 3.1–3.5, replacing the liquid and controlling the parameters.
5. Measurement of Surface Tension Oil–Water (Capillary Rise Method).
5.1. Fill the capillary with the investigated liquid (oil or water).
5.2. Immerse the capillary into the other liquid (water for oil and vice versa).
5.3. Record the height of liquid column in the capillary.
5.4. Calculate the surface tension using the formula:
where is the height of the liquid column, is the capillary radius, is the difference in liquid densities, and is the acceleration due to gravity.
All measurements are repeated at least 3 times to obtain an average value. The obtained results are presented in Figure 3 and Figure 4.
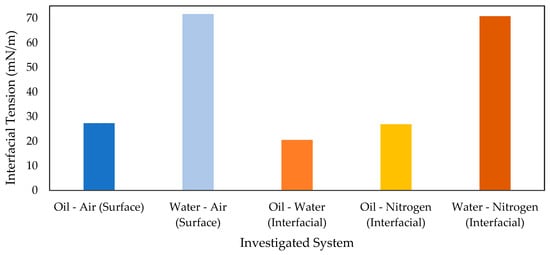
Figure 3.
Dependence of interfacial tension on the injected agent (N2 injection).
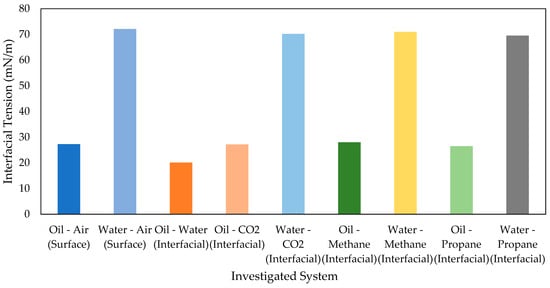
Figure 4.
Dependence of interfacial tension on the injected agent (CO2, methane CH4, propane C3H8).
The surface tension values indicate the potential interaction and dissolution of displacing agents with formation fluids—oil and water. From Figure 3 and Figure 4, it is clear that gas agents (CO2 and hydrocarbon gas propane) dissolve well in oil, which helps reduce its viscosity and improves flow. This can lead to an enhanced oil displacement factor when using these agents.
2.5. Methodologies of Special Core Analysis Performed on Cylindrical Core Samples
To saturate the core samples with formation water, an automatic saturator (AST-600, Geocomp Corporation, Acton, MA, USA) was used. This device allows for automated selection of air evacuation time and saturation pressure, ensuring quick and complete saturation of the core samples.
For conducting specialized filtration experiments, the PLS-200 system (Geocomp Corporation, Acton, MA, USA) with four hydrostatic core holders was used (Figure 5). Initially, the samples were saturated with formation water and then placed into the hydrostatic core holders of the equipment.
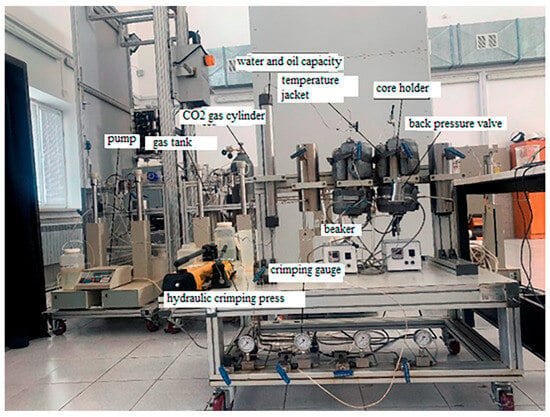
Figure 5.
PLS-200 System with 4 hydrostatic core holders.
The PLS-200 system is a high-pressure core flooding apparatus equipped with four hydrostatic core holders capable of operating at temperatures up to 150 °C and pressures of up to 10,000 psi. Each core holder is jacketed for temperature control and connected to precision pumps for fluid injection. In this study, it was used to conduct gas injection experiments with CO2, CH4, C3H8, and N2, allowing detailed measurements of displacement factor and pressure profiles under controlled laboratory conditions.
All filtration experiments were conducted without the application of backpressure, as the volume of produced fluids was calculated using a material balance approach.
2.6. Experimental Procedure
1. Core samples are initially 100% saturated with a model of formation water.
2. During each experiment, the core holders were enclosed in specialized heating jackets, maintaining the temperature at the reservoir level of 25 °C. A confining pressure of 6.7 MPa was applied to simulate effective in situ conditions. Throughout the experiment, the system automatically maintained this effective pressure to minimize pore space deformation and its impact on saturation. Reservoir pressure was simulated by injecting water into the pore space until a pressure of 4 MPa was reached.
3. Water permeability is measured at multiple flow rates (at least three) using formation water. The permeability was calculated using Darcy’s law as follows:
where K—water permeability of the core sample, µm2; Q—volume of formation water passed through the core, cm3; μ—viscosity of water, mPa·s; L—length of the core sample, cm; t—filtration time, s; F—cross-sectional area of the core sample, cm2; ΔP—pressure drop across the sample, atm.
4. Residual water saturation is achieved by injecting filtered refined kerosene into the core column. Filtration is continued until the pressure drop stabilizes.
5. Oil is injected into the column to displace the remaining water. Oil filtration continues until the pressure drop stabilizes. Oil permeability at residual water saturation is then calculated.
6. Oil is displaced by water at a constant flow rate until either saturation and pressure differential stabilize or 11–12 pore volumes are injected. Oil is displaced by formation water until the maximum water cut is reached. The volume of produced water and injection rate are recorded. In the core flooding experiments, oil was displaced by technical water. Graduated cylinders were connected to the outlet ports of the core holders to collect and quantify the produced oil, allowing for calculation of the oil recovery factor.
The oil displacement factor by water was determined as the ratio of the volume of recovered oil to the initial oil volume present in the core before the injection:
7. A gas agent (nitrogen, CO2, or hydrocarbon gas) is injected at reservoir pressure at a constant rate. The volume of displaced oil is measured.
8. For hydrocarbon gases (methane and propane), the previous steps were repeated, but in step 7, methane was gradually replaced with propane.
3. Research Object
The East Moldabek field has a complex geological and physical structure of productive layers, a weakly cemented reservoir, gas–oil zones, as well as low initial reservoir pressure and heavy oil in the Cretaceous horizons. The results of well exploitation at the East Moldabek field indicate the low efficiency of traditional methods of influence [,].
The East Moldabek field is located in the southeastern part of the Caspian Depression, in the interfluve of the Sagiz–Emba rivers. In the lower Cretaceous section of the productive strata, one gas–oil horizon (M-I) and two oil horizons (M-II, M-III) have been identified. The depth of the horizons varies from 190 to 810 m. The height of the oil section of the lower Cretaceous layers is 35–57 m, while the gas section ranges from 1.4 to 16 m. The boundary of the gas–oil contact (GOC) is found at depths of 181–544 m. The reservoirs are stratified, anticline, and tectonically sealed. The productive horizons are composed of terrigenous rocks, and the reservoirs are pore-type. The thickness of the oil-saturated section varies from 1.4 to 19.4 m, while the gas-saturated section ranges from 1 to 14.6 m. The open porosity of the reservoirs is 29–40%, with permeability values ranging from 0.026 to 0.75 µm2. The oil saturation coefficients range from 0.56 to 0.77, and the gas saturation coefficients range from 0.48 to 0.64.
The reservoir pressure ranges from 2.4 to 4.5 MPa, with temperatures between 23 and 27 °C.
The geological and physical characteristics of the Cretaceous horizons of the East Moldabek field are presented in Table 2. This table provides detailed data on the geological and physical properties of the M-I and M-II horizons of the East Moldabek field, including depth, reservoir characteristics, oil properties, and water conditions. It is essential for understanding the specific conditions for enhanced oil recovery methods applied to this field.

Table 2.
Geological and physical characteristics of the Cretaceous horizons of the East Moldabek field [,].
The results of development for the M-I and M-II Cretaceous horizons of the East Moldabek field using traditional waterflooding methods indicate low efficiency.
In this study, filtration tests were conducted on Cretaceous horizons with an oil viscosity of 358.0 mPa·s.
3.1. Core Material Samples
For the filtration tests, six core samples were taken from well no. 2657. After determining the basic parameters of volume and weight, a standard analysis was conducted (Table 3). This table provides the key parameters for each core sample, including the sample depth, dimensions, pore volume, porosity, and gas permeability. These values are critical for analyzing the reservoir’s properties and assessing its potential for enhanced oil recovery.

Table 3.
Standard Analysis Results of Core Samples.
To simulate reservoir conditions for the filtration experiments, a reservoir pressure of 4 MPa and a reservoir temperature of 25 °C were applied.
3.2. Reservoir Fluids and Displacing Gas Agents
The results of viscosity measurements for reservoir fluids and displacing agents are presented in Table 4.

Table 4.
Viscosity Measurement Results.
The oil from the Cretaceous horizons (M-I, M-II, M-III) of the East Moldabek field is characterized by the following properties:
- High viscosity: The oil exhibits high viscosity, complicating its extraction and transportation.
- Density of degassed oil: Approximately 916 kg/m3, classifying it as heavy oil.
- Low gas content: The gas solubility coefficient ranges from 4.08 to 5.38 m3/m3/MPa, indicating a low dissolved gas content.
- Low reservoir pressure and temperature: The initial reservoir pressure is approximately 2 MPa, and the temperature is around 23 °C, indicating a low-energy reservoir state.
- Asphaltene content: The oil contains a significant amount of asphaltenes, which may precipitate with changes in pressure and temperature.
Figure 6 and Figure 7 show the dependence of oil viscosity on temperature and the dependence of reservoir oil viscosity on gas content.
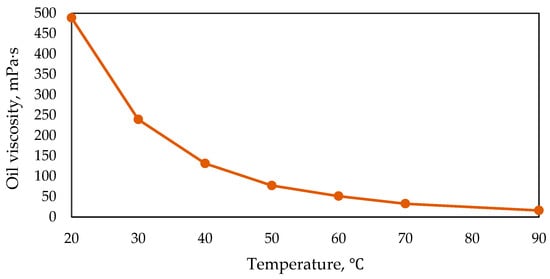
Figure 6.
Dependence of oil viscosity on temperature of Cretaceous reservoir of the East Moldabek field.
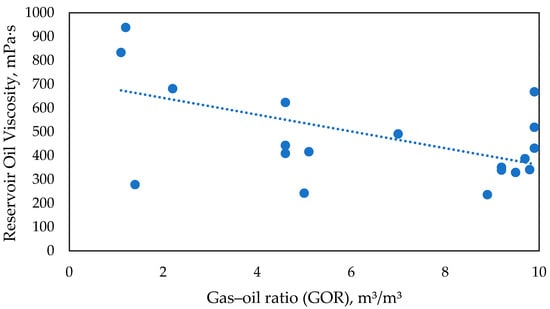
Figure 7.
Dependence of reservoir oil viscosity on gas–oil ratio of Cretaceous reservoir of the East Moldabek field [].
The physical properties of formation water at a temperature of 25 °C are presented in Table 5.

Table 5.
Parameters of formation water.
To simulate reservoir conditions for injection, a formation water model was used, taking into account the properties of formation water (Table 6).

Table 6.
Amount of salts for preparation of the formation water model.
4. Results of Filtration Experiments on Displacement of High-Viscosity Oil by Gas EOR and Discussions
In this study, the effectiveness of gas-based enhanced oil recovery (EOR) methods was evaluated by injecting the following gas agents, focusing on their impact on the increase in oil displacement factor and the reduction in interfacial tension between oil and the displacing agent:
- Nitrogen (N2) injection.
- Carbon dioxide (CO2) injection.
- Hydrocarbon gas injection (methane, propane).
Table 7 presents the results of filtration experiments on oil displacement using these gas agents. Each gas-based EOR method was tested on at least two core samples, whose characteristics are listed in Table 3.

Table 7.
Results of filtration experiments for determining the oil displacement factor during gas injection (N2, CO2, hydrocarbon gases).
- The experimental conditions were as follows:
- Reservoir pressure: 4 MPa.
- Reservoir temperature: 25 °C.
- Dynamic viscosity of oil: 358 mPa∙s.
- Dynamic viscosity of formation water: 1.4 mPa∙s.
The relationship between oil displacement factor and injected water-to-pore volume ratio is illustrated in Figure 8, Figure 9 and Figure 10.
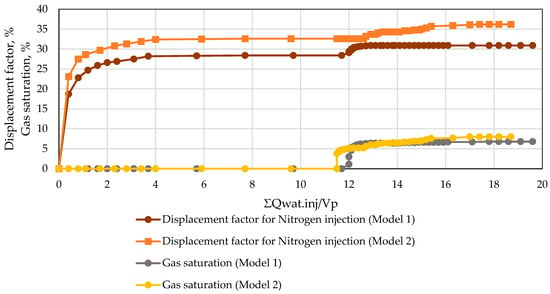
Figure 8.
Results of the displacement factor for nitrogen injection.
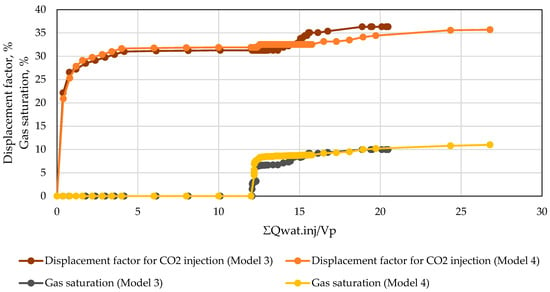
Figure 9.
Results of displacement factor for CO2 injection.
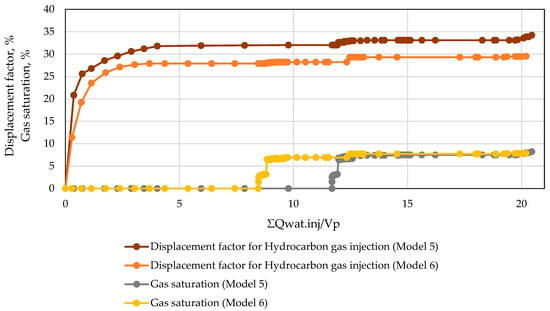
Figure 10.
Results of displacement factor for hydrocarbon gas injection.
4.1. Effectiveness of Nitrogen (N2) Injection
The key displacement mechanism of nitrogen (N2) injection is the creation of a displacement front through the injection of an inert gas that pushes oil toward the production wells. Since nitrogen is practically insoluble in crude oil and does not chemically interact with reservoir fluids, the displacement process occurs in an immiscible mode, in contrast to CO2 or hydrocarbon gas injection methods. In this case, the recovery effect is achieved by pressure-driven displacement and the formation of a gas buffer, which promotes the mobilization of residual oil [,].
An additional mechanism may involve the liberation of dissolved gas from the oil phase, resulting in the swelling and expansion of crude oil volume. This, in turn, improves its mobility and facilitates the drainage of previously unswept or poorly drained reservoir zones. Moreover, nitrogen can enhance the sweep efficiency of the reservoir by redirecting fluid flow paths and reducing water cut.
Nitrogen injection is particularly applicable under the following conditions:
- Limited availability of CO2 or when its injection is economically unfeasible.
- The need to avoid chemical interactions between the injected gas and the reservoir rock or fluids.
- The requirement to stabilize or restore reservoir pressure without the risk of emulsion formation or production-related complications.
Figure 8 illustrates the relationship between the oil displacement factor and the cumulative injected pore volumes during nitrogen (N2) injection for two core models (Model 1 and Model 2) obtained from the Cretaceous reservoir of the East Moldabek field. The horizontal axis represents the cumulative injected water volume normalized to pore volume (∑Qwat.inj/Vp), while the vertical axis shows both the oil displacement factor (%) and gas saturation (%).
The experimental results indicate that Model 2 exhibited a higher final displacement factor of 36.2%, compared to 30.9% in Model 1, with a more pronounced and stable increase at lower injection volumes. In both cases, the displacement factor plateaued after ∑Qwat.inj/Vp ≈ 4, indicating the formation of a stable displacement front.
Gas saturation data reveal an increase starting after ∑Qwat.inj/Vp ≈ 12, reaching up to 9% in Model 2 and 7% in Model 1. This corresponds to the onset of nitrogen breakthrough and suggests better gas propagation and sweep efficiency in Model 2, likely due to more favorable permeability and porosity characteristics.
The displacement mechanism of nitrogen injection in this immiscible mode is primarily driven by pressure gradients and the creation of a gas buffer that mobilizes residual oil. Despite the limited solubility of nitrogen in crude oil, the experiments demonstrated an average incremental displacement of ~3%, confirming the viability of N2 injection for pressure maintenance and partial oil mobilization under low-pressure, high-viscosity conditions.
These results support the feasibility of nitrogen-based EOR in mature heavy oil fields with limited CO2 availability and contribute to a broader understanding of gas-based displacement mechanisms in low-energy reservoirs.
Displacement experiments using nitrogen (N2) on core samples from the East Moldabek field demonstrated an average incremental displacement factor of approximately 3%.
The experiments revealed that nitrogen can enhance oil displacement by mobilizing residual oil.
4.2. Effectiveness of Carbon Dioxide (CO2) Injection
The primary mechanism of Carbon Dioxide (CO2) injection is the dissolution of CO2 in crude oil, which leads to a reduction in oil viscosity and interfacial tension, thereby facilitating its flow through the pore space. Under specific pressure–temperature conditions, CO2 becomes miscible with oil, forming a single-phase mixture that significantly enhances the displacement of residual oil. Achieving full miscibility requires the minimum miscibility pressure (MMP) to be exceeded, which depends on the oil composition, reservoir temperature, and rock properties.
An additional recovery effect is observed due to oil swelling caused by dissolved CO2, which increases oil volume and reduces its density, further promoting displacement. Moreover, injected CO2 can act as a displacing agent in immiscible mode, pushing oil toward the production wells even when miscibility is not achieved. In carbonate reservoirs, CO2 may also participate in chemical interactions with rock minerals (e.g., calcite), potentially enhancing permeability and creating additional flow pathways.
The CO2 method has seen widespread application, particularly in the United States (notably in the Permian Basin), as well as in Canada, China, and the Middle East [,,]. It is also an integral part of carbon capture, utilization, and storage (CCUS) strategies, offering the dual benefit of improved oil recovery and reduced greenhouse gas emissions.
Figure 9 presents the dynamics of oil displacement during Carbon Dioxide (CO2) injection for two core models (Model 3 and Model 4) from the East Moldabek heavy oil reservoir. The horizontal axis shows the cumulative injected water volume normalized to pore volume (∑Qwat.inj/Vp), while the vertical axis shows the oil displacement factor (%) and gas saturation (%).
The results indicate a maximum displacement factor of 36.3% for Model 3 and 35.7% for Model 4, representing the highest efficiency among all tested gas agents. The increase in displacement efficiency occurs sharply in the early stages of injection (∑Qwat.inj/Vp < 4), followed by a gradual stabilization.
CO2 saturation begins to increase after ∑Qwat.inj/Vp ≈ 12 and reaches approximately 10%, indicating significant gas propagation within the core and successful formation of miscible or near-miscible flow conditions. The displacement mechanism is primarily governed by the dissolution of CO2 in crude oil, which reduces viscosity and interfacial tension, facilitating enhanced flow through the pore network.
Additionally, swelling of the oil phase due to CO2 solubility improves its mobility and contributes to the displacement of oil from previously unswept zones. The experimental data confirm the thermodynamic compatibility of CO2 with East Moldabek oils and suggest its high potential for application in low-pressure, high-viscosity terrigenous formations.
CO2 injection resulted in an increase in the displacement factor of up to 5.06% compared to water flooding. This improvement is attributed to the dissolution of CO2 in oil, which reduces its viscosity and enhances its mobility.
4.3. Effectiveness of Hydrocarbon Gas Injection (Methane and Propane)
The primary mechanism of hydrocarbon gas injection (Methane and Propane) involves the interaction between the hydrocarbon gas and the oil phase, resulting in partial or full miscibility. This leads to a reduction in oil viscosity, decreased interfacial tension, and, under certain reservoir conditions, the formation of a single oil–gas phase, which effectively displaces residual oil from the pore space.
An additional recovery effect is observed due to oil swelling caused by the dissolution of light gas components and the release of dissolved gas from the oil phase, which contributes to oil expansion. Furthermore, hydrocarbon gas injection can enhance the mobility of trapped oil in low-permeability zones and improve sweep efficiency through a more uniform displacement front distribution [,,].
Hydrocarbon gas injection is particularly effective when:
- Associated gas or light hydrocarbon fractions are available at the field site.
- Reservoir pressure is sufficient to achieve miscibility.
- The field is at a mature development stage, where enhanced recovery of residual oil is targeted.
Figure 10 illustrates the results of oil displacement experiments using hydrocarbon gases—methane and propane—performed on Model 5 and Model 6 core samples. The plot shows the variation in displacement factor (%) and gas saturation (%) as a function of the cumulative injected volume normalized to pore volume.
Core displacement experiments conducted on samples from the East Moldabek field showed that methane injection resulted in an incremental oil recovery of 1.2–2.3%, while propane injection achieved 2.5–3.6%. Propane demonstrated higher efficiency due to its better solubility in crude oil.
These findings confirm that CO2 and propane reduce interfacial tension more effectively than methane.
However, the overall displacement efficiency of hydrocarbon gas injection remains lower than CO2 injection. Despite this, the use of associated light hydrocarbon gases such as propane can be advantageous in fields where such gases are readily available, offering a technically viable and economically attractive alternative under certain field-specific conditions.
Filtration experiments on oil displacement using gas agents demonstrate that the highest increase in displacement factor was achieved with carbon dioxide (CO2) injection, reaching 5.06%. The least effective scenario was observed with hydrocarbon gas injection, resulting in only a 1.6% increase. Overall, this series of experiments suggests that gas-based enhanced oil recovery (EOR) methods are promising for application in high-viscosity oil fields, as they yield a positive increase in the displacement factor.
Although the current study primarily focuses on the type of injected gas (CO2, CH4, C3H8, and N2), the gas injection rate is another critical parameter that can significantly influence displacement performance, particularly in high-viscosity reservoirs. The rate of injection affects the stability of the displacement front, sweep efficiency, and the timing of gas breakthrough.
According to RSC Advances experiments [] using gas-assisted gravity drainage, the highest oil recovery (~63.3%) occurred at an injection rate of 0.15 m/day, while both lower (0.05 m/day) and higher rates (0.3–0.5 m/day) reduced overall recovery due to under-displacement or early gas breakthrough, respectively.
Similarly, Siregar et al. (2007) [] investigated laboratory nitrogen injection at pressures of 1500 psi and injection rates of 20, 30, and 36.66 cc/h. The study established that 30 cc/h delivered optimal displacement efficiency, while 36.66 cc/h led to lower recovery efficiency due to early gas breakthrough and destabilization of the gas front.
Additional findings from experiments [] on hydrocarbon gas flooding in low-permeability formations show that an injection rate of 0.2 mL/min provided significantly higher oil recovery (~61%) compared to both lower and higher rates—confirming the presence of a rate-dependent optimum for EOR performance.
In the context of gas EOR, optimizing the injection rate is essential for balancing between mobility control and reservoir pressure maintenance. A moderate injection rate ensures a more uniform displacement front and minimizes gas override or channeling effects. Although experimental validation of variable injection rates was beyond the scope of the current work, future tests are planned to examine their effect on oil recovery efficiency and pressure profiles.
This study highlights the potential of gas-based EOR techniques for enhancing oil recovery from Cretaceous reservoirs in the high-viscosity oil field of East Moldabek. It also demonstrates the value of integrating laboratory methods for investigating fluid and rock properties. The results can serve as a foundation for further research in this field or related areas.
A comprehensive approach to studying gas-based oil displacement is essential. Continued laboratory and field trials will allow for more precise determination of CO2 and hydrocarbon gas application parameters, ultimately leading to a significant improvement in the efficiency of high-viscosity oil field development in terrigenous formations.
5. Conclusions
In the framework of experimental studies, filtration displacement experiments of high-viscosity oil were conducted to determine the displacement factor when injecting a gaseous agent: nitrogen, CO2, and hydrocarbon gas into core samples from the East Moldabek field. The results were compared with conventional water flooding—oil displacement by formation water.
The displacement experiments using nitrogen (N2), carbon dioxide (CO2), and hydrocarbon gases revealed distinct trends in oil recovery performance, attributable to differences in physicochemical properties and interaction mechanisms with reservoir fluids and rock.
CO2 injection achieved the highest displacement efficiency due to its favorable interactions with crude oil, including oil swelling and viscosity reduction [,].
N2, being chemically inert and non-miscible, provided pressure maintenance but with limited oil mobilization capabilities [].
Hydrocarbon gases offered a balance between performance and miscibility but showed earlier breakthrough compared to CO2 [].
These results confirm that gas selection for EOR should consider reservoir conditions, gas miscibility behavior, and operational constraints. Future optimization may involve gas blending, cyclic injection schemes, or co-injection with water to maximize displacement efficiency.
The filtration experiments demonstrated a characteristic trend in oil displacement behavior across all tested gases. As the cumulative injected volume, normalized to pore volume (Q/Vp), increased, the oil displacement factor initially showed a rapid growth phase, followed by a plateau, and finally a slight increase under forced injection conditions.
This behavior can be explained by the dynamics of front propagation and saturation redistribution within the core. Initially, the injected gas establishes a displacement front, mobilizing a significant portion of the movable oil. Once the front reaches a stable configuration (typically around Q/Vp ≈ 3–4), further injection does not significantly enhance oil recovery due to bypassing or already drained pore spaces. However, when the injection continues at elevated volumes (e.g., Q/Vp > 6–8), preferential flow paths may expand or new pore channels become accessible due to increasing pressure gradients, resulting in a small additional increase in the displacement factor. This phase corresponds to forced displacement, where incremental recovery is achieved at the expense of increased gas injection and energy input.
Such a trend has also been observed in other core flooding studies involving gas injection into low-permeability or high-viscosity oil formations [,].
Gas-based enhanced oil recovery (EOR) methods demonstrated lower incremental displacement factor compared to water flooding. Experimental studies on packed Cretaceous core samples from the East Moldabek field showed that the use of nitrogen as a displacement agent resulted in a slight increase in the displacement factor of approximately 3%. CO2 injection demonstrated an increase in the displacement factor of up to 5.06% compared to water flooding. This is attributed to the dissolution of CO2 in oil, which reduces oil viscosity and improves its mobility. Further studies are required to assess the feasibility of the method. Nevertheless, this experimental research highlights the effectiveness of nitrogen and CO2 injection for enhancing oil recovery in Cretaceous reservoirs and demonstrates the value of integrating laboratory methods for evaluating EOR efficiency. These findings can serve as a basis for further research in the field of filtration experiments.
Author Contributions
Conceptualization, K.S. and U.Z.; methodology, U.Z., K.S., and G.R.; investigation, K.S. and U.Z.; data curation, K.S.; writing—original draft preparation, K.S. and G.R.; writing—review and editing, K.S. and G.R.; visualization, K.S. and G.R.; supervision, G.R.; project administration, G.R.; funding acquisition, G.R. All authors have read and agreed to the published version of the manuscript.
Funding
This research was funded by the Committee of Science of the Ministry of Science and Higher Education of the Republic of Kazakhstan (grant No. AR19677859).
Data Availability Statement
The original contributions presented in this study are included in the article; further inquiries can be directed to the corresponding authors.
Acknowledgments
The authors would also like to express their gratitude to JSC “Embamunaigas” in providing data on the East Moldabek field section, as well as Atyrau branch of KMG Engineering LLP for cooperation in conducting filtration experiments.
Conflicts of Interest
The authors declare no conflicts of interest.
Abbreviations
The following abbreviations are used in this manuscript:
| EOR | Enhanced Oil Recovery |
| WAG | Water-Alternating-Gas |
| GOC | Gas–Oil Contact |
| GOR | Gas–Oil Ratio |
References
- Energy Institute. Statistical Review of World Energy 2024; Energy Institute: London, UK, 2024. [Google Scholar]
- Bulekbayev, Z.E.; Vocalevskyi, E.S.; Eskuzhiev, B.A.; Kamalov, S.M.; Korostyshevskyi, M.N.; Kuandykov, B.M.; Kuantaev, N.E.; Marchenko, O.N.; Matloshinsky, N.G.; Nazhmetdinov, A.S.; et al. Oil & Gas Fields of Kazakhstan; Reference Book: Almaty, Kazakhstan, 1996. (In Russian) [Google Scholar]
- Nukenov, D.K.; Nusupbekova, D.A. Methods for enhancing oil recovery using unconventional resources of Kazakhstan. In Proceedings of the All-Russian Conference with International Participation “Unconventional Hydrocarbon Resources: Distribution, Genesis, Forecasts, Development Prospects”; GEOS: Moscow, Russia, 2013. (In Russian) [Google Scholar]
- Bissembayeva, K.T.; Mamalov, E.N.; Hadiyeva, A.S.; Sabyrbayeva, G.S.; Karazhanova, M.K.; Bekbauliyeva, A.A.; Koishina, A.I. An enhanced oil recovery technology applicable to Kazakhstan reserves with highly viscous oils. SOCAR Proc. 2024, 1, 107–111. [Google Scholar] [CrossRef]
- Mukhtanov, B.M. Application of thermal methods in the Republic of Kazakhstan. Current projects and prospects. SOCAR Proc. 2021, 1, 114–123. (In Russian) [Google Scholar] [CrossRef]
- McGlade, C.; Sondak, G.; Han, M. Whatever happened to enhanced oil recovery? In World Energy Outlook 2018; IEA: Paris, France, 2018; Available online: https://www.iea.org (accessed on 26 June 2025).
- Statistical Review of World Energy 2023, 72nd ed.; BP: London, UK, 2023.
- Suleymanov, B.A. Theory and Practice of Enhanced Oil Recovery of Reservoirs; Series: Modern Oil and Gas Technologies; Institute for Computer Research: Izhevsk, Russia, 2022. (In Russian) [Google Scholar]
- Vishnyakov, V.; Suleimanov, B.; Salmanov, A.; Zeynalov, E. Primer on Enhanced Oil Recovery, 1st ed.; Gulf Professional Publishing: Houston, TX, USA, 2019. [Google Scholar] [CrossRef]
- Soltanbekova, K.A.; Ramazanova, G.I.; Eremin, N.A.; Zhapbasbayev, U.K.; Zhappasbayev, B.Z. Prospects and Current State of Chemical EOR Methods Applied in Kazakhstan. SOCAR Proc. 2024, 2, 71–77. [Google Scholar] [CrossRef]
- Liu, Z.; Yan, L.; Wang, Q.; Guo, Y.; Gao, M.; Wang, Z.; Liu, W. Status and progress of worldwide EOR field applications. J. Pet. Sci. Eng. 2020, 193, 107449. [Google Scholar] [CrossRef]
- Lake, L.W. Enhanced Oil Recovery; Prentice Hall: Englewood Cliffs, NJ, USA, 1989. [Google Scholar]
- Song, Z.; Song, Y.; Li, Y.; Bai, B.; Song, K.; Hou, J. A critical review of CO2 enhanced oil recovery in tight oil reservoirs of North America and China. Fuel 2020, 276, 118006. [Google Scholar] [CrossRef]
- Sheng, J.J. (Ed.) Enhanced Oil Recovery Field Case Studies; Gulf Professional Publishing: Houston, TX, USA, 2013. [Google Scholar]
- Aladasani, A.; Bai, K. Gas injection EOR: A review of current status and opportunities. Energy Rep. 2019, 5, 855–875. [Google Scholar]
- Bachu, S.; Bonijoly, D.; Bradshaw, J. Screening criteria for CO2 storage in oil reservoirs. Energy Procedia 2007, 1, 465–472. [Google Scholar]
- Zholdybaeva, A.T.; Pokhilyuk, M.V.; Kunzharikova, K.M. Study of the effectiveness of tertiary enhanced oil recovery methods in carbonate reservoirs. Kaz. J. Oil Gas Ind. 2024, 2, 61–76. (In Russian) [Google Scholar] [CrossRef]
- Musharova, A.A.; Sarsenbekova, A.K.; Musina, D.K. Determination of unified applicability criteria for enhanced oil recovery technologies and development of a screening tool for these technologies. Kaz. J. Oil Gas Ind. 2024, 2, 54–68. (In Russian) [Google Scholar] [CrossRef]
- Al-Obaidi, S.H.; Hofmann, M.; Khalaf, F.H.; Alwan, H.H. The efficiency of gas injection into low-permeability multilayer hydrocarbon reservoirs. Tech. Rom. J. Appl. Sci. Technol. 2021, 3, 100–108. [Google Scholar] [CrossRef]
- Ibrahimov, K.M. A new method for enhancing oil recovery in low-temperature reservoirs. SOCAR Proc. 2023, 1, 74–79. (In Russian) [Google Scholar] [CrossRef]
- Ozowe, W.; Daramola, G.O.; Ekemezie, I.O. Innovative approaches in enhanced oil recovery: A focus on gas injection synergies with other EOR methods. Magna Sci. Adv. Res. Rev. 2024, 11, 311–324. [Google Scholar] [CrossRef]
- Sardanashvili, O.N.; Bogatkina, Y.G. Techno-economic efficiency of applying enhanced oil recovery methods. Neftegaz.RU 2024, 10. Available online: https://magazine.neftegaz.ru/articles/ekonomika/859853-tekhniko-ekonomicheskaya-effektivnost-primeneniya-metodov-uvelicheniya-nefteotdachi/ (accessed on 30 June 2025). (In Russian).
- Bealessio, B.A.; Alonso, N.A.B.; Mendes, N.J.; Sande, A.V.; Hasçakir, B. A review of enhanced oil recovery (EOR) methods applied in Kazakhstan. Petroleum 2021, 7, 1–9. [Google Scholar] [CrossRef]
- Li, Q.; Zhang, C.; Yang, Y.; Ansari, U.; Han, Y.; Li, X.; Cheng, Y. Preliminary Experimental Investigation on Long-Term Fracture Conductivity for Evaluating the Feasibility and Efficiency of Fracturing Operation in Offshore Hydrate-Bearing Sediments. Ocean Eng. 2023, 281, 114949. [Google Scholar] [CrossRef]
- Li, Q.; Li, Q.; Liu, J.; Zhang, C.; Cheng, Y. Settling Behavior and Mechanism Analysis of Kaolinite as a Fracture Proppant of Hydrocarbon Reservoirs in CO2 Fracturing Fluid. Colloids Surf. A Physicochem. Eng. Asp. 2025, 724, 137463. [Google Scholar] [CrossRef]
- Hao, H.; Hou, J.; Zhao, F.; Huang, H.; Wang, Z.; Liu, H. Feasibility study of gas-EOR using CO2 and N2 mixture in a heavy oil reservoir: Experiments and pilot test. In Proceedings of the Carbon Management Technology Conference, Houston, TX, USA, 15–18 July 2019. [Google Scholar] [CrossRef]
- Ermakov, P.P.; Eremin, N.A. Nitrogen injection into porous media to enhance oil recovery. Geol. Geophys. Oilfield Dev. 1996, 11, 45–50. (In Russian) [Google Scholar]
- Zhang, F.; Adel, I.A.; Saputra, I.W.; Chen, W.; Schechter, D.S. Numerical investigation to understand the mechanisms of CO2 EOR in unconventional liquid reservoirs. In Proceedings of the SPE Annual Technical Conference and Exhibition, Calgary, AB, Canada, 30 September–2 October 2019. [Google Scholar] [CrossRef]
- Reid, R.C.; Prausnitz, J.M.; Sherwood, T.K. The Properties of Gases and Liquids, 5th ed.; McGraw-Hill: New York, NJ, USA, 2001; 768p. [Google Scholar]
- Ely, J.F.; Hanley, H.J.M. Prediction of Transport Properties. 1. Viscosity of Fluids and Mixtures. Ind. Eng. Chem. Fundam. 1981, 20, 323–332. [Google Scholar] [CrossRef]
- Chung, T.H.; Lee, L.L.; Starling, K.E. Applications of Kinetic Gas Theories and Multiparameter Correlations for Prediction of Dilute Gas Viscosity and Thermal Conductivity. Ind. Eng. Chem. Fundam. 1984, 23, 8–13. [Google Scholar] [CrossRef]
- Hasanov, B.K.; Guzhikov, P.A.; Kunzharikova, K.M.; Dukesov, N.K.; Kokymbaeva, G.Z. High-viscosity oil properties of the East Moldabek field. Kaz. J. Oil Gas Ind. 2021, 1, 56–66. (In Russian) [Google Scholar] [CrossRef]
- Zholdybayeva, A.; Syzdykov, A.; Pourafshary, P.; Ismailova, J.; Delikesheva, D. Importance of Clay Swelling on the Efficacy of Cyclic Steam Stimulation in the East Moldabek Formation in Kazakhstan. Energies 2024, 17, 5078. [Google Scholar] [CrossRef]
- Zholdybayeva, A.T.; Shishkin, V.V.; Khazhitov, V.Z.; Niyazbayeva, A.B.; Sidorov, D.A.; Kurmankulov, A.T. Estimation of the efficiency of the cyclic steam simulation with high viscosity oil wells based on the hydrodynamic model of the East Moldabek deposit, Kenbai field. Kaz. J. Oil Gas Ind. 2021, 4, 65–78. (In Russian) [Google Scholar] [CrossRef]
- Lake, L.W.; Johns, R.; Rossen, B.; Pope, G. Fundamentals of Enhanced Oil Recovery; Society of Petroleum Engineers: Richardson, TX, USA, 2014. [Google Scholar] [CrossRef]
- Kong, D.; Lian, P.; Zheng, R.; Li, Y. Performance demonstration of gas-assisted gravity drainage in a heterogeneous reservoir using a 3D scaled model. RSC Adv. 2021, 11, 30610–30622. [Google Scholar] [CrossRef]
- Siregar, S.; Hidayaturobbi, A.D.; Wijaya, B.A.; Listiani, S.N.; Adiningrum, T.; Irwan, I.; Pratomo, A.I. Laboratory Experiments on Enhanced Oil Recovery with Nitrogen Injection. ITB J. Eng. Sci. 2007, 39, 20–27. [Google Scholar] [CrossRef]
- Xian, B.; Hao, H.; Deng, S.; Sun, T.; Wu, H.; Cheng, L.; Tang, Z.; Gao, X.; Wang, Y.; Cai, S.; et al. Laboratory Experiments of Hydrocarbon Gas Flooding and Its Influencing Factors on Oil Recovery in a Low Permeability Reservoir with Medium Viscous Oil. ACS Omega 2024, 9, 8381–8396. [Google Scholar] [CrossRef] [PubMed]
Disclaimer/Publisher’s Note: The statements, opinions and data contained in all publications are solely those of the individual author(s) and contributor(s) and not of MDPI and/or the editor(s). MDPI and/or the editor(s) disclaim responsibility for any injury to people or property resulting from any ideas, methods, instructions or products referred to in the content. |
© 2025 by the authors. Licensee MDPI, Basel, Switzerland. This article is an open access article distributed under the terms and conditions of the Creative Commons Attribution (CC BY) license (https://creativecommons.org/licenses/by/4.0/).