Article

Multi-Criteria Optimization and Techno-Economic Assessment of a Wind–Solar–Hydrogen Hybrid System for a Plateau Tourist City Using HOMER and Shannon Entropy-EDAS Models

1
State Key Laboratory of Complex Nonferrous Metal Resources Clean Utilization, Faculty of Metallurgical and Energy Engineering, Kunming University of Science and Technology, Kunming 650093, China
2
China Three Gorges Corporation Yunnan Energy Investment Co., Ltd., Kunming 650051, China
*
Authors to whom correspondence should be addressed.
Energies 2025, 18(15), 4183; https://doi.org/10.3390/en18154183
Submission received: 20 May 2025 / Revised: 16 July 2025 / Accepted: 1 August 2025 / Published: 7 August 2025
(This article belongs to the Section B: Energy and Environment)

Abstract

Hydrogen offers an effective pathway for the large-scale storage of renewable energy. For a tourist city located in a plateau region rich in renewable energy, hydrogen shows great potential for reducing carbon emissions and utilizing uncertain renewable energy. Herein, the wind–solar–hydrogen stand-alone and grid-connected systems in the plateau tourist city of Lijiang City in Yunnan Province are modeled and techno-economically evaluated by using the HOMER Pro software (version 3.14.2) with the multi-criteria decision analysis models. The system is composed of 5588 kW solar photovoltaic panels, an 800 kW wind turbine, a 1600 kW electrolyzer, a 421 kWh battery, and a 50 kW fuel cell. In addition to meeting the power requirements for system operation, the system has the capacity to provide daily electricity for 200 households in a neighborhood and supply 240 kg of hydrogen per day to local hydrogen-fueled buses. The stand-alone system can produce 10.15 × 10⁶ kWh of electricity and 93.44 t of hydrogen per year, with an NPC of USD 8.15 million, an LCOE of USD 0.43/kWh, and an LCOH of USD 5.26/kg. The grid-connected system can generate 10.10 × 10⁶ kWh of electricity and 103.01 ton of hydrogen annually. Its NPC is USD 7.34 million, its LCOE is USD 0.11/kWh, and its LCOH is USD 3.42/kg. This study provides a new solution for optimizing the configuration of hybrid renewable energy systems, which will develop the hydrogen economy and create low-carbon-emission energy systems.

1. Introduction

To overcome the problems of stochasticity and volatility of renewable energy in power generation, researchers have been working on developing HRESs [1,2]. This system achieves the complementary advantages and disadvantages of energy sources by integrating multiple renewable energy sources [3]. Today, researchers have conducted numerous studies on the feasibility of HRESs in both off-grid and grid-connected setups, of which the main energy sources used for research are solar, wind, hydro, and biomass [4,5,6,7,8,9,10,11,12]. In addition to this, hydrogen has been known as one of the most desirable fuels to replace fossil energy sources with great potential [13]. In recent years, hydrogen energy has been gradually combined with renewable energy sources to enrich renewable energy development [14,15,16,17,18,19,20,21,22,23]. From the production of hydrogen by renewable energy sources to the storage and transportation of hydrogen, and then to the downstream application, there are numerous studies on the development of each link in the hydrogen ‘production, storage, transportation, and use’ industry chain [24,25,26,27,28].
The actual operation of hybrid renewable energy systems involves complex synergies and the optimization of multiple factors. The output power of wind turbines, solar photovoltaic panels, and other power generation equipment is susceptible to local wind speed, light intensity, temperature, and other natural meteorological conditions. When faced with high-load-demand scenarios, the deployment of large-scale power generation equipment may lead to the incomplete consumption of microgrids, resulting in problems such as wind and light abandonment. In addition, due to the relatively high price of energy storage technology and related equipment in the current development stage, suboptimal energy storage configurations may lead to both the poor performance of renewable energy consumption capacity and economic decline. Therefore, it is particularly important to optimize hybrid renewable energy system capacity allocation. By optimizing the system capacity, the fluctuation in renewable energy power generation can be effectively suppressed, the security and stability of microgrid operation can be improved, and the economic and environmental benefits of the microgrid system can be significantly enhanced.
A wide range of techniques and tools have been developed to continuously advance and improve the process of optimizing the capacity allocation of hybrid renewable energy systems [29,30,31,32,33,34]. Among the many tools, the most popular academic applications are HOMER and RETscreen [3,34]; widely used optimization techniques include artificial neural network models, adaptive neuro-fuzzy inference systems, fuzzy logic-based approaches, and meta-heuristic algorithms [35]. M. Thirunavukkarasu et al. [3] conducted a comprehensive review of various optimization methodologies applicable to HRES optimization. Their review covered classical optimization methods, artificial intelligence-based techniques, hybrid optimization algorithms, and software-oriented optimization tools used across different HRES applications. Bachir Tiar et al. [36] used multi-criteria decision making, the geographic information system, and HOMER software to determine the best choice among five suitable regions for hydrogen production in Algeria and determined the levelized costs of hydrogen in the region to be USD 1.96–4.85/kg. Youssef Elomari et al. [37] put forward a data-driven framework to optimize the design of renewable energy communities, combining HOMER Pro and Python tools to develop a new data-driven model to evaluate the energy, economic, and environmental criteria; to identify the best size of the system; and to achieve a low-cost, high-efficiency, and low-environmental-impact solution through a multi-objective optimization and weighted sum decision-making method, as well as low-environmental-impact programs.
When optimizing the capacity allocation of a hybrid renewable energy system, multiple objectives such as economy, reliability, and environmental friendliness need to be considered simultaneously, and there is often a conflicting or mutually exclusive relationship between these objectives. The optimization of a single metric may neglect other important factors and fail to fully reflect the overall performance and operational requirements of the system. By adopting multi-criteria decision-making methods, key indicators can be incorporated into a unified framework, weighed, and comprehensively evaluated according to their relative importance, to strike a balance between different objectives. The widely used multi-criteria decision-making methods include AHP, TOPSIS, PROMETHEE, GRA, and Shannon Entropy. Among the above methods, the Shannon Entropy-EDAS method uses entropy weighting to achieve a completely objective determination of criterion weights, effectively eliminating the bias and controversy caused by subjective assignments, and making full use of the information embedded in the data itself to identify the key differentiation criteria. Combined with the robust and intuitive ranking mechanism of the EDAS method, this method has significant advantages over other mainstream decision-making methods in scenarios where objectivity and data-drivenness are emphasized, and where subjective weighting disputes need to be avoided. In addition, the calculation process is relatively simple and easy to implement by programming, so it has strong applicability and practical value in comprehensive multi-dimensional considerations such as economy, reliability, and environmental impact.
Currently, most studies related to grid-connected/stand-alone HRESs coupled with energy storage systems focus on fixed system configurations, a single consideration of grid-connected/off-grid modes, and evaluation criteria [38,39]. Manaf Zghaibeh et al. [38] performed a component configuration optimization and techno-economic analysis of a hydropower–photovoltaic (PV) co-generation plant in southern Oman and optimized the levelized cost of green hydrogen production. Laveet Kumar et al. [39] utilized HOMER Pro software to conduct an optimal configuration analysis and economic evaluation of two proposed hybrid renewable energy systems intended for installation in Kotri, Pakistan. Their findings indicated that the hybrid system consisting of photovoltaic, biomass, fuel cell, electrolyzer, and battery components is more cost-effective and viable. In addition, the current research related to the capacity allocation optimization of renewable energy systems in China’s highland cities also suffers from the problem of the high levelized cost of electricity. Yang-Yan Lai et al. [40] found that the advantages of the system were more pronounced in Lhasa, China, by sizing and capacity-optimizing a solar PV/thermal system built in Hangzhou with integrated seasonal latent heat storage and using Lhasa, China, as a comparative study. The average annual performance factor of the system can be increased by 160% and the levelized cost of electricity can be reduced to only USD 0.1/kWh. Jingze Yang et al. [41] conducted a capacity optimization and feasibility assessment of wind–solar complementary renewable energy systems in 36 typical regions in China, where the levelized cost of electricity of the systems in Kunming, Yunnan, Lhasa, Tibet, and Qinghai were all above USD 0.1/kWh. By analyzing the above articles, we believe it is possible to continue to explore the possibility of fully utilizing renewable energy sources in terms of type and quantity, based on which we can subsequently explore the impact of flexible combinations of system components on the results of the system operation, the impact of switching between grid-connected and off-grid modes on the overall capacity and economics of the system, and the impact of multiple evaluation criteria on the ranking of the advantages and disadvantages of systems with different forms of combinations. In addition, the research content is combined with local natural and tourism resources for better practical application. By combining the HOMER Pro software with the Shannon Entropy-EDAS model, it is possible to optimize the capacity allocation of the renewable energy system in the study area in terms of technical, economic, and environmental aspects, as well as to analyze the relevant technical and economic parameters. Table 1 compares the economic parameters of the techno-economic analyses of different types of hybrid systems using HOMER Pro software.
Therefore, this study combines relevant research from both domestic and international sources with the geographic and meteorological conditions of Lijiang City in Yunnan Province, China, as the research subject of renewable energy systems, focusing on wind, solar, and hydrogen. The HOMER Pro software is combined with the Shannon Entropy-EDAS model to conduct a multi-criteria assessment and economic feasibility analysis of the proposed system. In addition, this study explores the impact of the electrolyzer and system lifetime on NPC and the impact of inflation rate and discount rate on LCOH. It aims to achieve the integrated utilization of renewable energy sources, which provide a prominent reference for the optimal allocation of renewable energy systems.

2. Geographical Location and Meteorological Data

2.1. Selection of the Study Area

The study area selected for this study is located in Lijiang City, Yunnan Province. Lijiang is a world-famous city for culture and tourism, and tourism makes a great contribution every year to the economic growth of each city; at the same time, it also drives the development of other industries together, represented by the transportation industry.

2.2. Introduction to Load Demand in the Study Area

To respond to the national dual-carbon strategy as well as to vigorously develop renewable energy, we consider replacing some of the tourist buses in the city with hydrogen buses as a pilot study. It is currently considered that this research system can provide both residential electricity and hydrogen for hydrogen fuel cell buses, whose load demand is shown in Figure 1. The impact of seasonal changes in visitor numbers on the load demand is not considered, and we assume that these changes are negligible. In this case, the pattern of hydrogen demand is concentrated from 7:00 a.m. to 7:00 p.m. daily, which coincides with the working hours of the electrolyzer. After hydrogen is stored briefly, it is uniformly charged into the hydrogen buses at 20:00 pm. Of course, the electrolyzer can also provide hydrogen for the buses at any time during operation.
The proposed electricity and hydrogen loads in this study area are estimated based on the operation of a hydrogen energy demonstration project in Lijiang City, the electricity consumption of residents in a neighboring community, and the loads of hydrogen buses that have been put into operation in Lijiang City, in order to meet the actual application requirements. Based on a survey of the daily electricity consumption of households in a neighborhood in Lijiang, the average of this consumption is 10 kWh, which is estimated to be 2000 kWh per day for a neighborhood of nearly 200 households. A total of five hydrogen buses have been put into operation in Lijiang City, each with a mileage of 420 km with a full load of hydrogen, with a hydrogen consumption rate of 6 kg per 100 km. They are suitable for high-altitude operations. Considering that the number of hydrogen buses will increase in the future, the hydrogen load of the system was determined to be 240 kg per day, which can satisfy the demand of up to nine buses from zero to full hydrogen storage tanks. However, considering that there may be buses refueling in the middle of the hydrogen production process, the system can satisfy a total of eight buses with empty to full hydrogen storage tanks. For the study of such a large-scale charging and refueling system, a lot of valuable information is provided in a previous study [42].

2.3. Introduction to Resources in the Study Area

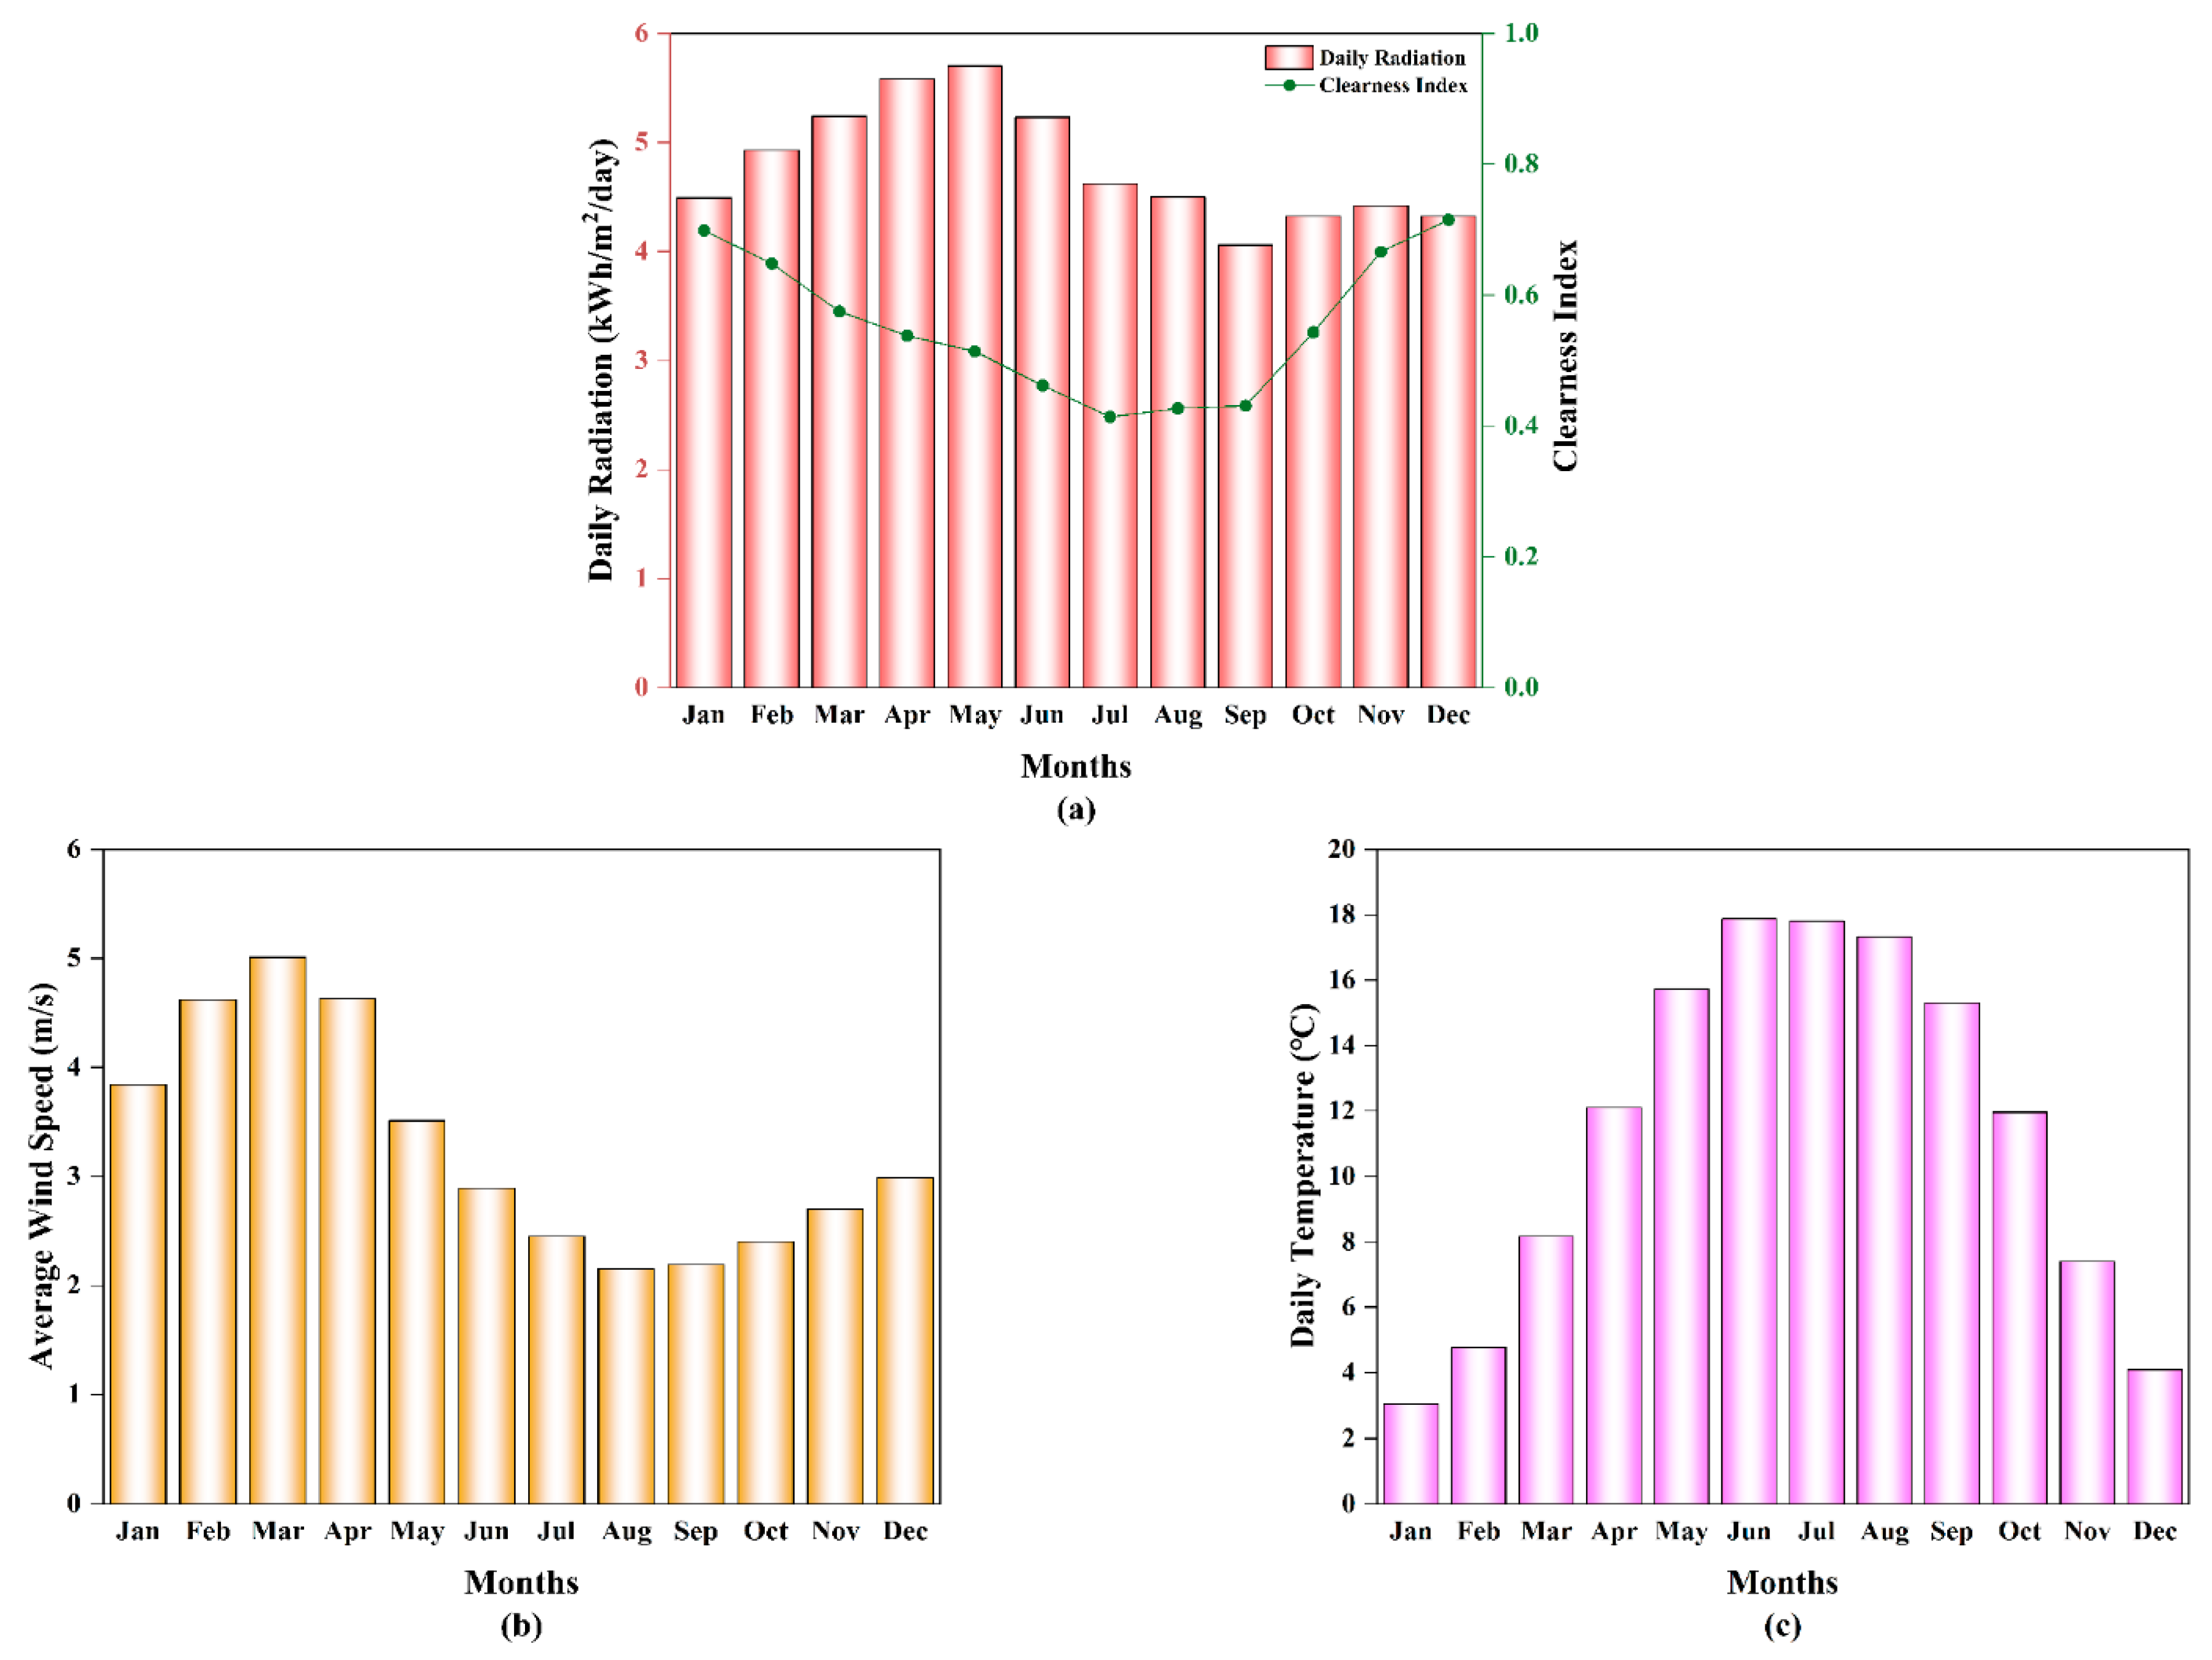
The annual average solar radiation in the study area is 4.78 kWh/m2/day, which is the monthly average of the data collected by NASA for 22 years. The peak of solar radiation in the Lijiang region occurs in May with a value of 5.70 kWh/m2/day, with a minimum in September at 4.06 kWh/m2/day. The annual mean clear sky index in the study area is 0.55 and the distribution trend is seasonally related, both of which are high in summer and low in winter. Figure 2a illustrates the monthly average solar radiation along with the corresponding clearness index. The wind speed and ambient temperature data utilized in this study were acquired from the NASA database, and the annual mean wind speed used was 3.28 m/s. The maximum value of the monthly mean wind speed occurred in May, with a value of 5.01 m/s, and the minimum of 2.15 m/s occurred in August. The values and typical months are plotted over time in Figure 2b [43]. Regarding temperature, the annual mean for the Lijiang region is around 11.30 °C, with the highest monthly average temperature in summer recorded at 17.88 °C and the lowest in winter at 3.05 °C, resulting in an annual seasonal temperature variation of roughly 20 °C. The monthly temperature distribution throughout the year is presented in Figure 2c, indicating the region’s comfortable climate for habitation.
According to the Notice on Further Improvement of Time-Sharing Electricity Pricing Policies issued by the Yunnan Provincial Development and Reform Commission [44], as well as the Yunnan Power Grid Company Limited Liability Company’s Agent Purchase of Electricity Information Disclosure Sheet [45] and other information, the electricity purchase and sale price table is summarized in Table 2. In this study’s grid-connected configuration, excess electricity produced by the renewable energy system can be exported back to the local grid, thereby offsetting system costs after fulfilling the park’s electricity demand. Conversely, when renewable generation is inadequate, electricity can be imported from the grid to ensure continuous supply to the park [46].

3. Methodology

3.1. System Modeling

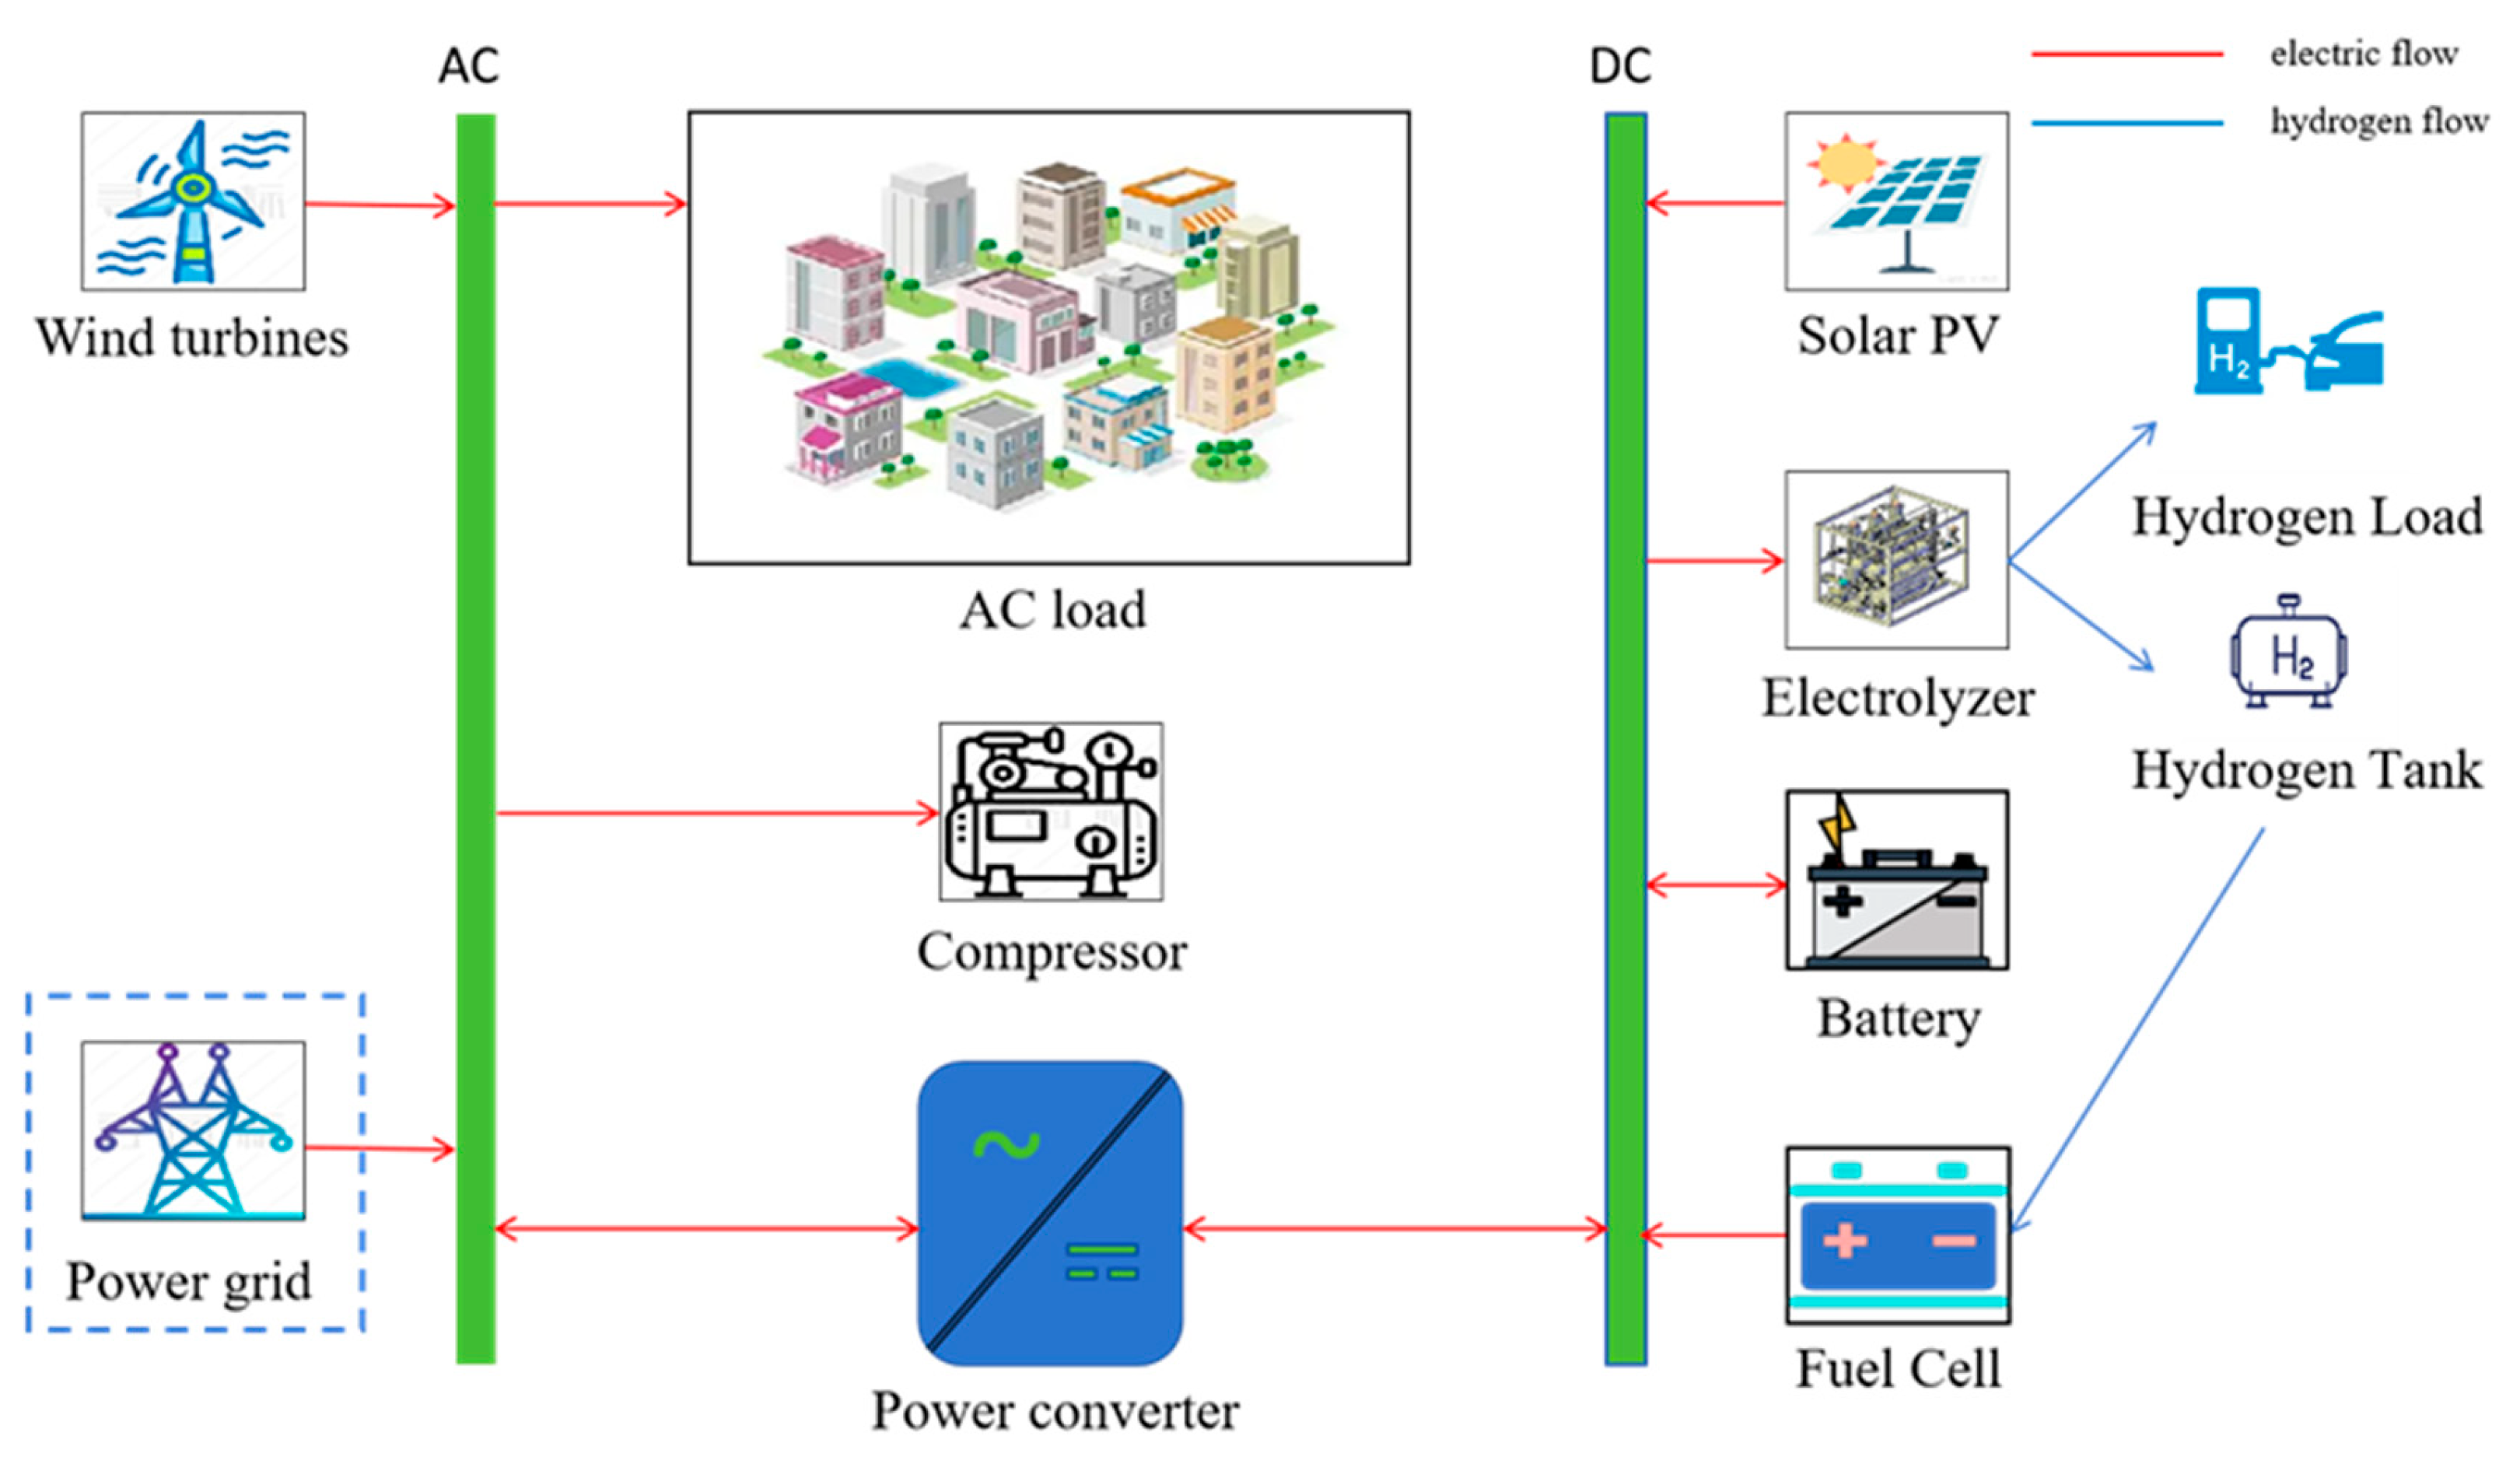
In this research, HOMER Pro (3.14.2) was employed to simulate a wind–solar hybrid energy storage system comprising PV panels, wind turbines, electrolyzers, hydrogen storage tanks, fuel cells, converters, and batteries. To build the off-grid scenarios, three combinations of components were used in this study: (i) wind turbine/photovoltaic/electrolyzer/fuel cell/battery/hydrogen storage tank; (ii) removal of the wind turbine from the system (i); and (iii) removal of the battery from the system (i). Ultimately, three independent off-grid systems were established, and their performance was comprehensively analyzed using multi-criteria decision-making approaches to determine the optimal combination suitable for subsequent grid-connected operation. A schematic representation of the proposed system is illustrated in Figure 3, where the grid connection is highlighted with a dashed outline to indicate differences between off-grid and grid-connected setups. Table 3 provides the detailed parameters and technical specifications of the components utilized.

3.1.1. Wind Turbine Components

The wind turbine power generation process can be expressed by the following equations. Initially, the wind speed at the turbine installation site is determined based on the hub height, as presented in Equation (1). Subsequently, using the turbine manufacturer’s provided power curve, the turbine’s anticipated power output at the calculated wind speed under standard atmospheric conditions (temperature and pressure) is determined. Finally, this predicted power output is adjusted by multiplying it with the air density ratio to obtain a more accurate estimation, thus reflecting the actual power generation capability of the wind turbine. This calculation process is demonstrated in Equation (2) [42].
u 0 u 1 = z 0 z 1 α
where u 1 is wind speed measured using instruments, m/s; z 0 is the height of the turbine hub, m; z 1 is the height at which the anemometer is located, m; and α is the ground friction coefficient.
P W T G = ρ ρ 0 · P W T G , S T P
where P W T G denotes the power output of the fan, kW; ρ is the actual air density, kg/m3; ρ 0 denotes the air density under standard conditions (P = 101.325 kPa, T = 288.15 K), 1.225 kg/m3; and P W T G , S T P denotes the power output of the fan under standard conditions, kW.

3.1.2. Photovoltaic Components

For this analysis, a standard photovoltaic (PV) flat panel module provided in HOMER software was employed, given the substantial solar energy availability in the research region throughout the year, making PV modules crucial components of the overall system. These solar panels convert solar energy into electrical power by absorbing photons emitted by sunlight, which excites electrons inside the panel, consequently generating electric current. The PV array’s power generation was determined using the mathematical relationship shown in Equation (3) [42].
P p v = Y p v f p v G T ¯ G T , S T C ¯ 1 + α P T c T c , S T C
where Y p v denotes the nominal capacity of the photovoltaic array, specifically referring to the electrical output under standardized test conditions, which include a solar irradiance of 1000 W/m2, a photovoltaic cell temperature of 25 °C, and an air mass coefficient of AM1.5; f p v represents the PV derating coefficient, %; G T ¯ indicates the solar radiation striking the photovoltaic array at a given time step, measured in kW/m2; G T , S T C ¯ corresponds to the standard test condition irradiance of 1 kW/m2; α P denotes the temperature coefficient of power output (%/°C); T c represents the PV cell temperature at the current time interval, measured in °C; and T c , S T C signifies the PV cell temperature under standard test conditions, specifically 25 °C.

3.1.3. Battery Components

In renewable energy generation systems, the electricity generated can be unstable due to fluctuations in weather conditions, sunlight intensity, wind speed, and other factors. By storing excess electrical energy and releasing it at times of peak consumption, batteries can balance the load on the grid and improve the stability and reliability of the grid. The battery makes energy interchangeable between chemical and electrical energy through the process of charging and discharging, and the battery used in this study is a lithium battery with a nominal capacity of 1 kWh.

3.1.4. Converter Components

The converter in the system is a combination of a rectifier and an inverter that transforms the AC power from the wind turbine and the DC power from the hybrid PV–fuel cell–battery energy system into the DC/AC power required by the load.

3.1.5. Electrolyzer Components

The electrolyzer is the core of the whole hydrogen production module, and the system chooses the proton exchange membrane electrolyzer model that comes with the software to electrolyze water to produce hydrogen. In practice, in order to improve the purity of hydrogen, the electrolyzer unit is used together with the hydrogen separator, oxygen separator, and other equipment, and here, in order to simplify the model, only the electrolyzer as a single device is considered.

3.1.6. Fuel Cell Components

This system uses a proton exchange membrane fuel cell model that comes with the software. The fuel cell converts chemical energy into electrical energy through an electrochemical reaction. The generated electricity can be directly delivered to the load for practical application, and its by-product is only water, which does not emit any harmful pollutants.

3.1.7. Hydrogen Storage Tank Components

Once the hydrogen demand is satisfied, surplus hydrogen generated by the electrolyzer is accumulated in the hydrogen storage tank. During periods when electricity production is insufficient, the stored hydrogen is directed to the fuel cell unit, undergoing an electrochemical reaction to convert its chemical energy into electrical power, thereby meeting the electricity requirements of the load.

3.1.8. Compressor Components

The hydrogen produced in electrolyzers typically emerges at relatively low pressures and subsequently needs compression to higher pressures for efficient and compact storage. Although HOMER software does not directly incorporate a hydrogen compression module, the compression power requirement can still be calculated through a straightforward equation. The estimated compression load is then integrated into HOMER as an additional electrical load profile, effectively simulating the compressor demand. The following equation (Equation (4)) is used to estimate the power required for hydrogen compression from 30 to 400 (350) bar [7], where the values of the parameters and their interpretation are in agreement with the references given. At present, 20–40 MPa of gaseous storage is mainly used, with an average daily loss of about 0.5%, and the loss of long pipe trailers in transport is about 10%.
P c o m p = z R n T 1 η r r 1 P 2 P 1 r 1 n r 1 m c

3.2. Analysis and Optimization

3.2.1. Economic Analysis Parameters

During the simulation and optimization procedures, NPC, LCOE, and LCOH serve as the key evaluation metrics for determining the optimal configuration of the hybrid system. These evaluation criteria are as follows:
(1)
Net present cost (NPC) [5,48,49]:
N P C = C a n n , t o t C R F i , n
C a n n , t o t = C c a p + C r e p + C O & M R s a l v
C R F i , n = i ( 1 + i ) n i ( 1 + i ) n 1
where C a n n , t o t (USD/year) denotes the hybrid system’s overall annual cost, CRF refers to the capital recovery factor, i represents the annual interest rate (%), and n indicates the operational lifespan of the hybrid system. Additionally, C c a p , C r e p , C O & M , and R s a l v correspond to the capacity cost, replacement cost, total operation and maintenance expenditures, and salvage value.
(2)
Levelized costs of energy (LCOE) [50]:
L C O E = C a n n , t o t C b o i l e r H s e r v e d E s e r v e d
where L C O E represents the LCOE, C b o i l e r denotes the boiler-related cost (USD/kWh), H t h e r m a l is the total thermal energy requirement (kWh/year), and E s e r v e d signifies the overall electrical load (kWh/year). Since the system evaluated here does not include any thermal energy demand, the value of H t h e r m a l is set to zero.
(3)
Levelized costs of hydrogen (LCOH) [7]:
L C O H = C a n n , t o t M h y d r o g e n
where M h y d r o g e n (kg/year) represents the annual supply of hydrogen.
In addition, discount and inflation rates of 8 and 2%, respectively, were adopted in this study [11,51]. Two distinct operational scheduling methods—load following (LF) and cyclic charging (CC)—were implemented for comparative analysis.

3.2.2. Optimization Processes

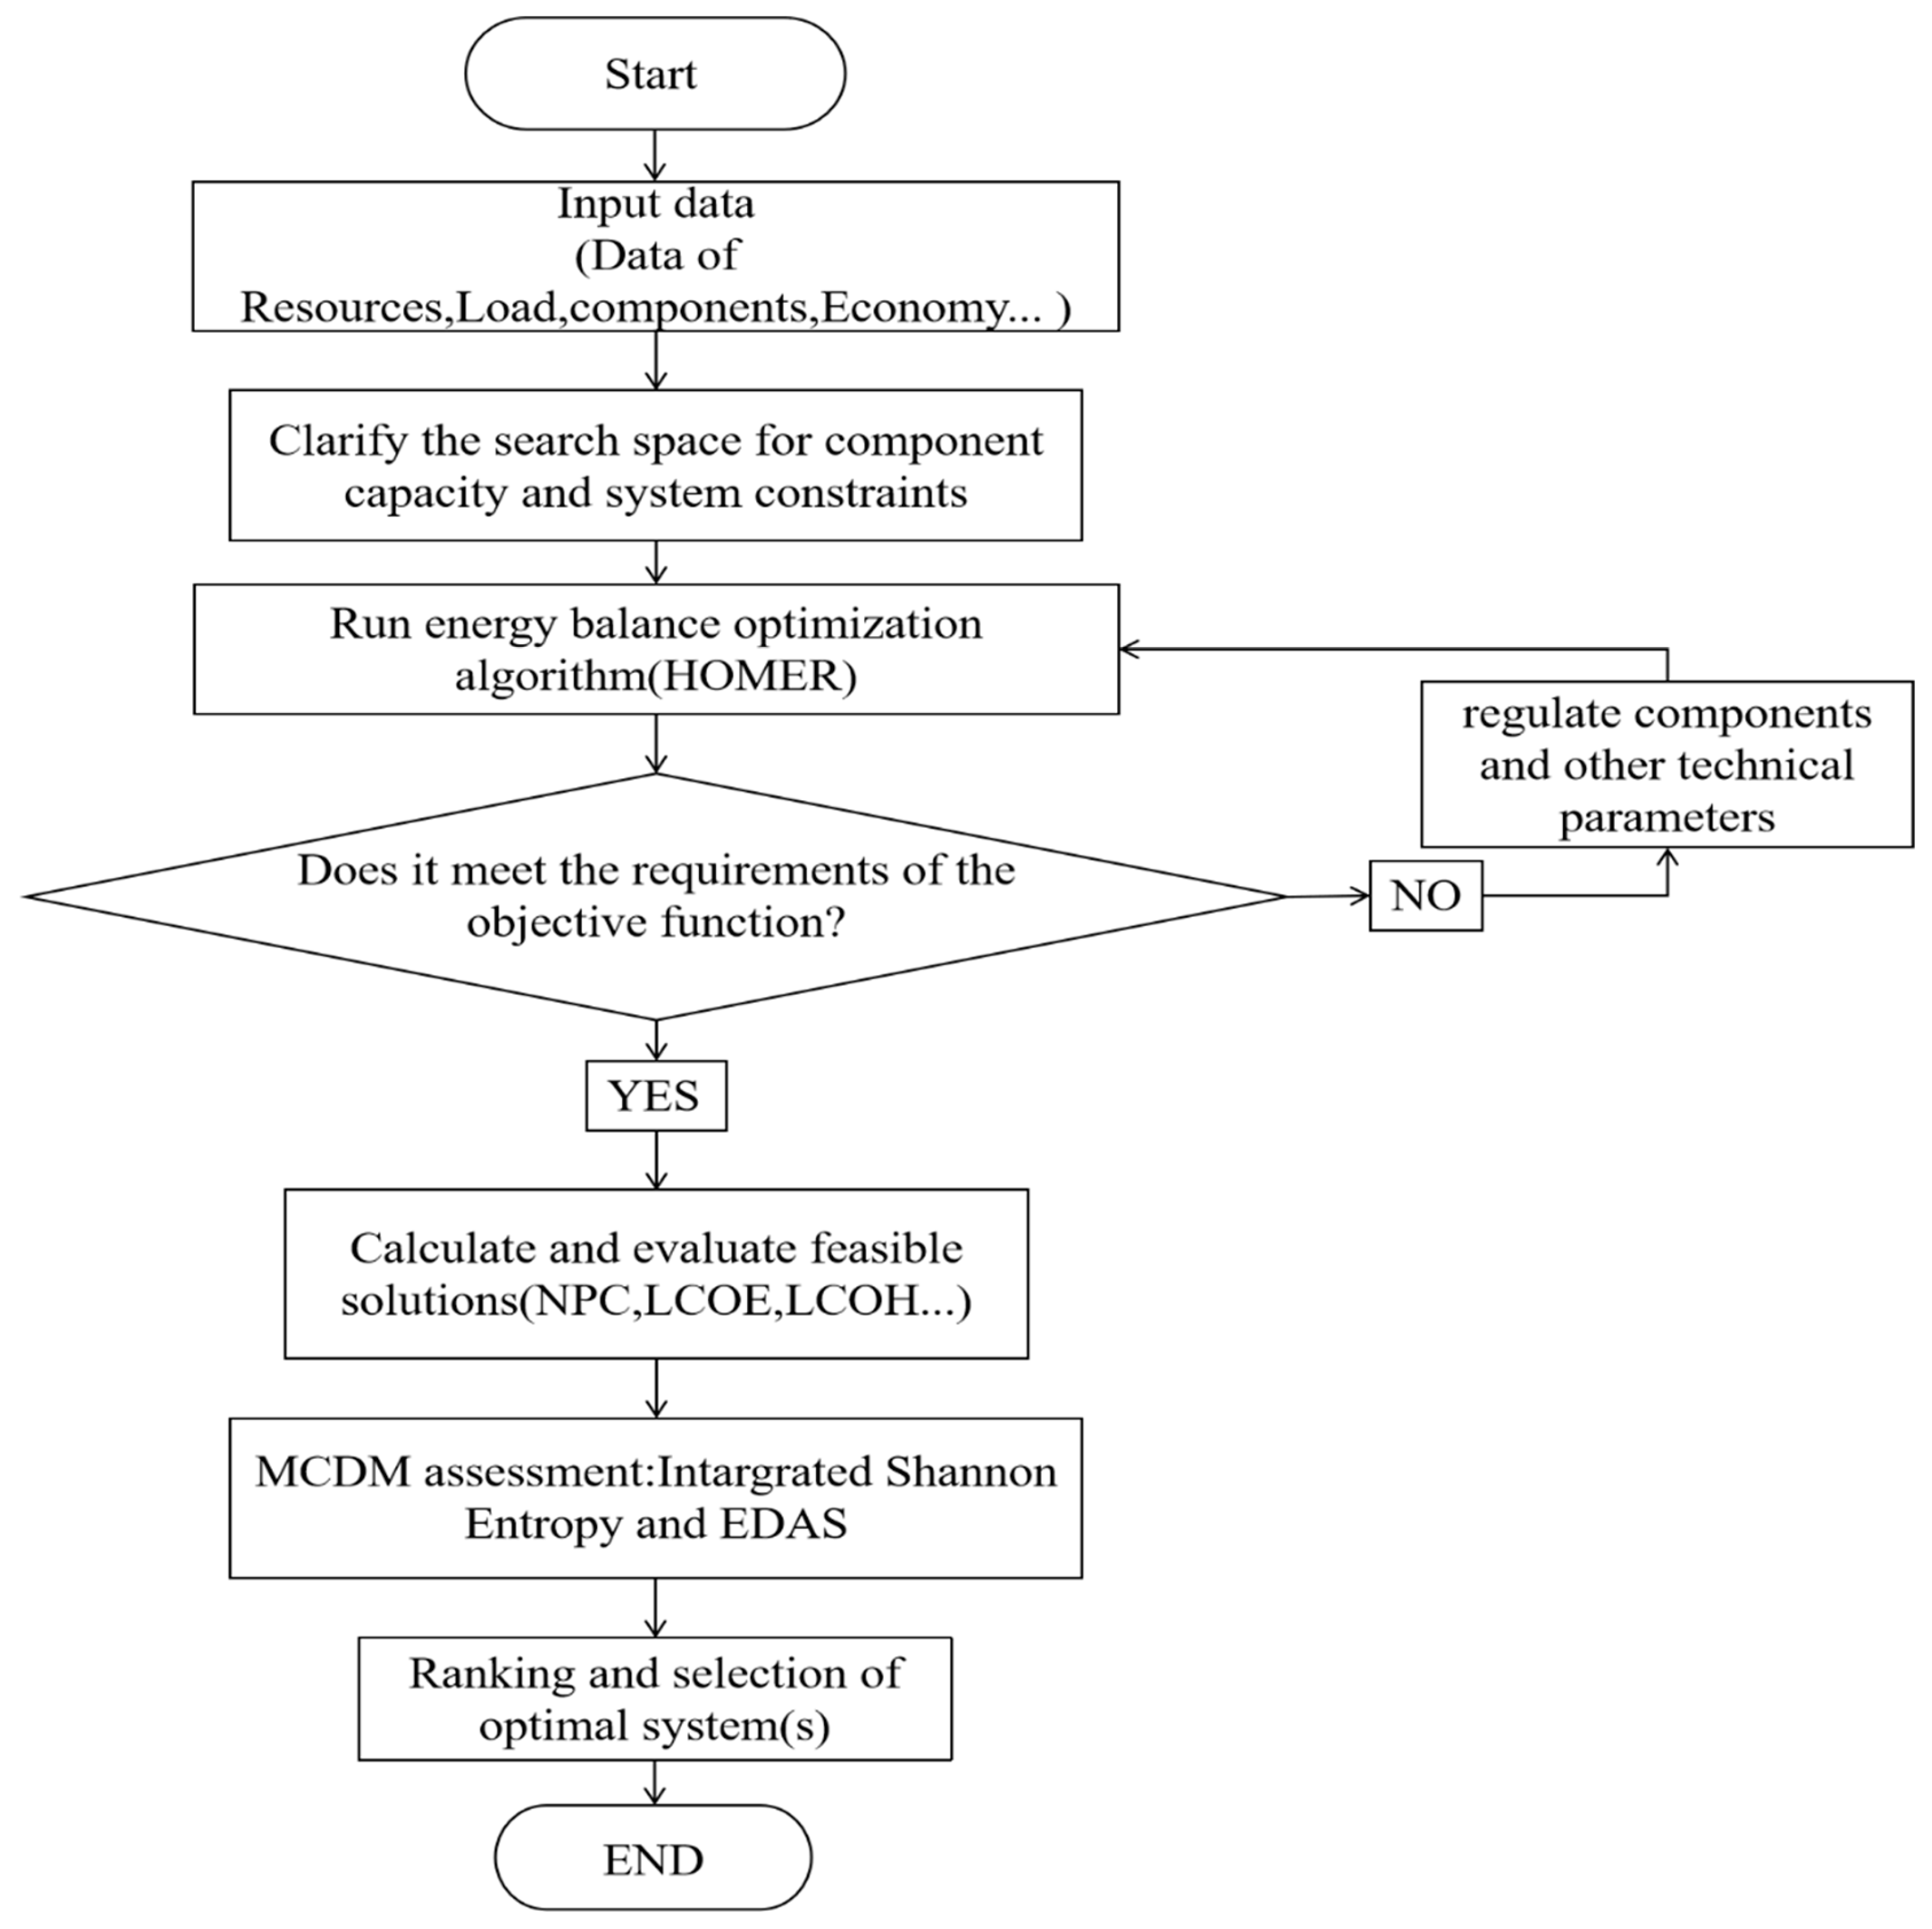
The optimization flow chart for HOMER Pro software is shown in Figure 4.

3.2.3. Sensitivity Analysis Overview

This research introduces a renewable energy-based hydrogen generation and storage scenario designed for sustainable operation. Throughout the project’s life cycle, various uncertainties may emerge, potentially influencing overall system performance. Therefore, we should take these influences into account in the pre-planning stage of the system. In this study, sensitivity analyses were conducted to evaluate how factors such as electrolyzer lifetime and overall system lifespan affect the NPC, as well as to assess the effects of inflation and discount rates on the LCOH. The goal of these analyses was to identify critical parameters significantly impacting the economic feasibility and operational performance of the system.

4. Multi-Criteria Decision Assessment

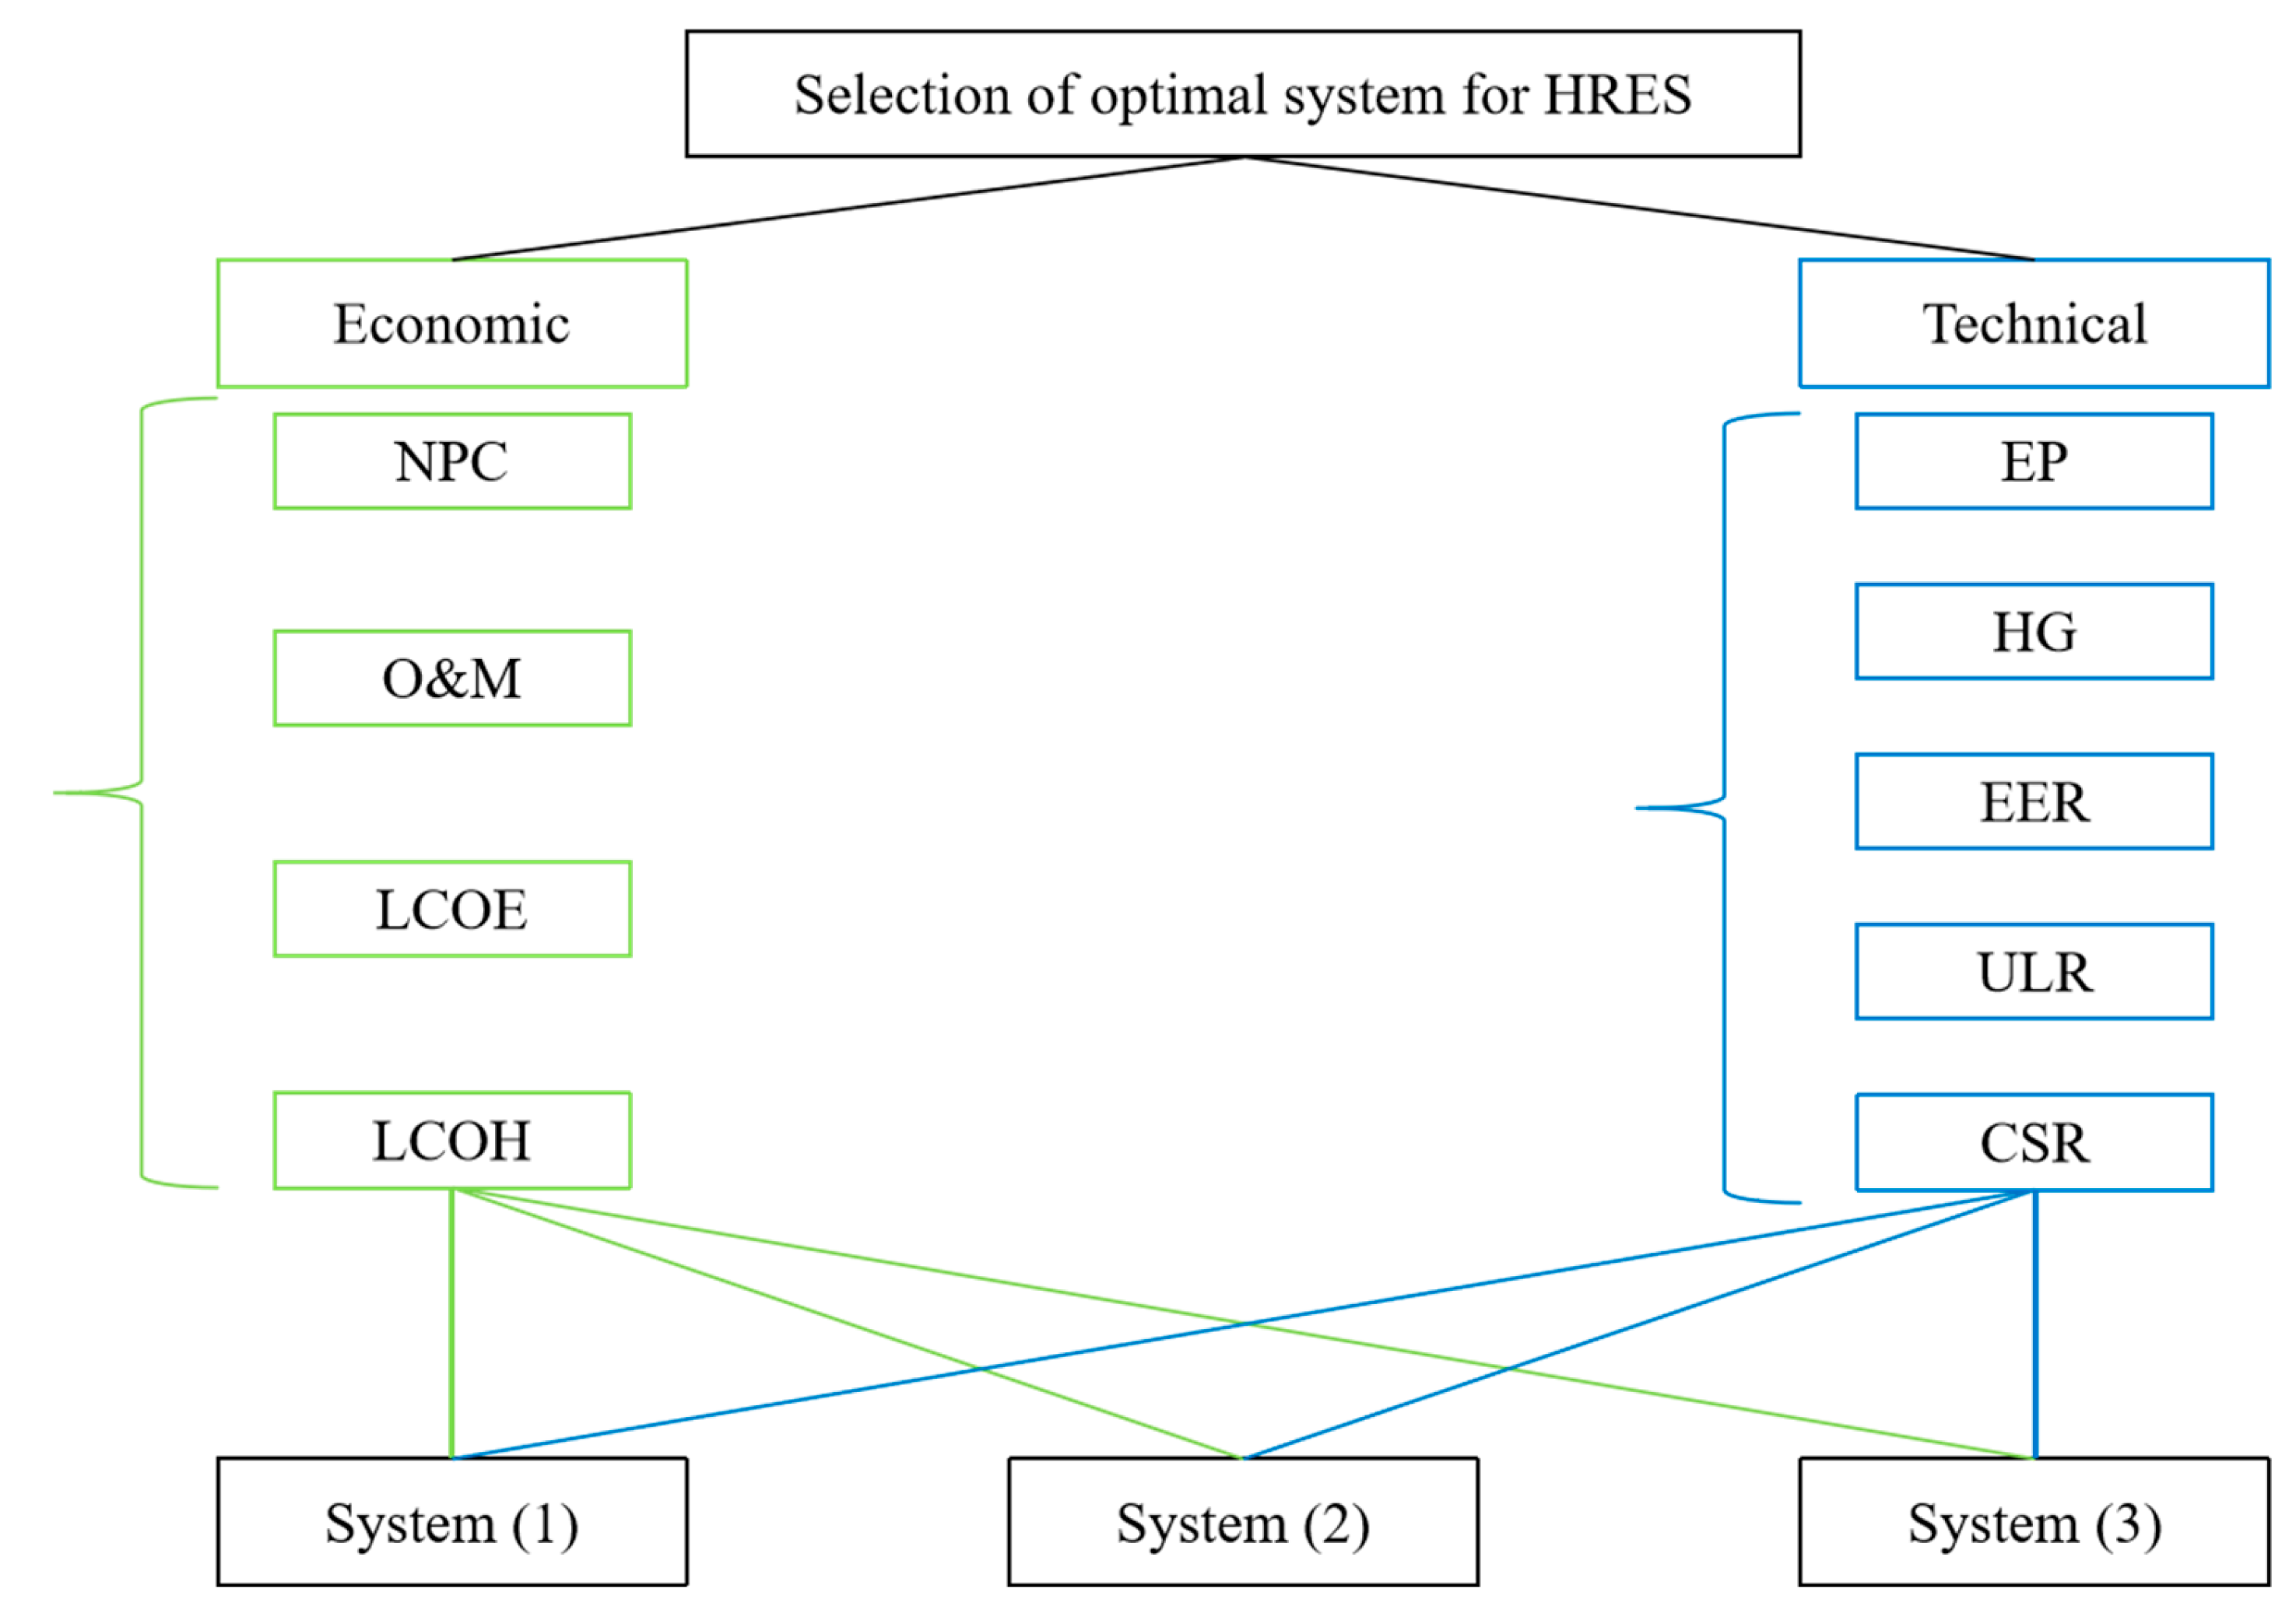
The rationale for adopting a multi-criteria decision-making approach in this study is that the optimal capacity allocation results provided by HOMER Pro are primarily evaluated from an economic standpoint. However, multiple additional factors influence the comprehensive performance of hybrid systems, necessitating the integration of various evaluation metrics to accurately identify the optimal combination of system components. The corresponding schematic illustration is presented in Figure 5. The decision flow chart of the Shannon Entropy-EDAS method is shown in Figure 6.

4.1. Shannon Entropy

The Shannon Entropy method is a weight determination MCDM model that uses the Shannon Entropy of weight assignment to determine the relative weights of multiple criteria to the objective, which determines the weights of the decision criteria by initializing the decision matrix and following specific steps as follows [52,53]:
Step 1: Normalize the initial decision matrix using Equation (10).
r i j = x i j i = 1 m x i j , i = 1,2 , , m
Step 2: Calculate the entropy value for each criterion using Equation (11).
E j = k i = 1 m r i j ln r i j , j = 1,2 , n
where k is a constant, k = 1 ln ( m ) .
Step 3: Based on the concept of entropy, define objective weights for each criterion using Equation (12).
w j = 1 E j j = 1 n ( 1 E j )

4.2. EDAS

The Evaluation Based on Distance from Average Solution (EDAS) method, originally introduced by Ghorabaee et al. [54], is a multi-criteria decision-making (MCDM) approach that evaluates alternatives based on their distances to the average performance level. The central concept of EDAS is assessing each alternative by determining how far it deviates—positively or negatively—from the mean value across all alternatives. Unlike conventional MCDM techniques such as TOPSIS and VIKOR, which emphasize the distances to ideal or negative-ideal solutions, EDAS specifically examines the deviations of alternatives relative to the average. In EDAS, two primary metrics are computed: positive distance from average (PDA) and negative distance from average (NDA). PDA reflects how significantly an alternative surpasses the average performance, whereas NDA measures how considerably an alternative falls short of the average. Consequently, an alternative exhibiting a higher PDA and a lower NDA is considered more favorable compared to others and the average solution. The detailed computational steps involved in the EDAS method are described as follows [55]. The values of i in Equation (13) to Equation (23) all range from 1 to m, and the values of j all range from 1 to n.
Step 1: Construct a decision matrix using real data as shown in Equation (13).
D = r 11 r 1 n r m 1 r m n
where m and n denote the number of options and criteria, respectively.
Step 2: Calculate the average solution for each criterion based on Equation (14).
A V j = i = 1 m r i j m
Step 3: For positive criteria, use Equations (15) and (16) to calculate their positive distance (PDA) and negative distance (NDA) from the mean, respectively. For the negative criteria, use Equations (17) and (18) to perform the relevant numerical calculations, respectively.
P D A i j = max 0 , r i j A V j A V j
N D A i j = max 0 , A V j r i j A V j
P D A i j = max 0 , A V j r i j A V j
N D A i j = max 0 , r i j A V j A V j
Step 4: Calculate the weighted values of PDA and NDA for all alternatives using Equations (19) and (20), respectively.
W P i = j = 1 n P D A i j · w j
W N i = j = 1 n N D A i j · w j
Step 5: Normalize the weighted results of PDA and NDA using Equations (21) and (22), respectively.
N W P i = W P i max W P i
N W N i = W N i max W N i
Step 6: Calculate the score for each program using Equation (23).
S i = 1 2 N W P i + N W N i
Step 7: Sort the scores of each option in ascending order, and select the option with the highest score.

5. Results and Discussion

In this section, the optimization results are presented in tabular form, and further screening is carried out through the method of multi-criteria decision-making evaluation. Finally, the preferred solution is analyzed for economy, technology, and sensitivity. The benchmark values for system life, discount rate, inflation rate, and annual capacity shortfall for each system in this study are set to 25 years and 8, 2, and 0%, respectively. In addition to this, this study excludes the thermal energy of the system from the techno-economic analysis and does not consider its impact.

5.1. Software Optimization Results

Table 4, Table 5 and Table 6 below show the results of the optimization of the system’s capacity allocation, the economic parameters, and the technical parameters for each of the studied systems, respectively. Subsequent relevant analyses will be based on the above tables and corresponding pictures.
When using the multi-criteria decision evaluation method described in Section 4, we first use the entropy weighting method to calculate the criteria weights and then determine the weights of each evaluation indicator through the steps of data standardization, calculation of probability distributions, calculation of information entropy, and computation to avoid subjective bias. Next, using the weights from the previous step, the average solution for each criterion is determined, the degree of deviation (positive/negative deviation) from the average solution is calculated for each scheme, and then the positive and negative deviation scores are standardized. Finally, the composite score for each solution is calculated, and the advantages and disadvantages of the solutions are ranked and comprehensively assessed. Ultimately, we arrived at the decision results for each criterion shown in Table 7 and Table 8. As can be seen in Table 7, the top three criteria in terms of importance among the multiple evaluation criteria are the capacity shortage rate, the excess electricity rate, and the levelized cost of electricity, which are important economic and feasibility factors in evaluating the system’s operational capability, and the extrapolated results are consistent with reality. Based on the ranking of criteria in Table 8, combined with Table 4, Table 5 and Table 6, it can be preliminarily inferred that system (1) is the best system.
Table 8 gives the final results of ranking each of the above scenarios using the Shannon Entropy-EDAS model, with system (1) ranking the highest. Compared to the other two systems, this system has outstanding points in terms of both economic and technical aspects, achieving a high production of electricity and hydrogen at a lower cost.
Based on the results of the multi-criteria decision evaluation method described above, the grid-connected system (4) is constructed according to the component pairing form of system (1). There is no difference between systems (1) and (4) in terms of other configuration parameters of the system, except for whether it has a grid-connected structure [42]. The renewable energy share of the system is calculated to be 99.3%. For the economic indicators, the NPC of the system is USD 7.34 million, the initial cost is USD 6.09 million, the O&M cost is USD 0.35 million, the replacement cost is USD 1.40 million, the LCOE is USD 0.11/kWh, and the LCOH is USD 3.42/kg. For the technical indicators, the system’s annual electricity generation is 10.15 × 10⁶ kWh, annual hydrogen production is 103.01 ton, excess electricity rate is 15.6%, unmet load rate and capacity shortage rate are both 0, annual power purchased from the same grid is 2.63 × 10⁴ kWh, and power sold is 2.84 × 10⁶ kWh. After field research, the actual operation of the local hydrogen demonstration project in the study area has a production cost of around USD 5.6 per kilogram of hydrogen, and no hybrid storage structure is added to the project. In comparison, the system in this study has a lower cost of hydrogen production and a lower levelized cost of electricity in the grid-connected mode. Overall, the optimized system performs better in terms of economy. In addition, the current hydrogen demonstration project has long-term and diversified development prospects due to the local government policy support, which will provide a basis for the application of hydrogen energy.

5.2. Economic Analysis

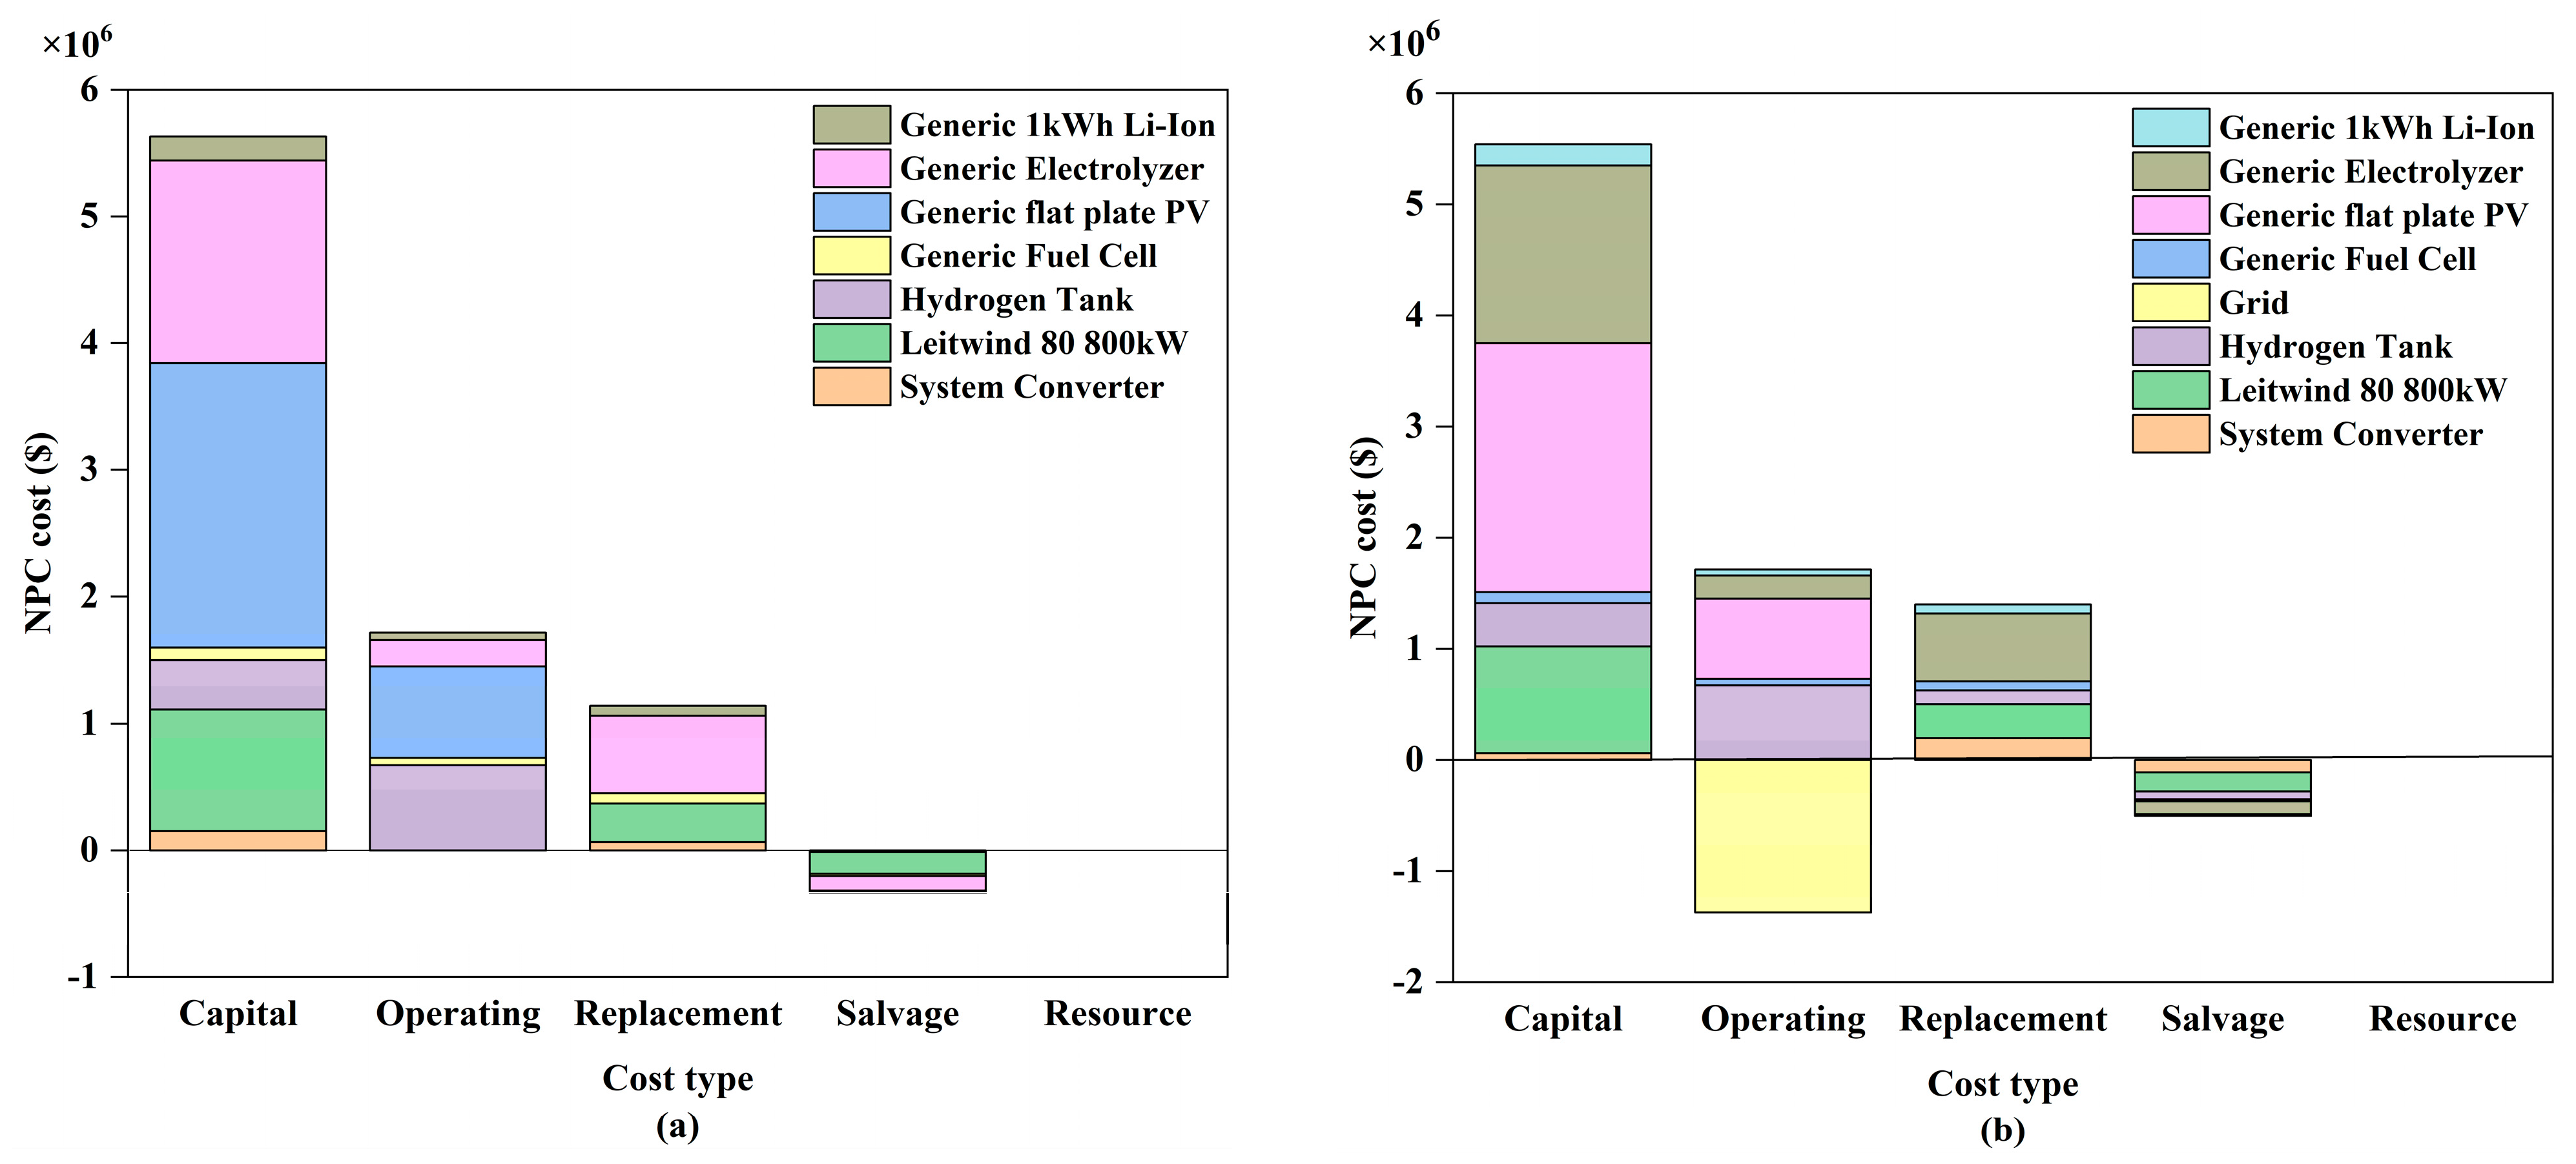
An economic analysis of systems (1) and (4) is conducted below, beginning with an examination of their cost structures categorized by cost type and individual system components, as depicted in Figure 7. Among these cost categories, the initial investment represents the largest proportion of total NPC, accounting for 69.08% in the off-grid scenario and 82.97% in the grid-connected scenario, followed by operation and maintenance (O&M) and replacement expenses. Hence, the initial capital investment significantly influences system implementation. Subsequently, analyzing the contribution of each component module to the total initial cost, (a) and (b) of Figure 7 illustrate that the photovoltaic (PV) and electrolyzer modules constitute the highest percentages, at 68.21% for system (1) and 63.05% for system (4), respectively. These modules are thus critical components in electricity and hydrogen production processes. Consequently, future optimization efforts should focus primarily on decreasing the costs of PV and electrolyzer modules, enhancing their operational efficiency, and reducing their input–output ratios. Furthermore, as indicated by the economic indicators summarized in Table 5, the grid-connected scenario demonstrates notably lower values compared to the off-grid scenario in terms of NPC (by 9.94%), LCOE (by 74.42%), and LCOH (by 34.98%). This is primarily attributed to the capability of the grid-connected configuration to sell excess generated electricity back to the grid and to purchase supplemental electricity during periods of insufficient system-generated power. When the electricity sold significantly exceeds the amount purchased, the resultant revenue substantially decreases operational costs and enhances the reliability and economic viability of the system.
Of course, when the grid-connected system is in operation, the vast majority of electricity purchased from the grid is obtained by relying on thermal power generation, which involves the issue of carbon emissions from the grid-connected system. In accordance with the “2021 Electricity Carbon Dioxide Emission Factors” attached to the “Announcement on the Release of 2021 Electricity Carbon Dioxide Emission Factors” issued by the Ministry of Ecology and Environment and the National Bureau of Statistics, the provincial average carbon dioxide emission factor for electricity in Yunnan Province is 0.1235 kgCO2/kWh. On 30 January 2024, the International Institute of Green Finance at Central University of Finance and Economics published the “2023 Annual Report on China’s Carbon Market” in its IGF Special Issue, which indicates that the annual average transaction price of carbon emission allowances in the national carbon market was USD 9.54/ton in 2023. Bringing the above data into the system and recalculating, the NPC of the system changes from USD 7,338,254 to 7,338,666, and the operation and maintenance cost changes from USD 348,092.76 to 348,477.51.
Considering that there is also an output of oxygen in the system if it is stored and sold, it will further reduce the system’s cost. Based on the efficiency of the electrolyzer and the annual hydrogen production, the annual oxygen production of systems (1) and (4) is 747.52 and 824.08 ton, respectively. Considering that oxygen recycling and sales need to involve relevant infrastructure, a simple cost–benefit estimation is made here, using a project in Foshan, Guangdong, as a reference. First, there is the analysis of the investment cost of the facilities, which mainly includes the oxygen purification device, compression and storage device, and the transmission and distribution pipeline network. Based on the current annual oxygen production, the initial equipment investment is about USD 1–1.2 million, and the annual operating cost is about USD 100,000–140,000. In terms of revenue from the sale of oxygen, with all the oxygen produced being used as medical oxygen (USD 0.56/m3), the annual amount of oxygen sold by systems (1) and (4) would be USD 600,000 and 660,000 per year, respectively.

5.3. Technical Analyses

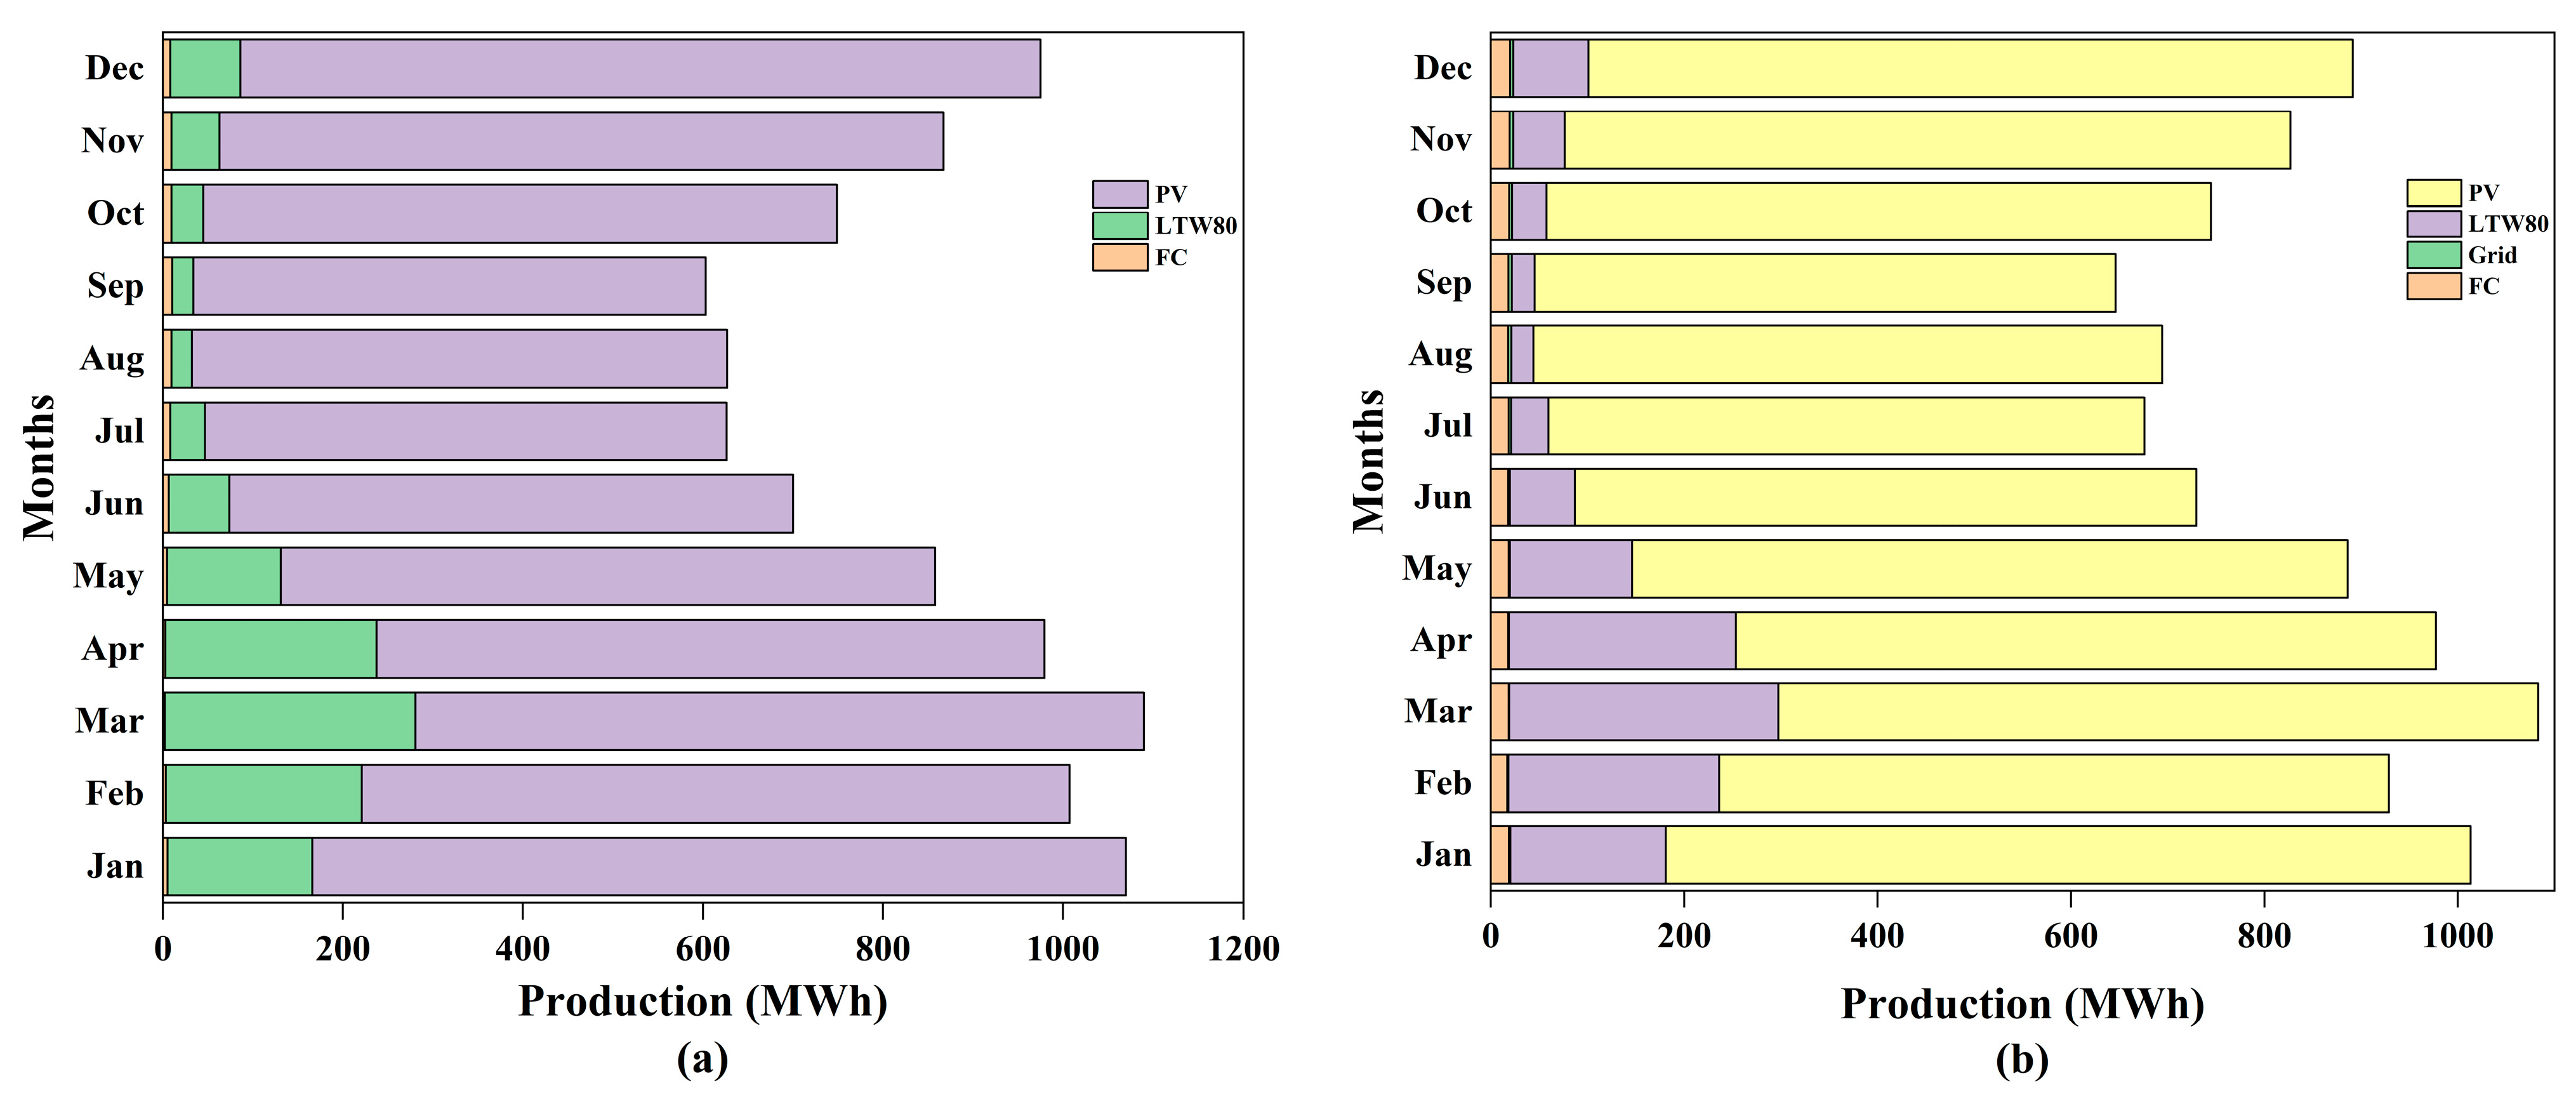
Figure 8 corresponds to the monthly power generation graphs of systems (1) and (4), respectively, and the similarity is that they both show a general trend of decreasing and then increasing, with the lowest power generation in the same year from June to September. The reason for the above pattern is that during this period, there is more rainfall in the study area, and as can be seen from Figure 7, this system is based on photovoltaic power generation, so the power generation is affected by this factor. Combining this with Table 5, the difference between the stand-alone and grid-connected systems is equally evident in terms of technicality. Systems (1) and (4) have an annual electricity and hydrogen production of 10.15 × 10⁶ kWh/yr and 93.44 ton/yr, and 10.10 × 10⁶ kWh/yr and 103.01 ton/yr, respectively, provided that the load is satisfied and the economy is optimal. Photovoltaic power generation accounted for a relatively large share of total power generation, at 86% and 84.3%, respectively. System (1) has a 42.5% power surplus, which puts higher demands on energy storage, conversion, and management. For the grid-connected system of system (4), which purchases 2.63 × 10⁴ kWh from the grid and sells 2.84 × 10⁶ kWh per year, the power surplus rate is reduced to 14.6%, which improves energy utilization and reduces costs. In addition to this, both grid-connected and off-grid systems perform very well in terms of power supply losses. The values of unmet load rate and capacity shortage rate are very low, which indicates that both systems have good stability and the probability of power supply interruptions and failures is very low.
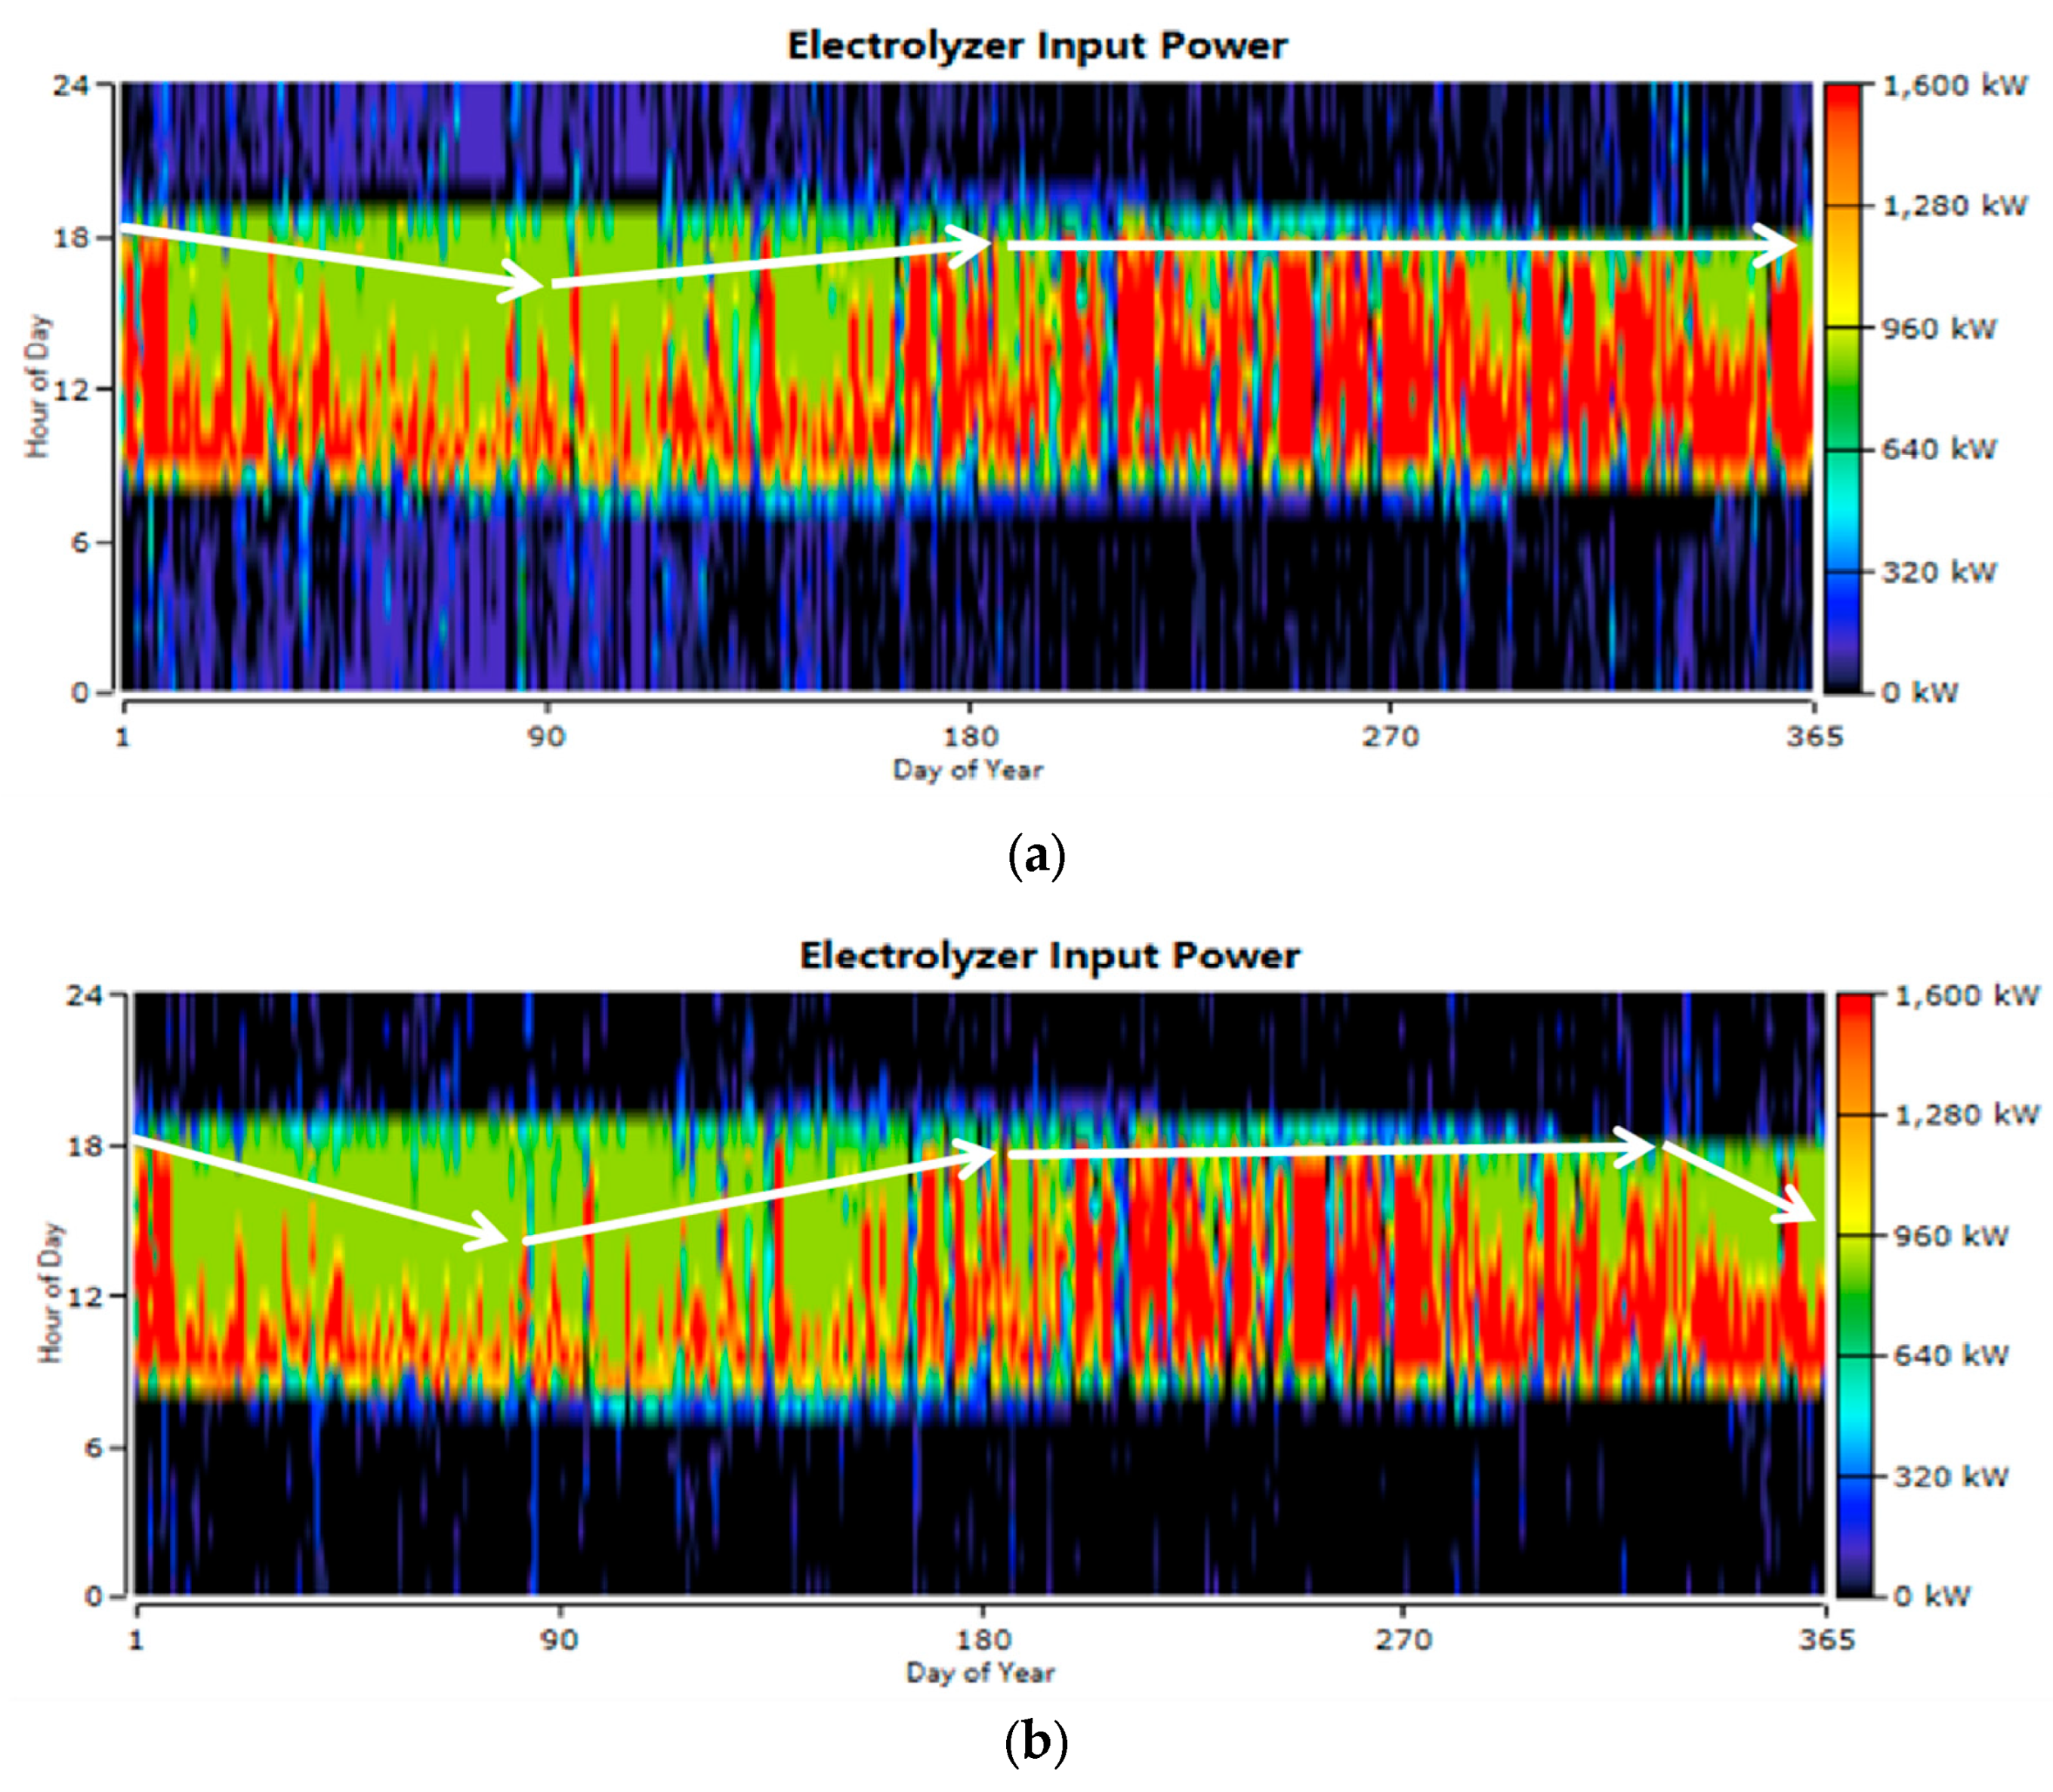
Figure 9a,b corresponds to the input power diagrams of the electrolyzer in the off-grid/grid-connected system, respectively. The white line in the figure represents the trend of power increase and decrease in the electrolyzer. It can be seen that the working time of the electrolyzer is 7:00 a.m. and 7:00 p.m., which is the same as that of the PV module, and the average monthly hydrogen production is 7786.67 and 8584.17 kg, respectively. The difference between the two is not significant when viewed in conjunction with the hydrogen production data mentioned in the article. The main reason for this is as follows: the system needs to minimize the usage time of the electrolyzer under the condition of satisfying the electricity and hydrogen loads and minimizing the system operating cost. This leads to similarities in electrolyzer usage between the two system configurations. In addition to this, the peak fluctuations in the plots are squeezed or even overshadowed due to the sheer volume of data, which is why the difference between the (a) and (b) plots is not clear. In combination with Figure 9a,b, it can be seen that there are still differences in the electrolyzer input power profiles of the two systems in the range of 160–365 days. The power fluctuation of the electrolyzer in Figure 9 a is more frequent and the electrolyzer is more involved in hydrogen production, storage, and conversion. This is due to the fact that the off-grid system has fewer ways to digest the excess power it produces while meeting demand than the grid-connected system, which is not able to interact with the grid, so there are more conversions between electricity and hydrogen in this system to improve energy utilization.
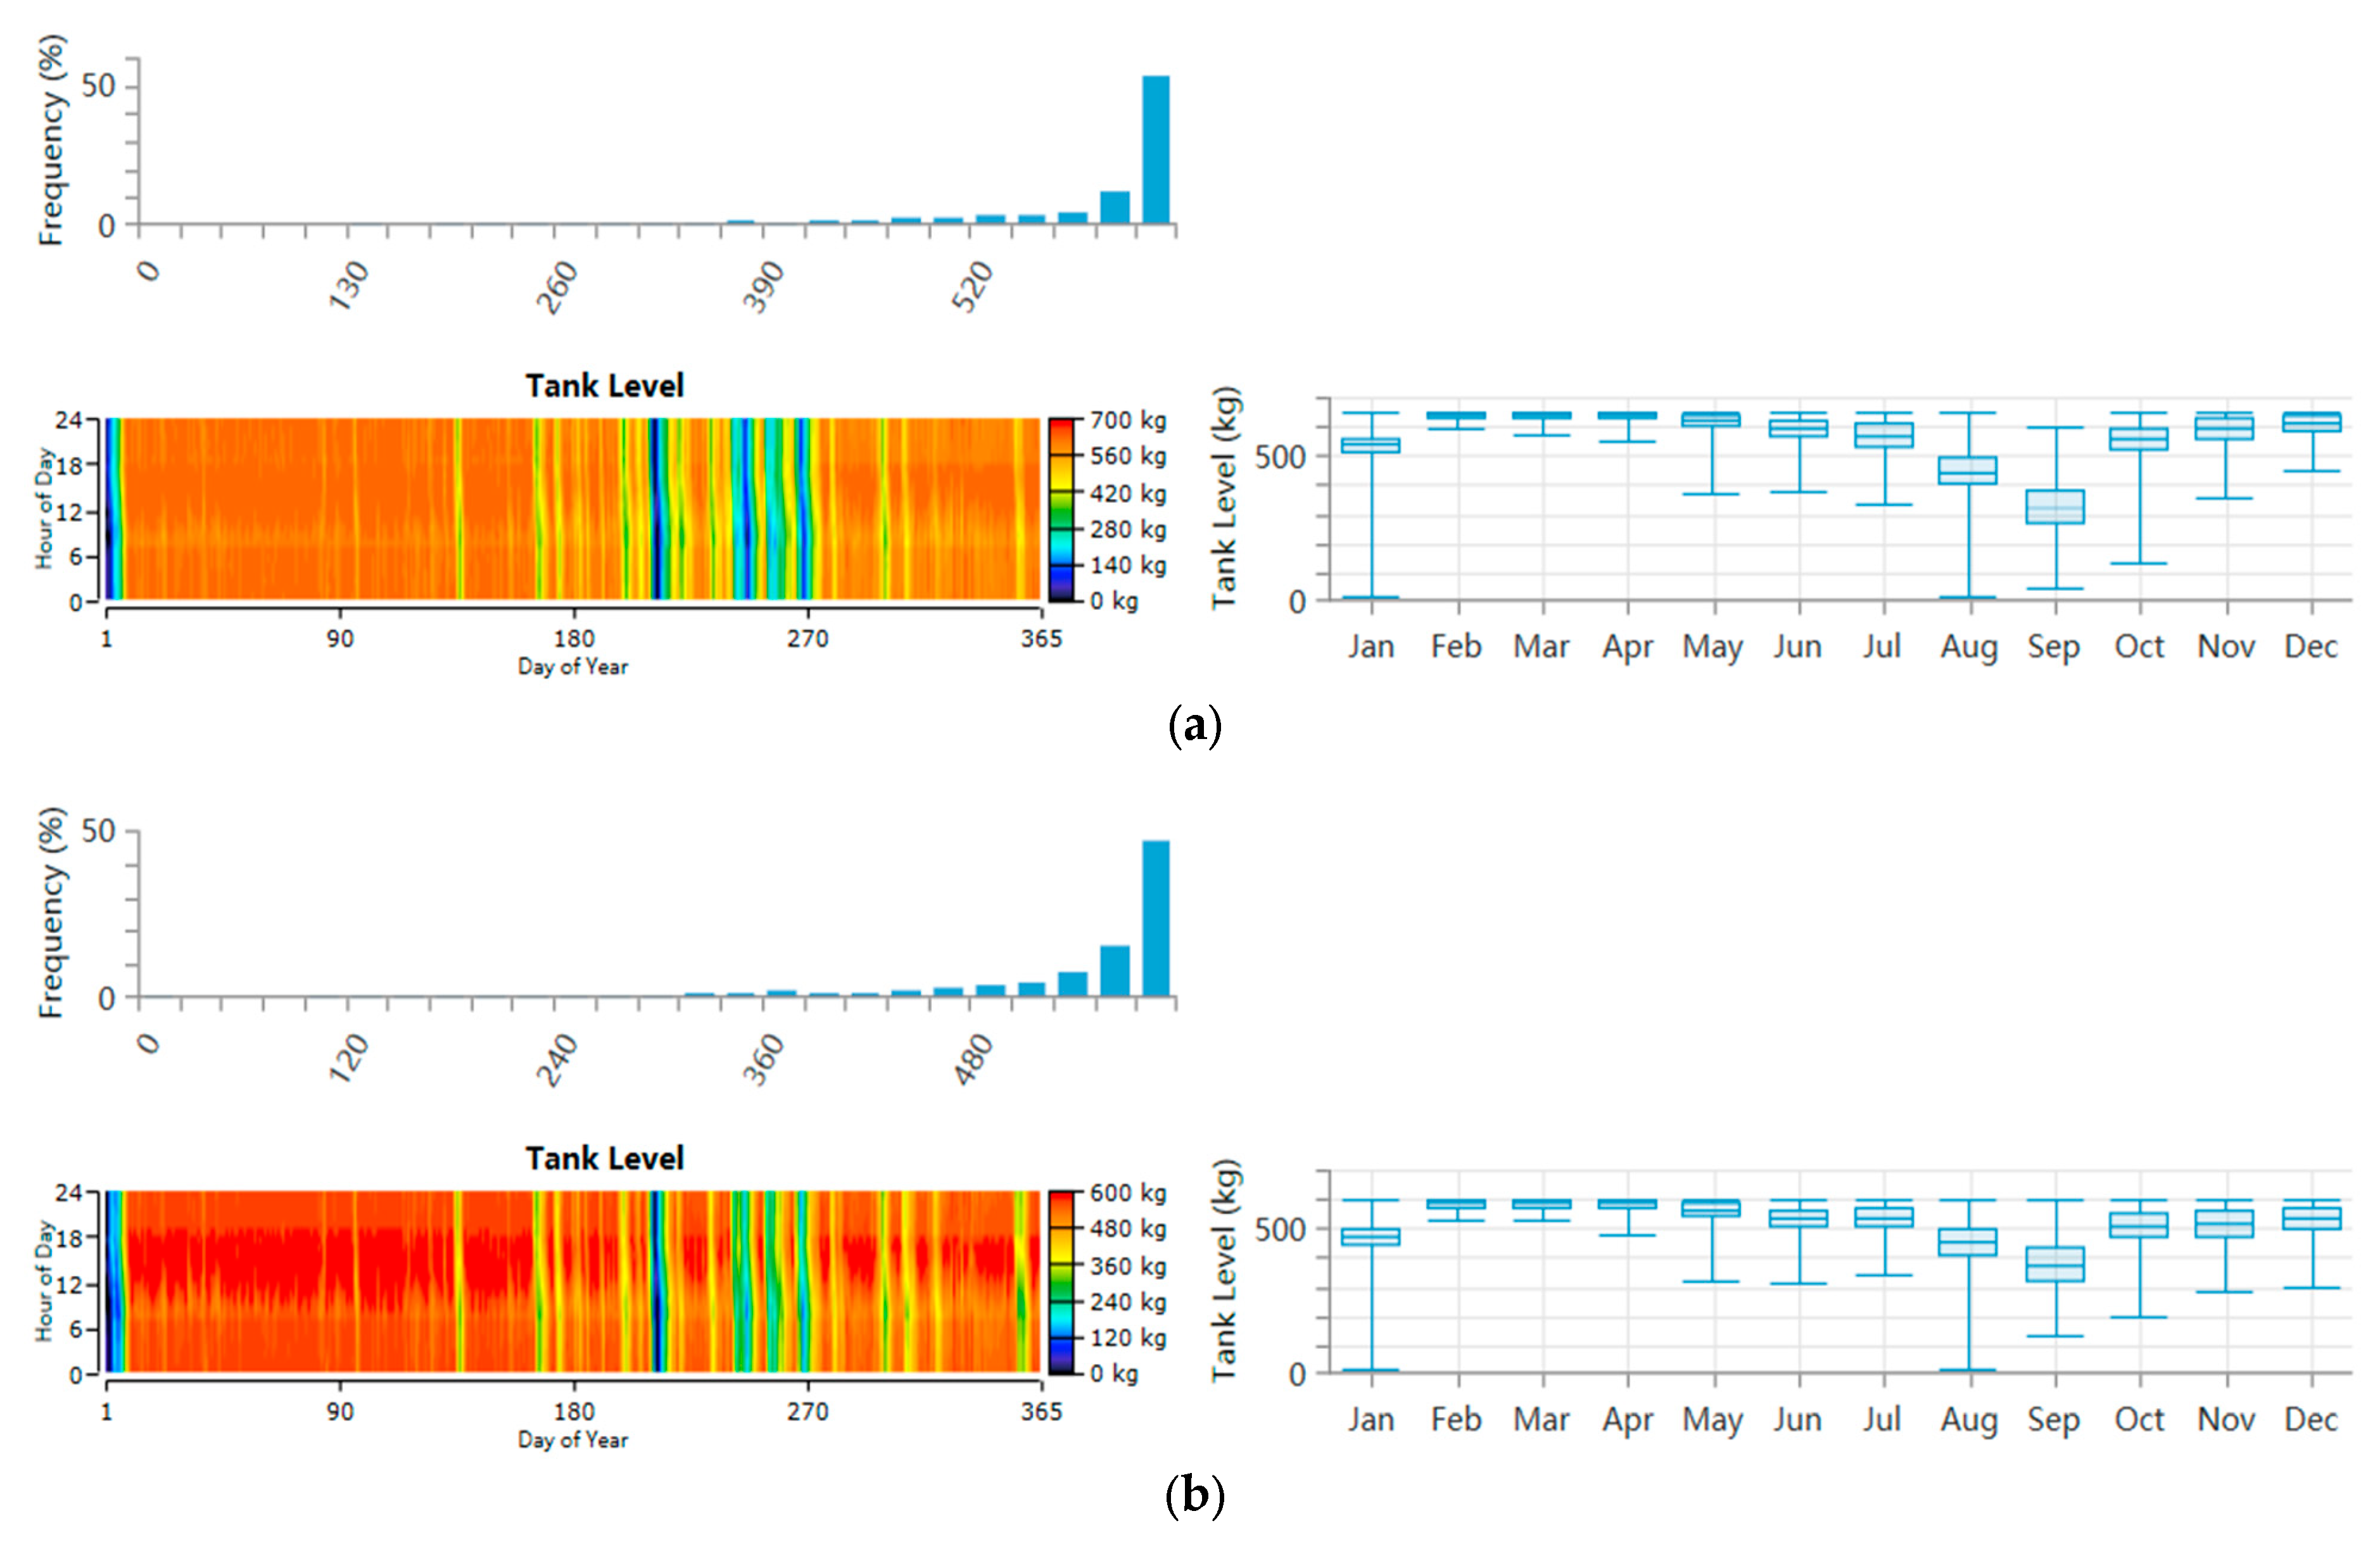
The peaks of the electrolyzer’s power consumption of the two systems are distributed from 1 to 30 days and 150 days. The reason for this is analyzed by combining the hydrogen storage tank levels shown in Figure 10. In the initial 1–30 days, the electrolyzer is at full power output and the hydrogen storage tanks are gradually filled to satisfy the daily hydrogen load, and the electrolyzer power decreases from days 30 to 150 to ensure economy and to ensure the hydrogen load is stored and the hydrogen storage tanks are used at the same time, which achieves the dynamic equilibrium. Subsequently, on days 210–215 and 265–270, the hydrogen storage tanks are maintained, the tanks consume all the hydrogen, and the electrolyzer power drops to 0. The explanation here is consistent with that in a previous study [54]. After that, the initial phase of the work stage is repeated week after week. At 365 days, the final hydrogen storage for systems (1) and (4) is 627 and 622 kg, respectively.
Utilizing renewable energy systems for electricity generation to satisfy hydrogen production demands in this study significantly decreases carbon dioxide (CO2) emissions compared with conventional fossil fuel-based power generation methods. The quantitative reduction in CO2 emissions can be computed by employing the formula presented in Equation (24) [37,38]:
C O 2 r e d u c e d = E g × F f a c t o r
where C O 2 r e d u c e d represents the amount of CO2 emission reduction achieved; E g denotes the total annual electricity generated by the hybrid renewable energy system; and F f a c t o r refers to the emission factor, which, for the purposes of this analysis, is considered as 123.5 g CO2 per kWh.
It is now known that the off-grid system can produce 9.52 MWh of electricity per year, and the annual carbon dioxide emission reduction of the system can be calculated by Equation (24) to be 1247.35 ton.

5.4. Sensitivity Analysis

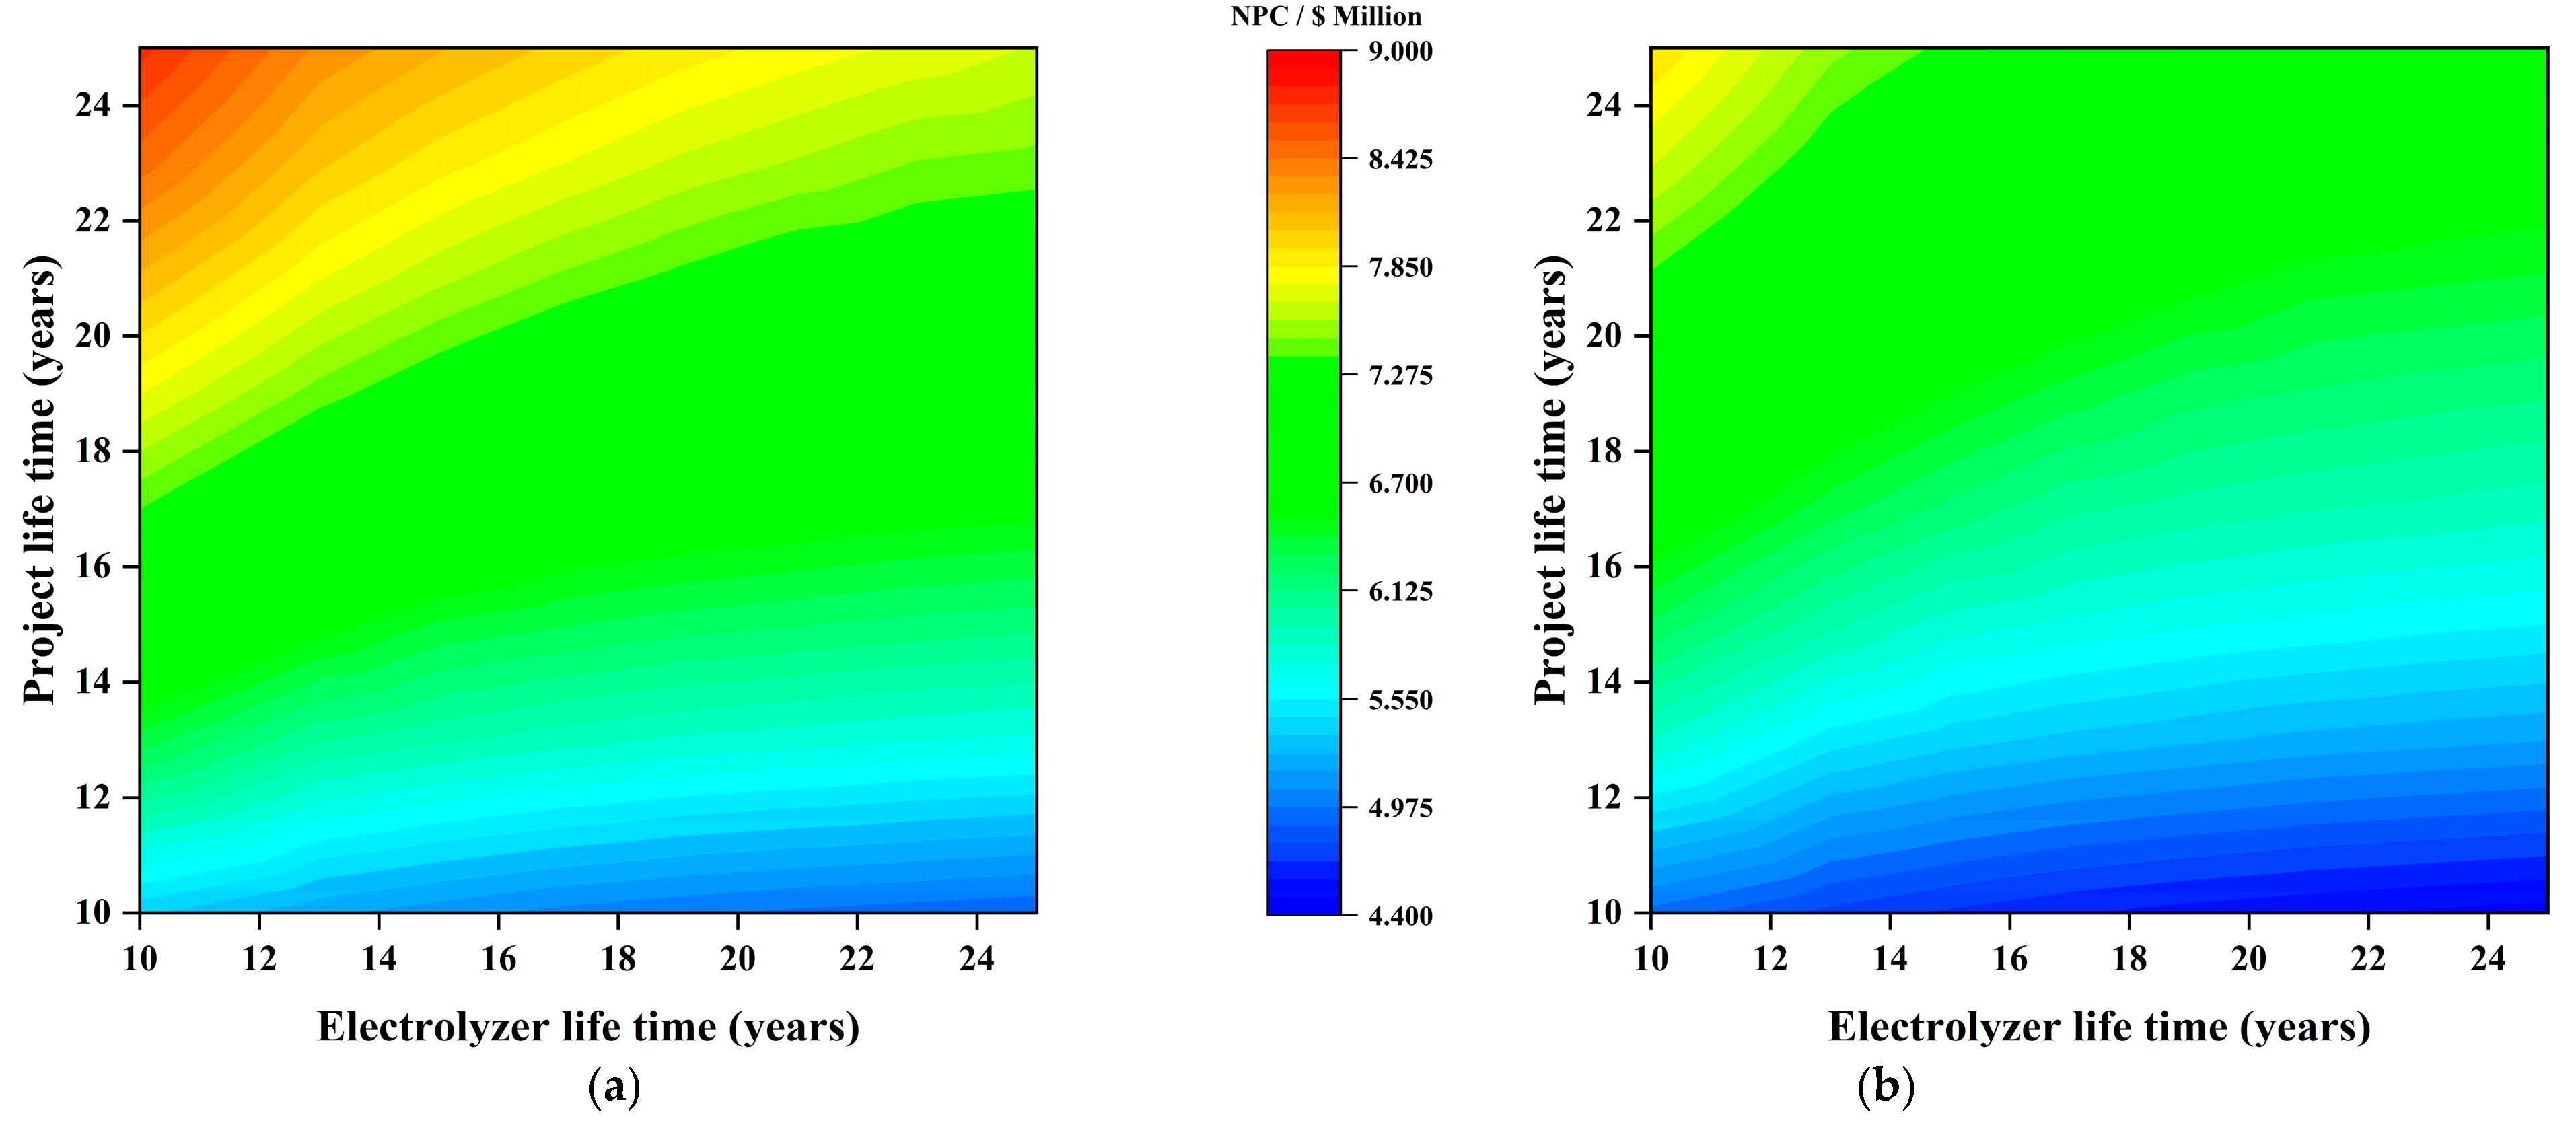
To investigate the effect of electrolyzer life and system life on NPC, eight gradients (from 10 to 25 years) were set for both system and electrolyzer life, as shown in Figure 11. By using the same color gradient in the two images above, the differences can be more clearly distinguished. From the figure, it can be seen that the system life increases and NPC rises, and the electrolyzer life increases and NPC decreases. The two have opposite trends and the electrolyzer life has a greater impact on NPC. In addition, the grid-connected/off-grid structure does not affect the sensitivity analysis. After integrating and analyzing the data, it is found that systems (1) and (4) have the lowest NPC of USD 4.89 million and USD 4.45 million, respectively, at 25 years of electrolyzer life and 10 years of system life. As the electrolyzer process continues to be optimized and hydrogen production technology continues to evolve, it is expected that capital costs will continue to fall, leading to more economically attractive renewable energy systems in the study area [56,57].
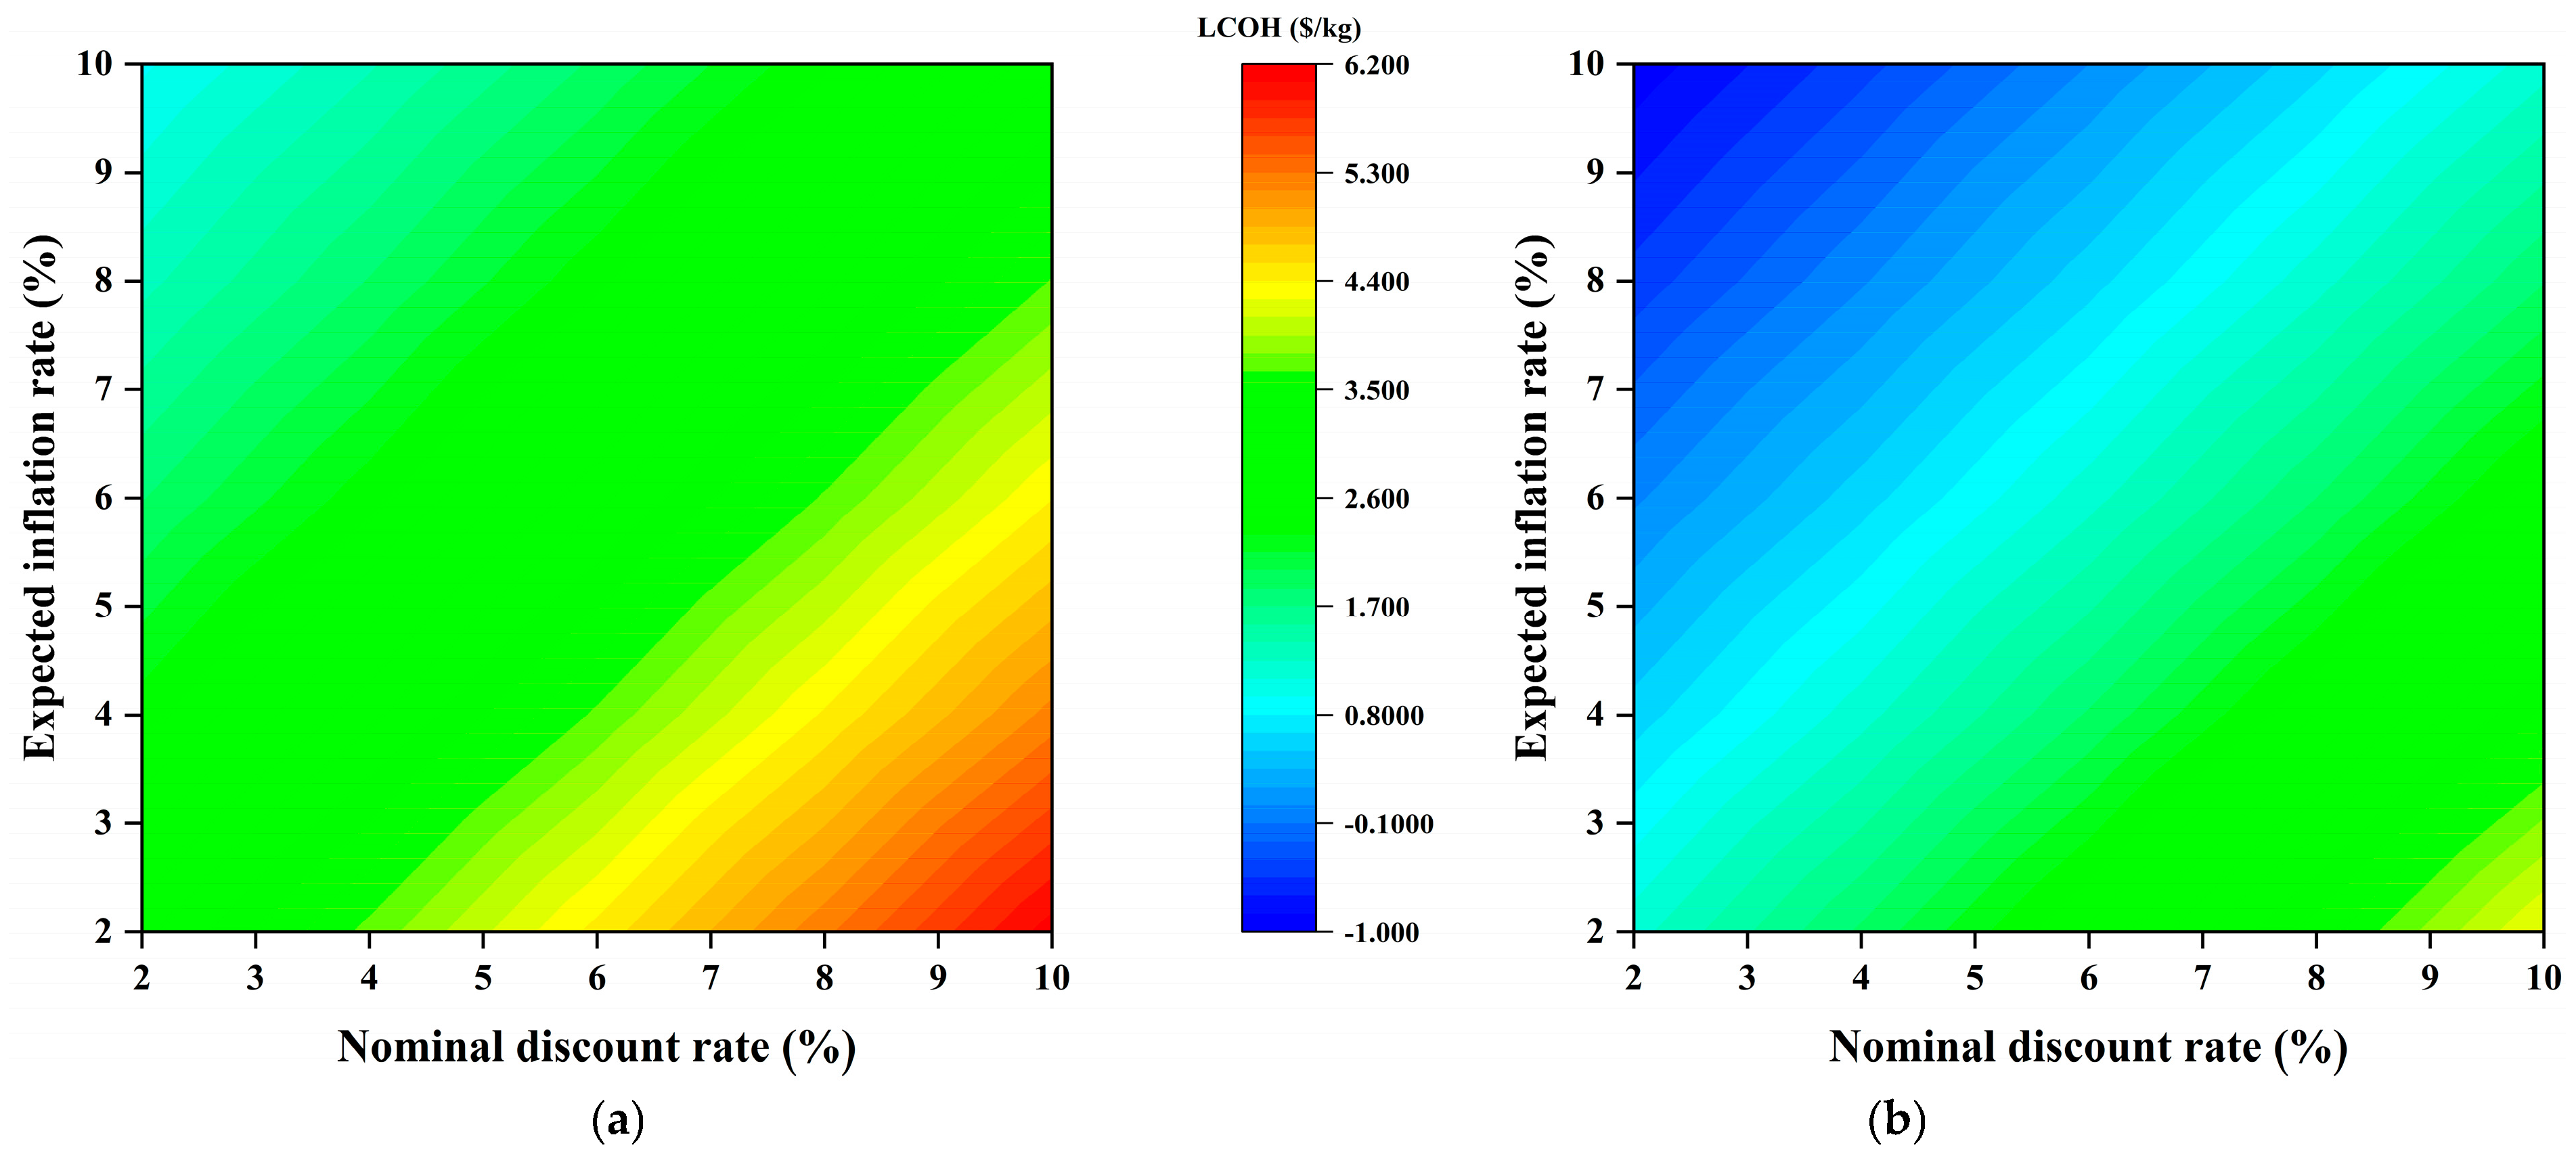
Figure 12 shows the effect of the inflation rate and discount rate on the system LCOH. It can be seen that the effect of both on the system LCOH is independent of whether they are on/off-grid. When the inflation rate decreases, LCOH decreases; when the discount rate decreases, LCOH increases. When the inflation rate is 10% and the discount rate is 2%, the minimum cost of producing hydrogen can be derived as USD 0.92 and −0.95/kg for systems (1) and (4), respectively. A negative value here indicates that every kilogram of hydrogen produced by the system is profitable for the system and reduces system operating costs. Therefore, the effect of the inflation rate and discount rate on the cost needs to be carefully examined when investing in the establishment of the scenario.
The above sensitivity analysis provides some data support for the adjustment of renewable energy incentives, and the elimination of diesel subsidies and the adjustment of renewable energy incentives need to be dynamically matched with the green hydrogen cost decline curve. The withdrawal of diesel subsidies should be implemented in phases (to avoid a sudden rise in energy prices), while at the same time redirecting part of the funds to infrastructure such as hydrogen refueling stations, and taking advantage of the diesel price increase window to accelerate hydrogen substitution in the transportation sector; renewable energy incentives also need to be shifted from installed capacity subsidies to technical performance pegging, and the carbon price should be used to internalize the environmental costs and compensate for the green hydrogen premium.
The results of the above study provide a supportive basis for the design of subsidy programs, hydrogen pricing mechanisms, and grid expansion planning in tourist cities: (i) Specifically, this study takes the projects supported by existing enterprises as case studies and identifies the areas with subsidy needs. For enterprises that support the development of green tourism in cities, they can further develop application scenarios by receiving relevant subsidies from the government, thus forming a virtuous cycle. (ii) This study analyzes and calculates the production cost in the process of hydrogen production, and summarizes similar studies to provide a cost benchmark for hydrogen energy pricing. (iii) By analyzing the techno-economics of the study system in off-grid and grid-connected modes, the amount of electricity interacting between the system and the grid is clarified, which provides data support for the scale of grid expansion.

6. Conclusions

This study focuses on modeling and simulating the wind–solar–hydrogen stand-alone and grid-connected systems in Lijiang City, Yunnan Province. The modeling is carried out using HOMER Pro software. The results are evaluated using an MCDM model, which helps identify the optimal energy configuration and relevant parameters for ensuring safe and reliable operation within specific economic constraints. Among the several systems explored, the component configuration scheme with the best economy and feasibility is the wind–solar–hydroelectric–hydrogen system coupled with fuel cells and batteries. The stand-alone system constructed based on the above scheme produces 10.15 × 10⁶ kWh/yr of electricity and 93.44 ton/yr of hydrogen, with an NPC of USD 8.15 million, an LCOE of USD 0.43/kWh, and an LCOH of USD 5.26/kg, and the grid-connected system produces 10.10 × 10⁶ kWh/yr of electricity and 103.01 ton/yr of hydrogen, with an NPC of USD 7.34 million, an LCOE of USD 0.11/kWh, and an LCOH of USD 3.42/kg.
The following was found through economic, technical, and sensitivity analysis: (1) (a) Among the various costs, initial cost accounts for the largest share of the total NPC, and the preliminary input is crucial to the operation of the system. (b) The direction of the current system’s subsequent optimization mainly lies in reducing the cost of photovoltaic panels and electrolyzer modules, improving their performance, and reducing the input–output ratio. (c) The income from oxygen sales is very considerable, and the specific way of combining it with the system can be explored for this item in the future. (2) The grid-connected system outperforms the off-grid system in all technical aspects, and the electrolyzer and hydrogen storage tank behaviors are effectively explained. In addition to this, the off-grid system in this study can produce 9.52 MWh of electricity per year, and the annual CO2 emission reduction of this system is calculated to be 1247.35 tons. (3) (a) The effects of the electrolyzer and system life on NPC are opposite and independent of the stand-alone and grid-connected structure; when the electrolyzer life increases, NPC decreases, and the effect of electrolyzer life is greater than that of system life. (b) The effects of the inflation rate and discount rate on the system LCOH also show opposite trends and have nothing to do with the on/off-grid structure: when the inflation rate decreases, the LCOH decreases, and when the discount rate decreases, the LCOH rises.
The above study establishes the feasibility of a wind–solar–hydrogen storage system for optimizing the renewable energy mix and improving energy efficiency. However, there are limitations in the following areas. This study is relatively shallow in terms of hydrogen applications, revenue from oxygen sales, and CO2 emission reductions and does not consider the impact of seasonal variations on system loads and potential policy/regulatory barriers. Relevant future studies could consider correlating community energy models with renewable energy systems and analyzing different policy scenarios from multiple perspectives. In addition, for other regions with similar natural conditions, this research method can also be used to optimize the capacity allocation of renewable energy systems after obtaining local renewable energy data, load demand data, system module parameters, and local policies.

Author Contributions

Methodology, X.Z., Y.H., D.L. and T.Z.; validation, Y.H. and R.X.; formal analysis, J.S. and G.W.; investigation, J.S.; data curation, Z.H., N.F. and J.S.; writing—original draft preparation, J.S.; writing—review and editing, X.Z.; visualization, R.X.; supervision, X.Z.; project administration, Z.H., G.W. and N.F. All authors have read and agreed to the published version of the manuscript.

Funding

This research was funded by the Yunnan Provincial Major Science and Technology Program (202202AG050017) and Yunnan Energy Investment Company of Three Gorges Group. And The APC was funded by the Yunnan Provincial Major Science and Technology Program (202202AG050017).

Conflicts of Interest

Authors Nanyu Fan, Zhanghua Hong, Guohua Wang and Yong Han were employed by the company China Three Gorges Corporation Yunnan Energy Investment Co., Ltd. The remaining authors declare that the research was conducted in the absence of any commercial or financial relationships that could be construed as a potential conflict of interest.

Abbreviations

AHPAnalytic Hierarchy Process
CSRCapacity Shortage Rate
EDASEvaluation based on Distance from Average Solution
EERExcess Electricity Rate
EPElectricity Production
GRAGrey Relational Analysis
HGHydrogen Generation
HOMER ProHybrid Optimization of Multiple Energy Resources
HRESsHybrid Renewable Energy Systems
LCOELevelized Cost of Energy
LCOHLevelized Cost of Hydrogen
NPCNet Present Cost
O&MOperation and Maintenance
PROMETHEEPreference Ranking Organization Method for Enrichment Evaluations
PVPhotovoltaic
TOPSISTechnique for Order Preference by Similarity to Ideal Solution
ULRUnmet Load Rate

References

  1. Krishna, K.S.; Kumar, K.S. A review on hybrid renewable energy systems. Renew. Sustain. Energy Rev. 2015, 52, 907–916. [Google Scholar] [CrossRef]
  2. Ang, T.Z.; Salem, M.; Kamarol, M.; Das, H.S.; Nazari, M.A.; Prabaharan, N. A comprehensive study of renewable energy sources: Classifications, challenges and suggestions. Energy Strategy Rev. 2022, 43, 100939. [Google Scholar] [CrossRef]
  3. Thirunavukkarasu, M.; Sawle, Y.; Lala, H. A comprehensive review on optimization of hybrid renewable energy systems using various optimization techniques. Renew. Sustain. Energy Rev. 2023, 176, 113192. [Google Scholar] [CrossRef]
  4. Basnet, S.; Deschinkel, K.; Le Moyne, L.; Cécile Péra, M. A review on recent standalone and grid integrated hybrid renewable energy systems: System optimization and energy management strategies. Renew. Energy Focus 2023, 46, 103–125. [Google Scholar] [CrossRef]
  5. Manoo, M.U.; Shaikh, F.; Kumar, L.; Arıcı, M. Comparative techno-economic analysis of various stand-alone and grid connected (solar/wind/fuel cell) renewable energy systems. Int. J. Hydrogen Energy 2024, 52, 397–414. [Google Scholar] [CrossRef]
  6. Agyekum, E.B.; Ampah, J.D.; Afrane, S.; Adebayo, T.S.; Agbozo, E. A 3E, hydrogen production, irrigation, and employment potential assessment of a hybrid energy system for tropical weather conditions—Combination of HOMER software, shannon entropy, and TOPSIS. Int. J. Hydrogen Energy 2022, 47, 31073–31097. [Google Scholar] [CrossRef]
  7. Chen, Q.; Gu, Y.; Tang, Z.; Wang, D.; Wu, Q. Optimal design and techno-economic assessment of low-carbon hydrogen supply pathways for a refueling station located in Shanghai. Energy 2021, 237, 121584. [Google Scholar] [CrossRef]
  8. Türkay, B.E.; Telli, A.Y. Economic analysis of standalone and grid connected hybrid energy systems. Renew. Energy 2011, 36, 1931–1943. [Google Scholar] [CrossRef]
  9. Abdin, Z.; Al Khafaf, N.; McGrath, B. Feasibility of hydrogen hybrid energy systems for sustainable on- and off-grid integration: An Australian REZs case study. Int. J. Hydrogen Energy 2024, 57, 1197–1207. [Google Scholar] [CrossRef]
  10. Shahzad, M.K.; Zahid, A.; ur Rashid, T.; Rehan, M.A.; Ali, M.; Ahmad, M. Techno-economic feasibility analysis of a solar-biomass off grid system for the electrification of remote rural areas in Pakistan using HOMER software. Renew. Energy 2017, 106, 264–273. [Google Scholar] [CrossRef]
  11. Miao, H.; Yu, Y.; Kharrazi, A.; Ma, T. Multi-criteria decision analysis for the planning of island microgrid system: A case study of Yongxing island, China. Energy 2023, 284, 129264. [Google Scholar] [CrossRef]
  12. Gonzalez, A.; Riba, J.-R.; Esteban, B.; Rius, A. Environmental and cost optimal design of a biomass–Wind–PV electricity generation system. Renew. Energy 2018, 126, 420–430. [Google Scholar] [CrossRef]
  13. Abdin, Z.; Mérida, W. Hybrid energy systems for off-grid power supply and hydrogen production based on renewable energy: A techno-economic analysis. Energy Convers. Manag. 2019, 196, 1068–1079. [Google Scholar] [CrossRef]
  14. HassanzadehFard, H.; Tooryan, F.; Collins, E.R.; Jin, S.; Ramezani, B. Design and optimum energy management of a hybrid renewable energy system based on efficient various hydrogen production. Int. J. Hydrogen Energy 2020, 45, 30113–30128. [Google Scholar] [CrossRef]
  15. Li, Y.; Liu, F.; Chen, K.; Liu, Y. Technical and economic analysis of a hybrid PV/wind energy system for hydrogen refueling stations. Energy 2024, 303, 131899. [Google Scholar] [CrossRef]
  16. Yue, M.; Lambert, H.; Pahon, E.; Roche, R.; Jemei, S.; Hissel, D. Hydrogen energy systems: A critical review of technologies, applications, trends and challenges. Renew. Sustain. Energy Rev. 2021, 146, 111180. [Google Scholar] [CrossRef]
  17. Ishaq, H.; Dincer, I.; Crawford, C. A review on hydrogen production and utilization: Challenges and opportunities. Int. J. Hydrogen Energy 2022, 47, 26238–26264. [Google Scholar] [CrossRef]
  18. Allakhverdiev, S.I. Artificial photosynthesis: Powering a green new deal for sustainable energy. Int. J. Hydrogen Energy 2024, 90, 199–209. [Google Scholar] [CrossRef]
  19. Bozieva, A.M.; Khasimov, M.K.; Voloshin, R.A.; Sinetova, M.A.; Kupriyanova, E.V.; Zharmukhamedov, S.K.; Dunikov, O.O.; Tsygankov, A.A.; Tomo, T.; Allakhverdiev, S.I. New cyanobacterial strains for biohydrogen production. Int. J. Hydrogen Energy 2023, 48, 7569–7581. [Google Scholar] [CrossRef]
  20. Kamshybayeva, G.K.; Kossalbayev, B.D.; Sadvakasova, A.K.; Bauenova, M.O.; Zayadan, B.K.; Bozieva, A.M.; Alharby, H.F.; Tomo, T.; Allakhverdiev, S.I. Screening and optimisation of hydrogen production by newly isolated nitrogen-fixing cyanobacterial strains. Int. J. Hydrogen Energy 2023, 48, 16649–16662. [Google Scholar] [CrossRef]
  21. Kamshybayeva, G.K.; Kossalbayev, B.D.; Sadvakasova, A.K.; Zayadan, B.K.; Bozieva, A.M.; Dunikov, D.; Alwasel, S.; Allakhverdiev, S.I. Strategies and economic feasibilities in cyanobacterial hydrogen production. Int. J. Hydrogen Energy 2022, 47, 29661–29684. [Google Scholar] [CrossRef]
  22. Kossalbayev, B.D.; Tomo, T.; Zayadan, B.K.; Sadvakasova, A.K.; Bolatkhan, K.; Alwasel, S.; Allakhverdiev, S.I. Determination of the potential of cyanobacterial strains for hydrogen production. Int. J. Hydrogen Energy 2020, 45, 2627–2639. [Google Scholar] [CrossRef]
  23. Kossalbayev, B.D.; Yilmaz, G.; Sadvakasova, A.K.; Zayadan, B.K.; Belkozhayev, A.M.; Kamshybayeva, G.K.; Sainova, G.A.; Bozieva, A.M.; Alharby, H.F.; Tomo, T.; et al. Biotechnological production of hydrogen: Design features of photobioreactors and improvement of conditions for cultivating cyanobacteria. Int. J. Hydrogen Energy 2024, 49, 413–432. [Google Scholar] [CrossRef]
  24. Irham, A.; Roslan, M.F.; Jern, K.P.; Hannan, M.A.; Mahlia, T.M.I. Hydrogen energy storage integrated grid: A bibliometric analysis for sustainable enrgy production. Int. J. Hydrogen Energy 2024, 63, 1044–1087. [Google Scholar] [CrossRef]
  25. Sdanghi, G.; Maranzana, G.; Celzard, A.; Fierro, V. Review of the current technologies and performances of hydrogen compression for stationary and automotive applications. Renew. Sustain. Energy Rev. 2019, 102, 150–170. [Google Scholar] [CrossRef]
  26. Ajanovic, A.; Haas, R. Prospects and impediments for hydrogen and fuel cell vehicles in the transport sector. Int. J. Hydrogen Energy 2021, 46, 10049–10058. [Google Scholar] [CrossRef]
  27. Moradi, R.; Growth, K.M. Hydrogen storage and delivery: Review of the state of the art technologies and risk and reliability analysis. Int. J. Hydrogen Energy 2019, 44, 12254–12269. [Google Scholar] [CrossRef]
  28. Gu, Y.; Chen, Q.; Xue, J.; Tang, Z.; Sun, Y.; Wu, Q. Comparative techno-economic study of solar energy integrated hydrogen supply pathways for hydrogen refueling stations in China. Energy Convers. Manag. 2020, 223, 113240. [Google Scholar] [CrossRef]
  29. Pareek, A.; Dom, R.; Gupta, J.; Chandran, J.; Adepu, V.; Borse, P.H. Insights into renewable hydrogen energy: Recent advances and prospects. Mater. Sci. Energy Technol. 2020, 3, 319–327. [Google Scholar] [CrossRef]
  30. Khan, T.; Yu, M.; Waseem, M. Review on recent optimization strategies for hybrid renewable energy system with hydrogen technologies: State of the art, trends and future directions. Int. J. Hydrogen Energy 2022, 47, 25155–25201. [Google Scholar] [CrossRef]
  31. Bahramara, S.; Moghaddam, M.P.; Haghifam, M.R. Optimal planning of hybrid renewable energy systems using HOMER: A review. Renew. Sustain. Energy Rev. 2016, 62, 609–620. [Google Scholar] [CrossRef]
  32. Emrani, A.; Berrada, A. A comprehensive review on techno-economic assessment of hybrid energy storage systems integrated with renewable energy. J. Energy Storage 2024, 84, 111010. [Google Scholar] [CrossRef]
  33. Upadhyay, S.; Sharma, M.P. A review on configurations, control and sizing methodologies of hybrid energy systems. Renew. Sustain. Energy Rev. 2014, 38, 47–63. [Google Scholar] [CrossRef]
  34. Connolly, D.; Lund, H.; Mathiesen, B.V.; Leahy, M. A review of computer tools for analysing the integration of renewable energy into various energy systems. Appl. Energy 2010, 87, 1059–1082. [Google Scholar] [CrossRef]
  35. Caliskan, A.; Percin, H.B. Techno-economic analysis of a campus-based hydrogen-producing hybrid system. Int. J. Hydrogen Energy 2024, 75, 428–437. [Google Scholar] [CrossRef]
  36. Tiar, B.; Fadlallah, S.O.; Benhadji Serradj, D.E.; Graham, P.; Aagela, H. Navigating Algeria towards a sustainable green hydrogen future to empower North Africa and Europe’s clean hydrogen transition. Int. J. Hydrogen Energy 2024, 61, 783–802. [Google Scholar] [CrossRef]
  37. Elomari, Y.; Mateu, C.; Marín-Genescà, M.; Boer, D. A data-driven framework for designing a renewable energy community based on the integration of machine learning model with life cycle assessment and life cycle cost parameters. Appl. Energy 2024, 358, 122619. [Google Scholar] [CrossRef]
  38. Zghaibeh, M.; Ben Belgacem, I.; Barhoumi, E.M.; Baloch, M.H.; Chauhdary, S.T.; Kumar, L.; Arıcı, M. Optimization of green hydrogen production in hydroelectric-photovoltaic grid connected power station. Int. J. Hydrogen Energy 2024, 52, 440–453. [Google Scholar] [CrossRef]
  39. Kumar, L.; Manoo, M.U.; Ahmed, J.; Arıcı, M.; Awad, M.M. Comparative techno-economic investigation of hybrid energy systems for sustainable energy solution. Int. J. Hydrogen Energy 2024, 104, 513–526. [Google Scholar] [CrossRef]
  40. Lai, Y.Y.; Yang, S.; Fan, L.W. Analysis and optimization of the performance of a solar PV/T system integrated with seasonal latent heat storage for decarbonized heating and hot water supply. Energy 2025, 331, 137069. [Google Scholar] [CrossRef]
  41. Yang, J.; Yang, Z.; Duan, Y. Capacity optimization and feasibility assessment of solar-wind hybrid renewable energy systems in China. J. Clean. Prod. 2022, 368, 133139. [Google Scholar] [CrossRef]
  42. Ampah, J.D.; Afrane, S.; Agyekum, E.B.; Adun, H.; Yusuf, A.A.; Bamisile, O. Electric vehicles development in Sub-Saharan Africa: Performance assessment of standalone renewable energy systems for hydrogen refuelling and electricity charging stations (HRECS). J. Clean. Prod. 2022, 376, 134238. [Google Scholar] [CrossRef]
  43. Hussam, W.K.; Barhoumi, E.M.; Abdul-Niby, M.; Sheard, G.J. Techno-economic analysis and optimization of hydrogen production from renewable hybrid energy systems: Shagaya renewable power plant-Kuwait. Int. J. Hydrogen Energy 2024, 58, 56–68. [Google Scholar] [CrossRef]
  44. province TdarcoY. Notice of the Yunnan Provincial Development and Reform Commission on Further Improving the Time-of-Use Electricity Pricing Policy. Available online: https://yndrc.yn.gov.cn/html/2023/qitawenjian_1115/13903.html (accessed on 2 April 2024).
  45. Network PES. 16 Provinces and Cities with Peak and Valley Price Differences of More Than ¥0.7!2024 Summary of Peak and Valley Electricity Prices Across the Country in April! Available online: https://news.bjx.com.cn/html/20240401/1369193-3.shtml (accessed on 2 April 2024).
  46. Hassan, Q.; Algburi, S.; Sameen, A.Z.; Salman, H.M.; Jaszczur, M. A review of hybrid renewable energy systems: Solar and wind-powered solutions: Challenges, opportunities, and policy implications. Results Eng. 2023, 20, 101621. [Google Scholar] [CrossRef]
  47. Okundamiya, M.S.; Wara, S.T.; Obakhena, H.I. Optimization and techno-economic analysis of a mixed power system for sustainable operation of cellular sites in 5G era. Int. J. Hydrogen Energy 2022, 47, 17351–17366. [Google Scholar] [CrossRef]
  48. Bhatt, A.; Ongsakul, W.; Madhu, M.N. Optimal techno-economic feasibility study of net-zero carbon emission microgrid integrating second-life battery energy storage system. Energy Convers. Manag. 2022, 266, 115825. [Google Scholar] [CrossRef]
  49. Maisanam, A.K.S.; Biswas, A.; Sharma, K.K. Integrated socio-environmental and techno-economic factors for designing and sizing of a sustainable hybrid renewable energy system. Energy Convers. Manag. 2021, 247, 114709. [Google Scholar] [CrossRef]
  50. Barhoumi, E.M.; Okonkwo, P.C.; Ben Belgacem, I.; Zghaibeh, M.; Tlili, I. Optimal sizing of photovoltaic systems based green hydrogen refueling stations case study Oman. Int. J. Hydrogen Energy 2022, 47, 31964–31973. [Google Scholar] [CrossRef]
  51. Li, C.; Ge, X.; Zheng, Y.; Xu, C.; Ren, Y.; Song, C.; Yang, C. Techno-economic feasibility study of autonomous hybrid wind/PV/battery power system for a household in Urumqi, China. Energy 2013, 55, 263–272. [Google Scholar] [CrossRef]
  52. Thakkar, N.; Paliwal, P. Data driven MCDM models for reliability-economic-environmental analysis of energy storage based autonomous micro-grid. J. Energy Storage 2024, 81, 110408. [Google Scholar] [CrossRef]
  53. Yazdani, M.; Torkayesh, A.E.; Santibanez-Gonzalez, E.D.; Otaghsara, S.K. Evaluation of renewable energy resources using integrated Shannon Entropy—EDAS model. Sustain. Oper. Comput. 2020, 1, 35–42. [Google Scholar] [CrossRef]
  54. Keshavarz Ghorabaee, M.; Zavadskas, E.K.; Olfat, L.; Turskis, Z. Multi-Criteria Inventory Classification Using a New Method of Evaluation Based on Distance from Average Solution (EDAS). Informatica 2015, 26, 435–451. [Google Scholar] [CrossRef]
  55. Torkayesh, A.E.; Deveci, M.; Karagoz, S.; Antucheviciene, J. A state-of-the-art survey of evaluation based on distance from average solution (EDAS): Developments and applications. Expert Syst. Appl. 2023, 221, 119724. [Google Scholar] [CrossRef]
  56. Kumar, N.; Karmakar, S. Techno-economic optimization of hydrogen generation through hybrid energy system: A step towards sustainable development. Int. J. Hydrogen Energy 2024, 55, 400–413. [Google Scholar] [CrossRef]
  57. Kandel, M.R.; Pan, U.N.; Dhakal, P.P.; Ghising, R.B.; Sidra, S.; Kim, D.H.; Kim, N.H.; Lee, J.H. Manganese-Doped Bimetallic (Co,Ni)2P Integrated CoP in N;S Co-Doped Carbon: Unveiling a Compatible Hybrid Electrocatalyst for Overall Water Splitting. Small 2024, 20, 2307241. [Google Scholar] [CrossRef]
Figure 1. Typical daily electricity and hydrogen load diagram in the study area.
Energies 18 04183 g001
Figure 2. Description of natural resources in study area. Monthly average (a) solar resource data, (b) wind speed, and (c) temperature.
Energies 18 04183 g002
Figure 3. System model diagram.
Energies 18 04183 g003
Figure 4. Framework of capacity optimization via HOMER Pro software.
Energies 18 04183 g004
Figure 5. Parameters of system economics and feasibility as assessment criteria.
Energies 18 04183 g005
Figure 6. Shannon Entropy-EDAS method decision flow chart.
Energies 18 04183 g006
Figure 7. Cost summary of proposed system: (a) off-grid and (b) on-grid.
Energies 18 04183 g007
Figure 8. Monthly power generation of each system: (a) off-grid and (b) on-grid.
Energies 18 04183 g008
Figure 9. Electrolyzer input power: (a) off-grid and (b) on-grid.
Energies 18 04183 g009
Figure 10. Tank levels for each system: (a) off-grid and (b) on-grid.
Energies 18 04183 g010
Figure 11. The effect of system lifetime and electrolyzer lifetime on NPC: (a) off-grid and (b) on-grid.
Energies 18 04183 g011
Figure 12. The effect of the inflation rate and discount rate on LCOH: (a) off-grid and (b) on-grid.
Energies 18 04183 g012
Table 1. Economic comparison of different hybrid systems using HOMER Pro software.
CountrySystem ComponentsNPCLCOELCOHReference
PakistanWind Turbine, PV, Fuel Cell, Hydrogen Tank, Electrolyzer, Battery, ConverterM USD 1.54–6.82USD 0.16/kWh–USD 0.37/kWh-[5]
GhanaPV, Hydrokinetic Turbine, PSIM, Converter, Electrolyzer, Hydrogen Tank, BatteryScenario I: M USD 0.51, scenario II: M USD 1.14Scenario I: USD 0.06/kWh, scenario II: 0.14/kWhScenario I: 4.47 USD/kg, scenario II: 9.81 USD/kg[6]
ChinaPV, Wind Turbine, Battery, Converter, Electrolyzer, Compressor, Hydrogen Tank, Liquefier, Liquid H2 Pump, Evaporator, Cooling, DispenserNo specific numerical specifications providedCNY 0.28/kWh, CNY 0.49/kWh, CNY 0.58/kWh, CNY 0.83/kWhNo specific numerical specifications provided[7]
AustraliaPV, Wind Turbine, Fuel Cell, Battery, Converter, Electrolyzer, Hydrogen Tank, CompressorOff-grid systems: M USD 19.6, M USD 20.1, M USD 21.2, M USD 20.7, M USD 23.5.
On-grid systems: M USD 6.86, M USD 6.77, M USD 7.33, M USD 6.95, M USD 8.25.
Off-grid systems: USD 0.32/kWh, USD 0.33/kWh, USD 0.34/kWh, USD 0.34/kWh, USD 0.38/kWh. On-grid systems: USD 0.033/kWh, USD 0.030/kWh, USD 0.032/kWh, USD 0.031/kWh, USD 0.034/kWh.Off-grid systems: USD 3.62/kg, USD 3.91/kg, USD 4.49/kg, USD 4.17/kg, USD 5.72/kg. On-grid systems: USD −17.5/kg, USD −19.3/kg, USD −19.8/kg, USD −19.3/kg, USD −20/kg.[9]
PakistanPV, Biogas-Fueled Generator, Battery, ConverterM PKR 4.48PKR 5.51/kWh-[10]
ChinaPV, Wind Turbine, Hydrokinetic Turbines, Diesel Generators, Power Grid, Battery, Converter, Electrolyzer, Hydrogen Tank, Thermal Load Controller, Boiler, Diesel ReformerM CNY 101.39 CNY 0.18/kWhCNY 51.83/kg[11]
TürkiyePV, Wind Turbine, Electrolyzer, Hydrogen Tank, Power Grid, ConverterM USD 7.67 USD 0.02/kWhNo specific numerical specifications provided[35]
Table 2. Electricity purchase and sale price.
TimeNotePurchase Price (USD/kWh)Sale Price (USD/kWh)
RushPeakShoulderOff-Peak
7:00–9:00 0.07
9:00–10:30 0.09 0.04
10:30–11:30Implemented in January, March, April, and December only.0.110.09
11:30–12:00 0.09
12:00–17:00 0.07
17:00–17:30 0.09
17:30–18:30Implemented in January, March, April, and December only.0.110.09
18:30–22:00 0.09
22:00–23:00 0.07
23:00–7:00 0.05
Rush tariffs are only implemented for a fixed period in January, March, April, and December, with the rest of the months being charged at peak hour prices for that period.
Table 3. Parameters of system components.
ComponentsParametersValueReferences
Wind turbine (LTW80)Capital cost (USD/kW)1200[7]
Replacement cost (USD/kW)1200
O&M cost (USD/y)24
Rated capacity (kW)800
Hub height (m)80
Cut-in wind speed (m/s)3
Cut-out wind speed (m/s)25
Life (y)20
Generic flat-plate PVCapital cost (USD/kW)400[5]
Replacement cost (USD/kW)400
O&M cost (USD/y)10
Rated capacity (kW)1
Efficiency20%
Life (y)25
Generic 1 kWh Li-ion batteryEfficiency90%[15]
Capital cost (USD/kW)450
Replacement cost (USD/kW)450
O&M cost (USD/y)10
Maximum capacity167
Nominal voltage6
Life (y)15
ConverterCapital cost (USD/kW)500[34]
Replacement cost (USD/kW)500
O&M cost (USD/y)0
Life (y)15
Generic electrolyzerModelAWE[7]
Efficiency85%
Capital cost (USD/kW)1000
Replacement cost (USD/kW)900
O&M cost (USD/y)10
Life (y)15
Efficiency (%)85
Generic fuel cellEfficiency50%[47]
Capital cost (USD/kW)2000
Replacement cost (USD/kW)2000
O&M cost (USD/op. hr)0.02
Life (h)50,000
Hydrogen storage tankCapital cost (USD/kW)600[42]
Replacement cost (USD/kW)600
O&M cost (USD/y)80
Life (y)25
GridMax exchange capacity (kW)1000[7]
Sell back pricesTable 1
Purchase pricesTable 1
Table 4. Capacity optimization results.
SystemGrid (kW)Wind Turbine (kW)Solar Panel
(kW)
Battery
(Li-Ion, kWh)
Fuel Cell
(kW)
Electrolyzer
(kW)
Hydrogen Tank
(kg)
Converter
(kW)
(1)-8005588421501600650303
(2)- 6042621501700750281
(3)-8005482 2001700750285
Table 5. Economic indicators of each system.
SystemNPC/106
(USD)
Initial Capital/106 (USD)O&M Cost/106 (USD)Replacement Cost/106 (USD)LCOE (USD/kWh)LCOH (USD/kg)
(1)8.155.631.711.140.435.26
(2)8.245.491.751.210.485.65
(3)8.505.751.811.360.516.01
Table 6. Technical indicators of each system.
SystemEP (kWh/yr)HG (ton/yr)EER (%)ULR (%)CSR(%)
(1)10.15 × 10693.4442.500.020.08
(2)9.68 × 10694.6743.100.040.09
(3)10.04 × 10695.4045.400.030.09
Table 7. Table of criteria weights and statistics (Shannon Entropy method).
NPCLCOEO&MLCOHEPEERHGULRCSR
Weight (%)8.52910.5018.9529.5976.48613.1198.8479.46524.504
Rank836492751
Table 8. Results and rankings were calculated using the Shannon Entropy-EDAS model.
Hybrid SystemPDANDAScoreRanking
(1)7.5042.0003.2521
(2)0.5603.695−0.6853
(3)2.6305.000−1.0672
Disclaimer/Publisher’s Note: The statements, opinions and data contained in all publications are solely those of the individual author(s) and contributor(s) and not of MDPI and/or the editor(s). MDPI and/or the editor(s) disclaim responsibility for any injury to people or property resulting from any ideas, methods, instructions or products referred to in the content.