Abstract
Contemporary research on electric buses focuses mainly on the following issues: energy efficiency, range and transport costs, and traction battery technology. However, little research has been conducted on operational reliability. This article presents a comparative assessment of the reliability of electric buses in relation to combustion engine buses. The research was conducted under real conditions in the city of Lublin, Poland. The reliability functions of buses and their structural components were determined based on the Weibull distribution. It was shown that electric buses have a shorter distance between failures than combustion engine buses of analogous capacity. The statistical significance of the differences in reliability between electric and combustion engine buses was verified. The suitability of the Weibull model as a model of bus reliability in comparative studies was verified. The results of the research can be used to monitor current sustainable public transport development programs and to improve bus diagnostic and maintenance systems in transport companies.
1. Introduction
The subject of the research described in this article is the reliability of electric buses in relation to internal combustion engine buses, in a public transportation system. In the field of urban public transportation, vehicle reliability is a key factor determining the quality of transportation services [1,2,3].
From the passengers’ point of view, the reliability of the transport service affects the guarantee of punctuality of travel [4,5,6,7]. In many cases, transit reliability is considered to be a more important factor than travel time or travel costs. The reliability of the vehicles themselves and the transportation infrastructure is of particular importance here. The reliability of vehicles also significantly affects the safety of passengers due to the specific conditions of urban traffic, which require high discipline of travel time in diverse and unpredictable traffic situations [8,9,10].
In a public transportation system, reliability is also a particularly important feature for the carrier [5,11], because if it is inadequate, it can significantly increase the company’s costs, and thus reduce its profitability. On the other hand, the high reliability of the vehicles allows the carrier to make better use of resources, as well as to improve management efficiency. Reducing the number of reliability threats also makes it possible to reduce the fleet of reserve vehicles [12].
Routine reliability testing of motor vehicles is undertaken both by manufacturers and by carriers that are users of the vehicles [13,14,15]. Tests performed by manufacturers are used to control the quality (qualification) of products or to improve their technology. They are mostly performed under standardized conditions, and sometimes under intensified loads.
On the other hand, the tests carried out by users are in the nature of monitoring the operational condition of vehicles and are carried out on a continuous basis, as part of the supervision of transits and technical maintenance of the fleet. The main result of the research on the reliability of vehicles during their service life is the determination of the current values of failure, repeatability and readiness rates of the fleet [16]. On this basis, an ongoing assessment of their past performance is made or their forecast is determined using probabilistic modeling methods: reliability [7] operational risk [10,17] and maintenance costs [12,18]. The genesis of the reliability studies described in this article may be found in the literature [19,20,21,22,23,24,25].
Literature Review
Ref. [19] presents a comparison of the reliability of public transport buses Jelcz M081MB and Volkswagen. The study described the operation of these vehicles over a period of one year. The authors compared the operational quality of vehicles on the basis of the distributed failures parameter and the average mileage between subsequent repairs. Classification of types of failures according to their frequency was proposed. A similar research method was used in ref. [21]. The study included an analysis of the time-to-failure of city buses under conditions in Kazakhstan. The chassis components most susceptible to failure and the physical causes of this failure were indicated. Refs. [20,22] describe the results of studies on the impact of fleet reliability on operating and investment costs in the urban public transportation system.
Ref. [24] presents the use of a three-state hidden semi-Markov model for reliability analysis. On the basis of the studies on the vehicle operation, the model was validated in terms of determining the probabilities of conditional interstate transitions for the embedded Markov chain, as well as the parameters of the distribution function over time. The Laplace transform was used to determine the reliability function, failure probability density function, failure intensity and expected time to failure. The readiness index was calculated based on ergodic probabilities.
In refs. [17,26], the aim was to compare the reliability of two brands of public transport buses Solaris Urbino 12 and Mercedes 628 Conecto L used in the city of Lublin. In the studies, the reliability function R(t) of the vehicle mileage between failures was determined. The vehicle as a whole and selected components (systems) were analyzed: engine, electrical system, pneumatic system, braking system, steering system, heating and air conditioning system. The Weibull distribution was used to model the reliability. It was found that under the conditions of the conducted tests, there are significant differences in reliability between bus brands and between the stages of their use. This article addresses the issue of continuation of this research with regard to electric buses.
Currently, the replacement of internal combustion to electric in automotive transportation is becoming more and more common [27]. This also applies to urban public transportation. In 2023, 500,000 urban electric buses were registered worldwide, with 12,000 in Europe, including 850 in Poland [28].
In urban conditions, the environmental and climate benefits of replacing combustion engines with electric ones are the most apparent. These benefits include reduced greenhouse gas emissions, lower operating costs due to the greater efficiency of electric engines, reduced air pollution and the increased use of renewable energy consumption [29,30].
Many aspects of the problem of electrification of public vehicle transportation have been described quite extensively in the literature. Among the publications in this area, the following topics are most often discussed:
Numbered lists can be added as follows:
- Rationalization of electromobility policy on a local and global scale [4,31].
- Total cost of ownership analysis [5,32,33,34].
- Reducing energy consumption and increasing the range of vehicles by optimizing driving cycles [31,34,35,36].
- Analysis of the actual operating costs of electric buses [5,30].
- Rationalization of infrastructure costs, including investment and operating costs for electric vehicle charging systems [37,38,39].
- Improvement of public transportation services using electric vehicles [22,40].
- Development of technologies and methods of technical maintenance of electric vehicles, including diagnostics and charging of traction batteries [41,42].
An analysis of the literature shows that among the many factors characterizing the topic of electromobility in the field of public transportation, the issue of vehicle reliability is of great importance. There are a number of works that can be distinguished on this topic [38,43,44,45].
In ref. [43], the conditions for cyclical diagnostics of EV buses and trolleybuses were defined, depending on the intensity of failures and the given probability of failure-free operation. The dissimilarity of reliability models of mechanical and electrical systems was emphasized. It was found that in the case of bus electrical modules, the probability of their failure-free operation decreases with the increase in the number of previous failures. A method for correcting the inter-repair time of the electrical equipment of the studied buses and trolleybuses was proposed.
The authors of [19] proposed a method of technical and economic assessment of the reliability of electric buses and trolleybuses, which allows to determine the current values of reliability parameters and forecasts. Empirical studies have shown that increasing fleet reliability can lead to reduced operating costs and capital expenditures. The conducted experiments confirmed that the level of reliability of structural elements allows for reducing number of bus failures by 14%.
Ref. [38] examined the reliability of the integrated transportation and electric power system. A two-way strategy for controlling the charging process of electric vehicles was presented. A simplified model of the transportation system was developed, whose high performance allows the reliability of to be assessed with acceptable accuracy.
The application methods to assess reliability and safety in urban electrical substations has been presented in [44]. An indicator assessing the risk of service discontinuity was proposed. The results showed that the proposed method is useful for quantitative description of the system.
Ref. [45] concerns a comparative assessment of the readiness of electric buses in relation to internal combustion engine buses. The readiness of electric buses was studied in a sample of 18 vehicles and the readiness of internal combustion buses, respectively. Readiness indicators were compared using the variance analysis method. It was shown that electric buses had a higher level of readiness and no trend in the studied period of operation.
When summing up the review of the literature in terms of in-service tests of electric cars, it can be stated that most of the studies to date concern issues of energy consumption and range, operating costs and investment costs, development of traction battery technology and charging systems. On the other hand, less attention is paid to the issues of operational reliability of vehicles and the related operational risks. The examples of experimental observations in this regard presented so far in the literature are very rare.
This article describes the research on the reliability of electric buses that the authors undertook, using the method of comparing them to buses with an internal combustion drive. The purpose of the study was to develop and verify the effectiveness of a comparative method for assessing the reliability of electric buses in relation to those with internal combustion engines.
The average mileage (distance) between failures of vehicles of both types and their structural components (systems), respectively, was chosen as an indicator of reliability. On the basis of the literature [16,43,46], it was assumed that the in-service mileage of a vehicle between failures is determined on the basis of the time of proper operation or the time of being in the state of fitness for use, which was recorded by the operator as the period between two successive states of unfitness of the vehicle. Hence, this article assumes that the average vehicle mileage Lave corresponds to the value of the mean time between failures (MTBF).
The research described in this article is a continuation of the studies presented in the paper [17]. The results presented here are taken as a case study, on the example of public transport in Lublin, Poland. Lublin is a medium-sized city (with approx. 330,000 inhabitants) and the capital of the province. Currently, the Municipal Transport Company in Lublin has a total of 376 vehicles. These include 215 internal combustion engine buses, 40 electric buses and 100 trolleybuses. The electric buses were put into service in 2021. The structure of the fleet of the Municipal Transport Company in Lublin is shown in Figure 1. The company’s development program provides for a further increase in the fleet of electric buses. This also applies to a compatible program for the expansion of the traction battery charging infrastructure.
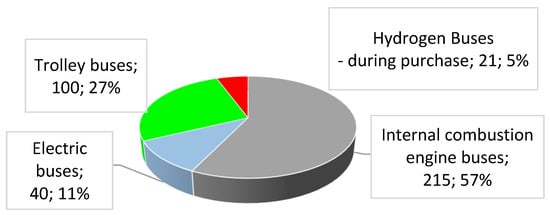
Figure 1.
Structure of vehicle fleet at Municipal Transport Company in Lublin.
2. Subjects and Conditions of the Study
The subjects of the study were Solaris Urbino 12 electric buses. The reference sample was marked as E12. New vehicles from the period between 2021 and 2024 were studied. The results of tests of Solaris Urbino 12 internal combustion engine buses of comparable design and transport capacity published in works [17,26] were used as reference data. The reference sample was marked as S12.
The tests covered a period of 36 months of bus operation. The number of failures and the mileage between damages were monitored. During the operation of both types of vehicles, travel routes, driving cycles, maintenance conditions and management staff were comparable. The sample of electric buses (research sample) consisted of 32 units, while the sample of internal combustion engine buses (reference sample) consisted of 20 units. The technical characteristics of the tested buses are shown in Table 1.

Table 1.
Technical and operational indicators of tested electric and internal combustion buses.
The studies were carried out under standard operating conditions used in the public transportation company in Lublin. The average value of the total observed mileage of buses was 174,960 km, while in the case of internal combustion engine buses it was 219,168 km. The average daily mileage of electric vehicles was 238 km, and 251 km for internal combustion engine buses. Correspondingly, the average monthly mileage was 4860 km, and 6088 km for internal combustion engine buses.
The communication lines were operated in a two-shift, all-day mode of operation or only during peak periods. In addition to the full manning of all communication lines, a certain number of buses remained at the depot in standby as reserve vehicles. The failures caused or revealed during the travel was a signal for the driver to stop transport work and the bus to go to the depot. Each repair was performed, depending on the time of bus return, either immediately or starting with the next mechanics’ shift [26,45]. The source database consisted of internal company vehicle damage reports. These reports contained a register of the operating conditions of each vehicle divided into subsequent days of each month.
The following structural systems were distinguished in the research sample (electric buses): traction batteries (TB), battery cooling system (BCS), battery charging system (ChS), high voltage system (HVS), electrical system (ES), doors (DS), breaking system (BS), heating and air conditioning (HAC).
Traction batteries (TB): The most commonly used are lithium-ion batteries with high energy density, which are characterized by significant durability and resistance to aging under intensive charging and discharging conditions. The average capacity of the traction batteries is between 120 kWh and 400 kWh, which allows them to cover a distance of 65 to 300 km on a single charge. These systems are optimized to ensure energy stability under harsh operating conditions. Operating temperature control and a battery management system (BMS) help with maintaining high energy efficiency, improving reliability and minimizing operating costs.
The tested buses are equipped with LTO-type lithium-ion batteries in a 200 s configuration. Their rated capacity is 120 kWh, and their usable capacity is limited to 80% of the rated capacity and is equal to 96 kWh. Traction batteries in electric buses are characterized by a significant complexity of mechanical, electrical and thermal parameters. Each cell is monitored by the BMS in terms of temperature and electrical voltage measurements. The experience of the Lublin Municipal Transportation Company shows that the most fail-safe components of the traction battery system are the electrical connections and microprocessor components. Due to unforeseen circumstances that may arise during the charging of the bus battery, such as an interruption in communication between the bus and the charger or a break in the galvanic connection of the current collector–charger contact, contactors installed on both terminals of the traction battery also suffer frequent failures.
The cooling system (BCS) uses circulating pumps and heat exchangers to ensure that the batteries are at the optimal operating temperature (typically between 25 and 35 °C). This affects the longevity of the batteries and the maintenance of stable energy capacity. In addition, the cooling system minimizes the risk of overheating and increases the safety of the bus.
In the tested buses, a liquid cooling and heating system is used to maintain the temperature of the traction batteries. The cooling and heating agent of the cells is glycol, the temperature of which is regulated by heat exchangers. The heating element is electric heaters, while cooling is carried out by the air conditioning system, in which the working medium is the R 407 gas. The entire system is characterized by high reliability, and its failures are mainly related to gas losses in the cooling system and defects of the glycol circulation pump.
The battery charging system (ChS) for electric buses relies on charging technologies which include both wired charging and charging with a current collecting device. The charging stations enable fast charging at high power, ranging from 50 kW to 450 kW, which reduces the time needed to fully charge the vehicle to just 1–2 h. The charging system is equipped with advanced protection systems that monitor current and voltage parameters to ensure a safe charging process and minimize the risk of battery damage. The integrated charge management system optimizes charging cycles to extend battery life and ensure maximum vehicle availability in service.
The charging process for electric buses in the Municipal Transport Company in Lublin is tailored to local conditions. The buses have a relatively short range of 70 km, but thanks to the recognition and appropriate use of battery technologies along with the appropriate charging infrastructure, these are buses which can maintain the continuity of transport tasks, in accordance with regular timetables.
Charging stations with two or four charging points with a rated power of 450 kW each were installed at the eight main terminal stops. The length of the bus route between subsequent charging sessions, on a full-day schedule, does not exceed 40 km and energy consumption is 43 kWh. Thus, the charging time at the maximum discharge does not exceed 6 min and corresponds to the schedule breaks at the terminal stops for both electric and internal combustion buses. The buses use current collectors, and their special design allows the bus to be immediately connected for charging.
The system also provided chargers installed at the depot with a rated power of 40 kW per charging point available simultaneously for each bus. Each charger has two stations and when connected to one bus, it provides power of 80 kW per point. Such a system is designed to meet the assumptions of charging the bus within three hours, so that the bus leaving the route at 0:00 a.m., after performing maintenance activities related to its preparation for running on the next day, is ready to leave at 4:00 a.m. in order to provide communication services. Chargers installed in the depot are also used to charge buses dispatched on a given day to perform tasks on peak schedules.
The most common failures of the battery charging system are related to mechanical failures of the current collector and the Combo 2 plug-in connector. There are also often problems related to effective communication between the bus and the charger. The reliability of the charging process is also negatively affected by the weakening of the electrical insulation of the bus.
The high-voltage system (HVS) distributes high-voltage electrical energy from the traction batteries and directed to the main components of the vehicle (powertrain and auxiliary systems). A characteristic feature of the system is the use of electrical cables with appropriate insulation and protective elements that minimize the risk of failure and guarantee high reliability of energy transmission. Typical operating voltages range from 600 V to 800 V, allowing the system to operate efficiently with minimal energy losses. System protections include emergency shutdowns and insulation modules to ensure safe operation in the event of unforeseen external disturbances.
The high-voltage system includes all devices and parts of the electrical system where dangerous voltage may occur, i.e., above 30 V AC or 50 V DC. In the analyzed case, a continuous insulation resistance measurement system of the bus’s high-voltage system was installed in all buses. In addition to the traction batteries and the powertrain, the HVS also includes wiring, a number of converters and auxiliary equipment such as the hydraulic system’s power-assisted motor, the motors driving the air compressor and the compressors of the cooling systems, switchgears and contactors, and the protections of these systems.
The most common faults of a high-voltage system include failures of contactors switching on auxiliary devices. There is also weakening of insulation associated with abrasion of the wires. It is also of great importance to keep the braking resistor in adequate technical condition, so that it provides insulation parameters at the required level also in adverse weather conditions.
The electrical system includes the bus’s on-board system with on-board batteries. It includes: wiring of this system, on-board computer of the vehicle with multiplexers, passenger information system, electrical components of all passenger service systems, push buttons, sensors, exterior and interior lighting of the bus, etc.
Currently, the public transport buses have a number of systems operating in the background, even when the bus is switched off, and thus the on-board batteries are undercharged during this time. In this case, when the bus is parked at the depot for an extended period of time, the on-board batteries are discharged to a state that makes it impossible to start the bus. This is the cause of the most common failures of the electrical system leading to its unfitness.
The door system in an electric bus consists of an electric drive, sensors and a control system. The door drive is carried out by electric motors, which enable precise control of speed and position of the door. The system is equipped with optical and mechanical sensors that detect the presence of obstacles, preventing them from being blocked or damaged. Doors are most often made of lightweight composite materials, and their design minimizes weight and allows passengers to get in or out of the vehicle quickly. The door system control is integrated into the vehicle management system, which enables the doors to be opened and closed automatically at stops and in emergency situations. The most common door system failures occur during difficult weather conditions. Freezing slush in the door movement area and freezing gaskets are reasons for the door not closing, which is signaled as a failure by the control system.
The braking system combines an electrodynamic brake and a hydraulic braking system. The electrodynamic brake uses an electric motor to generate braking torque while recovering kinetic energy and transferring it to the battery. If the braking force needs to be increased, the hydraulic braking system, equipped with ABS (Anti-lock Braking System) and ESP (Electronic Stability Program), is activated. The braking system is managed by the electronic control unit, which optimizes the distribution of the braking force between the axles, ensuring stability and safety.
Among the most common braking system failures are problems in the area of brake calipers. These include failures of wheel speed sensors, brake pad wear sensors, blocking of brake lining slack adjusters and moisture inside the calipers caused by leaking brake cylinders.
The HVAC (heating, ventilation, and air conditioning) system in an electric bus consists of electric heaters and heat pumps and a control system. Heat pumps enable the recovery of heat energy from the environment, which increases the efficiency of the system. HVAC system control is based on algorithms that take into account external parameters such as temperature and humidity and user preferences. In addition, the system can be equipped with HEPA (High-Efficiency Particulate Air) filters that ensure high air quality inside the vehicle.
In the analyzed example, the buses are equipped with a 24 kW electric boiler as a heat source for the heating system in the form of forced-air radiators, convector heaters and an air-conditioning system with a heating function. The air conditioning system consists of separate systems for the passenger compartment and the driver’s cabin. These systems are controlled automatically in a way in which the driver sets the temperature level and the controller automatically selects the intensity and temperature of the air flow in order to achieve the set parameters.
The most common failures of the heating and air conditioning system occur as a result of a leak in the system with a gas refrigerant. Failures of heater fans and rooftop air conditioning units are also common.
3. Test Method
The reliability indicators of electric buses and their structural systems described in Section 2 were analyzed.
It was assumed that the identification of probabilistic characteristics of failures and their causes can be the basis for engineering reliability assessment, including the identification of the most unreliable elements (weak links) [19,21,43]. The mileage between the T damages was taken as a reliability indicator.
Descriptive statistics of the random variable T were calculated, in particular: mean mileage value, a median, a maximum and a minimum value in the sample, standard deviation and the coefficient of variation [46].
Using the 2-parameter Weibull distribution as a model for the probability distribution of failure, the reliability function of the bus as a whole and the reliability functions of the structural systems were determined, as expressed in Equation (1).
The parameters of the Weibull distribution were estimated using the maximum likelihood method
where
R(t)—reliability function
t—generalized time between failures (repair interval)
c—Weibull distribution shape parameter
b—Weibull distribution scale parameter
The justification for the choice of the Weibull distribution as a reliability model was the examples described in the literature indicating the desirability of such a solution in the case of sudden and unpredictable failures, such as damage to electrical systems and fatigue damage to mechanical elements [25,26,47].
According to the Weibull model, the shape parameter “c” determines the behavior of failure probability over time. In particular:
- for c < 1, the damage intensity decreases as a function of time. This suggests that some copies of the tested vehicles may have manufacturing defects, which results in their gradual removal from the population.
- for c = 1, the intensity of the failures is constant and the reliability model takes a form analogous to the exponential distribution.
- for c > 1, the intensity of failure increases over time. In this case, it is assumed that the main cause of failure is the physical wear and tear of the object.
The scale parameter “b” determines the time after which 63.2% of the population will fail. This is known as the characteristic survival value [48].
To check the statistical significance of the differences in the average reliability values of the E12 electric buses and the S12 internal combustion buses, the non-parametric tests analysis was used. The computer package used was STATISTICA 13. The data independence and data measurability were considered to be met due to the scope and method of the research performed. The normality of the distribution of results, was checked using the Shapiro–Wilk test. On the basis of an unsatisfactory level of significance, i.e., p < 0.05, the hypothesis of normality of the distribution was rejected. Therefore, the non-parametric Kruskal–Wallis rank-sum test and the median test were used. Due to the lack of consistency of the results of both above-mentioned tests, a two-sided comparison test was carried out during the next stage.
With regard to both vehicle brands E12 and S12, the empirical data were treated as random samples constituting the basis for estimating the average mileage between failures and for verifying the null hypothesis HE,S, according to which there are no significant differences in the average mileage between the brands of vehicles marked with the symbol E12 and S12.
The null hypothesis was written as:
where
HE,S: E(TE12) = E(TS12),
- E(TE12) is the mean time between failures (MTBF) for electric buses.
- E(TS12) is the mean time between failures (MTBF) for internal combustion engine buses.
4. Test Results
The reliability indicators of the bus as a whole and the reliability indicators of its structural systems were determined. The scope of the study included: traction battery system (TB), battery cooling system (BCS), battery charging system (ChS), high voltage system (HVS), electrical system (ES), door system (DS), braking system (BS), heating and air conditioning system (HAC). The mileage between failures Ts was controlled as an indicator of reliability of the systems. The statistical distributions of the random variable Ts were determined. Using the Weibull distribution, experimental data were approximated and a model of bus reliability was determined, including the vehicle as a whole and the above-mentioned structural systems.
In this part of the article, the abbreviated nomenclature of the tested types (samples) of vehicles is introduced. It is assumed that electric buses (Solaris brand) are marked with the E12 symbol, while internal combustion buses (Solaris brand) are marked with the S12 symbol.
4.1. Reliability Characteristics of the Bus as a Whole
4.1.1. Descriptive Statistics and Weibull Model of Bus Reliability
The basic descriptive statistics characterizing the time between failures are presented in Table 2. Mean values, median values, maximum and minimum values, and standard error values for the E12 and S12 vehicle tests were given. As can be seen from the table, for E12 buses the average mileage between failures was 1714.3 km, while the average value for the S12 sample was 2029.3 km. The median values also vary significantly and are 944 km for E12 buses compared to 1580.7 km for S12 buses. The larger electric-bus fault database (3 747 failures) increases the sensitivity of reliability estimates for that group.
Table 2.
Descriptive statistics of mileage between failures of S12 and E12 buses in a 36-month period of use.
The large values of the standard deviation are noteworthy: 2166.5 km for the E12 buses and 1714.6 km for the S12 buses, which indicates a large variation in the mileage between the damages of individual vehicles within the tested samples, both in the S12 (V(S) = 84%) and E12 (V(E) = 126%) buses.
The next step in the analysis was to determine the parameters of the Weibull distribution describing the empirical distribution of mileage between failures. Table 3 shows the calculated values of the shape parameters c and the scale parameters b for the E12 electric buses, as well as the corresponding reference data for the S12 internal combustion buses. On this basis, using Equation (1), the reliability function R(t) of both types of vehicles was determined (Figure 2).
Table 3.
Weibull model parameters for the E12 electric and S12 internal combustion buses.
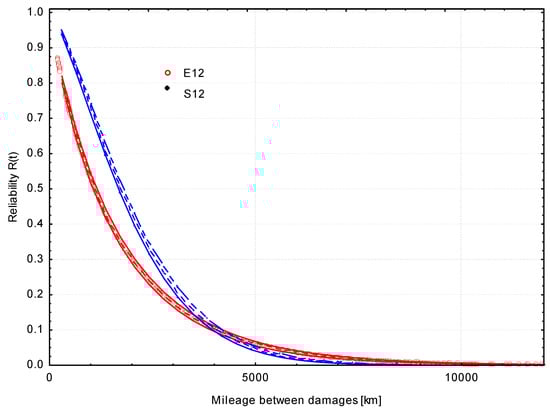
Figure 2.
Diagrams of reliability functions of S12 and E12 buses.
For electric buses as a whole, the reliability level of R*(t) = 0.5 is achieved after the mileage TR50(E) = 1095 km, whereas reliability R*(t) = 0.8 after the mileage TR80(E) = 378 km. In the case of S12 internal combustion buses, the reliability R*(t) = 0.5 is achieved after a mileage of TR50(S) = 1738 km, while R*(t) = 0.8 is achieved after a mileage of TR80(S) = 777 km.
Tests have shown that for the E12 brand, the shape parameter is slightly less than unity, c = 0.92254. Thus, the failures are generally random with a gradually decreasing proportion of running-in of moving mechanical parts. They may also include hidden manufacturing defects. However, in the case of the S12 brand, it was found that the shape parameter meets the inequality c > 1, which may indicate the impact of damage caused by wear and tear of mechanical parts. The study also showed that the scale parameter b, indicating the characteristic mileage-to-failure value for 63.2% of the population, is about 27% lower for the E12 buses than for the S12 (Table 3).
Probably the main reason for this difference is the dissimilarity of the physical processes of damage of electrical (electronic) components and mechanical components, especially those subject to tribological wear. This is evidenced by many results of experimental studies in this area [13,21,26]. The in-service failures to mechanical systems result from the accumulating phenomena of fatigue, corrosion and friction of structural components. On the other hand, damage to electrical systems results from changes in the structure of the material occurring under the influence of cyclic interruptions and changes in the flow of electric current [13,43].
4.1.2. Evaluation of the Statistical Consistency of Bus Reliability Characteristics
The reliability of the E12 electric and the S12 internal combustion buses was compared using the non-parametric tests and using the computer software package STATISTICA 13.
The null hypothesis described by Equation (2) was verified. In the conducted test, the qualifying factors were the “make of the vehicle”, while the dependent (explained) variable was the average mileage of the vehicle between failures.
The condition of normality of the distribution of results in the analyzed bus groups was checked using the Shapiro–Wilk test (Figure 3). In both vehicle brands, a satisfactory level of significance was not found, p ≤ 0.05. On this basis, the hypothesis of normality of distribution was rejected.
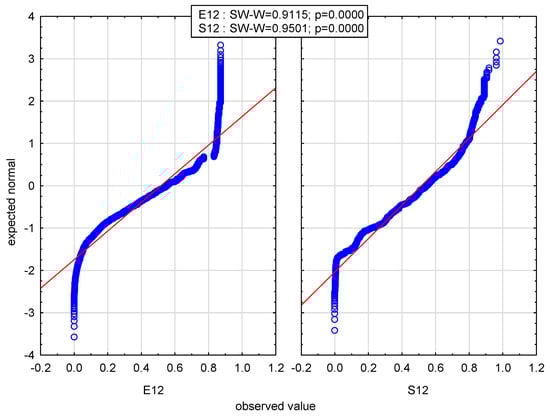
Figure 3.
Categorized charts of normality of dependent variable—reliability for “type of vehicle” factor.
It was decided to use a non-parametric Kruskal–Wallis test and a median test. Test results are shown in Table 4 and Table 5.
Table 4.
Results of Kruskal–Wallis rank-sum test of dependent variable—reliability for “type of vehicle” factor—during the 36 months of use of E12 and S12 vehicles.
Table 5.
Results of median test of dependent variable—reliability for “type of vehicle” factor—during 36 months of use of E12 and S12 vehicles.
The significance level calculated by the Kruskal–Wallis test is p = 0.0248, which is less than 0.05 (Table 4). This provides a basis for rejecting the null hypothesis, and therefore the type of bus drive significantly differentiates its reliability. The opposite conclusion is drawn from the median test, which shows that the E12 and S12 buses do not differ in terms of reliability. The median reliability over the entire period analyzed is 0.5485 for both bus brands (Table 5), and the value p = 0.6024 indicates that there is no basis for rejecting the null hypothesis of equal reliability of the two types of buses.
Due to the different results of the Kruskal–Wallis test and the median test, Scheffé’s post hoc test was used to specify the differences detected by the Kruskal–Wallis and median non-parametric tests. The results of the previous analysis do not indicate that all of the analyzed groups are different. To identify which type of vehicle is more reliable, multiple comparisons were used, the results of which are presented in Table 6.
Table 6.
Results of calculations of probability p for comparisons of two types of buses.
Based on Table 6, it can be concluded that electric buses have a higher average rank value than internal combustion buses and the p probabilities of the compared vehicles are statistically significant p = 0.02835. In order to illustrate the comparison of electric and internal combustion buses, Figure 4 shows the box plot of the (estimated) reliability indicators from the E12 and S12 sample.
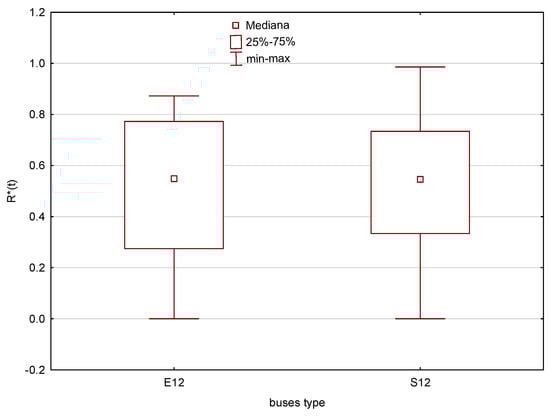
Figure 4.
Box plot for compared vehicle groups.
The results of the tests described in this article: Table 2, Table 3 and Table 6 and Figure 2 show that electric buses are characterized by a lower mileage between failures than classic internal combustion buses with comparable transport capacity. The numerical differences are:
- For the average value of the mileage in the sample,
- For the parameter b of the Weibull model,
- For the set reliability: R*(t) = 0.5,
- For the set reliability: R*(t) = 0.8,
Similar observations were also presented by other authors. Malozymov et al. 2023 [43] emphasize that the design of an electric bus relative to an internal combustion bus has more components, resulting in the need for more frequent repairs. However, these repairs are less labor-intensive because they generally involve the rapid replacement of entire structural modules. According to ref. [45], the average effective repair time for damage to electric buses was 1.95 h while according to ref. [13], the average repair time for comparable internal combustion engine buses under similar public transportation conditions was 6.4 h.
4.2. Reliability Characteristics of Structural Systems
4.2.1. Descriptive Statistics and Parameters of the Weibull Model
The mileages between successive failures of selected structural systems were analyzed. The primary criterion for selecting these systems was the predicted failure rate. The selection took into account data from the literature [13,26,43] and the experience of employees of the Municipal Transport Company as experts.
Eight structural systems were distinguished, which were considered to be the most characteristic for showing the different frequency of failure to components of electric and internal combustion buses. It was assumed that damage to any component in the system under consideration is equivalent to damage to the entire vehicle.
Table 7 shows descriptive statistics of the mileage between failures for the selected E12 electric bus systems over 36 months of use. The data includes: mean values, standard deviation, maximum values and the number of failures.
Table 7.
Descriptive statistics of inter-repair mileage of selected structural systems in E12 buses, during 36 months of operation.
In the case of the traction battery (TB) system, the average mileage between the failures was 2172 km. However, a large standard deviation of 8163 km indicates an extraordinary diversity of data in the tested sample of E12 buses.
The electrical system was characterized by an average inter-repair mileage of 1438 km, with a standard deviation of 2130 km. The heating and air conditioning system had the highest non-failure rate, and the average interval mileage was 1670 km with a standard deviation of 2052 km.
In the case of the charging system (ChS), an average mileage of 1449 km was found, and the maximum value reached 12,096 km. This system was characterized by moderate reliability, but the high number of failures (506 cases) indicates the need for a more detailed analysis. Large differences in average mileage and high dispersion of data indicate a wide variation in reliability levels. The group of BCS and ChS high-failure systems requires more attention in terms of fault diagnosis. Table 8 shows the results of Weibull model parameter calculations for the inter-repair mileage of E12 bus structural systems. The relevant data for the S12 buses are shown in Table 9 [26].
Table 8.
Parameters of Weibull model of reliability of structural systems of E12 electric buses during 36 months of operation.
Table 9.
Parameters of Weibull model of reliability of structural systems of S12 electric buses during 36 months of operation [26].
The most distinguished in the summary of the parameters of the Weibull model in the reliability of electric vehicles (Table 8) are the low values of the scale parameter b for: the traction battery system b(TB) = 15,957 km, the charging system b(ChS) = 16,424 km and the door system b (DS) = 14,154 km. In the case of the reference sample of internal combustion vehicles (Table 9), the lowest values of the scale parameter were obtained for the electrical system b(ES) = 10,895 km, for the engine b(EnS) = 22,878 km and for the door system b(DS) = 23,713 km. It is noteworthy that there is a large difference in the b(DS) parameter between the E12 and S12 samples—a decrease of 40%. This is probably due to differences in the design of the control system in the door system and requires a separate engineering analysis.
When analyzing the data in Table 8 and Table 9, it is also important to consider the range of values of the shape parameter c, which characterizes the dynamics of changes in the frequency of failures as a function of the vehicle use time. In the case of electric buses (Table 8), the shape parameter of the considered systems is in the range of cE = (0.85587; 0.91119) while in the group of internal combustion buses cS = (0.75355; 1.1043). The range of values of the parameter cE is therefore more limited and closer to unity than the interval of the parameter cS This allows for assuming that the reliability of the structural systems of electric buses is more standardized, and failures are caused by random external events, while in internal combustion buses the influence of physical running-in of moving parts (PS, DS) or the influence of cumulative wear and tear on parts (HAC, PS) are included.
Based on the results of electric bus testing, three characteristic failure patterns can be distinguished, differing in the degree of influence of random factors and, therefore, predictability. The first group consists of failures resulting from progressive mechanical wear (e.g., door systems) or physical and chemical degradation (e.g., traction batteries). The second group consists of random failures of electronic and electrical components (e.g., electrical system components, high-voltage system components). The third group consists of failures with a mixed impact of random and deterministic factors (e.g., charging system).
4.2.2. Functional Characteristics of Reliability of Structural Systems
Figure 5, Figure 6, Figure 7, Figure 8, Figure 9, Figure 10, Figure 11 and Figure 12 present diagrams of reliability functions of selected electric bus systems. Confidence intervals of 95% are also marked. Based on the characteristics shown in Figure 5, Figure 6, Figure 7, Figure 8, Figure 9, Figure 10, Figure 11 and Figure 12, the values of the inter-failure (inter-repair) mileage corresponding to the preset reliability of the systems R*(t) = 0.8 and R*(t) = 0.5 are compiled in the table (Table 10).
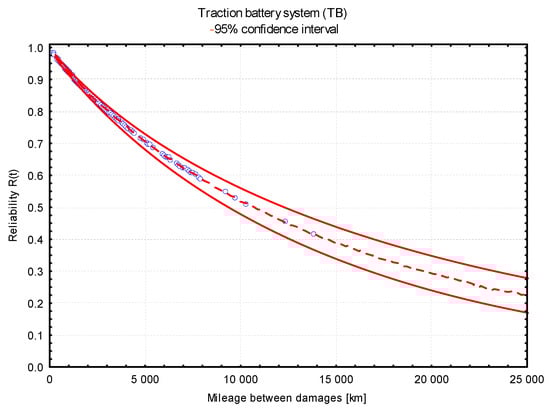
Figure 5.
Diagram of reliability function of traction battery system (TB) of E12 electric buses.
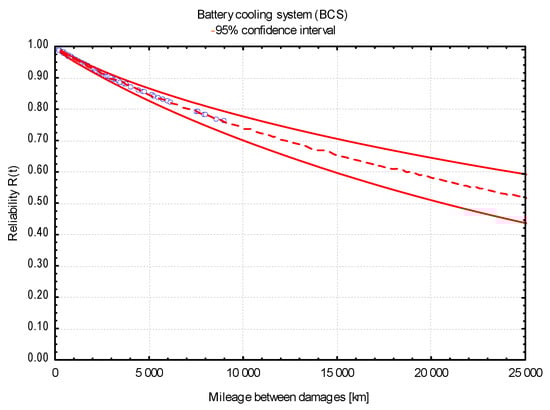
Figure 6.
Diagram of reliability function of battery cooling system (BCS) of E12 electric buses.
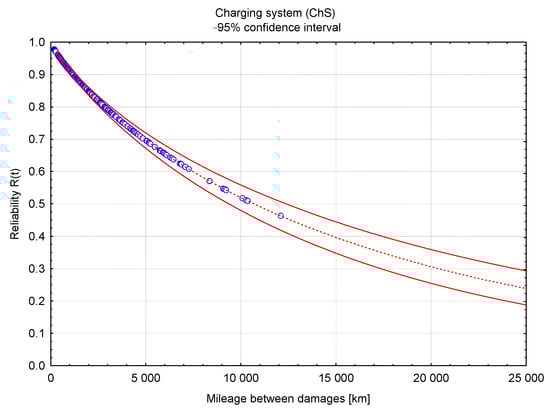
Figure 7.
Diagram of reliability function of charging system (ChS) of E12 electric buses.
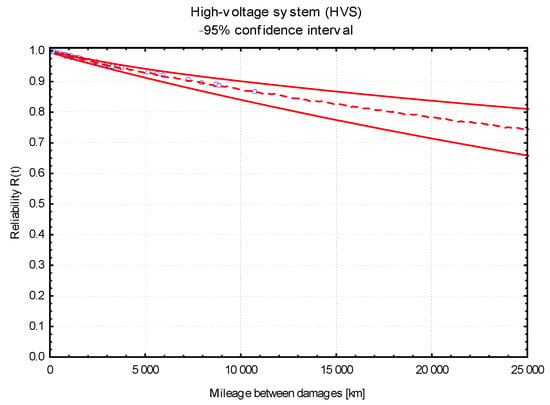
Figure 8.
Diagram of reliability function of high-voltage system (HVS) of E12 electric buses.
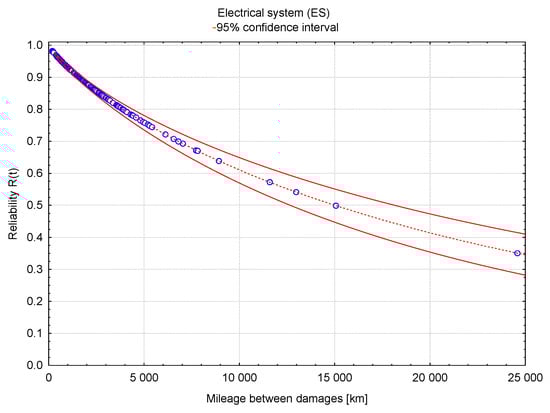
Figure 9.
Diagram of reliability function of electrical system (ES) of E12 electric buses.
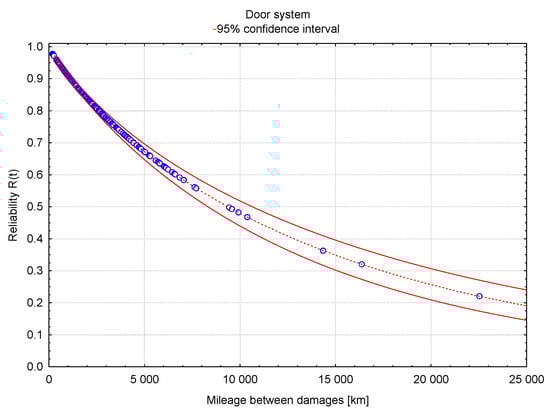
Figure 10.
Diagram of reliability function of E12 electric bus door system.
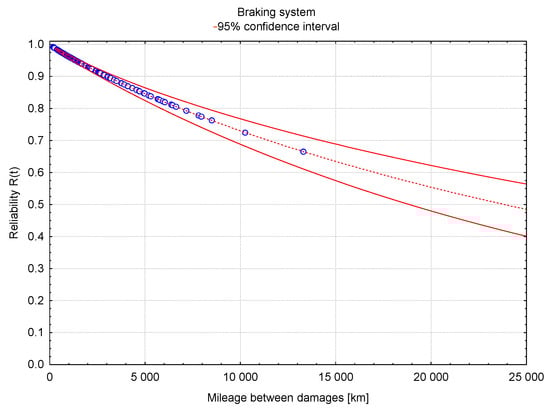
Figure 11.
Diagram of reliability function of braking system of E12 electric buses.
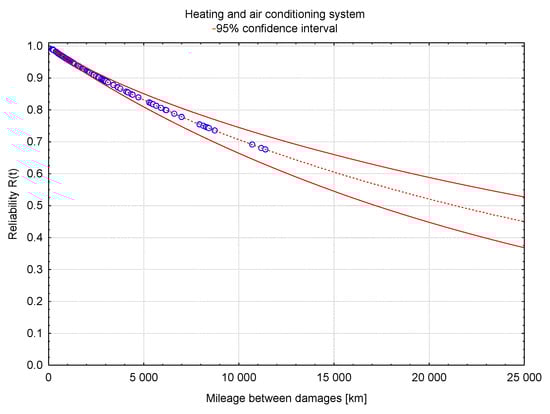
Figure 12.
Diagram of reliability function of heating and air conditioning system of E12 electric buses.
Table 10.
Inter-failure mileage at given reliability of structural systems R*(t) = 0.8 and R*(t) = 0.5 of E12 electric buses [km].
In the case of the high-voltage system (HVS), it was found that for a set R*(t) = 0.8, the correct mileage is TR80 = 10,800 km. However, in the cases of battery cooling (BCS), braking (BS) and heating and air conditioning (HAC) systems, the proper mileage between repairs is in the range TR80 = (6100; 6630 km). The lowest mileage specific for reliability R*(t) = 0.8 was found for the charging (ChS) and door (DS) systems, respectively, TR80 = 2835 km and TR80 = 2610 km.
The values of mileage between the failures presented in Table 10 for the given reliability R*(t) = 0.5 were compared to the data from the literature. In their 2023 paper [20], Malozymov et al., who were studying trolleybuses in Novosibirsk in Russia, determined the mean time between failures (MTBF) of selected electrical systems, among others:
- traction engine—16,329 km
- auxiliary engine—7581 km
- current regulator relay—15,746 km
- voltage relay—16,329 km
- current relay—15,716 km
- batteries—11,080 km
The MTBF calculations used the usage intensity index as in the presented tests of electric buses of 58,320 km/year. When comparing the data to the data from Table 10, one can notice a similar range of mileage specific to R*(t) = 0.5 power systems in E12 buses:
- traction batteries—10,032 km
- electrical system—15,000 km
- charging system—10,277 km
5. Conclusions
Based on the tests conducted on a sample of electric buses (E12) in real public transport conditions and a comparison to the test results of a reference group of internal combustion buses (S12), it was shown that although the difference between the two groups of vehicles is small, it can be considered statistically significant. This demonstrates the effectiveness of the adopted reliability indicators.
The results of the study (Table 2, Table 3 and Table 6, as well as Figure 2) show that electric buses have a lower mileage between failures than classic internal combustion buses of comparable transport capacity. The relative differences are:
- For the average value of the mileage in the sample,
- For the parameter b of the Weibull model,
- For the set reliability: R*(t) = 0.5,
- For the set reliability: R(t) = 0.8,
It was shown that the analysis of Weibull model parameters (Table 8 and Table 9) makes it possible to identify parts of the vehicle with low reliability and determine the characteristic values of the scale parameter b. The most distinguished in the summary of the parameters of the Weibull model in the reliability of electric vehicles (Table 8) are the low values of the scale parameter b for: the traction battery system b(TB) = 15,957 km, the charging system b(ChS) = 16,424 km and the door system b(DS) = 14,154 km.
It was also assessed that the Weibull distribution is an effective reliability model because it allows for concluding (estimating) the dynamics of change in the frequency of failures in the function of the vehicle’s in-service mileage on the basis of the assessment of the shape parameter c. In the case of electric buses (Table 8), the shape parameter of the considered systems is in the range of c(E) = (0.85587; 0.91119) while in the group of internal combustion buses c(S) = (0.75355; 1.1043). The range of values c(E) is therefore more limited (narrow) and closer to unity than that of the parameter c(S). This allows for assuming that the reliability of the structural systems of electric buses is more standardized, and failures are caused by random external events, while in internal combustion buses the additional influence of physical running-in of moving parts (PS, DS) or the influence of cumulative wear and tear on parts (HAC, PS) are also included.
Perspective for Practical Use of the Results and Suggestions for Future Research Directions
The results of the research described in this article can be used to control the effects of the implementation of strategic programs for the sustainable development of public transport, as well as local programs for the expansion of the bus fleet. The practical applications may also concern the improvement of bus diagnostic and maintenance systems in public transport companies.
The authors postulate the continuation and expansion of research in the future, in terms of:
- Statistical analysis and standardization of indicators for the repair of all damaged vehicle components.
- Conducting an engineering analysis of the causes of damage in the context of assessing reliability risks for the continuity of bus operation.
Author Contributions
Conceptualization, A.N., M.Ś. and J.R.; methodology, A.N.; software, D.K.; validation, A.N. and M.Ś.; formal analysis, P.H.; investigation, A.N., J.R. and D.K.; resources, A.N. and D.K.; data curation, P.H.; writing—original draft preparation, A.N. and J.R.; visualization, J.R.; supervision, A.N. and J.R. All authors have read and agreed to the published version of the manuscript.
Funding
This research received no external funding.
Data Availability Statement
The original contributions presented in this study are included in the article. Further inquiries can be directed to the corresponding author.
Conflicts of Interest
Author Piotr Hołyszko was employed by the company Municipal Transport Company Lublin Ltd. The remaining authors declare that the research was conducted in the absence of any commercial or financial relationships that could be construed as a potential conflict of interest.
References
- Ammenberg, J.; Dahlgren, S. Sustainability Assessment of Public Transport, Part I—A Multi-Criteria Assessment Method to Compare Different Bus Technologies. Sustainability 2021, 13, 825. [Google Scholar] [CrossRef]
- Chan, W.C.; Ibrahim, W.H.W.; Lo, M.C.; Suaidi, M.K.; Ha, S.T. Determinants of customer satisfaction and loyalty in public transport: A PLS-SEM approach. Stud. Appl. Econ. 2021, 39, 1–23. [Google Scholar] [CrossRef]
- Zwierzchowska, M. Ocena jakości usług komunikacji miejskiej-dobór zmiennych metodą delficką. Autobusy–Tech. Eksploat. Syst. Transp. 2018, 219, 18–21. [Google Scholar] [CrossRef]
- Chen, X.; Yu, L.; Zhang, Y.; Guo, J. Analyzing urban bus service reliability at the stop, route, and network levels. Transp. Res. Part A Policy Pract. 2009, 43, 722–734. [Google Scholar] [CrossRef]
- Laizāns, A.; Graurs, I.; Rubenis, A.; Utehin, G. Economic viability of electric public busses: Regional perspective. Procedia Eng. 2016, 134, 316–321. [Google Scholar] [CrossRef]
- Telakowiec, K.; Szarek, S. Ocena stanu infrastruktury i sposobu funkcjonowania transportu miejskiego w Warszawie i Kopenhadze. Wydaw. Uniw. Przyr.-Humanist. W Siedlcach 2016, 12, 187–199. [Google Scholar]
- Yatskiv, I.; Pticina, I.; Savrasovs, M. Urban Public Transport System’s Reliability Estimation Using Microscopic Simulation. Transp. Telecommun. J. 2012, 13, 219–228. [Google Scholar] [CrossRef]
- Mańka, A.; Mańka, I. Analiza ryzyka jako narzędzie zapewniania bezpieczeństwa w transporcie publicznym. Komun. Publiczna 2016, 3, 23–30. [Google Scholar]
- Niewczas, A.; Mórawski, Ł.; Rymarz, J.; Dębicka, E.; Hołyszko, P. Operatinal risk assessment model for city buses. Eksploat. I Niezawodn.-Maint. Reliab. 2023, 25, 14. [Google Scholar] [CrossRef]
- Smalko, Z.; Nowakowski, T.; Tubis, A. Zarys Niezawodnościowej Teorii Zagrożeń; Oficyna Wydawnicza Politechniki Wrocławskiej: Wrocław, Poland, 2020. [Google Scholar]
- Veeneman, W.; Wilschut, J.; Urlings, T.; Blank, J.; van de Velde, D. Efficient frontier analysis of Dutch public transport tendering: A first analysis. Res. Transp. Econ. 2014, 48, 101–108. [Google Scholar] [CrossRef]
- Raposo, H.; Farinha, J.T.; Ferreira, L.; Galar, D. An integrated econometric model for bus replacement and determination of reserve fleet size based on predictive maintenance. Eksploat. I. Niezawodn.-Maint. Reliab. 2017, 19, 358–368. [Google Scholar] [CrossRef]
- Gołąbek, A. (red.): NIEZAWODNOŚĆ Autobusów; Oficyna Wydawnicza Politechniki Wrocławskiej: Wrocław, Poland, 1993. [Google Scholar]
- Młyńczak, M. Metodyka Badań Eksploatacyjnych Obiektów Mechanicznych; Oficyna Wydawnicza Politechniki Wrocławskiej: Wrocław, Poland, 2012. [Google Scholar]
- Nowakowski, T.; Tubis, A.; Werbińska-Wojciechowska, S. ISO 55001 and difficulties of its implementation in polish enterprises. J. KONBiN 2017, 42, 209. [Google Scholar] [CrossRef][Green Version]
- Mahboob, Q.; Zio, E. Handbook of RAMS in Railway Systems: Theory and Practice; CRC Press: Boca Raton, FL, USA, 2018. [Google Scholar]
- Niewczas, A.; Rymarz, J.; Dębicka, E. Stages of operating vehicles with respect to operational efficiency using city buses as an example. Eksploat. I Niezawodn.-Maint. Reliab. 2019, 21, 21–27. [Google Scholar] [CrossRef]
- Andrzejczak, K.; Selech, J. Quantile analysis of the operating costs of the public transport fleet. Transp. Probl. 2017, 12, 103–111. [Google Scholar] [CrossRef]
- Michalski, R.; Wierzbicki, S. Comparative reliability tests of city transport busses. Eksploat. I Niezawodn.-Maint. Reliab. 2006, 4, 22–26. [Google Scholar]
- Andrzejczak, K.; Selech, J. Investigating the trends of average costs of corrective maintenance of public transport vehicles. J. KONBiN 2017, 41, 207–226. [Google Scholar] [CrossRef]
- Młyńczak, M.; Muzdybayev, M.; Muzdybayeva, A.; Myrzabekova, D. Reliability Assessment of Driving Systems of City Buses. In Advances in Dependability Engineering of Complex Systems; Zamojski, W., Mazurkiewicz, J., Sugier, J., Walkowiak, T., Kacprzyk, J., Eds.; Springer: Berlin/Heidelberg, Germany, 2018; p. 582. [Google Scholar] [CrossRef]
- Martyushev, N.V.; Malozyomov, B.V.; Kukartsev, V.V.; Gozbenko, V.E.; Konyukhov, V.Y.; Mikhalev, A.S. Determination of the reliability of urban electric transport running autonomously through diagnostic parameters. World Electr. Veh. J. 2023, 14, 334. [Google Scholar] [CrossRef]
- Yuan, X.; Lu, Z. Efficient approach for reliability-based optimization based on weighted importance sampling approach. Reliab. Eng. Syst. Saf. 2014, 132, 107–114. [Google Scholar] [CrossRef]
- Oszczypała, M.; Ziółkowski, J.; Małachowski, J. Semi-Markov approach for reliability modelling of light utility vehicles. Eksploat. I Niezawodn.-Maint. Reliab. 2023, 25, 161859. [Google Scholar] [CrossRef]
- Selech, J.; Andrzejczak, K. An aggregate criterion for selecting a distribution for times to failure of components of rail vehicles. Eksploat. I Niezawodn.-Maint. Reliab. 2020, 22, 102–111. [Google Scholar] [CrossRef]
- Rymarz, J. Badania Efektywności Eksploatacyjnej Autobusów Komunikacji Miejskiej; Wydawnictwo Politechniki Lubelskiej: Lublin, Poland, 2021. [Google Scholar]
- Borucka, A.; Stopka, O.; Kozłowski, E. Analysis of electric vehicles in the context of the world’s largest economies. Arch. Automot. Eng. Arch. Motoryz. 2024, 106, 65–82. [Google Scholar] [CrossRef]
- Analizy Statystyczne GUS, Transport Drogowy w Polsce w Latach 2022 i 2023, Warszawa Szczecin 2024. Available online: https://stat.gov.pl/obszary-tematyczne/transport-i-lacznosc/ (accessed on 30 October 2024).
- Brdulak, J.; Pawlak, P. Międzynarodowe aspekty jakościowych zmian transportu samochodowego związane z elektromobilnością. Kwart. Nauk. O Przedsiębiorstwie 2022, 66, 5–16. [Google Scholar] [CrossRef]
- Dahlgren, S.; Ammenberg, J. Sustainability of Public Transport, Part II—Applying a Multi-Criteria Assessment Method of Compare Different Bus Technologies. Sustainability 2021, 13, 1273. [Google Scholar] [CrossRef]
- Vepsäläinen, J.; Ritari, A.; Lajunen, A.; Kivekäs, K.; Tammi, K. Energy uncertainty analysis of electric buses. Energies 2018, 11, 3267. [Google Scholar] [CrossRef]
- Taysayev, K.; Terentyev, A.; Evtukov, S.; Arifullin, I. Efficiency ratio assessment model for buses. Transp. Res. Procedia 2020, 50, 674–680. [Google Scholar] [CrossRef]
- Ritari, A.; Vepsäläinen, J.; Kivekäs, K.; Tammi, K.; Laitinen, H. Energy consumption and lifecycle cost analysis of electric city buses with multispeed gearboxes. Energies 2020, 13, 2117. [Google Scholar] [CrossRef]
- Szürke, S.K.; Saly, G.; Lakatos, I. Analyzing Energy Efficiency and Battery Supervision in Electric Bus Integration for Improved Urban Transport Sustainability. Sustainability 2024, 16, 8182. [Google Scholar] [CrossRef]
- Komorska, I.; Puchalski, A.; Niewczas, A.; Ślęzak, M.; Szczepański, T. Adaptive driving cycles of EVs for reducing energy consumption. Energies 2021, 14, 2592. [Google Scholar] [CrossRef]
- Kozłowski, E.; Wiśniowski, P.; Gis, M.; Zimakowska-Laskowska, M.; Borucka, A. Vehicle acceleration and speed as factors determining energy consumption in electric vehicles. Energies 2024, 17, 4051. [Google Scholar] [CrossRef]
- Al-Saadi, M.; Mathes, M.; Käsgen, J.; Robert, K.; Mayrock, M.; Mierlo, J.V. Optimization and analysis of electric vehicle operation with fast-charging technologies. World Electr. Veh. J. 2022, 13, 20. [Google Scholar] [CrossRef]
- Hou, K.; Xu, X.; Jia, H.; Yu, X.; Jiang, T.; Zhang, K. A reliability assessment approach for integrated transportation and electrical power systems incorporating electric vehicles. IEEE Trans. Smart Grid 2016, 9, 88–100. [Google Scholar] [CrossRef]
- Lin, Y.; Zhang, K.; Shen, Z.-J.M.; Miao, L. Charging network planning for electric bus cities: A case study of Shenzhen, China. Sustainability 2019, 11, 4713. [Google Scholar] [CrossRef]
- Wang, N.; Pei, Y.; Wang, Y.-J. Antecedents in Determining Users’ Acceptance of Electric Shuttle Bus Services. Mathematics 2022, 10, 2896. [Google Scholar] [CrossRef]
- Li, L.; Liu, Q. Study on the influence of acceleration curve on electric vehicle energy consumption and battery life. In IOP Conference Series: Earth and Environmental Science; IOP Publishing: Bristol, UK, 2020; Volume 512, p. 012106. [Google Scholar] [CrossRef]
- Małek, A.; Dudziak, A.; Stopka, O.; Caban, J.; Marciniak, A.; Rybicka, I. Charging Electric Vehicles from Photovoltaic Systems—Statistical Analyses of the Small Photovoltaic Farm Operation. Energies 2022, 15, 2137. [Google Scholar] [CrossRef]
- Malozyomov, B.V.; Martyushev, N.V.; Konyukhov, V.Y.; Oparina, T.A.; Zagorodnii, N.A.; Efremenkov, E.A. Mathematical analysis of the reliability of modern trolleybuses and electric buses. Mathematics 2023, 11, 3260. [Google Scholar] [CrossRef]
- Silva-Ortega, J.; Ortíz, J.; Candelo-Becerra, J.E. A New Method to Assess the Reliability and Security of Urban Electrical Substations. Electricity 2024, 5, 991–1007. [Google Scholar] [CrossRef]
- Niewczas, A.; Mórawski, Ł.; Dębicka, E.; Rymarz, J.; Kasperek, D.; Hołyszko, P. A Comparative Study of the Availability of Electric Buses in the Public Transport System. Applied Sciences. Multidiscip. Digit. Publ. Inst. 2025, 15, 1212. [Google Scholar] [CrossRef]
- O’Connor, P.; Kleyner, A. Practical Reliability Engineering; John Wiley & Sons: Hoboken, NJ, USA, 2011. [Google Scholar] [CrossRef]
- Hang, T.; Wen, J.; Zheng, B.S.; Xiao, J.H.; Zhou, F. Reliability analysis of the vehicle door system EDCU based on Weibull distribution. Eksploat. I Niezawodn.-Maint. Reliab. 2025, 27, 195257. [Google Scholar] [CrossRef]
- Trivedi, K.S.; Bobbio, A. Reliability and Availability Engineering: Modeling, Analysis, and Applications; Cambridge University Press: Cambridge, UK, 2017. [Google Scholar] [CrossRef]


Disclaimer/Publisher’s Note: The statements, opinions and data contained in all publications are solely those of the individual author(s) and contributor(s) and not of MDPI and/or the editor(s). MDPI and/or the editor(s) disclaim responsibility for any injury to people or property resulting from any ideas, methods, instructions or products referred to in the content. |
© 2025 by the authors. Licensee MDPI, Basel, Switzerland. This article is an open access article distributed under the terms and conditions of the Creative Commons Attribution (CC BY) license (https://creativecommons.org/licenses/by/4.0/).