Abstract
In recent years, the increasing frequency of extreme weather events has led to a rise in unplanned unit outages, posing significant risks to the safe operation of power systems and underscoring the critical need for accurate prediction and effective mitigation of wind and solar power ramp events. Unlike traditional power forecasting, ramp event prediction must capture the abrupt output variations induced by short-term meteorological fluctuations. This review systematically examines recent advancements in the field, focusing on three principal areas: the definition and detection of ramp event characteristics, innovations in predictive model architectures, and strategies for precision optimization. Our analysis reveals that while detection algorithms for ramp events have matured and the overall predictive performance of power forecasting models has improved, existing approaches often struggle to capture localized ramp phenomena, resulting in persistent deviations. Moreover, current research highlights the necessity of developing evaluation systems tailored to the specific operational hazards of ramp events, rather than relying solely on conventional forecasting metrics. The integration of artificial intelligence has accelerated progress in both event prediction and error correction. However, significant challenges remain, particularly regarding the interpretability, generalizability, and real-time applicability of advanced models. Future research should prioritize the development of adaptive, ramp-specific evaluation frameworks, the fusion of physical and data-driven modeling techniques, and the deployment of multi-modal systems capable of leveraging heterogeneous data sources for robust, actionable ramp event forecasting.
1. Introduction
Renewable energy, particularly wind energy and photovoltaic energy, continues to expand its installed capacity as the global energy structure is transitioning toward decarbonization. However, the intermittency and volatility of their power generation, particularly “power ramp events” triggered by extreme weather or abrupt meteorological changes, pose severe challenges to the safety and stability of power systems. A power ramp event is defined as a sudden and significant increase or decrease in generation output over a brief period, leading to supply–demand imbalances, significant prediction errors, and potential grid frequency violations or even blackouts [1]. Such problems are exacerbated by the frequency of extreme weather events in the context of climate change, forcing power systems to increase flexibility and regulation capabilities under higher renewable energy penetration targets [2,3]. Therefore, proactive control of power ramp events has become a key aspect of improving the reliability and economics of wind and PV integration.
Current technical approaches for controlling power ramp events are primarily based on multi-dimensional collaborative strategies. By integrating high-precision power forecasting technologies [4], large-scale energy storage systems with fast response capabilities [5], and intelligent demand response mechanisms [6], a source–grid–load–storage coordinated scheduling framework [7] is constructed to enhance the reliability of wind and solar energy as power sources.
As the core link of the ramp event feedforward control strategy, the improvement of power ramp forecasting accuracy can effectively reduce the development costs of the energy storage systems and the solution complexity of the scheduling optimization strategy. Based on this, constructing a refined probabilistic prediction model for ramp events to decouple and quantify multi-dimensional features (e.g., fluctuation amplitude, change rate, spatio-temporal correlation) has become a key path to enhance the spatio-temporal resolution of ramp event identification. Cristobal et al. [1] systematically reviewed the studies on wind power ramps before 2015, covering definitions, meteorological causes, and prediction methods. Notably, over the past decade, with advancements in artificial intelligence and multi-source data fusion, ramp event forecasting has shifted from purely physics-driven models to hybrid data-physics approaches. Therefore, a systematic compendium of interdisciplinary research progress is needed to improve the theoretical system of renewable energy ramp event and guide the resilient transition of energy system.
Current research primarily focuses on the meteorological causes and hazard mitigation of ramp events. Significant progress has been made in power smoothing strategies based on model predictive control (MPC) [4,5] and robust optimization [8,9]. Many scholars have also attempted to elucidate the mechanisms of meteorological driving factors through spatiotemporal analysis using all-sky imagers [10] and Doppler radars [11]. However, a major limitation of existing research lies in the absence of a quantitative evaluation model for assessing the severity of ramp events, which hinders the implementation of risk-graded early warning systems. Relying exclusively on complex control strategies that focus only on power fluctuations, while disregarding the underlying physical causes of ramp events, results in inefficient allocation of regulation resources and hinders the achievement of an optimal balance between economic efficiency and operational responsiveness.
Therefore, it is necessary to investigate how to construct a unified mathematical characterization framework for power ramp events in wind and photovoltaic systems, in order to accelerate the development of AI-driven optimization methods for ramp event prediction and control. This paper systematically reviews the research progress on renewable energy power ramp events, with particular emphasis on ramp event detection and forecasting techniques, as well as the development direction of AI driven optimization methods. The main contribution of this study is the systematic synthesis and organization of existing mathematical modeling approaches: by thoroughly reviewing the literature on the detection and forecasting of power ramp events, we identify and summarize a unified mathematical characterization framework for wind and PV ramp events. This framework enables a comprehensive analysis of historical ramp event characteristics and provides effective support for the prediction and control of future ramp events.
The structure of the paper is divided into four sections. In Section 2, the historical development process of mathematical modeling of power ramp events and the iterative optimization of algorithms for power ramp event detection in recent years is presented. In Section 3, the sample imbalance problem for power ramp events and novel methods and metrics for performing ramp forecasting are presented. In Section 4, the use of AI to solve the current ramp event problem is summarized, and a short summary of potential research and challenges is provided. The discussion and the conclusions are presented in Section 5.
2. Mathematical Modeling and Detection of Power Ramp Events
Power ramps in wind and photovoltaic (PV) generation refer to rapid changes in power output over a short period, which can be simply characterized by specifying a ramp rate in the absence of noise disturbances. However, such a straightforward definition may not enable reliable and reproducible segmentation and classification of all power event sequence intervals that meet a given criterion [12]. This limitation poses challenges in standardizing the criteria for defining power ramps. Therefore, modeling and defining a power ramp event can help to better characterize the ramping behavior of power output, thereby facilitating improved control and management of power ramps.
2.1. Mathematical Modeling and Characteristic Parameters of Power Ramp Events
Ferreira et al. [13] proposed a mathematical model for wind power ramp events by defining five key characteristic quantities: ramp amplitude (ΔP), duration (Δt), ramp rate (ΔP/Δt), start time (t0), and ramp direction (f). In this framework, the ramp amplitude (ΔP) represents the total change in power output during the ramp event, providing a direct measure of the event’s magnitude. The duration (Δt) refers to the time interval over which the ramp occurs, offering insight into the temporal scale and potential operational impact of the event. The ramp rate (ΔP/Δt) quantifies the speed of power variation, serving as an important indicator for the grid’s ability to respond to rapid fluctuations. The start time (t0) marks the initial moment when the power output begins to change significantly, which is crucial for event detection and subsequent control actions. Lastly, the ramp direction (f) distinguishes between positive and negative ramps, indicating whether the power output is increasing or decreasing. Accurately identifying these parameters is fundamental to the modeling of ramp events, as they form the basis for characterizing the dynamic behavior of wind power output and developing effective detection, forecasting, and mitigation strategies. The precision in capturing the start time, duration, power variation interval, and ramp rate directly influences the reliability of ramp event models and their applicability in operational decision-making and risk management for power systems.
2.2. Definitions of Power Ramp Events
Based on the above models and characteristic parameters, various studies have proposed different definitions for ramp events, which can be broadly classified into two categories, one is to directly set a threshold for power ramp; this threshold can be changed and is amplitude, rate, and duration related, so as to complete a dichotomous definition of a ramp event, when more than this threshold is considered to have occurred a ramp event. Another approach involves decomposing the power data and transforming the resulting components into a ramp function. Unlike the discrete definition of ramp events, this method characterizes ramping behavior as a continuous metric. While the definition of ramp events is particularly useful for engineers in risk warning and control applications, the ramp function approach offers valuable insights for power market traders in electricity price forecasting. In this paper, the focus is primarily on definitions related to ramp events.
On the basis of this ramp model and characteristic parameters, the literature [14] proposes the following definition of a ramp event.
The first one considers a ramp event to have occurred when the power difference at the start and end points of the interval reaches a set threshold value [15]:
The second one assumes that when the difference between the peak and valley values in the interval reaches a set threshold , a ramp event is considered to have occurred [15]:
The third one assumes that when the rate of change in power, , in the interval reaches a set threshold, , a ramp event is considered to have occurred [16]:
The fourth one considers a ramp event to have occurred when the average change in power over the interval reaches a given threshold value [16]:
The validity of these definitions critically depends on threshold configuration. However, the establishment of universal threshold standards remains challenging due to heterogeneous grid stability requirements across different national/regional power systems. Consequently, appropriate combinations of definitions should be strategically selected according to specific application scenarios. For instance, when implementing power fluctuation smoothing control, priority should be given to ramp rate indicators that characterize temporal variation characteristics. Conversely, for power supply–demand balance optimization targeting ramp events, operational emphasis should shift towards magnitude-based metrics that quantify power deviation scales. This adaptive selection mechanism ensures technical alignment between definitional frameworks and application objectives while maintaining regulatory adaptability.
2.3. Detection Algorithms for Power Ramp Events
In the early period before ramp events were modeled and studied, researchers identified ramp events mainly by calculating the ramp rate through power and time differences [17,18]. This detection algorithm uses time point intervals as ramp intervals and is susceptible to temporal resolution and noise; when the temporal resolution is small or there is a lot of interfering noise, multiple ramp events can be detected, leading to unwanted ramp warnings.
Kamath et al. [16] adopted definitions (1) and (2) of ramp events. They then proceeded to identify ramp events within a segment of an interval, employing a data smoothing process to eliminate noise interference. This identification method, underpinned by the concept of windowing, considers the occurrence of ramp events within a designated window, that is, a time series. This approach facilitates a more comprehensive analysis of the trend across a segment of ramp events, as opposed to the point-by-point detection of ramp points.
Based on Kamath’s work, Sevlian and Rajagopa [12] proposed a novel definition (3) of the ramp rate, which incorporates a sliding window approach to enhance temporal flexibility in detecting ramp events. Utilizing the dynamic programming algorithm, they were able to identify the optimal window for the definition of the ramp event, with the duration of the ramp being considered from the longest duration onwards. The score function of dynamic programming is as follows:
denotes the score function in the interval [i, j], with higher score indicating greater ease of selection as the interval for ramp events. denotes the satisfaction of the ramp definition, with 1 assigned when it is satisfied and 0 when it is not, thus identifying the algorithm as the dichotomous method. The utilization of this algorithm facilitates the expeditious identification of ramp events within the longest time window. However, this approach results in the overshadowing of short-term larger rate ramps by long-term smaller rate ramps, despite the latter often being more detrimental and requiring greater detection.
To address this, the authors propose the implementation of an additional definition to prevent this phenomenon:
where is 1 if the interval [i, j] satisfies the ramp condition, and 0 if otherwise. are power values within the window, and is a user-defined parameter. This definition prevents significant power drops or fluctuations within the ramp interval. However, it still relies on subjectively set thresholds, leading to inconsistent results due to regional differences in threshold standards.
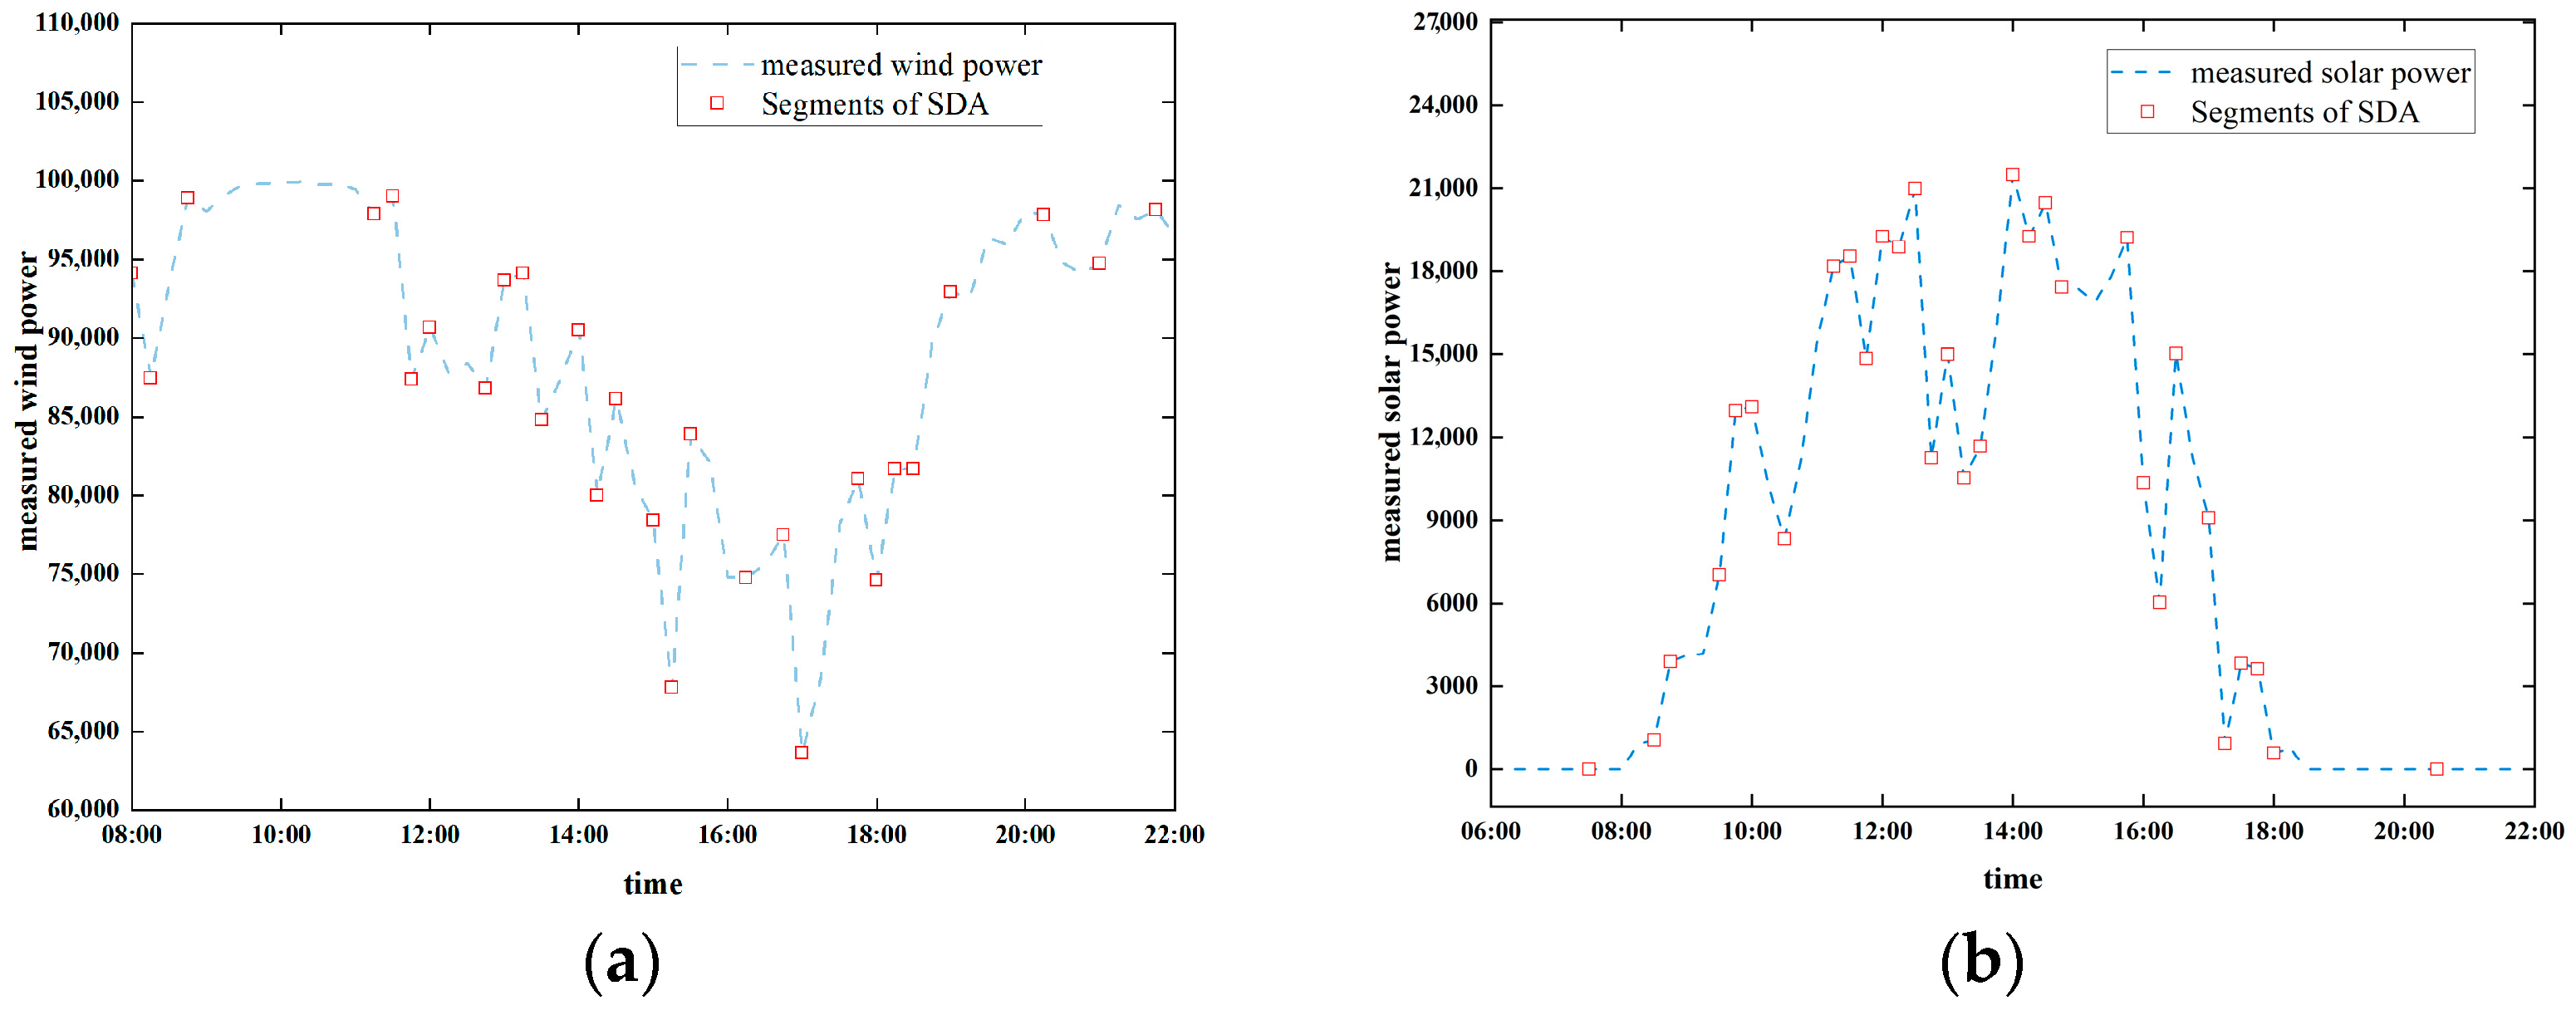
Concurrently, Florita et al. [19] implemented the swinging door algorithm (SDA) to execute trend compression and thereby discern wind and PV power ramp occurrences. SDA sets a parameter, door width ε, and through this parameter, a slope rule is determined. In this rule, a starting point is first established, and if the fluctuation range of the data points behind it is within this door width, it can be compressed until the slope between a data point and the starting point exceeds the range of the door width. At this point, the compression is stopped, and the data point is set as the new starting point. (Equation (7) and Figure 1).
where denotes the upper limit, denotes the lower limit, a denotes the start point, n denotes the end point, P is the power, t is the time point, and denotes the door width.
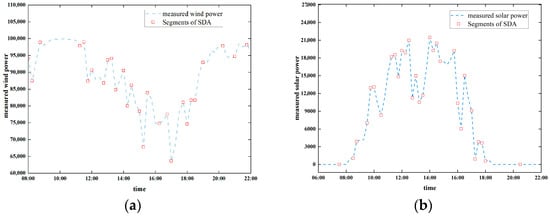
Figure 1.
Schematic diagram of data point compression by the SDA [19]. (a) Compressed data points of wind power. (b) Compressed data points of solar power.
A salient advantage of the SDA under scrutiny is its capacity to compress data to extract trends, a task particularly well-suited to data with a low resolution. Such data typically exhibits a multitude of minute fluctuations, which can be effectively eliminated by the swinging door algorithm through a process of smoothing, resulting in a straight line. However, the denoising effect of the revolving door is limited and depends on the width of the door . If is too large it will distort the data and if it is too small it will not compress the data well. This can make it difficult to discern trends and identify significant events in the data.
Cui et al. [20] proposed the optimized swinging door algorithm (OpSDA), combining dynamic programming to merge ramp segments, and they also analyzed and solved bump events, which are smaller amplitude fluctuations occurring in a short period of time. OpSDA optimizes the extraction of large ramps, reducing computation time and improving accuracy compared to L1-norm sliding window (L1-SW) and SDA by leveraging SDA for data compression. However, a problem is that when combining L1-SW and SDA, the parameter of SDA and the parameter L1-SW are not strictly determined, but just take a value within a reasonable range, and the paper does not introduce how to adapt the parameter values to further optimize the detection effect of the algorithm.
Therefore, Yang Cui [21] introduced the improved dynamic swinging door algorithm (IMSDA); they firstly use the confusion matrix to analyze the SDA detection of the ramp and select the parameter door width with the optimal evaluation effect, then they use the dynamic programming to the optimal door width of the SDA recognized ramp segments are merged with significant ramp event extraction. This IMSDA utilizes confusing evaluation to select the optimal parameters, but the thresholds for the definition of the ramp are chosen by human beings, the evaluation of the confusion matrix is still subjective, and there are still differences in the definition and detection of ramp events in different regions.
From the parameter selection on the definition of ramp, Lyners [22] gave a new solution, and they use a multi-parameter segmentation algorithm, that is to say, the parameters of multiple algorithms are used to select each other. For example, L1-SW and OpSDA, respectively, use these two algorithms for the detection of ramp events, and select the ramp events with 80% overlap as the actual occurrence of the ramp events, and select the parameters of the most overlapping ramp events detected by the two as the optimal parameters of the algorithm. This selection of ramp events with a high degree of overlap is a novel idea, compared to the traditional visual effects based on the observation of the ramp event. However, the starting and ending points of the common ramp events with 80% overlap in this selection becomes a difficult point in the detection of the ramp events. Whether the starting and ending points of the ramp events need to be defined as the extreme point or need to include a small smooth interval before the extreme point becomes a problem that needs to be discussed.
The Table 1 presents several algorithms for ramp event detection as previously introduced. It is important to note that increased algorithmic complexity does not necessarily lead to better ramp event detection performance. Due to the current lack of a clear and unified definition for ramp events, more sophisticated algorithms may lead to over-definition, such as merging ramp intervals. For example, a single meteorological change may result in several consecutive ramp events. However, whether a complete ramp event is required to map a meteorological change still warrants further investigation. Additionally, it is worth mentioning that the ramp event detection algorithms discussed here are independent from ramp event forecasting. In most cases, power forecasting is performed first, and ramp events are then detected through these algorithms. Further analysis is needed to determine which detection algorithms are most effective for extracting meaningful ramp events to support ramp event prediction.

Table 1.
Several algorithms for ramp event detection.
Most of the above algorithms for ramp detection are applicable to wind power ramp, only from the mathematical definition of power ramp event; wind power and PV should be able to use the same definition and the same algorithm. Cui et al. [23] have used OpSDA for the detection of solar power ramp events and also achieved good results. However, the problem to be noted is that the PV power has obvious daily periodicity, and the selection of parameters and the definition of ramp-up can lead to the fixed detection of a large ramp-up event and a large ramp-down event if used improperly. Zhu [24], therefore, proposed the method of offsetting the ramp rate for correcting the effect of PV daily periodicity. However, this method relies on the accuracy of the clear-sky model and the corrected ramp events become unintuitive compared to the original data.
The time scale of modeling for power ramp is mostly focused on 15 min, which originates from the need of power trading and scheduling, but this may not reflect the high frequency characteristics of PV power, so Raj [25] proposed the use of a higher resolution such as 1 min for the analysis of PV power ramp. Meanwhile, they decomposed the PV power component into metered average, ramp, and noise components and characterized the imbalance power as daily cycle variation and natural fluctuation. They successfully developed a mathematical model and used linear fitting to achieve results comparable to rolling average fitted data in fitting high frequency data. Although the uncertainty of their model still needs further analysis, this idea of modeling solar energy characteristics can be fully extended to apply to more directions such as wind power and load modeling.
Continuous Detection Based on Wavelet Transform
A major challenge in directly modeling power ramp using linear fitting lies in the choice of the ramp threshold, which is related to the detection of an interval as a ramp event. The wavelet transform based on the Haar function provides gradient information of the signal at different time scales. Therefore, Gallego et al. [26] proposed the use of a wavelet transform for the characterization of ramp events. The wavelet transform provides a magnitude for each scale and time, representing the signal as a cross-scale sum of time-centered wavelets with wavelet transform magnitude. The formula is given below:
In the above equation, denotes the center of the wavelet and gives information about the location. denotes the time scale of the wavelet and, in this particular application, the length of the interval to be considered for slope detection. The local gradients are evaluated at different time scales, and the value of that leads to the highest value of energy is chosen.
The accuracy of the wavelet transform, however, also relies on the choice of wavelet coefficients. Hannesdóttir, Á. et al. [27] argued that their approach, which characterizes power ramping as a continuous index, is considered more robust than the binary classification of ramp and non-ramp events. The primary advantage of this method is its ability to address the limitations associated with binary classification, which often assumes that all ramp intervals are similar regardless of differences in magnitude and duration. However, one challenge inherent to the wavelet-based approach is its susceptibility to noise interference, as the high sensitivity of the Haar wavelet may result in false detections. Additionally, wavelet transforms alone cannot directly distinguish between the magnitude and duration of ramp events, necessitating the integration of other methods for comprehensive quantitative analysis.
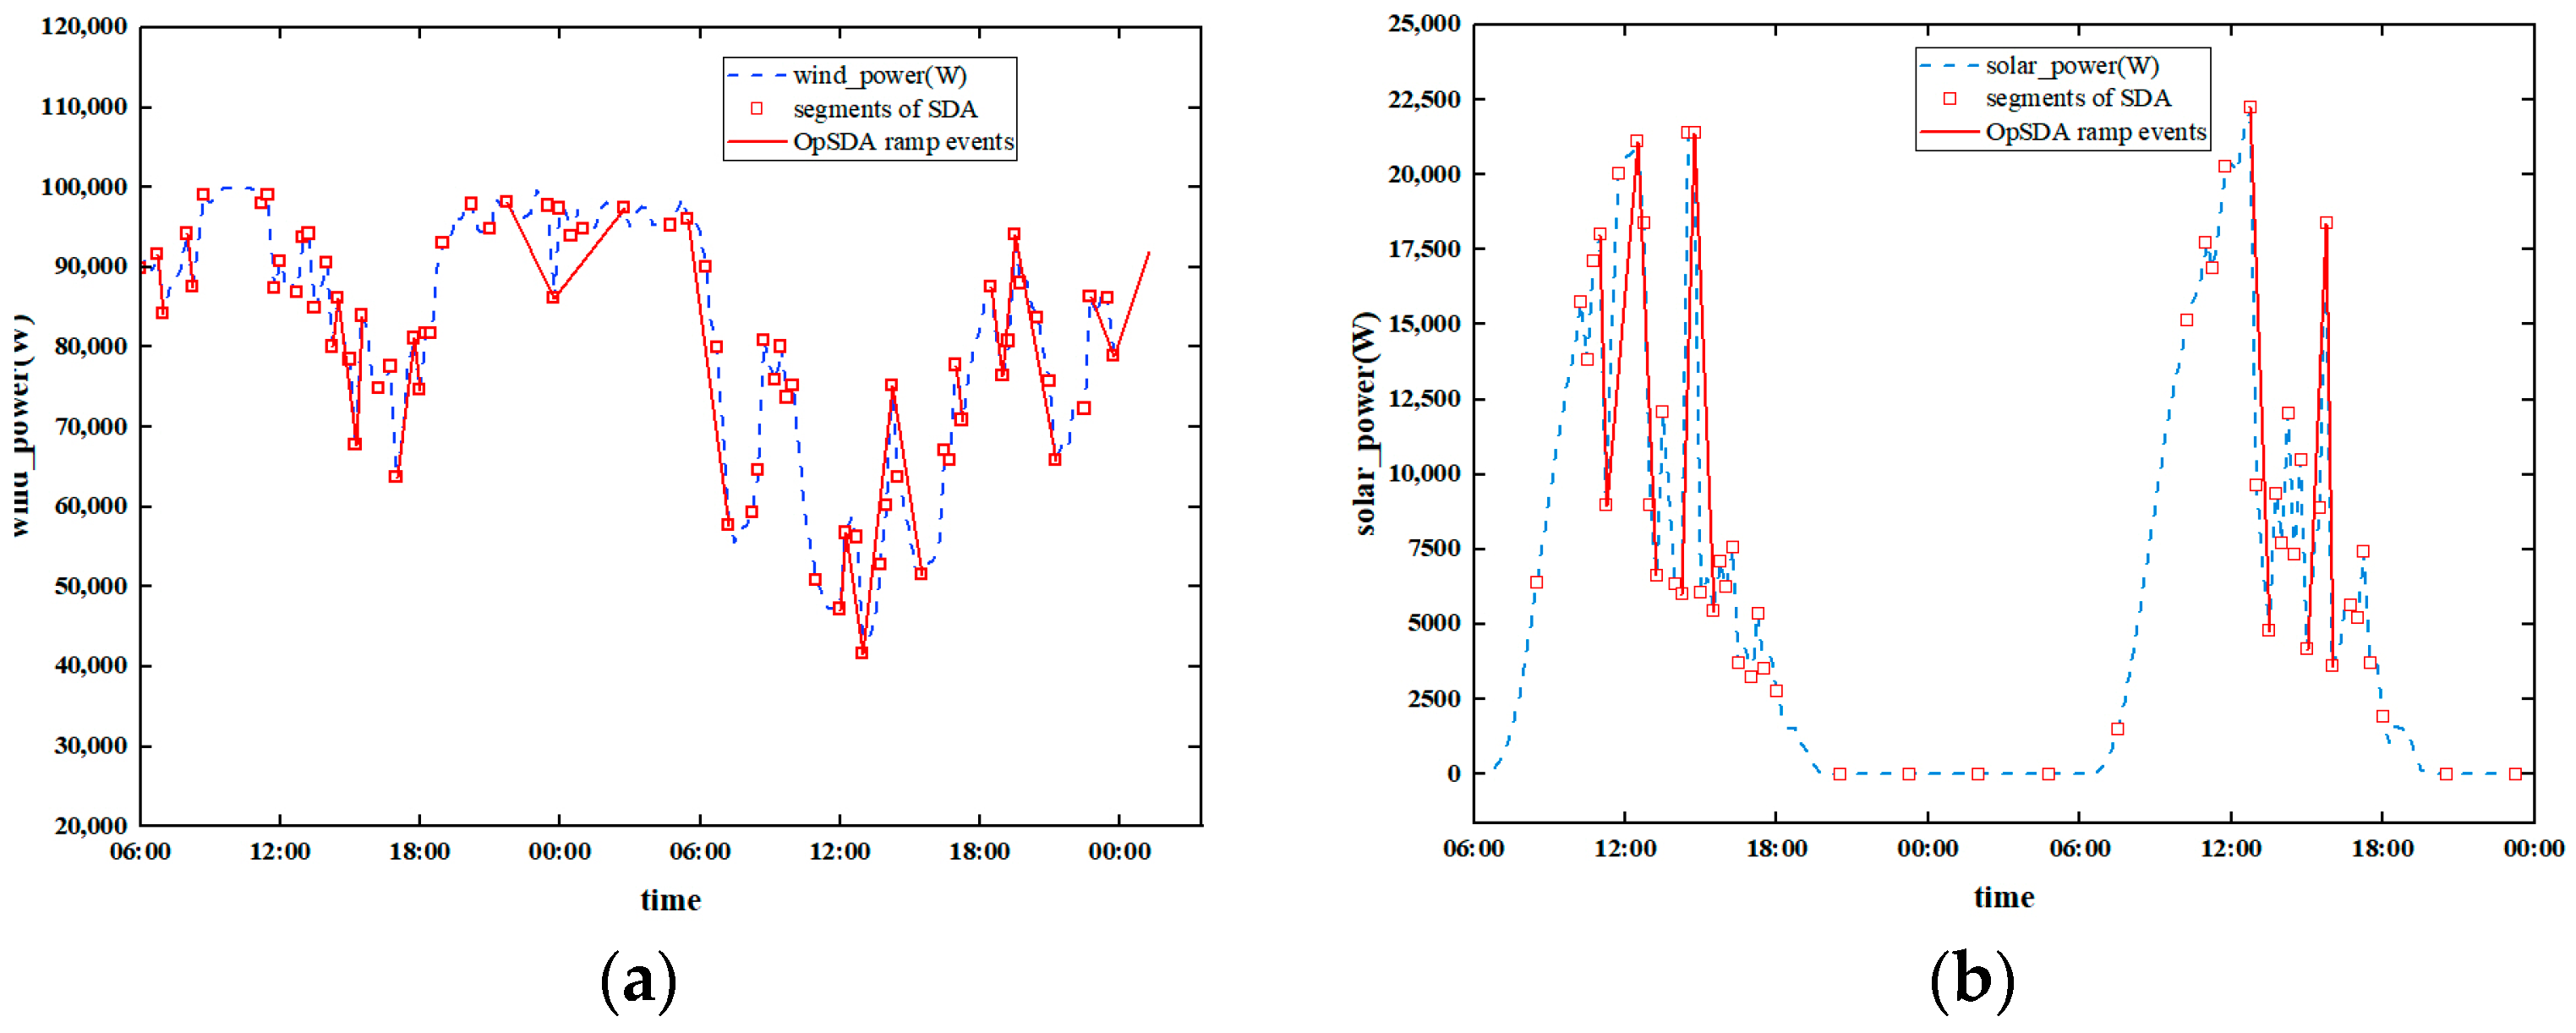
The swinging door algorithm is currently one of the most widely used methods for ramp event detection, as it effectively extracts peak and extremum points, as illustrated in Figure 2. Building upon this foundation, many researchers have developed algorithms such as dynamic programming and sliding window techniques to further optimize the merging of power data extrema and thus identify complete ramp events for analysis. However, as these algorithms have been refined, their computational complexity has increased significantly, particularly with respect to parameter optimization in dynamic programming and sliding window approaches. The choice of parameters also directly impacts the performance of these algorithms in detecting ramp events. While parameter tuning can mitigate the impact of noise to some extent, it still cannot fully guarantee that short-term ramp events detected are not caused by noise, which warrants further investigation. A critical consideration in ramp event detection is the data resolution: higher resolution data tend to be more susceptible to noise interference and require more complex algorithms. Future research in ramp event detection algorithms should, therefore, focus on enhancing computational speed and robustness without compromising accuracy, as well as on improving data transferability and algorithm generalization.
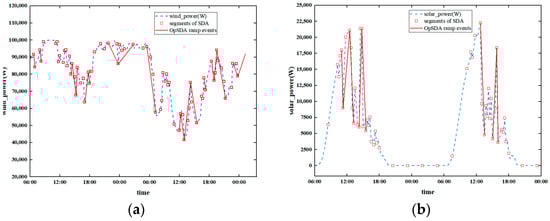
Figure 2.
Schematic diagram of OpSDA for detecting ramp events [20]. (a) Wind Power Ramp Detection Using Optimized Swinging Door Algorithm. (b) Solar Power Ramp Detection Using Optimized Swinging Door Algorithm.
3. Power Ramp Event Forecasting
In the early research on the forecasting of power ramp events, the forecasting of ramp events was mainly performed directly through meteorological factors because the modeling and definition of ramp events were not clear. However, the ramp event is a small probability event, and the lack of historical data has been restricting the research on the forecasting mechanism of the ramp event. With the improvement of the accuracy of power prediction and the optimization of the detection algorithm of the ramp event in recent years, the prediction of the power and then the identification of the ramp event have become the mainstream direction of the current research [14].
3.1. Simulation of Ramp Events—The Sample Imbalance Problem of Ramp Events
Aiming at the problem that statistical methods produce different results for each simulation and it is difficult for physical models to accurately forecast slope characteristics, Cui et al. [28] used neural networks to simulate wind power generation as a stochastic process to generate multiple possible scenarios of future wind power generation (WPG). Based on these scenarios, they probabilistically extracted important characteristics of wind power ramp events (WPREs), such as the start time, duration, rate of change, etc., thus providing statistical information for power system operators for unit commitment and dispatch, especially in the case of high wind penetration. Cui [29] proposed another generalized Gaussian mixture model and analytically derived the cumulative distribution function (CDF), which is then based on the inverse transformation method of the CDF to generate a large number of forecasting error scenarios.
Qu et al. [30] addressed the problems of ramp forecasting methods in terms of long-term trends and coordinated short-term accuracy. They first established a preliminary model using wind power generation curves to capture the trends of wind changes and then corrected the forecasting residuals using Markov autoregressive models. Finally, an improved swing gate algorithm is applied for ramp event detection and ramp characterization.
Ramping events are low-frequency but high-impact occurrences in modern power systems, and the sparsity of historical data imposes significant constraints on the study of such events. Randomized scenario generation and probabilistic feature extraction, which can produce a large number of possible future wind power scenarios and statistically characterize ramp events, have emerged as key approaches to addressing the imbalance in ramp event samples. However, despite their advantages, these methods are not without limitations. Notably, they often rely heavily on synthetic data, which may not fully capture the complexity and variability of real-world ramp events. Furthermore, scalability can become an issue as the dimensionality and complexity of the power system increase, potentially resulting in high computational costs. Finally, the effectiveness and robustness of these methods are sensitive to the assumptions underlying the stochastic models and scenario generation techniques, which may affect the generalizability of the results. Therefore, while randomized scenario generation and probabilistic feature extraction offer promising solutions to sample imbalance, careful consideration of their limitations is essential for their practical application and for guiding future research directions.
3.2. Power Ramp Forecasting Using Different Models
Wind and photovoltaic power generation, as clean and environmentally friendly renewable energy sources, has been developing rapidly in recent years, but its high volatility and intermittency challenge the economic operation and real-time control of the power grid. Accurate forecasting techniques for wind and photovoltaic power generation are essential to improve the contribution of wind power in the grid, especially when dealing with ramp events in large-scale wind farms.
In recent years, a number of scholars have verified the effectiveness of neural network methods in wind power ramp forecasting. For example, the generative adversarial network (GAN) [31] can generate virtual samples to compete with real samples, thus compensating for the insufficient samples in ramp events. Through the long short-term memory network (LSTM) [32] and gated recursive unit [33], long-term memory can be effectively extracted to solve the gradient explosion problem of recurrent neural networks. By improving Transformer’s Informer architecture [34], the network size can be reduced, and forecasting performance can be improved through the self-attention mechanism.
The Table 2 presents the performance metrics of various models reported in the literature for ramp event prediction under a specific scenario. In practice, neural networks can be highly stochastic and unpredictable. This issue is particularly pronounced in the context of ramp event prediction, where the limited number of ramp events often leads to significant variations in detection accuracy across different datasets.
Table 2.
Metric scores of several models for ramp event prediction.
Therefore, leveraging neural networks to improve prediction accuracy is heavily dependent on effective feature extraction from the dataset prior to model input. Zhou et al. [31] combined the variational modal decomposition (VMD) to decompose the original wind power time series data into multiple intrinsic modal functions and used a convolutional neural network (CNN) to extract the features to generate the virtual samples. Zhang et al. [35] considered quadratic denoising by wavelet transform (WT) and then filtering the data by PCA-BP to eliminate redundant and irrelevant information and reduce the model complexity. Wang et al. [36] used wavelet transform to decompose the original signal into multiple frequency sequences and extracted nonlinear features and invariant structures in each frequency using a deep convolutional network. Currently, the mainstream feature extraction means are divided into two kinds, one is based on signal processing such as wavelet transform and variational modal decomposition, and the other is based on neural networks such as convolutional neural networks. Feature extraction methods can improve the quality of data input and increase the interpretability of the forecasting model, thus further adjusting the model and improving the accuracy of forecasting.
With the proposal of multi-modal modeling and the breakthrough of multi-source data fusion in recent years. Research for ramp events is also not limited to a single data dimension. Peng et al. [37] proposed a graph attention network method (GAT) based on spatio-temporal wind propagation graphs, which emphasizes the complexity of wind propagation at multiple locations, unlike traditional single-site analysis. They first labeled wind power ramp events and non-ramp events as positive and negative samples, performed data preprocessing and input enhancement. By identifying the nodes and edges in the graph, they calculated the weights of the edges to reflect the direction and time of wind propagation, used a time-expanded graph (TEG) to visualize the spatio-temporal wind power generation (STWPG), and finally input the spatio-temporal wind propagation graph into the graph attention network and adjusted the loss function to alleviate the sample imbalance problem of upstream nodes. Liu et al. [38] proposed a sparse spatio-temporal feature descriptor for extracting dynamic spatio-temporal information from continuous grayscale sky images and combined it with spatial pyramid pooling for feature refinement. Chu et al. [39] obtained regional and global weights through all-sky image feature extraction and used a long and short-term memory network as a training model to estimate solar radiation using these weights as inputs. They classified the all-sky image data into four weather conditions: sunny, partly sunny, partly cloudy, and cloudy, and analyzed the solar block image by calculating the solar coordinates, cropping the all-sky image with the sun as the center, extracting cloud contour and thickness features, and calculating the regional weights. Wen et al. [10] applied a multi-step forecasting scheme for the control of PV power ramp rate, and they used a ResNet-18 model for time series solar irradiance forecasting and used a sky image dataset to improve the accuracy of the forecasting by capturing the dynamics of cloud motion from stacked images. To reduce the control failure rate, the traditional PV power fluctuation rate control method is combined with forecasting models for regulation to reduce the control failure rate. Hendrikx et al. [40] also used an all-sky imager (ASI) to collect image data combined with in situ sensor data and external data. They extracted features such as cloud pixels, brightness, edges, and corner points from the ASI images and used optical flow techniques to estimate cloud speed. Ruan et al. [41] compared seven commonly used sky image-based solar forecasting methods and established 72 forecasting setups considering three key parameters: image resolution, image sequence length, and forecasting range. They pointed out that in the future, the use of multi-camera networks or video sequences could be considered to expand the field of view, and the combination of wider spatial information sources such as satellite images could also be considered to improve forecasting accuracy.
Current research on the forecasting of ramp events shows a clear trend from single-model optimization towards multimodal fusion. Future advances are expected to arise from the integration of innovations in traditional neural network optimization, enhanced extraction of multimodal data features, and the hybrid modeling of physical mechanisms with data-driven approaches. These developments have the potential to further improve both the accuracy and interpretability of forecasting systems. However, it is important to recognize several inherent limitations of neural network models. These models can be prone to overfitting, particularly when the available training data are limited or imbalanced, as is often the case with ramp event datasets. Moreover, neural networks frequently lack interpretability, making it challenging for practitioners to understand the basis for their forecasts and to ensure trustworthiness in operational settings. Their performance is also highly dependent on the availability of labeled data and can be sensitive to noise, which may further constrain their effectiveness in real-world applications.
3.3. Evaluation Metrics for Ramp Event Forecasting
Sudden fluctuations in solar radiation intensity or wind speed within a localized region can significantly affect wind and photovoltaic (PV) power generation, a concern that is particularly critical for large, centralized wind and solar farms. However, conventional metrics used to evaluate and optimize forecasting systems—such as root mean square error (RMSE) and general forecasting scores—often fail to adequately capture the performance of these systems in forecasting ramp events. Consequently, there is a clear need to develop and adopt dedicated ramp event metrics that can more effectively assess the forecasting accuracy and reliability specifically for ramp events.
Existing evaluation metrics include root mean square error (RMSE), mean absolute error (MAE), and mean bias error (MBE), which are mainly used to comprehensively assess the overall performance of forecasting; however, they have limited applicability in different contexts such as different locations, time of day, and proportion of clear sky days. Some scholars have proposed using recall rate and F1-score as evaluation metrics for ramp events [14], but this dichotomous definition has met with skepticism from other scholars who have difficulty in interpreting specific aspects of the ramp performance such as the lag in the occurrence of the ramp event as well as the degree of hazard of the ramp event [42].
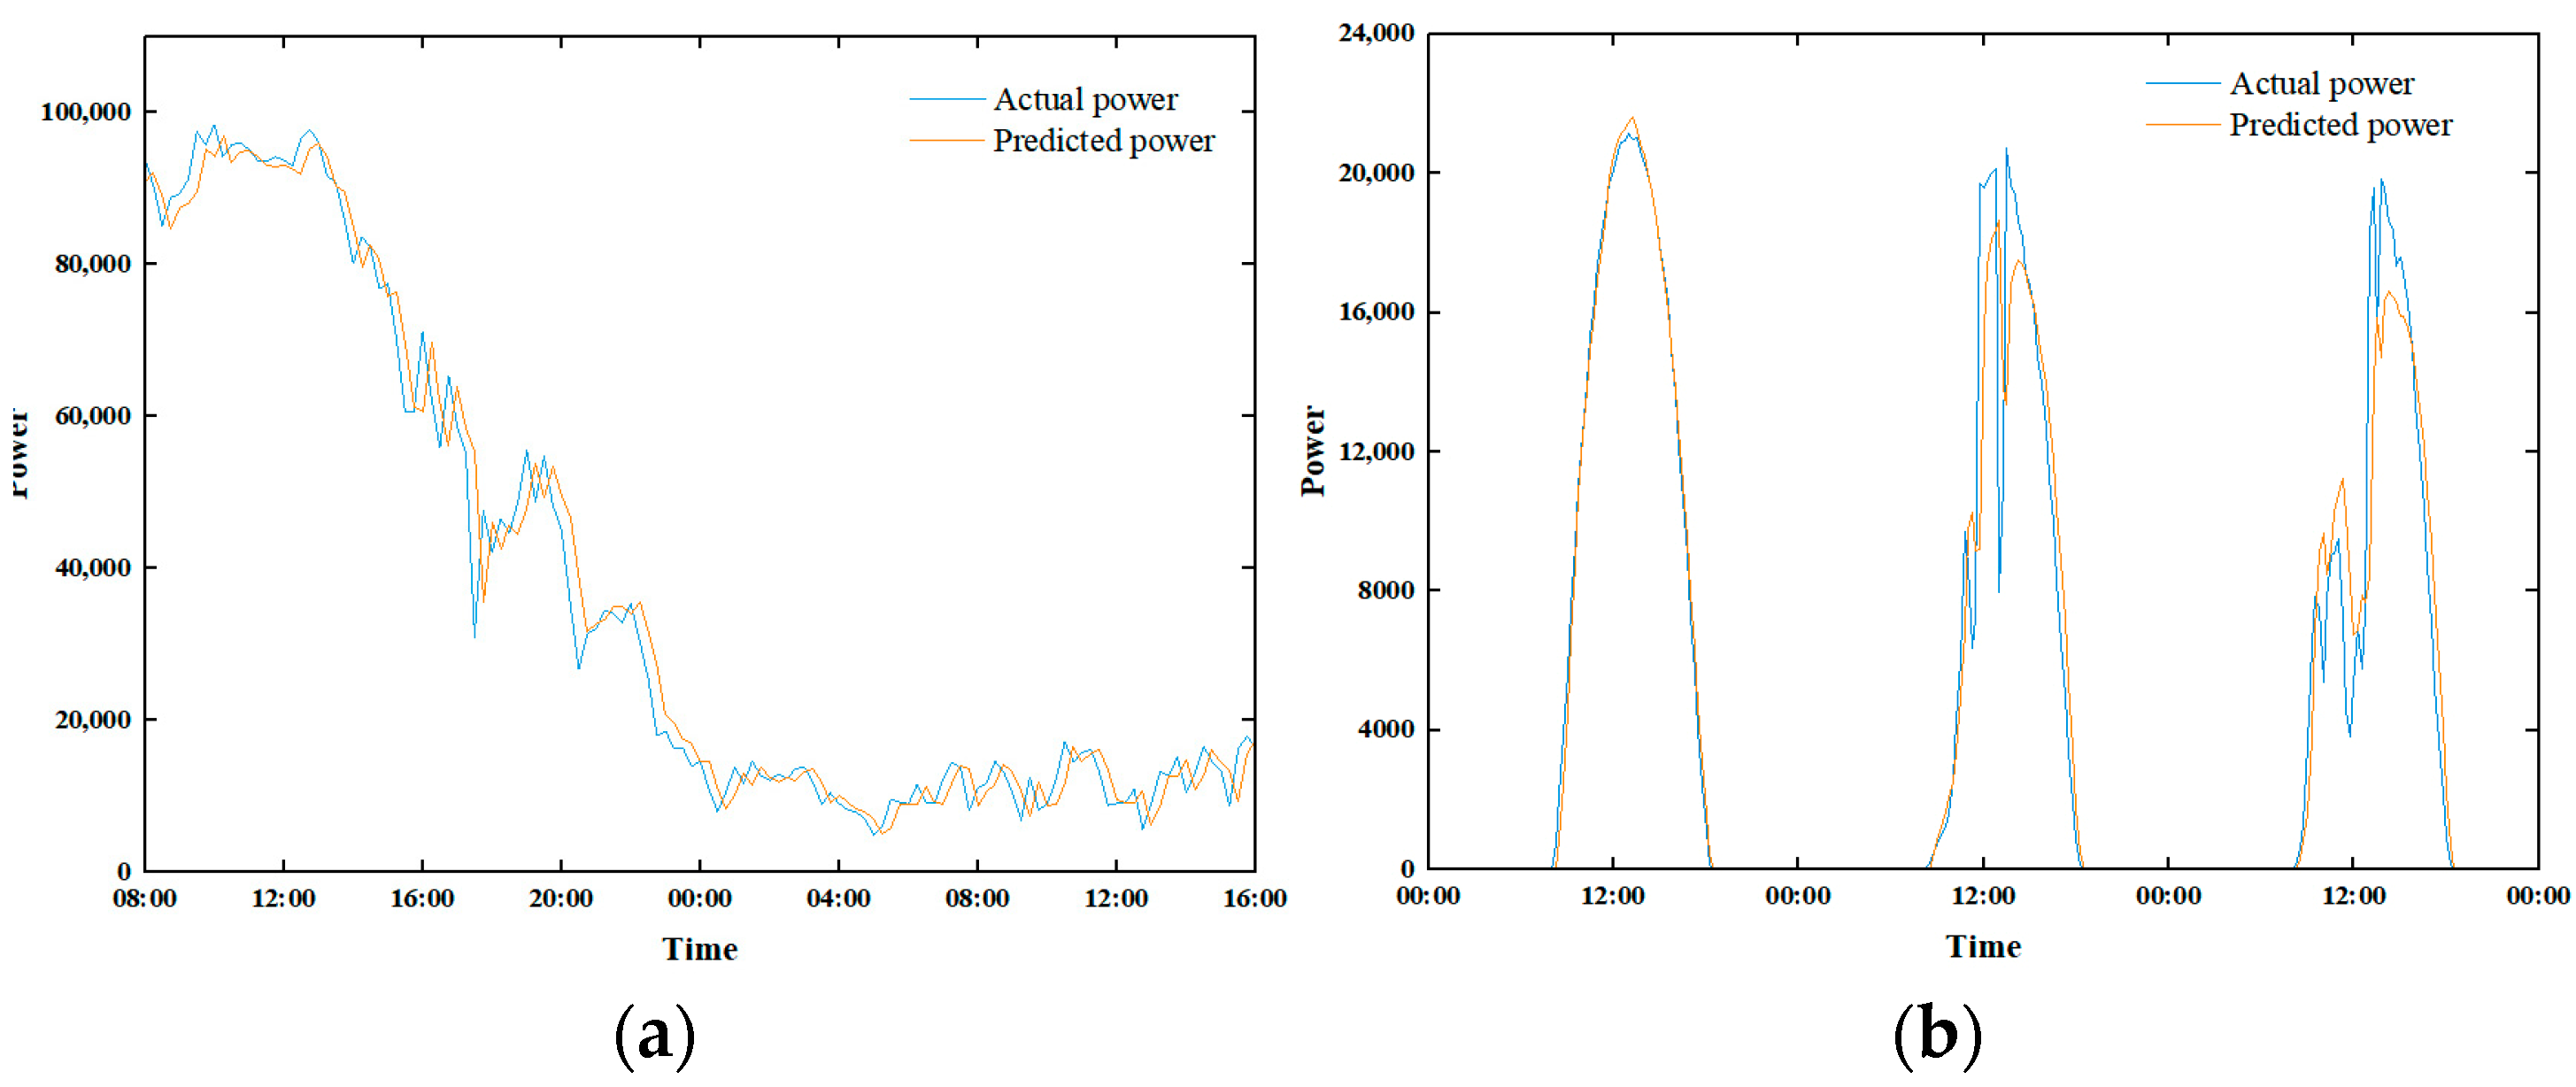
As shown in Figure 3 below, a long short-term memory model (LSTM) is used for forecasting the 15 min resolution wind power data, although the prediction accuracy may vary from model to model, most of the current neural network-based models suffer from the following problems, one of which is that the predicted time point of the occurrence of the ramp event will lag behind, and the other problem is that the magnitude of power change in the localized ramp event is smaller than that of the real power change in the local climbing event is smaller than the power change in the real event. Since traditional neural network prediction models are mainly trained using RMSE as the loss function, which tends to increase the overall weight too much and leads to poor forecasting of local extreme events.
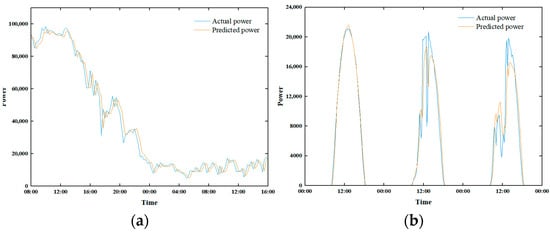
Figure 3.
Schematic diagram of wind power prediction by the LSTM model [31]. (a) Wind power forecasting using LSTM. (b) Solar power forecasting using LSTM.
Therefore, Vallance et al. [43] proposed using the dynamic time warping (DTW) algorithm to quantify temporal misalignment between predicted and measured time series, while the swinging door algorithm was employed to detect the characteristics of ramp events. Regarding ramp event characteristic metrics, Nouri et al. [44] introduced a ramp rate metric, which defines ramp events by comparing the rate of change in radiation intensity with a threshold and incorporates a tolerance window to enhance robustness against noise.
Overall, forecasting metrics for ramp events should not be regarded as exactly equivalent to those used for general power forecasting, as different types of ramp events present varying levels of operational risk and, thus, necessitate tailored evaluation criteria. For instance, when deploying energy storage systems, the stability and volatility of short-term ramps may be of primary concern [5], whereas for dispatch optimization, the focus often shifts to the overall amplitude of medium- and long-term ramps [7].
Despite these developments, a practical framework or guidance for the selection of appropriate ramp event metrics based on specific control strategies remains lacking in the literature. Future work should aim to establish such frameworks, potentially by aligning metric selection with operational objectives and system constraints. Moreover, although several metrics—such as ramp rate, ramp duration, and DTW-based indices—have shown promise, there is still no consensus on the most universally effective ones. Persistent challenges include the tuning of critical parameters (e.g., rate thresholds, window sizes), ensuring metric robustness across diverse datasets, and addressing the generalizability of metrics in cross-dataset or cross-region evaluation. Addressing these gaps will be essential for advancing the practical application and reliability of ramp event forecasting in power system operations.
4. Improving the Accuracy of Ramp Detection and Prediction Using Advanced Artificial Intelligence Methods
In recent years, artificial intelligence technologies—including machine learning, deep learning, and reinforcement learning—have achieved remarkable advancements, demonstrating distinct advantages in data processing, pattern recognition, and predictive modeling.
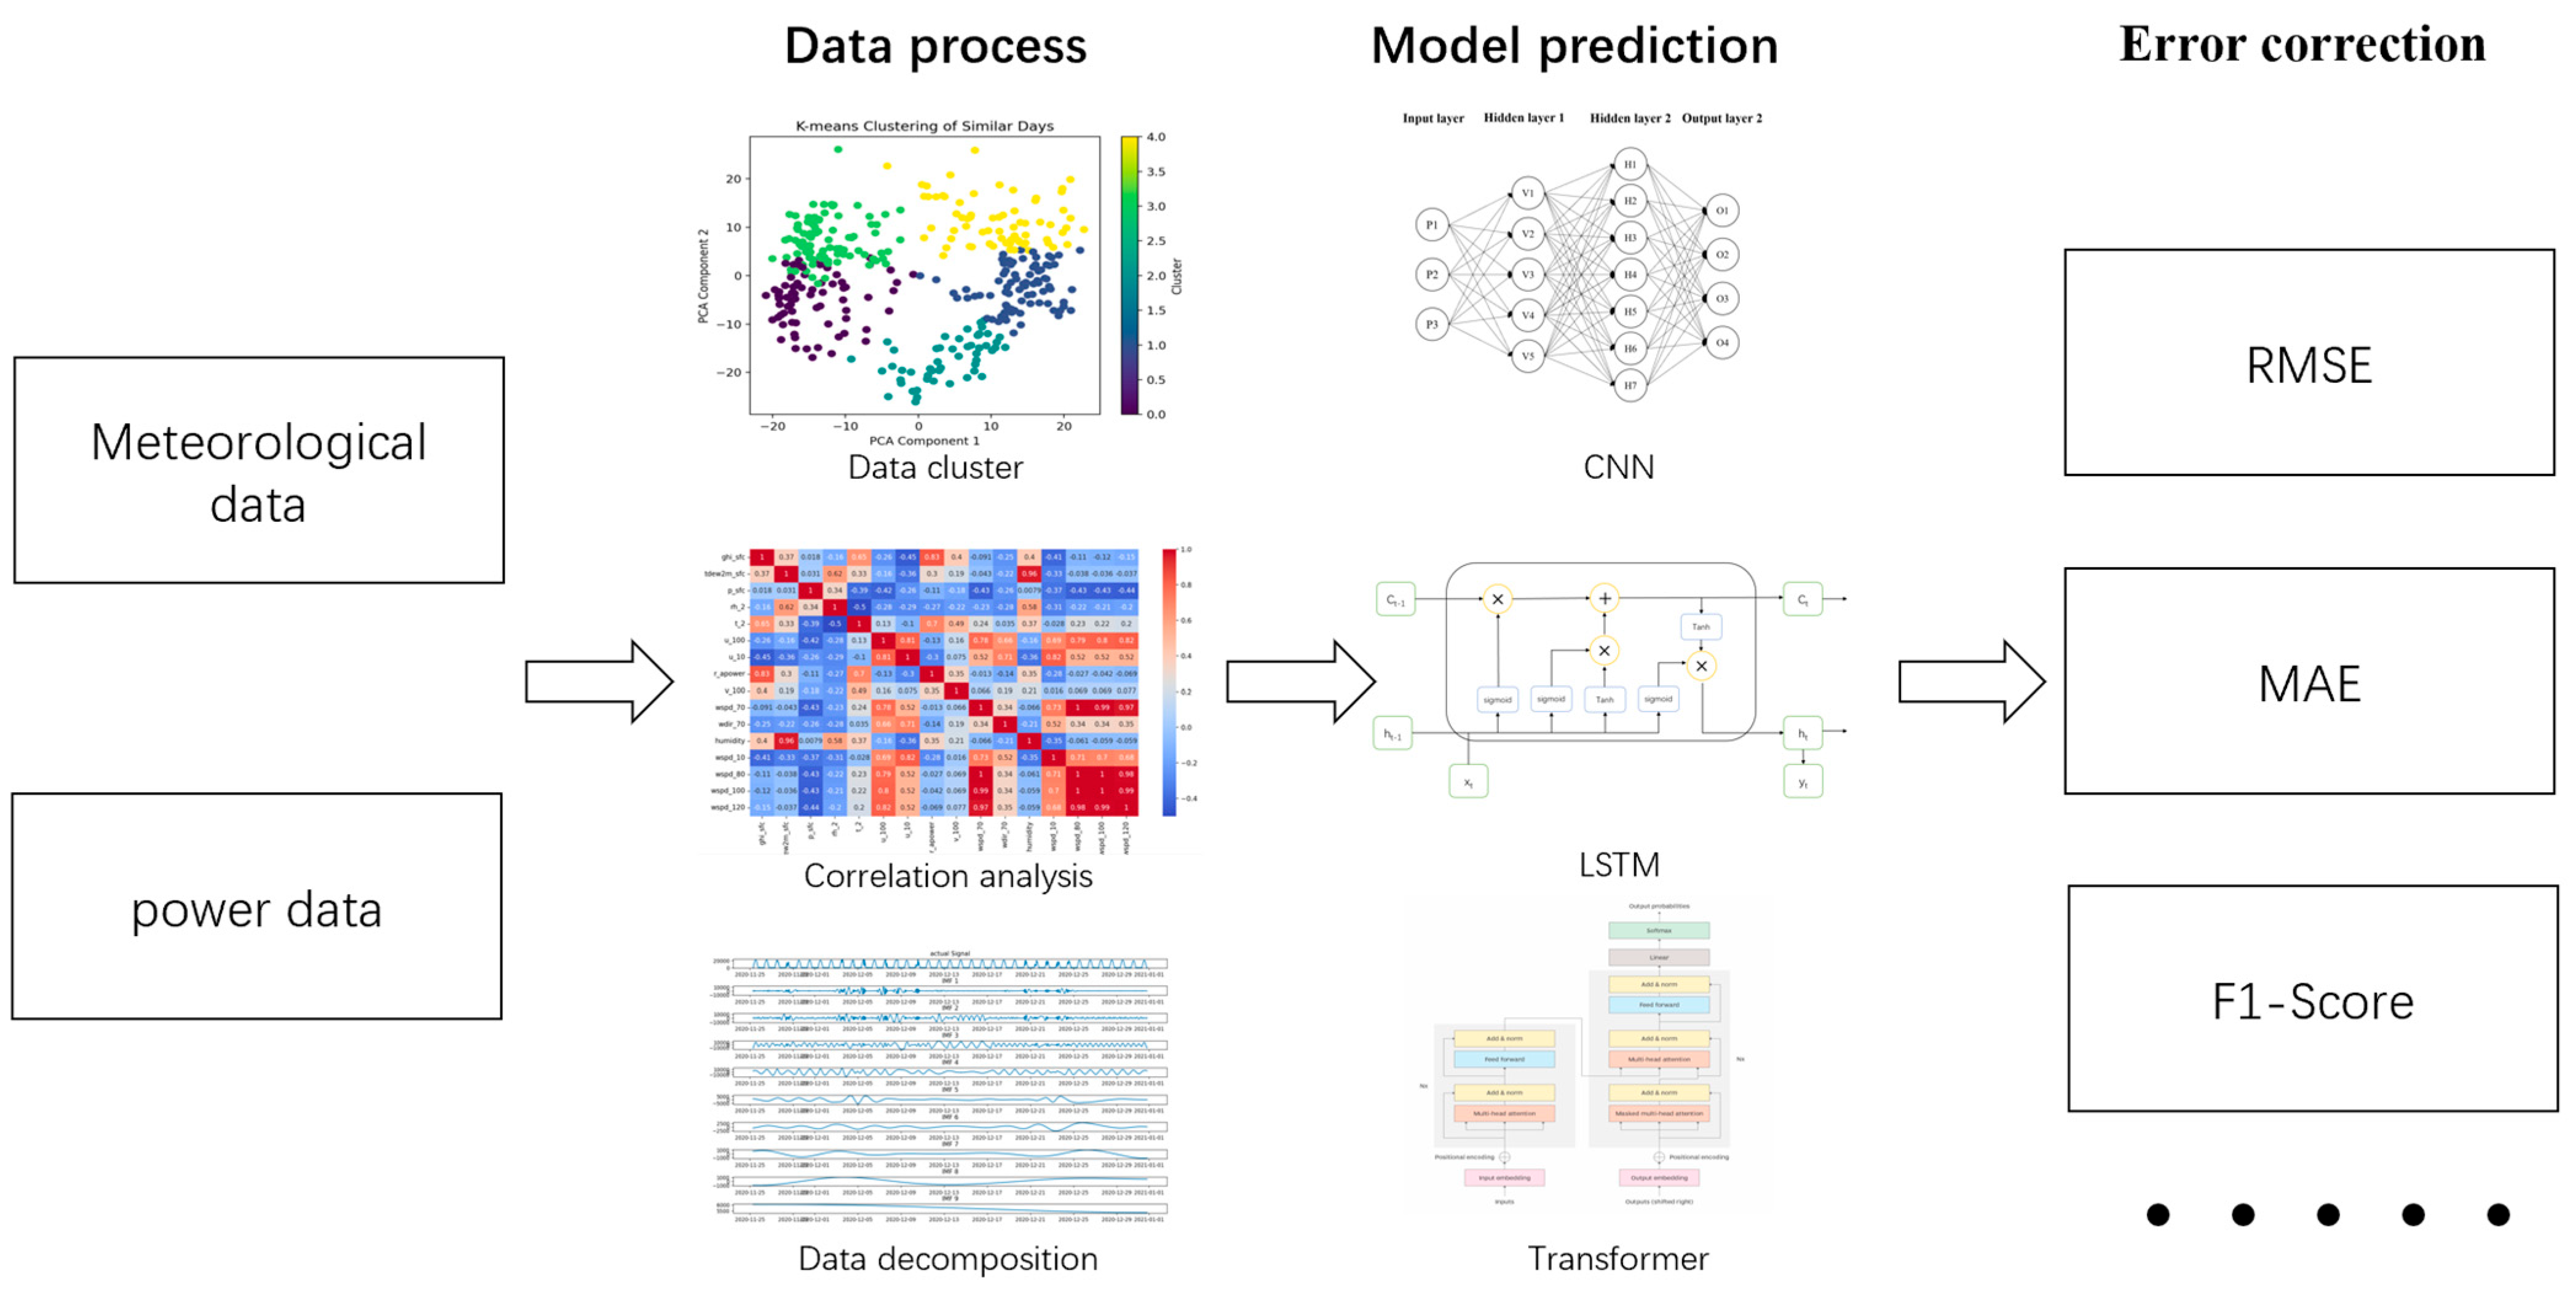
The following figure is the process of ramp event prediction using artificial intelligence predictive models.
As illustrated in Figure 4, the current artificial intelligence-based prediction of power ramp events typically consists of three main stages: data processing, model prediction, and error correction. Each of these stages involves a range of specific techniques and plays a critical role in the overall forecasting pipeline. In the data processing stage, raw meteorological and power data are pre-processed and transformed to enhance the quality and relevance of the information used for modeling. Common approaches include data clustering (e.g., K-means or hierarchical clustering) to identify similar weather patterns or operational days, correlation analysis to quantify relationships between input features and ramp events, and data decomposition methods such as empirical mode decomposition (EMD) or wavelet transforms to isolate meaningful temporal patterns from noisy signals. These techniques help to extract key features and reduce data dimensionality, ultimately improving model interpretability and predictive power. The model prediction stage involves training AI models to learn the complex temporal and nonlinear relationships inherent in ramp event data. Popular models include convolutional neural networks (CNNs), which are adept at capturing spatial and temporal dependencies in multivariate time series; long short-term memory networks (LSTMs), which are well-suited for modeling long-range dependencies and sequential data; and Transformer architectures, which utilize attention mechanisms for improved performance in time series forecasting tasks. The choice of model often depends on the specific characteristics of the data and the prediction horizon. Following prediction, the error correction stage evaluates model performance and may apply post-processing adjustments. Traditional error metrics such as root mean square error (RMSE) and mean absolute error (MAE) are widely used to assess general forecasting accuracy. However, these metrics can be insufficient for ramp event prediction, as they do not directly capture the frequency, magnitude, or timing of rapid changes. Therefore, additional event-based metrics such as the F1-score—which considers the precision and recall of ramp event detection—are increasingly adopted to provide a more comprehensive evaluation.

Figure 4.
Simplified AI Workflow for Power Ramp Event Prediction.
The accompanying Table 3 provides an extensive summary of recent models and methods applied in ramp event prediction. A critical analysis reveals several noteworthy trends. First, models can be broadly grouped into traditional machine learning (e.g., random forests, support vector machines), deep learning (CNNs, LSTMs, Transformers), and hybrid approaches that combine physical and data-driven models. Deep learning models, particularly LSTMs and Transformers, have demonstrated superior performance in capturing complex temporal structures, especially under conditions of high data variability. However, the effectiveness of each approach is often context dependent: for example, CNNs excel in scenarios with strong spatial correlations, while LSTMs are preferred for long-term sequential dependencies.
Table 3.
Data Feature Processing Methods, Prediction Models, and Evaluation Indicators in Recent Literature.
It is also evident that most studies rely on standard accuracy metrics, but there is a growing consensus on the necessity of developing and using specialized ramp event metrics to better reflect operational risks. Nevertheless, challenges remain—such as the tuning of hyperparameters, ensuring robustness across different datasets, and generalizing findings to new geographic regions or operational contexts. Few studies provide comprehensive cross-dataset evaluations, and there is limited guidance on how to select the most appropriate metrics and models for specific control strategies or deployment settings.
Overall, while the rapid proliferation of AI-based methods has greatly advanced ramp event forecasting, there is a clear need for systematic frameworks that guide the selection of models and evaluation metrics based on the characteristics of ramp events and the operational objectives of power systems. Further research should focus on comparative studies, the development of ramp-specific evaluation protocols, and the synthesis of best practices for practical deployment.
4.1. Parameter Adaptation and Dynamic Update of Detection Methods
Traditional ramp detection relies on a single parameter such as the power change rate or a fixed threshold, which is difficult to cope with complex and changing real-world scenarios. For example, it is prone to misjudgment in dynamic environments such as sudden change in wind speed and cloudy weather, while fixed thresholds cannot capture the nonlinear coupling relationship between meteorological conditions and power fluctuations. Therefore, the historical data can be divided into subsets (e.g., high load on sunny days, low irradiation on cloudy days, and sudden change in wind speed, etc.) by meteorological and load characteristics through the multi-parameter segmentation method [22], and a dedicated model can be trained for each subset. Then, the network weights are automatically updated through the real-time data stream using LSTM, Transformer and other models [51], and then the wind speed features are dynamically strengthened to account for the weights in the model during the time of sudden wind speed change, and the irradiance impact factor on power forecasting is adjusted in real time using the clear sky index. Finally, the forecasting error-environmental state feedback loop can be constructed and the adaptive adjustment of the threshold value can be realized by machine learning algorithm [52], so as to reduce the misjudgment rate of the ramp event in the detection of the ramp event, improve the sensitivity of the detection of the ramp event in different weather, and optimize the computational efficiency to meet the real-time scheduling requirements of the power system.
However, several challenges remain unaddressed. The computational cost and scalability of real-time weight updates require further analysis, especially in the context of large-scale, real-time power system operations. Issues such as model stability, concept drift, and the ongoing need for labeled data must also be considered to ensure long-term effectiveness and adaptability. Moreover, while the proposed methods are theoretically promising, empirical validation—such as quantifiable reductions in false positives, increased detection sensitivity, and improved response times—are necessary to substantiate their practical value. Future work should focus on providing detailed implementation strategies, rigorous performance evaluations, and comprehensive analyses of computational and operational impacts.
4.2. Analyzing Ramp Characteristics Using Historical Similarity
The understanding of ramp event regularity may be enhanced by mining similar patterns in historical data. Incorporating the ramp characteristics of historically similar days as prior knowledge into forecasting models—potentially through attention mechanisms that enable the model to focus on relevant historical time periods—could improve the identification of ramp event patterns. Techniques such as dynamic time warping (DTW) or cosine similarity, when combined with features like weather types and seasonal factors, offer promising avenues for filtering and selecting historically analogous days. This approach may enhance the robustness of models in forecasting periodic or episodic ramp events, though its effectiveness remains subject to further empirical validation.
Several recent studies have explored related strategies. For example, Zhu et al. [53] proposed a hybrid method combining path analysis (PA) and phase space reconstruction (PSR) to investigate the multi-scale fluctuation characteristics of PV power. Li et al. [54] utilized event-based K-means clustering to estimate the similarity of consecutive historical ramp events via empirical probability, facilitating the detection of typical event clusters. Zhou et al. [55] applied Pearson’s correlation coefficient across five meteorological variables to measure inter-day similarity, using these results as input to an extreme learning machine (ELM) for similar day forecasting. Li et al. [56] employed both grey correlation analysis and Pearson’s coefficient to search for historically similar days, while Cao et al. [57] transformed wind speed forecasting curves into grayscale images, extracting features with convolutional neural networks (CNN) and using maximum likelihood estimation to probabilistically forecast ramp events.
While the periodic nature of power forecasting is well established, the regularity of ramp event occurrence is less certain. Characterizing historical ramp events could contribute to improved ramp event prediction and, by extension, facilitate the development of more targeted control and scheduling strategies. However, the degree to which leveraging historical analogs reduces the unpredictability and potential impact of ramp events warrants further critical investigation.
Meteorological factors are primary drivers of ramp events in wind and photovoltaic (PV) power systems. The integration of high-precision meteorological data—particularly from advanced numerical weather prediction (NWP) models—has shown considerable promise in improving the forecasting accuracy of such events. Recent advances leverage a range of artificial intelligence (AI) techniques to capture complex spatiotemporal dependencies between meteorological variables and power fluctuations. For example, spatial weather maps are commonly processed with convolutional neural networks (CNNs) to extract image-based features, while temporal patterns are modeled using long short-term memory (LSTM) networks. Graph neural networks (GNNs) have also been applied to explicitly represent and learn the causal relationships between meteorological factors and power changes, which enables the identification of key influencing variables and enhances the early detection of sudden meteorological changes that could lead to ramp events.
Several empirical studies illustrate the diverse approaches in this field. Jin et al. [58] evaluated the forecasting performance of five NWP models for wind change events using wind speed observations from 262 wind farms in China, highlighting the importance of site-specific data in improving model accuracy. Lochmann et al. [59] demonstrated that replacing NWP-modeled wind speed with observed wind speed as an input to artificial neural networks (ANNs) significantly reduced mean absolute error (MAE) in wind power forecasts, particularly during ramp events, compared to NWP-based reference models. Lou et al. [46] proposed a variability reduction model that quantifies PV power fluctuation correlations by considering both along-wind and cross-wind directions under varying meteorological and irradiance conditions, providing a more nuanced understanding of spatial variability.
In the context of feature extraction, Liu et al. [38] introduced a sparse spatiotemporal feature descriptor to enhance the dynamic extraction of information from continuous grayscale sky images, using spatial pyramid pooling for feature refinement. Dense CNNs were used to extract static features from single-frame RGB sky images, resulting in improved nowcasting of local weather events. Sun et al. [60] developed a probabilistic solar forecasting framework that models inter-variable correlations using copula functions and employs Gibbs sampling and Gaussian mixture models to generate realistic weather scenarios—offering a robust probabilistic characterization of forecast uncertainty. More recently, Li et al. [61] explored deep generative diffusion models to simulate weather scenarios from historical data, demonstrating high scalability and the ability to generate thousands of realistic samples at low computational cost. While these generative models enable improved probabilistic forecasting, they may lack interpretability compared to physically based models. Zhang et al. [62] combined CNNs and ANNs for multi-modal feature extraction and fusion, employing a gating mechanism to optimize the integration of spatial and numerical features; however, the computational cost and complexity of such hybrid models may limit real-time operational deployment.
Despite these advancements, direct comparisons between methods remain limited. For instance, while Lochmann et al. [59] report notable reductions in MAE using observed data, few studies systematically evaluate which AI-based approach (e.g., CNN-LSTM, generative modeling, GNNs) yields the greatest improvement in key metrics such as RMSE or forecast lead time under comparable conditions. Furthermore, the trade-off between model scalability, interpretability, and computational burden is seldom addressed in depth.
The utility of high-precision meteorological forecasting datasets in wind and PV power forecasting is expected to increase. However, realizing this potential will require datasets with sufficient temporal resolution, broad geographical coverage, and frequent updates to accurately capture rapidly evolving weather phenomena. Moreover, the integration of such forecasts into real-world power system operations must account for regulatory, technological, and economic constraints, including data latency, system interoperability, and cost–benefit considerations. Addressing these challenges will be crucial for translating methodological advances into practical improvements in ramp event forecasting and grid reliability.
5. Conclusions
This review has systematically examined recent developments in ramp event detection and forecasting. It emphasizes the unique challenges that distinguish ramp event analysis from conventional power prediction. Unlike traditional power forecasting, ramp event studies must consider the localized impact and operational risks of sudden power fluctuations on grid stability. While optimized detection algorithms, such as the swing gate method, have enhanced ramp event identification, their dependence on manually set parameters restricts their adaptability across varying scenarios. This underlines the need for adaptive parameter tuning approaches, such as intelligent optimization algorithms, to improve generalizability and robustness. In forecasting, although neural network models have become prevalent, many rely on loss functions like RMSE that fail to capture the temporal precision and magnitude of ramp events. This often results in delayed or inaccurate predictions that hinder effective grid control. Thus, the adoption of ramp-specific evaluation metrics and exploration of alternative loss functions tailored to operational needs are recommended. A key finding is the growing significance of integrating high-quality meteorological data. The fusion of AI-based multimodal models with physical meteorological models shows promise for improving both interpretability and predictive accuracy. However, practical deployment in real-world energy management systems will require attention to computational efficiency, data quality and availability, and regulatory compliance. Future research should focus on developing adaptive detection algorithms, interpretable multimodal frameworks, standardized benchmarks, and evaluation metrics, and on exploring strategies for operational integration that address computational, data-related, and regulatory challenges. By tackling these issues, the field can advance toward the deployment of robust, accurate, and actionable ramp event forecasting systems that support reliable and efficient grid operation.
Author Contributions
Conceptualization, J.Z. and G.C.; methodology, X.Z.; validation, Y.X.; formal analysis, S.L.; resources, X.Z.; data curation, J.Z.; writing—original draft preparation, G.C.; writing—review and editing, G.C.; visualization, Y.X.; project administration, Y.X.; funding acquisition, S.L. All authors have read and agreed to the published version of the manuscript.
Funding
This paper is supported by the Science and Technology Program of China Southern Power Grid Co., Ltd. (Grant No. YNKJXM20222173), the Reserve Talents Program for Middle-aged and Young Leaders of Disciplines in Science and Technology of Yunnan Province, China (Grant No. 202105AC160014).
Data Availability Statement
The datasets used or analyzed in this study are available from the corresponding author on reasonable request.
Conflicts of Interest
Authors Jie Zhang, Xinchun Zhu, Yigong Xie, and Shuangquan Liu were employed by the company Yunnan Power Grid Co., Ltd. The remaining author declare that the research was conducted in the absence of any commercial or financial relationships that could be construed as a potential conflict of interest.
References
- Gallego-Castillo, C.; Cuerva-Tejero, A.; Lopez-Garcia, O. A review on the recent history of wind power ramp forecasting. Renew. Sustain. Energy Rev. 2015, 52, 1148–1157. [Google Scholar] [CrossRef]
- Shivashankar, S.; Mekhilef, S.; Mokhlis, H.; Karimi, M. Mitigating methods of power fluctuation of photovoltaic (PV) sources—A review. Renew. Sustain. Energy Rev. 2016, 59, 1170–1184. [Google Scholar] [CrossRef]
- Perera, A.T.D.; Nik, V.M.; Chen, D.; Scartezzini, J.-L.; Hong, T. Quantifying the impacts of climate change and extreme climate events on energy systems. Nat. Energy 2020, 5, 150–159. [Google Scholar] [CrossRef]
- Yang, B.; Zhong, L.; Wang, J.; Shu, H.; Zhang, X.; Yu, T.; Sun, L. State-of-the-art one-stop handbook on wind forecasting technologies: An overview of classifications, methodologies, and analysis. J. Clean. Prod. 2021, 283, 124628. [Google Scholar] [CrossRef]
- Samu, R.; Calais, M.; Shafiullah, G.M.; Moghbel, M.; Shoeb, M.A.; Nouri, B.; Blum, N. Applications for solar irradiance nowcasting in the control of microgrids: A review. Renew. Sustain. Energy Rev. 2021, 147, 111187. [Google Scholar] [CrossRef]
- Mansoori, A.; Sheikhi Fini, A.; Parsa Moghaddam, M. Power System Robust Day-ahead Scheduling with the Presence of Fast-Response Resources Both on Generation and Demand Sides under High Penetration of Wind Generation Units. Int. J. Electr. Power Energy Syst. 2021, 131, 107149. [Google Scholar] [CrossRef]
- Wang, Q.; Hodge, B.-M. Enhancing Power System Operational Flexibility With Flexible Ramping Products: A Review. IEEE Trans. Ind. Inf. 2017, 13, 1652–1664. [Google Scholar] [CrossRef]
- Lamsal, D.; Sreeram, V.; Mishra, Y.; Kumar, D. Output power smoothing control approaches for wind and photovoltaic generation systems: A review. Renew. Sustain. Energy Rev. 2019, 113, 109245. [Google Scholar] [CrossRef]
- Pan, Y.; Ju, L.; Yang, S.; Guo, X.; Tan, Z. A multi-objective robust optimal dispatch and cost allocation model for microgrids-shared hybrid energy storage system considering flexible ramping capacity. Appl. Energy 2024, 369, 123565. [Google Scholar] [CrossRef]
- Wen, H.; Du, Y.; Chen, X.; Lim, E.; Wen, H.; Jiang, L.; Xiang, W. Deep Learning Based Multistep Solar Forecasting for PV Ramp-Rate Control Using Sky Images. IEEE Trans. Ind. Inf. 2021, 17, 1397–1406. [Google Scholar] [CrossRef]
- Valldecabres, L.; Von Bremen, L.; Kühn, M. Minute-scale detection and probabilistic prediction of offshore wind turbine power ramps using dual-Doppler radar. Wind Energy 2020, 23, 2202–2224. [Google Scholar] [CrossRef]
- Sevlian, R.; Rajagopal, R. Detection and Statistics of Wind Power Ramps. IEEE Trans. Power Syst. 2013, 28, 3610–3620. [Google Scholar] [CrossRef]
- Ferreira, C.; Gama, J.; Matias, L.; Botterud, A.; Wang, J. A Survey on Wind Power Ramp Forecasting; No. ANL/DIS-10-13; Argonne National Lab (ANL): Argonne, IL, USA, 2011. [Google Scholar]
- Wang, C.; Lin, H.; Yang, M.; Fu, X. Review of Research on New Energy Ramp Events. In Proceedings of the 2023 IEEE/IAS Industrial and Commercial Power System Asia (I&CPS Asia), Chongqing, China, 7–9 July 2023; pp. 1542–1546. [Google Scholar] [CrossRef]
- Ye, L.; Li, Y.; Pei, M.; Li, Z.; Xu, X.J.; Lu, J. Combined approach for short-term wind power forecasting under cold weather with small sample. Proc. CSEE 2023, 43, 543–554. [Google Scholar]
- Kamath, C. Understanding wind ramp events through analysis of historical data. In Proceedings of the IEEE PES T&D 2010, New Orleans, LA, USA, 19–22 April 2010. [Google Scholar]
- Greaves, B.; Collins, J.; Parkes, J.; Tindal, A. Temporal Forecast Uncertainty for Ramp Events. Wind Eng. 2009, 33, 309–319. [Google Scholar] [CrossRef]
- Cutler, N.; Kay, M.; Jacka, K.; Nielsen, T.S. Detecting, categorizing and forecasting large ramps in wind farm power output using meteorological observations and WPPT. Wind Energy 2007, 10, 453–470. [Google Scholar] [CrossRef]
- Florita, A.; Hodge, B.-M.; Orwig, K. Identifying Wind and Solar Ramping Events. In Proceedings of the 2013 IEEE Green Technologies Conference (GreenTech), Denver, CO, USA, 4–5 April 2013; pp. 147–152. [Google Scholar] [CrossRef]
- Cui, M.; Zhang, J.; Florita, A.R.; Hodge, B.-M.; Ke, D.; Sun, Y. An Optimized Swinging Door Algorithm for Identifying Wind Ramping Events. IEEE Trans. Sustain. Energy 2016, 7, 150–162. [Google Scholar] [CrossRef]
- Cui, Y.; He, Y.; Xiong, X.; Chen, Z.; Li, F.; Xu, T.; Zhang, F. Algorithm for identifying wind power ramp events via novel improved dynamic swinging door. Renew. Energy 2021, 171, 542–556. [Google Scholar] [CrossRef]
- Lyners, D.; Vermeulen, H.; Groch, M. Wind power ramp event detection using a multi-parameter segmentation algorithm. Energy Rep. 2021, 7, 5536–5548. [Google Scholar] [CrossRef]
- Cui, M.; Zhang, J.; Feng, C.; Florita, A.R.; Sun, Y.; Hodge, B.-M. Characterizing and analyzing ramping events in wind power, solar power, load. Renew. Energy 2017, 111, 227–244. [Google Scholar] [CrossRef]
- Zhu, W.; Zhang, L.; Yang, M.; Wang, B. Solar Power Ramp Event Forewarning With Limited Historical Observations. IEEE Trans. Ind. Applicat. 2019, 55, 5621–5630. [Google Scholar] [CrossRef]
- Raj, R.P.; Kowli, A. Characterizing the ramps and noise in solar power imbalances. Sol. Energy 2022, 247, 531–542. [Google Scholar] [CrossRef]
- Gallego, C.; Costa, A.; Cuerva, Á.; Landberg, L.; Greaves, B.; Collins, J. A wavelet-based approach for large wind power ramp characterisation. Wind Energy 2013, 16, 257–278. [Google Scholar] [CrossRef]
- Hannesdóttir, Á.; Kelly, M. Detection and characterization of extreme wind speed ramps. Wind Energy Sci. 2019, 4, 385–396. [Google Scholar] [CrossRef]
- Cui, M.; Ke, D.; Sun, Y.; Gan, D.; Zhang, J.; Hodge, B.-M. Wind Power Ramp Event Forecasting Using a Stochastic Scenario Generation Method. IEEE Trans. Sustain. Energy 2015, 6, 422–433. [Google Scholar] [CrossRef]
- Cui, M.; Zhang, J.; Wang, Q.; Krishnan, V.; Hodge, B.-M. A Data-Driven Methodology for Probabilistic Wind Power Ramp Forecasting. IEEE Trans. Smart Grid 2019, 10, 1326–1338. [Google Scholar] [CrossRef]
- Ouyang, T.; Zha, X.; Qin, L.; He, Y.; Tang, Z. Prediction of wind power ramp events based on residual correction. Renew. Energy 2019, 136, 781–792. [Google Scholar] [CrossRef]
- Zhou, B.; Duan, H.; Wu, Q.; Wang, H.; Or, S.W.; Chan, K.W.; Meng, Y. Short-term prediction of wind power and its ramp events based on semi-supervised generative adversarial network. Int. J. Electr. Power Energy Syst. 2021, 125, 106411. [Google Scholar] [CrossRef]
- Cui, Y.; Chen, Z.; He, Y.; Xiong, X.; Li, F. An algorithm for forecasting day-ahead wind power via novel long short-term. Energy 2023, 263, 125888. [Google Scholar] [CrossRef]
- Fantini, D.G.; Silva, R.N.; Siqueira, M.B.B.; Pinto, M.S.S.; Guimarães, M.; Brasil, A.C.P. Wind speed short-term prediction using recurrent neural network GRU model and stationary wavelet transform GRU hybrid model. Energy Convers. Manag. 2024, 308, 118333. [Google Scholar] [CrossRef]
- Hu, J.; Zhang, L.; Tang, J.; Liu, Z. A novel transformer ordinal regression network with label diversity for wind power ramp events forecasting. Energy 2023, 280, 128075. [Google Scholar] [CrossRef]
- Zhang, Y.; Chen, B.; Pan, G.; Zhao, Y. A novel hybrid model based on VMD-WT and PCA-BP-RBF neural network for short-term wind speed forecasting. Energy Convers. Manag. 2019, 195, 180–197. [Google Scholar] [CrossRef]
- Wang, H.; Yi, H.; Peng, J.; Wang, G.; Liu, Y.; Jiang, H.; Liu, W. Deterministic and probabilistic forecasting of photovoltaic power based on deep convolutional neural network. Energy Convers. Manag. 2017, 153, 409–422. [Google Scholar] [CrossRef]
- Peng, X.; Li, Y.; Tsung, F. A graph attention network with spatio-temporal wind propagation graph for wind power ramp events prediction. Renew. Energy 2024, 236, 121280. [Google Scholar] [CrossRef]
- Liu, J.; Zang, H.; Ding, T.; Cheng, L.; Wei, Z.; Sun, G. Harvesting spatiotemporal correlation from sky image sequence to improve ultra-short-term solar irradiance forecasting. Renew. Energy 2023, 209, 619–631. [Google Scholar] [CrossRef]
- Chu, T.-P.; Guo, J.-H.; Leu, Y.-G.; Chou, L.-F. Estimation of solar irradiance and solar power based on all-sky images. Sol. Energy 2023, 249, 495–506. [Google Scholar] [CrossRef]
- Hendrikx, N.Y.; Barhmi, K.; Visser, L.R.; De Bruin, T.A.; Pó, M.; Salah, A.A.; Van Sark, W.G.J.H.M. All sky imaging-based short-term solar irradiance forecasting with Long Short-Term Memory networks. Sol. Energy 2024, 272, 112463. [Google Scholar] [CrossRef]
- Ruan, G.; Chen, X.; Lim, E.G.; Fang, L.; Su, Q.; Jiang, L.; Du, Y. On the use of sky images for intra-hour solar forecasting benchmarking: Comparison of indirect and direct approaches. Sol. Energy 2024, 276, 112649. [Google Scholar] [CrossRef]
- Gharaie, M.M.; Sezer, D.; Zareipour, H. An Updated Review and Comparison of Wind Power Ramp Detection Techniques. In Proceedings of the 2024 IEEE Canadian Conference on Electrical and Computer Engineering (CCECE), Kingston, ON, Canada, 6–9 August 2024; pp. 829–834. [Google Scholar] [CrossRef]
- Vallance, L.; Charbonnier, B.; Paul, N.; Dubost, S.; Blanc, P. Towards a standardized procedure to assess solar forecast accuracy: A new ramp and time alignment metric. Sol. Energy 2017, 150, 408–422. [Google Scholar] [CrossRef]
- Nouri, B.; Fabel, Y.; Blum, N.; Schnaus, D.; Zarzalejo, L.F.; Kazantzidis, A.; Wilbert, S. Ramp Rate Metric Suitable for Solar Forecasting. Sol. RRL 2024, 2400468. [Google Scholar] [CrossRef]
- Song, W.; Yan, J.; Han, S.; Liu, S.; Wang, H.; Dai, Q.; Huo, X.; Liu, Y. A multi-task spatio-temporal fusion network for offshore wind power ramp events forecasting. Renew. Energy 2024, 237, 121774. [Google Scholar] [CrossRef]
- Lou, S.; Zhang, D.; Li, D.H.W.; Huang, Y. Evaluating solar ramp rate correlations by simple radiation and wind measurements. Renew. Energy 2024, 235, 121358. [Google Scholar] [CrossRef]
- He, Y.; Zhu, C.; Cao, C. A wind power ramp prediction method based on value-at-risk. Energy Convers. Manag. 2024, 315, 118767. [Google Scholar] [CrossRef]
- Yu, M.; Niu, D.; Gao, T.; Wang, K.; Sun, L.; Li, M.; Xu, X. A novel framework for ultra-short-term interval wind power prediction based on RF-WOA-VMD and BiGRU optimized by the attention mechanism. Energy 2023, 269, 126738. [Google Scholar] [CrossRef]
- Ye, L.; Peng, Y.; Li, Y.; Li, Z. A novel informer-time-series generative adversarial networks for day-ahead scenario generation of wind power. Appl. Energy 2024, 364, 123182. [Google Scholar] [CrossRef]
- Wang, J.; Liu, Y.; Li, Y. A parallel differential learning ensemble framework based on enhanced feature extraction and anti-information leakage mechanism for ultra-short-term wind speed forecast. Appl. Energy 2024, 361, 122909. [Google Scholar] [CrossRef]
- Yang, J.; Xu, S.; Jiang, S.; Liu, Y.; Ko, D.; Xu, J. Rolling correction model of ramp for wind power based on dynamic time warping. Autom. Electr. Power Syst. 2021, 45, 152–159. [Google Scholar]
- Keerthisinghe, C.; Silva, A.R.; Tardáguila, P.; Horváth, G.; Deng, A.; Theis, T.N. Improved Short-Term Wind Power Forecasts: Low-Latency Feedback Error Correction Using Ramp Prediction and Data From Nearby Farms. IEEE Access 2023, 11, 128697–128705. [Google Scholar] [CrossRef]
- Zhu, J.; Li, M.; Luo, L.; Zhang, B.; Cui, M.; Yu, L. Short-term PV power forecast methodology based on multi-scale fluctuation characteristics extraction. Renew. Energy 2023, 208, 141–151. [Google Scholar] [CrossRef]
- Li, J.; Song, T.; Liu, B.; Ma, H.; Chen, J.; Cheng, Y. Forecasting of Wind Capacity Ramp Events Using Typical Event Clustering Identification. IEEE Access 2020, 8, 176530–176539. [Google Scholar] [CrossRef]
- Zhou, Y.; Zhou, N.; Gong, L.; Jiang, M. Prediction of photovoltaic power output based on similar day analysis, genetic algorithm and extreme learning machine. Energy 2020, 204, 117894. [Google Scholar] [CrossRef]
- Li, Q.; Zhang, X.; Ma, T.; Jiao, C.; Wang, H.; Hu, W. A multi-step ahead photovoltaic power prediction model based on similar day. Energy 2021, 224, 120094. [Google Scholar] [CrossRef]
- Cao, B.; Chang, L.; Gong, X.; Pijnenburg, P.; Levy, T.; Kilpatrick, R. Day-ahead wind power ramp forecasting using an image-based similarity search strategy. IET Renew. Power Gen 2023, 17, 271–278. [Google Scholar] [CrossRef]
- Jin, C.; Yang, Y.; Han, C.; Lei, T.; Li, C.; Lu, B. Evaluation of forecasted wind speed at turbine hub height and wind ramps by five NWP models with observations from 262 wind farms over China. Meteorol. Appl. 2024, 31, e70007. [Google Scholar] [CrossRef]
- Lochmann, M.; Kalesse-Los, H.; Schäfer, M.; Heinrich, I.; Leinweber, R. Analysing wind power ramp events and improving very short-term wind power predictions by including wind speed observations. Wind Energy 2023, 26, 573–588. [Google Scholar] [CrossRef]
- Sun, M.; Feng, C.; Zhang, J. Probabilistic solar power forecasting based on weather scenario generation. Appl. Energy 2020, 266, 114823. [Google Scholar] [CrossRef]
- Li, L.; Carver, R.; Lopez-Gomez, I.; Sha, F.; Anderson, J. Generative emulation of weather forecast ensembles with diffusion models. Sci. Adv. 2024, 10, eadk4489. [Google Scholar] [CrossRef]
- Zhang, L.; Wilson, R.; Sumner, M.; Wu, Y. Advanced multimodal fusion method for very short-term solar irradiance. Renew. Energy 2023, 216, 118952. [Google Scholar] [CrossRef]
Disclaimer/Publisher’s Note: The statements, opinions and data contained in all publications are solely those of the individual author(s) and contributor(s) and not of MDPI and/or the editor(s). MDPI and/or the editor(s) disclaim responsibility for any injury to people or property resulting from any ideas, methods, instructions or products referred to in the content. |
© 2025 by the authors. Licensee MDPI, Basel, Switzerland. This article is an open access article distributed under the terms and conditions of the Creative Commons Attribution (CC BY) license (https://creativecommons.org/licenses/by/4.0/).