Abstract
In the housing sector emission reduction builds on a shift from fossil fuels to renewable energy sources and increasing the efficiency of energy usage, with heating playing a dominant role in comparison to that of electricity. For electricity production in the residential sector, research shows that different settings of (co-)ownership in renewables are linked to a greater tendency to invest in energy-efficient devices or to adopt more energy-conscious behaviours. The empirical analysis demonstrates that fully-fledged prosumers, i.e., consumers who have the option to choose between self-consumption and selling to third parties or the grid, exhibit a higher tendency to invest in energy efficiency and that only this group manifests a greater likelihood of engaging in conscious-energy consumption behaviour. This paper extends the analysis to include heating in the residential sector. The study conducted an ANCOVA based on a sample of 2585 German households. The findings show that, depending on the (co-)ownership setting, the willingness to invest and to adopt energy-efficient practices grows considerably. Consumer-sellers demonstrate the highest willingness to invest and adapt energy conscious behaviour. Furthermore, regarding heating in particular, self-consumers are also inclined to invest and engage in energy-savings behaviour.
1. Introduction
Decarbonization of the residential sector is one of the key elements of the European climate strategy [1,2,3], combining the increasing supply of renewable energy (RE) production with energy efficiency (EE) improvement strategies [4,5]. In the first area, advances have been achieved [6,7], with the considerable transition of the European energy mix to renewable sources, including photovoltaics and wind power, mainly driven by technological advances and government incentives [7]. However, to achieve the decarbonization goals, it is necessary to expand the advances also to EE, including residential heating and mobility, with a potential remaining largely unexploited [8,9,10]. The energy distribution system, designed for centralized energy production, faces a need for constant restructuring parallel to an increase in volatile energy sources and systems designed for predictable outputs. The residential sector is crucial since the increase in RE production must be accompanied by an increase in demand-side flexibility [11,12]. To reinforce the central role of households, it is essential to engage consumers in this transition requiring integrated policies that combine technological innovation and financial incentives, accompanied by the promotion of social justice [13].
Research has consistently highlighted the importance of prosumership and RE (co-)ownership for the energy transition [11,12,14]. Prosumers are citizens generating the clean energy they consume, typically (co-)owning the RE production installations concerned. Depending on its consumption and production profiles, prosumership has different behavioural implications associated with its energy consumption [11,12], inter alia, a significantly greater willingness to invest in EE measures and adapting energy efficient usage [14]. However, significant differences stand out depending on the options for use/consumption that these (co-)owners have with a distinction of three settings: self-consumers, consumer-sellers, and only sellers of the energy produced [15]. Roth et al. demonstrated that those who have the choice between the options to self-consume and sell the energy produced differ most significantly from non-owners [14]; their empirical results, however, are limited to the electricity sector, thus excluding in particular usage, investment, and EE patterns in heating.
In the European context, heating is considered one of the main drivers of residential energy consumption [16]. In countries such as Germany, heating represents the largest portion of energy consumption in homes with higher expenditures when compared to electricity [16]. Despite its importance for living costs, the pace of measures to improve heating efficiency has not been sufficient [17], especially when compared with the improvements seen in the efficiency of electricity technologies and usage [18]. Some factors may help to explain this disparity; the nature of heating systems requires a higher initial investment and structural changes when compared to those made for electricity [19,20]. The cost of adopting EE technologies is also associated with financial obstacles, resulting often in a situation where using gas or heating remains the most economical option for households even when they acknowledge the environmental benefits of clean energy [21]. The cost factor is emphasised, as the cost–benefit relation of energy conservation measures is usually not associated with reduced investment costs in more efficient heating systems [22], making the technological change dependant on public subsidies [23].
When considering behavioural patterns of consumption, those related to heating are associated with daily practices and historical preferences that make behavioural change more difficult to achieve [24,25], while those associated with electricity are more easily adopted, especially when financial incentives exist [14]. Thus, while EE policies generally contribute to the reduction of energy consumption, comfort rebounds may have diminished these gains for heating [26].
Decisions associated with investments in heating technologies are, therefore, subject to greater scrutiny and require greater consideration before being carried out. At the same time, behaviour associated with home heating consumption appears to relate to subjective factors, comfort perspectives rooted in domestic routines and long-term habits, cultural and historical factors. This perspective makes it difficult to use simple economic rationalizations about whether or not to use heating and the effect of behavioural nudges [27]. The differences in EE investments and behavioural adaptation to heating therefore differ significantly from those concerning electricity [28,29] and, therefore, research results cannot be translated straight forward to the heating field, suggesting a need for specific sector-focused research. To fill this gap, expanding Roth et al.’s analytical framework [14], we apply the same methodology to investigate heating-related EE usage and willingness to invest in the domestic sector. To do so, we undertook a survey with data collected from 2585 German households in 2023, investigating how different forms of (co-)ownership with different usage modalities impact the behavioural patterns of households, focusing not only on electricity-related EE but also on heating.
The following is the literature review.
2. Literature Review
Energy efficiency is one of the fundamental pillars of sustainable energy strategies, being mainly associated with the installation of energy-efficient technology (EET) and the optimization of energy services [30,31,32,33,34]. This traditional view of EE, however, focuses mainly on technological improvements that can lead to energy savings while often ignoring how outcomes can vary significantly depending on behavioural changes and levels of technology adoption [34], and how these factors are influenced by socioeconomic dimensions [34,35] such as income level or political inclinations [36].
Another perspective of EE studies considers the decrease in demand not only through technological modernization and adoption but also through conscious energy behaviour usage. It takes into account that decisions regarding EE are outside the rationality of cost–benefit analysis, being shaped as well by comfort preferences, trust in new technologies, and household routines [37]. Technology adoption, in this perspective, involves one-time actions such as the acquisition of more efficient devices, whereas behaviour change entails repetitive changes in habits [35,38,39]. Both of these dimensions are interdependent and must be considered together to fully grasp the potential of EE [40].
Although the focus on financial returns and the rationality of decision-making [41] have long dominated the discussion, recent studies have taken into account the centrality of behavioural considerations. Evidence suggests that EE adoption cannot be fully attributed to economic returns and should consider in the analyses the influences of environmental consciousness, lifestyle choices, and social influence as well [42]. Sociodemographic variables, then, appear as significant determinants for EE adoption [43]. For Frederiks et al. (2015) [44] higher levels of education and environmental awareness are associated with a higher willingness to invest in EE, while Rekker et al. (2024) [45] show that those same sociodemographic motivators can also be moderated by different factors, such as previous experience or knowledge regarding EE measures. The mixed results of the correlation between income level and willingness to invest or modify behaviour association further validate the hypothesis that household energy behaviour cannot be explained by financial incentives alone.
In a scenario where RE usage is increasing in popularity, participatory schemes—i.e., (co-)ownership of renewable technology—have been proposed as a possible way of engaging citizens and raising their awareness of EE and system flexibility [46]. Different research shows that involvement in RE can promote a more energy-efficient behaviour [11,12,47,48,49], although these findings are sometimes mixed. Steg et al. (2009) [36] and Yildiz and Sagebiel (2019) [42] show that while energy cooperatives promote individuals’ participation and feeling of ownership, their net contribution to energy savings is uncertain. Additionally, though energy cooperative membership is linked with increased energy awareness, the impact varies on policy design and household constraints [42].
Hoseinpoori et al. (2018) [50] and Bauwens (2016) [51] point out that RE (co-)ownership can, contrary to the expected, be associated with increased overall energy use. The rebound effect, i.e., efficiency gains are shadowed by increased consumption, limits economic benefits and environmental gains [52,53,54]. This effect is of particular relevance for the discussion on heat decarbonization, as empirical evidence shows that heating-related rebound effects can reach up to 30%, significantly undermining expected savings [55,56]. A significant addition to this discussion is the research by Roth et al. (2023) [14], which goes beyond the simple dichotomy of RE installation owners vs. non-owners and investigates heterogeneity within various settings of (co-)ownership. The results show considerable heterogeneity in willingness to invest in EET and adopt energy conservation building (ECB) among different settings of (co-)ownership, for self-usage, for self-consumption and to sell, and just for selling. The study demonstrates that while ownership is generally associated with greater willingness to invest and adapt behaviour, only certain settings—particularly those with more control over and flexibility in using the generated energy—show higher degrees of energy-conscious behaviour. However, the analysis by Roth et al. (2023) [14] does not address the heating sector specificities, focusing exclusively on electricity use.
Yet, there are fundamental differences between the two realms, as investments in electricity are often easier to be incorporated in system infrastructure, while investments in heating not only require larger sums, but relevant technologies often require comprehensive structural changes [57,58]. At the behavioural level, heating consumption is strongly linked to thermal comfort perceptions, familiarity with traditional heating systems, and habitual routines—factors that make implementing and sustaining behavioural change in heating usage more complex [19,50]. In places where electricity prices are below average, the incentive to alter habits and adopt energy-efficient ones is reduced [20], and the higher costs of operation for heating, especially in geographies with colder climates, justifies specific public policy measures like subsidies or incentives for adopting energy efficient technologies or change in behaviour [58,59].
In regard to EE, the findings from Roth et. al. (2023) [14] show that the type of interaction between households and RE production affects both the investment willingness and behavioural tendencies. However, by focusing on electricity alone, the study leaves it open as to how those patterns apply to heating, which as mentioned involves distinct infrastructure, motivations, and habits.
Despite the centrality in household energy consumption, heating has received comparatively little attention in the literature. While several studies have explored technical and economic barriers in adopting heating-related energy efficiency technologies, few have examined the social and behavioural dimensions, such as how heating consumption habits respond to (co-)ownership settings, financial incentives, and feedback mechanisms. Even within research on prosumership and energy (co-)ownership, heating is either excluded from analyses or considered in an aggregated manner within household energy usage. This limitation is particularly alarming considering the sector’s impact on residential energy demand and the difficulty of adapting habits in this sector.
To our knowledge, no previous study has systematically investigated how different RE (co-)ownership approaches—self-consumption, consumption-seller, or pure selling—affect EE behaviour and willingness to invest, especially in the heating sector. To address this gap, this article builds on the foundations set by Roth et al. (2023) [14] and incorporates both electricity and heating to the analysis of renewable energy (co-)ownership’s effect under different settings. Grounded in this theoretical framework, and in the light of the evidence reviewed above, this article puts forward the following four hypotheses:
H1.
Individuals’ willingness to invest in energy-efficient electricity technologies varies according to whether they (co-)own RE installations linked to specific usage possibilities of self-generated electricity.
H2.
Individuals’ willingness to engage in in energy-efficient behaviour regarding electricity consumption varies according to whether they (co-)own RE installations linked to specific usage possibilities of self-generated electricity.
H3.
Individuals’ willingness to invest in energy-efficient heating technologies varies according to whether they (co-)own RE installations linked to specific usage possibilities of self-generated electricity.
H4.
Individuals’ willingness to engage in in energy-efficient behaviour regarding heating consumption varies according to whether they (co-)own RE installations linked to specific usage possibilities of self-generated electricity.
In the following we test these hypotheses.
3. Materials and Methods
This section presents the methodology used in our study. It presents (1) the data collection and the strategy employed for the sampling process, including the respondent recruitment and the balancing used in the target group; (2) the construction of indexes to capture the willingness to invest in and to adopt energy-efficient behaviours; and finally, (3) the specification of the statistical models used to test the hypotheses. Each step was designed to ensure alignment with previous work [14], while adapting the analytical framework to include research related to heating behaviours and investments.
3.1. Data and Sampling
The details of the data collection method used in this study are laid out in [46], where the basic questionnaire that this article rests on was already used, albeit without covering heating. At the time, the questionnaire was developed based on earlier surveys inspired by [11,14]. In their work, Ref. [14] collected data through a German real estate platform, aiming to reach a substantial number of (co-)owners. This previous survey acted as a basis for designing our own, with the goal of assessing EE behaviours and demand-side flexibility among RE prosumers [46]. At the time of survey deployment, the authors aimed to meet the research project’s objectives by maximizing prosumer representation and ensuring an even distribution across income levels and gender, with particular attention to reaching more female and low-income prosumers [46]. The survey was carried out by Norstat between August and November of 2023, using its respondents’ panel and applying filters developed in collaboration with our research team to target relevant prosumer profiles [46]. These filters were adjusted during the data collection period to better reach the specific target groups.
The final sample consists of 2585 completed questionnaires, including 925 identified prosumers, 464 of whom are female. This dataset provides a robust foundation for analysing prosumer behaviour and comparing it with non-prosumers, while controlling for various socioeconomic and demographic characteristics [46].
The required sample sizes for the analysis were determined using power analysis. Parameters were based on Roth et al.’s (2023) [14] original work and followed recommended thresholds from the literature, applying similar conditions found in related energy research [60]. The required sample sizes were thus met. Table 1 displays the distribution of ownership groups, and the power analysis results are presented in Appendix A.

Table 1.
Group distribution.
The number of prosumers in Germany is difficult to define due to data fragmentation and different and contrasting information. However, estimates indicate that there are between 1.5 and 2 million prosumer households, surpassing 1.8 million small-scale PV systems registered under the Renewable Energy Sources Act (EEG) in 2019 [61]. Other studies also point to the increasing number of prosumers participating in the German energy transition [62,63]. In this context, the sample of 2585 respondents, of which 925 are identified as prosumers, represents a valid subsample, with sufficient statistical power for the study. In our study, we do not seek to estimate national proportions, but to understand differences between groups and behavioural patterns across different (co-)ownership settings.
As anticipated, some respondents were unwilling or unable to specify their exact income. In such cases, we used the mean value of the income range selected by the respondent. Income levels were then categorized as low, medium, or high according to the benchmarks established by the national median income [46]. Following the standard thresholds for EU countries [64], individuals were classified as follows: Low income: less than 60% of the median; Medium: between 60% and 150% of the median; High: above 150% of the median [46].
The methodological process involved three key phases: (1) the design of a survey instrument specifically tailored to target relevant RE prosumer profiles; (2) data collection and classification of respondents into different (co-)ownership settings; and (3) data statistical modelling, including transformations, index creation, and covariate selection.
3.2. Index Construction
The methodology applied in this study aims to replicate the steps followed in previous work by Roth et al. (2023) [14], expanding the analysis to include heating-related considerations. Thus, the same methodological approach is employed here, with attention to the specificities of our research and survey design. As previously mentioned in the data collection section, the survey was directed at groups that could potentially align with the primary focus of our research scope: reaching as many prosumers as possible. Given the potential sampling biases that may result from this targeted approach, we apply an analysis of covariance (ANCOVA) to account for these effects [65].
The model construction includes the classification of respondents into groups (non-owners vs. ownership settings), the dependent variable representing the willingness to invest in or adapt energy-efficient behaviour, and a set of covariates.
In our questionnaire, we first asked respondents whether they were (co-)owners of a renewable energy installation:
- Have you invested in any form of renewable energy generation facility?
- Yes
- No
If the answer was positive, we then asked how the energy generated by the renewable energy installation was used. It is important to note that respondents could own more than one type of RE technology, each with a different usage purpose. Therefore, we asked this follow-up question for each type of installation:
- How do you use the energy you generate with [technology—PV, solar thermal, wind turbine, biogas, hydroelectric or other]?
- Exclusively for personal consumption
- Own consumption and sales
- For sale only (or resale by a third party)
To assess latent constructs such as the propensity to invest in energy-efficient technologies and the willingness to adopt energy-conscious behaviours, we developed two composite indices. Each index was constructed differently, depending on whether it measured behavioural intentions or investment preferences. In the case of behaviour regarding electricity and heating, we included questions that cover different domains of energy efficiency, capturing the complexity of respondents’ intentions and everyday practices.
Using indices rather than single items allows for greater nuance and precision in representing latent constructs [66] and provides a more comprehensive measure of the phenomena under analysis [67]. The indices were operationalized through a series of statements, where participants expressed their level of agreement on a 5-point scale (ranging from 1 = “strongly disagree” to 5 = “strongly agree”) with statements concerning the adoption of energy-efficient behaviours in technological and daily-life contexts. These indices act as proxies for actual behaviour related to energy efficiency [68]. To assess electricity-saving behaviour, respondents were prompted to indicate how willing they were to adopt the following practices:
- To what degree are you motivated to change your consumption behaviour to save energy?
- … turn off the lights, even if I only leave a room briefly.
- … use a power strip that has a switch to ensure that electronic devices do not draw power in standby mode.
- … run household appliances (such as dishwashers, clothes dryers or washing machines) in energy-saving settings.
- … only activate appliances when they are in their full capacity.
- … regularly clear out the freezer (defrost) to avoid the build-up of ice.
For heating, respondents were asked the following:
- To what degree are you motivated to change your consumption behaviour to save energy when heating?
- … turn off the heating when I’m not using a room.
- … remove all furniture and curtains in front of the radiator.
- … seal all windows and doors to prevent cold drafts.
- … regularly let air out of the radiator, as air in the radiator reduces the heating output.
- … independently insulate the heating pipes in my apartment.
- … obtain information about the correct thermostat settings.
Indices related to the willingness to invest were based on participants’ past or planned implementation of EE measures. For each action already taken, respondents received two points; for each planned action, they received one point. The composite index was constructed based on the following questions:
- What investments have you made/are you planning to make to save electricity?
- Swapping out traditional lighting for energy-efficient LED bulbs
- Upgrading home appliances
- Replacing additional electronic entertainment appliances
- Something else
- What investments have you made/are you planning to make to reduce your energy consumption for heating?
- Installing new windows
- Improving of the insulation in your home
- Acquiring technology for heating management
- Changing the circulation pump
- Installing a heat pump
- Something else
These items were selected based on evidence from the literature highlighting key areas of household electricity consumption. A study by the German Ministry of the Environment [69] emphasized saving energy by adopting different behaviours and improved use of appliances such as washing machines and refrigerators. Other studies stress the relevance of efficient lighting in the home [70,71], while cost-effective measures such as the use of power strips to prevent standby power losses are also frequently cited [72,73].
These questions were designed to capture the willingness of participants to adopt everyday practices that promote energy efficiency in heating. Unlike structural or technological investments, these behaviours are low-cost and easy to implement and still have a significant effect on reducing energy use. Practices such as switching off heating in unoccupied rooms, clearing radiators of blockages, and sealing windows are widely recommended in awareness campaigns due to their accessibility and impact [74,75].
The heating investment options reflect well-established measures in the literature for reducing heating-related energy consumption. Window replacement and insulation improvements enhance a building’s thermal efficiency [76,77]. Investments in heating management devices [76,78], new circulation pumps [77], and heat pumps [79] represent more advanced technical improvements. Together, these measures cover a broad spectrum of potential investments—both structural and technological—capturing the degree of respondent engagement with energy efficiency.
The index values are calculated following the methodology applied in Magalhães et al. (2025) [46] and Roth et al. (2023) [14]. Responses from both the behavioural 1–5 scale and the summed investment measures (implemented or planned) are log-transformed. The log transformation aids in normalizing distributions that are skewed, minimizes the influence of outliers, and stabilizes the variance [80,81]. To manage negative and zero values, a constant of 1 is added—a common practice in statistical transformations. The resulting value is then normalized by dividing by the sample mean, and the square root of this value is taken [82].
Finally, to make the values comparable across indices, they are scaled to a 0–100 range [66].
here represents the index, k denotes the highest number of items in the scale, and the individual scale items [14].
refers to the new index, which ranges from a minimum of 0 to a maximum of 100. represents the specific index value from i, indicates the lower boundary, and the upper boundary for within the sample, as in Roth et al. (2023) [14].
3.3. Model Specification and Statistical Treatment
We then specified our ANCOVA model as follows:
where represents for any of the EE indices the response variable, pertaining to observation j within group i. The constants μ and τi represent the overall average and the group affiliation, respectively, which serve as the independent variable. The notations to indicate the covariates for observation j in group i with corresponding coefficients through , while to refer to the aggregate means of the covariates. Finally, represents random error.
The model includes Gender [83,84], Income Level [85], Electricity Consumption [86], Age [84], and Population Size [87,88,89] as covariates. Prior studies indicate that age has a positive effect on the willingness to invest in EE [84]. Though gender is not shown to have a significant influence on EE investments [83,84], other studies show variations in electricity use by gender [90]. Knowledge of energy-efficient technology is also linked positively with investment behaviour [46,85].
We also include the variable Population Size as a covariate, which accounts for the size of the municipality of the respondent, in order to reflect variation in energy consumption behaviour at the context level by whether or not the respondent lives in an urban or rural area, a factor previously identified by research as a significant influencer [12]. As the covariates present different levels of skewness, we applied a Box-Cox transformation in order to improve the homogeneity of variance and to standardize the following covariates: Electricity Usage, Income level, Population Size, and Age [91]. We applied a bootstrap algorithm in the ANCOVA model, improving the model estimates’ stability and accounting for the non-normal distribution of the variables. Information regarding the variance of the sample can be found in the Appendix B. The bootstrap approach was performed with 1000 resamples of the original dataset. The method reduces the effect of heteroscedasticity on predictors with non-normal distributions [92] and decreases the effect of outliers [93,94], leading to more stable parameter estimates and confidence intervals.
To mitigate the likelihood of Type I errors resulting from multiple comparisons, we applied the Bonferroni adjustment. It is a conservative adjustment that increases confidence in comparisons between group means by decreasing false positives. We applied the Bonferroni method in preference to other options such as Tukey’s test due to its more powerful multiple testing control, particularly where many comparisons are being performed [95,96]. While the Bonferroni correction effectively reduces Type I errors, it at the same time can lower statistical power and thereby increase the risk of Type II errors. However, because of the relatively large sample size in our study, we deem the trade-off acceptable, as well as the method appropriate for our analysis [97].
Overall, the above methodological procedure ensures a consistent and replicable framework based on energy behavioural research practices, while expanding it to account for the specific dynamics of the heating sector.
4. Results
The subsequent section details the outcomes of the ANCOVA model indices, along with the differences between groups—specifically, non-owners compared to various models of (co-)ownership in RE production. The models are replicated using the methods applied in Roth et al. (2023) [14] incorporating demographic control parameters as covariates.
For each hypothesis, we outline the differences between groups, assess the effects of the covariates through coefficient tables, and determine whether significant differences exist in the indices across groups. Additionally, we perform pairwise comparisons with Bonferroni correction to manage the family-wise error rate.
All calculations were executed in R, using version 4.4.0.
4.1. Index Summary
Bellow, the tables present a summary of the average index scores, standard deviation (SD), and median for each group compared in each hypothesis.
Table 2 provides a summary of electricity-related energy-efficient technologies. The lowest mean is observed in the seller group (45.39), which is very close to that of non-owners (45.84). The consumer-seller group has the highest mean (59.47), while self-consumers show an average of 56.70. The median values, which are higher than the means, indicate a left-skewed distribution. Additionally, the high standard deviation (SD) values suggest considerable variability across groups.
Table 2.
Summary of the investment in electricity energy-efficient technologies index for all (co-)ownership settings.
Table 3 presents the values for the electricity energy-conscious behaviour index. The groups show little variation among themselves, with consumer-sellers having the highest mean (89.23), though very close to that of self-consumers (88.95). The median values also indicate a left-skewed distribution. However, the standard deviations suggest less dispersion around the mean compared to the index related to investment.
Table 3.
Summary of the electricity energy-conscious behaviour index for all (co-)ownership settings.
Table 4 presents the willingness to invest in heating energy-efficient technologies. The pattern observed in Table 2 is repeated, with non-owners having the lowest mean score (23.46) and consumer-sellers the highest (45.43), followed closely by self-consumers (41.28). The data skewness, observed through the median values, follows the same pattern as before, while the standard deviation values indicate significant dispersion across groups.
Table 4.
Summary of the investment in heating energy-efficient technologies index for all (co-)ownership settings.
Finally, Table 5 summarizes the willingness to adopt heating energy-conscious behaviour. Here, non-owners have the lowest mean index (77.12), while self-consumers report the highest (80.98), once again followed closely by consumer-sellers (80.10). The median values indicate a left-skewed distribution, while the standard deviation (SD) ranges suggest moderate dispersion. Overall, from a descriptive standpoint, it is evident that the (co-)ownership setting influences all indices, with consumer-sellers and self-consumers demonstrating a greater willingness to invest or adapt their behaviour.
Table 5.
Summary of the heating energy-conscious behaviour index for all (co-)ownership settings.
4.2. Hypothesis 1
Table 6 presents the independent variables, group affiliations, covariates, coefficients, p-values, and 95% confidence intervals (CIs) for the first ANCOVA model. The reference group for the coefficients is the non-owner group. Significant coefficients are observed for self-consumers (Coefficient = 1.18, p = 0.045) and consumer-sellers (Coefficient = 1.513, p = 0.027), indicating that self-consumers score, on average, 1.18 points higher, while consumer-sellers score 1.513 points higher than non-owners. Sellers’ scores do not differ significantly from those of non-owners (Coefficient = 1.163, p = 0.207). Within this model, the gender coefficient (with women as the baseline group) is both positive and statistically significant (β = 3.296, p < 0.001), suggesting that male respondents are more inclined to invest in EE electricity technologies. The gender disparity could be triggered by differences in financial attitudes, perceptions of risk, or decision-making patterns regarding household energy investments. However, this trend is not observed in all models, and additional research is required to ascertain whether the gender gap holds across all energy domains of energy or in different contexts.
Table 6.
ANCOVA analysis for the willingness to invest in energy-efficient electricity technologies.
Pairwise comparisons with Bonferroni correction (Table 7) further confirm significant differences between non-owners and consumer-sellers, non-owners and self-consumers, consumer-sellers and sellers, and self-consumers and sellers. The most notable differences are observed between consumer-sellers and self-consumers compared to non-owners. Specifically, consumer-sellers show the greatest difference from non-owners, indicating a stronger tendency for this group to invest in electricity energy-efficient technologies. Hypothesis 1 is partially confirmed, demonstrating that the willingness to invest in electricity EET is influenced by the setting of (co-)ownership. However, the seller group did not show significant differences compared to non-owners. To fully confirm the hypothesis, all (co-)ownership groups would have needed to show statistically significant difference when compared to the baseline group of non-owners.
Table 7.
Pairwise comparisons using Bonferroni correction conducted to assess the willingness to invest in energy-efficient electricity technologies.
4.3. Hypothesis 2
Statistically significant coefficients emerge once again for self-consumers (Coefficient = 8.416, p < 0.001) and consumer-sellers (Coefficient = 11.001, p < 0.001) in Table 8, indicating that these groups score, on average, are significantly higher on the ECB index in comparison to non-owners. Sellers do not show a significant difference (Coefficient = −2.52, p = 0.752).
Table 8.
ANCOVA analysis for the willingness to engage in energy-conscious behaviour regarding electricity usage.
In contrast to the findings from the ANCOVA findings, the Table 9 with the pairwise comparisons with Bonferroni correction does not show significant differences between groups after adjusting for multiple comparisons. However, the consumer-seller group presents the greatest contrast compared to non-owners and the other groups, once again indicating a stronger tendency toward energy-conscious behaviour in electricity usage.
Table 9.
Pairwise comparisons using Bonferroni correction conducted to assess willingness to engage in energy-conscious behaviour regarding electricity usage.
Hypothesis 2 is partially confirmed. While self-consumers and consumer-sellers exhibit significantly higher energy-conscious behaviour for electricity usage compared to non-owners in the ANCOVA model, these differences do not remain significant under stricter multiple comparison adjustments. Again, not all settings present significant differences when compared to non-owners, not fully confirming the hypothesis.
4.4. Hypothesis 3
The results for Hypothesis 3 indicate a significant difference in the willingness to invest in heating energy-efficient technologies, which differs based on the (co-)ownership of RE production. This variation is associated with different possibilities for using the energy produced.
Table 10 presents the ANCOVA results. Statistically significant differences emerge for self-consumers (Coefficient = 15.067, p < 0.001) and consumer-sellers (Coefficient = 19.245, p < 0.001), demonstrating that these groups have a significantly higher willingness to invest in heating energy-efficient technologies compared to non-owners. Sellers, however, do not show a significant difference (Coefficient = 2.306, p = 0.212).
Table 10.
ANCOVA analysis for willingness to invest in energy-efficient heating technologies.
Table 11 presents the pairwise comparisons with Bonferroni correction outcomes, highlighting the contrasts between (co-)owner groups and non-owners. A significant internal difference is observed among the (co-)owner groups. Hypothesis 3 is strongly confirmed, indicating that (co-)ownership of RE production facilities is associated with a significantly higher propensity to invest in heating energy-efficient technologies. Additionally, differences between the groups reveal a particularly high willingness to invest among consumer-sellers, followed by self-consumers.
Table 11.
Pairwise comparisons using Bonferroni correction conducted to assess the willingness to invest in energy-efficient heating technologies.
Unlike the previous hypotheses, these effects remain robust even after adjustments for multiple comparisons, demonstrating a strong relationship between (co-)ownership status and the willingness to invest in heating technologies for EE.
4.5. Hypothesis 4
A variation in the willingness to embrace energy-saving practices related to heating usage is observed across different settings of (co-)ownership. Table 12 presents the ANCOVA results, where statistically significant coefficients emerge for self-consumers (Coefficient = 3.448, p < 0.001) and consumer-sellers (Coefficient = 2.606, p = 0.007). However, sellers do not significantly differ from non-owners (Coefficient = 0.849, p = 0.339).
Table 12.
ANCOVA analysis for the willingness to engage in energy-conscious behaviour regarding heatingusage.
Table 13 provides the findings from the pairwise comparisons with Bonferroni correction. Interestingly, unlike the previous hypotheses where consumer-sellers demonstrated the highest willingness to adapt behaviour or invest, in this case, only the contrast between non-owners and self-consumers remains statistically significant (p < 0.001). Other comparisons among (co-)owner groups do not show significant differences.
Table 13.
Pairwise comparisons using Bonferroni correction conducted to assess the willingness to engage in energy-conscious behaviour regarding heatingusage.
Hypothesis 4 is, therefore, partially confirmed. While the ANCOVA model indicates significant differences for both self-consumers and consumer-sellers compared to the baseline group (non-owners), and belonging to these groups has a positive effect, under stricter correction and pairwise comparisons, only the self-consumer group remains statistically significant. As not all groups are statistically different from the baseline group, it is not possible to fully confirm the hypothesis.
In summary, across the first three hypotheses, the findings suggest that whether it is willingness to invest (for electricity and heating) or willingness to adapt behaviour (for electricity), the difference from non-owners depends on the setting of (co-)ownership association and energy usage. The strongest positive tendency is observed in the consumer-seller group. However, for the final hypothesis (willingness to adapt behaviour for heating usage), self-consumers show a stronger tendency to change their behaviour.
5. Discussion
Below we present the discussion of the hypotheses considering the results and the discussion of related literature.
5.1. Hypothesis 1 and 2
As in previous results [14], considerable heterogeneity in the willingness to invest in electricity-saving technologies and behavioural change is actually found across different settings of RE (co-)ownership. Among them, the strongest effect is found for consumer-sellers due to their ability to flexibly self-consume and to sell surplus electricity, offering robust economic incentives—via direct financial returns and through reduced consumption costs—aligned with ecological motivations that encourages higher investment rates. Notably, in contrast to Roth et al.’s previous results—where self-consumers were no different from non-owners—our more recent results indicate a strong positive attitude among self-consumers [14]. This difference can possibly be explained by more recent contextual circumstances with rising energy prices [98] that have amplified financial worries, making financial savings through self-consumption more attractive. Higher energy prices may also have boosted incentives for self-consumers to carefully manage and reduce consumption, translating into significant monetary benefit [98]. Although, this may only be true if it is followed by policy incentives [99].
Further, technological progress over the last few years and reduced costs of energy-efficient equipment lowered perceived economic costs, allowing previously reluctant self-consumers to invest more willingly in EE technologies [100]. The benefits, however, are unequally distributed, causing this motivation not to be translated into greater willingness for low-income groups [101]. Finally, the greater experience of households with RE devices and the higher diffusion of knowledge and information has enhanced self-consumers’ understanding and awareness of economic and environmental gains accrued through energy independence [100], which may have enabled more extensive adoption of energy-aware practices by self-consumers.
Furthermore, methodological differences can partly explain why self-consumers emerge as significant investors and behavioural changers in this study. This study’s larger and more diverse sample (N = 2585) compared to Roth et al.’s earlier study (N = 1454) may have provided more statistical power, detecting fine-grained differences between prosumer groups that were not visible in a smaller or less varied sampling. Exclusive sellers, in line with Roth et al.’s observations, are still statistically not different from non-owners, confirming that financial returns without autonomy incentives are not enough to drive significant investment behaviour or behavioural changes [14]. Therefore, even as autonomy and direct savings increasingly encourage self-consumers across both investment and behavioural domains in electricity, flexible monetization options provided to consumer-sellers still offer the most powerful motivation.
5.2. Hypothesis 3 and 4
Extending the logic of Roth et al. (2023) [14] to the heating sector, our evidence corroborates that the different settings of RE (co-)ownership also significantly influence both the willingness to invest in heating technologies and the participation in energy-saving practices. Similar to what was found with electricity, consumer-sellers again have the strongest motivation to invest due to the possibility of flexible usage, balancing the direct financial gain of selling excess energy with lower bills from self-consumption, which translates into investments in energy efficiency regardless of energy type. Self-consumers also have a significant willingness to invest in heating efficiency.
Just sellers remain not differentiated from non-owners in the willingness to invest in heating efficiency, further supporting for the thesis of Roth et al. (2023) [14] that isolated monetary incentives without usage incentives are poor motivators. Though these findings reflect what was found for electricity to some extent, important sectoral distinctions emerge. Heating is fundamentally distinct from electricity, both practically and economically. Heating represents usually a greater proportion of household total energy costs, making efficient heating investments more noticeable [102]. This economic significance increases investment motivations, especially among those who benefit directly from reduced consumption, i.e., consumer-sellers and self-consumers. In such cases, the economic benefit from a reduced heating bill can be greater than incentives observed for electricity, what amplifies the observed effects in this case [102,103].
The choice for investing in upgrades in heating systems is also affected by techno-economic causes, including the price of natural gas and the current electricity market structures [102,104] and existing policy incentives [105]. An integration of the heating system with the electricity system can increase flexibility and cost integration for renewable energy, further increasing savings and reducing emissions [104]. This integration becomes even more attractive under the condition of rising energy prices in contexts where there is policy support, including incentives for the adoption of technologies and for the reduction of climate-related costs in the price of energy [102,104,105]. Thus, these conditions can favour the creation of an encouraging context for prosumers who already benefit from energy autonomy and whose motivation is associated with energy use patterns, increasing their motivation to invest in EE measures.
Furthermore, recent trends in the market, such as technological advancement and governmental incentives directed at heating efficiency in particular (e.g., heat pump, circulation pump, and home insulation incentives) [106,107], might have disproportionately motivated prosumers’ investment, as incentives specifically targeted at these technologies have made them more accessible and attractive [108]. Prosumers prioritize investments that offer long-term energy cost savings—even at the cost of higher upfront expenses [109,110]. Thus, more experience and familiarity with renewable technology might also have helped prosumers feel confident in making their EE investments into heating, traditionally more expensive than electricity energy-efficiency investments. Additionally, frameworks aimed at community-based initiatives, such as RE communities, can further lower barriers and costs, making prosumers who prosume collectively even more motivated to participate in EE measures [111,112].
Regarding behavioural change, both consumer-sellers and self-consumers exhibit statistically significant positive behavioural tendencies relative to non-owners. However, after stricter pairwise testing and multiple comparison corrections, for heating only the behavioural change of self-consumers remains significantly distinct. This finding introduces an important contrast to electricity-related behavioural findings, in which consumer-sellers were consistently the group with the strongest willingness to change behaviour. In heating, immediate and direct monetary savings generated by energy-conscious behaviours—e.g., careful thermostat management, efficient ventilation, or optimum heating system settings [113,114]—may seem particularly evident for self-consumers. A plausible explanation is that unlike with electricity, heating behavioural changes quickly translate into substantial and noticeable economic benefits, as heating costs tend to be higher, strengthening self-consumers’ incentives for behavioural changes [29,88].
However, this change in habits is related to repetitive behaviours, embedded in daily routines, and is, therefore, probably more difficult to adopt. Nudges have little influence on behavioural change in this context [27], unlike consumption patterns for electricity, which are generally associated with specific appliance use that can be easily adjusted through minor changes in behaviour [111]. Thus, personal attitudes towards energy saving positively affect the willingness to adapt behaviour, but perceived behavioural control appears, in this context, not to impact the change in intentions [27].
Consumer-sellers may face, in this context, more complex decisions, as they must include the balance between the benefits related to immediate use and the potential future profits through the sale of surplus energy. In contrast, self-consumers have a clearer and more immediate view of their consumption, connecting their actions to their outcomes, directly perceiving the benefits and reinforcing habits. Recent economic pressures due to increasing heating costs, the improved affordability of smart heating solutions, and enhanced consumer experience due to broader diffusion of knowledge and community shared knowledge have likely backed self-consumers’ intentions to adopt and maintain energy-conscious heating usage habits. Smart heating systems demonstrate significant energy savings [115,116], resulting in a greater incentive for self-consumers, given their direct and apparent positive economic return.
Overall, although consumer-sellers continue to dominate across all forms of energy usage due to the possibilities of twofold monetization, heating’s unique economic prominence and habitual nature amplify self-consumers’ role as an especially responsive group for intentional behavioural adaptation. Only sellers continue to be indistinct from non-owners, reinforcing the observation of the insufficiency of monetary returns alone to generate intentional behavioural change in the absence of direct consumption incentives.
The Table 14 summarizes the main differences in the hypotheses.
Table 14.
Summary of key differences in investment and behavioural outcomes across energy types and ownership models.
Our findings highlight the relevance of energy prosumership models in promoting energy efficiency and driving behavioural change. Yildiz and Sagebiel (2019) [42] and Bauwens (2016) [51] found that energy (co-)ownership schemes can increase the engagement with renewable energy topics and develop a sense of responsibility among their members, which can translate into greater energy-efficiency practices. Our results support this in the case of self-consumers and consumer-sellers settings, in which autonomy and flexible use options appear as central elements for this engagement.
Some authors, however, stress that RE (co-)ownership by itself cannot guarantee energy-efficiency behaviour. Steg et al. (2009) [36] and Hoseinpoori et al. (2018) [50] highlight potential rebound effects, in which (co-)ownership is actually translated into an increase in total consumption. The only-sellers group does not differ from non-owners, showing that only in engaged ownership types are behavioural and investment modifications seen. This corroborates with the fact that usage control is a key condition for ownership to generate positive EE outcomes.
For heating, our results reflect what was found in Rekker et al. (2024) [45], highlighting that behavioural routines and comfort preferences shape household energy use. Different from the results in electricity, the greater significance for self-consumers in heating behavioural adaptation relates to the immediacy of feedback and perceived control described in these studies. The results suggest that the enabling mechanisms—autonomy, feedback, and incentive structures—are the core factors influencing EE behaviour and investment decisions, even if the nature of energy use differs across electricity and heating.
6. Conclusions and Policy Implications
Our empirical results are in line with what Roth et al. (2023) found for electricity [14], demonstrating that the behavioural effects of RE (co-)ownership related to EE and investments extend to heating, albeit with some differences. Generally, we find that consumer-sellers show the greatest inclination to beneficial behavioural changes associated with energy usage, i.e., both regarding electricity and heating, and investments in EE measures. Unlike electricity, in the field of heating, self-consumers are found also to be a relevant actor. When regarding investments in EE measures for heating, consumer-sellers again show the strongest positive behavioural inclinations; it is self-consumers that also show significantly different behavioural effects when compared to non-owners. When conducting more conservative comparison tests between the three groups to investigate behavioural adaptation, only self-consumers demonstrate a statistically significant differing behaviour from non-owners in heating. We surmise that these differences reflect different underlying economic structures, behavioural dynamics, and routines of heating usage when compared to electricity, as they are more firmly rooted in habits, comfort standards, and direct economic feedback due to usage adaptation.
Our results indicate that self-consumers appear to be more responsive to immediate savings in heating, while consumer-sellers, despite greater flexibility, may find it more difficult to balance self-consumption and sales. This suggests that behavioural adaptation for heating is strongly associated with clear, direct incentives embedded in household routines, in a context in which decisions about room temperature, ventilation, thermostat and system settings directly change home comfort, but at the same time deliver financial benefits. Self-consumers, focusing only on use, may more easily associate behavioural changes with concrete returns and reinforce these changes, while consumer-sellers appear to be more oriented towards long-term financial returns that ignore short-term behavioural changes.
Policymakers who aim to increase EE in the heating sector should emphasize support technologies that combine comfort standards with behavioural routines, including smart heating systems with real-time feedback. To this end, encouraging the participation of energy communities or other shared ownership arrangements can help bridge the equity gap between average and low-income households. Likewise, these efforts should be accompanied by solutions providing monetary incentives linked to behavioural changes increasing the EE of heating systems at household and community levels and their availability also to tenants, in this way connecting improvements in daily heating habits with long-term savings. Gender was a significant covariate in the investment model for electricity (Hypothesis 1), with men more inclined to invest. This suggests potential gendered variation in investment decisions; however, the effect was not present in all models.
Therefore, the discussion should be accompanied by an overview of the different capacities and capabilities that households need to engage in the energy transition, seeking ways to include and engage groups that are often ignored or hindered to access EE measures. In particular low-income households often lack the upfront capital to invest in energy-efficient heating technologies while at the same time bearing proportionally larger energy expenditure relative to overall household income [117]. Excluding these groups risks that the benefits of RE (co-)ownership, prosumership, and EE incentives are disproportionately captured by higher-income groups, reinforcing existing inequalities. To this end, instruments designed for collective investment schemes in RE community schemes can contribute to an equitable distribution that also guarantees the advantages of income integration [118].
According to our results, we recommend to policymakers the subsequent specific measures for implementation:
- Design target incentives reinforcing positive usage behaviour in the heating sector, linking usage data to tangible monetary returns;
- Support low-income household participation in RE (co-)ownership models through collective investment schemes to reduce entry barriers and up-front costs;
- Subsidize smart heating technologies that promote behavioural change that enable immediate feedback, making energy efficiency gains more visible and achievable in daily routines.
Evidence from the literature and the results of Roth et al. [14] corroborated by this study suggest that (co-)ownership of RE installations increases the willingness to invest in EE and adapt corresponding behaviour, especially in settings in which the groups have usage flexibility and perceive both their autonomy and the direct benefits from energy savings. In this way, ensuring that more households can participate in collective schemes of RE (co-)ownership also ensures that these models can be deployed in broader segments of the population. Upcoming studies should, therefore, concentrate on how the willingness to invest and to adapt energy efficient behaviour differs between prosumers who own RE installations alone and those who do so together with others, understanding how beneficial impacts are affected by different governance models and levels of participation.
Understanding these dynamics is fundamental to designing a more inclusive and resilient energy system.
Author Contributions
Conceptualization, R.M., J.L.; methodology, R.M. software, R.M.; validation, R.M.; formal analysis, R.M., J.L.; investigation, R.M., J.L.; data curation, R.M.; writing—original draft preparation, R.M., J.L.; writing—review and editing, J.L., F.N.; visualization, R.M.; supervision, J.L.; project administration, J.L.; funding acquisition, J.L. All authors have read and agreed to the published version of the manuscript.
Funding
The research for this publication has been co-funded by the Bundesministerium für Wirtschaft und Klimaschutz der Bundesrepublik Deutschland (BMWK) project FKZ: 03EI6072A ‘FinSESCo—Fintech-Plattformlösung fur das Intracting und Contracting von nachhaltigen Energiesystemen zur Förderung von Energieeinsparungen und erneuerbaren Energien’.
Data Availability Statement
The data presented in this study are available on request from the corresponding author due to privacy.
Conflicts of Interest
The authors declare no conflict of interest.
Appendix A
The power analysis below is performed using R 4.4.0. The reference values are retrieved from Ref. [14]. The desired power level is 90%, with the error probability reaching 5% and the Cohen’s f 0.13. Table A1 presents the estimated required group sizes and the ones in our sample proportionally to the sample group sizes.
Table A1.
Group settings size with the required data and the actual data that were included in the ANCOVA.
Table A1.
Group settings size with the required data and the actual data that were included in the ANCOVA.
| Groups | Power Estimation | Available Sample |
|---|---|---|
| Non-owner | 539 | 1659 |
| Self-consumer | 178 | 548 |
| Consumer-seller | 93 | 286 |
| Seller | 30 | 92 |
| Total | 840 | 2585 |
Source: authors’ own calculations.
Appendix B
Figure A1, Figure A2, Figure A3 and Figure A4 illustrate the box plot of the index scales. Respondents showing minimal or no willingness to invest or adapt behaviour are kept, as we understand this information as relevant for our model; therefore, the resulting variance seen in the plots was corrected using the bootstrap procedure to account for the effect of the outliers.
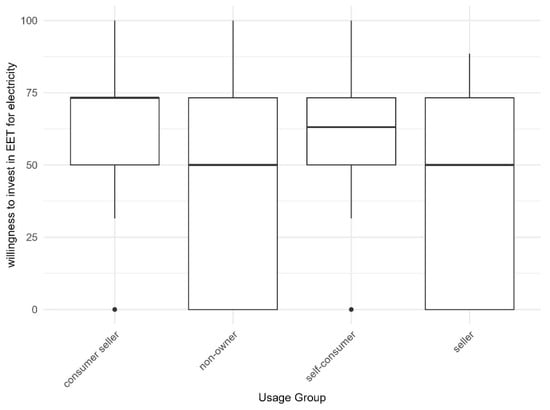
Figure A1.
Variation in investment willingness index for Energy Efficiency Technologies (EETs) for electricity across all respondents.
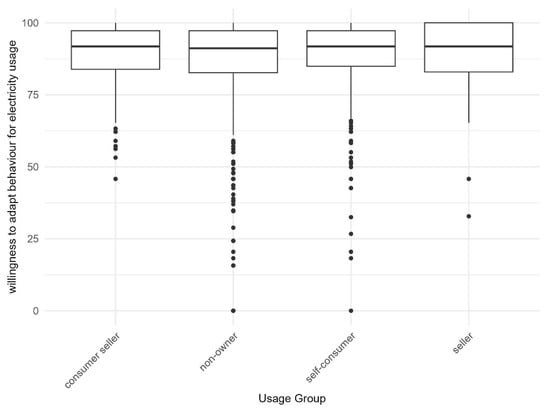
Figure A2.
Variation in adaptation willingness index for electricity usage across all respondents.
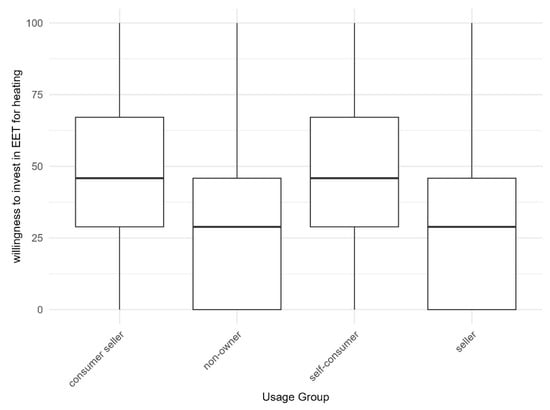
Figure A3.
Variation in investment willingness index for Energy Efficiency Technologies (EETs) for heating across all respondents.
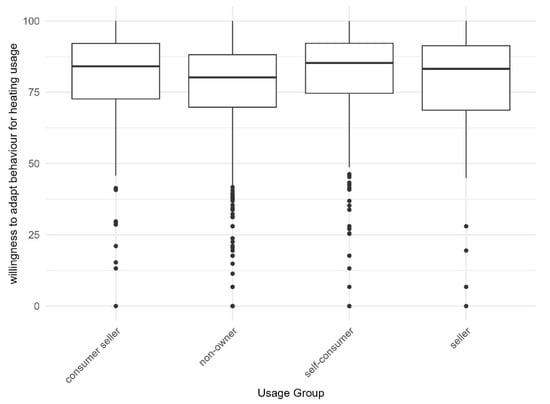
Figure A4.
Variation in adaptation willingness index for heating usage across all respondents.
References
- Gielen, D.; Boshell, F.; Saygin, D.; Bazilian, M.D.; Wagner, N.; Gorini, R. The Role of Renewable Energy in the Global Energy Transformation. Energy Strategy Rev. 2019, 24, 38–50. [Google Scholar] [CrossRef]
- Nam, E.; Jin, T. Mitigating Carbon Emissions by Energy Transition, Energy Efficiency, and Electrification: Difference between Regulation Indicators and Empirical Data. J. Clean. Prod. 2021, 300, 126962. [Google Scholar] [CrossRef]
- Tagliapietra, S.; Zachmann, G.; Edenhofer, O.; Glachant, J.-M.; Linares, P.; Loeschel, A. The European Union Energy Transition: Key Priorities for the next Five Years. Energy Policy 2019, 132, 950–954. [Google Scholar] [CrossRef]
- Gilson Dranka, G.; Ferreira, P.; Vaz, A.I.F. Co-Benefits between Energy Efficiency and Demand-Response on Renewable-Based Energy Systems. Renew. Sustain. Energy Rev. 2022, 169, 112936. [Google Scholar] [CrossRef]
- Khan, S.; Murshed, M.; Ozturk, I.; Khudoykulov, K. The Roles of Energy Efficiency Improvement, Renewable Electricity Production, and Financial Inclusion in Stimulating Environmental Sustainability in the Next Eleven Countries. Renew. Energy 2022, 193, 1164–1176. [Google Scholar] [CrossRef]
- Piekut, M. The Consumption of Renewable Energy Sources (RES) by the European Union Households between 2004 and 2019. Energies 2021, 14, 5560. [Google Scholar] [CrossRef]
- Tutak, M.; Brodny, J. Renewable Energy Consumption in Economic Sectors in the EU-27. The Impact on Economics, Environment and Conventional Energy Sources. A 20-Year Perspective. J. Clean. Prod. 2022, 345, 131076. [Google Scholar] [CrossRef]
- De Almeida, A.; Fonseca, P.; Schlomann, B.; Feilberg, N. Characterization of the Household Electricity Consumption in the EU, Potential Energy Savings and Specific Policy Recommendations. Energy Build. 2011, 43, 1884–1894. [Google Scholar] [CrossRef]
- Ramos, A.; Gago, A.; Labandeira, X.; Linares, P. The Role of Information for Energy Efficiency in the Residential Sector. Energy Econ. 2015, 52, S17–S29. [Google Scholar] [CrossRef]
- Rosenow, J.; Guertler, P.; Sorrell, S.; Eyre, N. The Remaining Potential for Energy Savings in UK Households. Energy Policy 2018, 121, 542–552. [Google Scholar] [CrossRef]
- Roth, L.; Lowitzsch, J.; Yildiz, Ö.; Hashani, A. Does (Co-)Ownership in Renewables Matter for an Electricity Consumer’s Demand Flexibility? Empirical Evidence from Germany. Energy Res. Soc. Sci. 2018, 46, 169–182. [Google Scholar] [CrossRef]
- Roth, L.; Yildiz, Ö.; Lowitzsch, J. An Empirical Approach to Differences in Flexible Electricity Consumption Behaviour of Urban and Rural Populations—Lessons Learned in Germany. Sustainability 2021, 13, 9028. [Google Scholar] [CrossRef]
- Skjærseth, J.B. Towards a European Green Deal: The Evolution of EU Climate and Energy Policy Mixes. Int. Env. Agreem. 2021, 21, 25–41. [Google Scholar] [CrossRef]
- Roth, L.; Lowitzsch, J.; Yildiz, Ö. Which (Co-)Ownership Types in Renewables Are Associated with the Willingness to Adopt Energy-Efficient Technologies and Energy-Conscious Behaviour? Data from German Households. Energy Policy 2023, 180, 113683. [Google Scholar] [CrossRef]
- Energy Transition: Financing Consumer Co-Ownership in Renewables; Lowitzsch, J., Ed.; Springer International Publishing: Cham, Switzerland, 2019; ISBN 978-3-319-93517-1. [Google Scholar]
- Kulawik, J.; Kockel, C.; Praktiknjo, A.J. What Are Consumers Willing to Pay for Residential Heating Systems in Germany? In Proceedings of the 17th IAEE European Energy Conference, Athens, Greece, 21–24 September 2022; Chair of Energy System Economics, RWTH Aachen University: Aachen, Germany, 2022. [Google Scholar]
- Salim, S.S.; Luxembourg, S.L.; Dalla Longa, F.; Van Der Zwaan, B. From Retrofitting to Renewables: Navigating Energy Transition Pathways for European Residential Space Heating. Energies 2024, 17, 2363. [Google Scholar] [CrossRef]
- Connolly, D. Heat Roadmap Europe: Quantitative Comparison between the Electricity, Heating, and Cooling Sectors for Different European Countries. Energy 2017, 139, 580–593. [Google Scholar] [CrossRef]
- Collins, M.; Curtis, J. Willingness-to-Pay and Free-Riding in a National Energy Efficiency Retrofit Grant Scheme. Energy Policy 2018, 118, 211–220. [Google Scholar] [CrossRef]
- Khanam, T.; Reiner, D.M. Evaluating Gaps in Knowledge, Willingness and Heating Performance in Individual Preferences on Household Energy and Climate Policy: Evidence from the UK. Renew. Sustain. Energy Rev. 2022, 160, 112229. [Google Scholar] [CrossRef]
- Podbregar, I.; Filipović, S.; Radovanović, M.; Mirković Isaeva, O.; Šprajc, P. Electricity Prices and Consumer Behavior, Case Study Serbia—Randomized Control Trials Method. Energies 2021, 14, 591. [Google Scholar] [CrossRef]
- Gustavsson, L.; Joelsson, A. Energy Conservation and Conversion of Electrical Heating Systems in Detached Houses. Energy Build. 2007, 39, 717–726. [Google Scholar] [CrossRef]
- Lang, G.; Farsi, M.; Lanz, B.; Weber, S. Energy Efficiency and Heating Technology Investments: Manipulating Financial Information in a Discrete Choice Experiment. Resour. Energy Econ. 2021, 64, 101231. [Google Scholar] [CrossRef]
- Never, B.; Kuhn, S.; Fuhrmann-Riebel, H.; Albert, J.R.; Gsell, S.; Jaramillo, M.; Sendaza, B. Energy Saving Behaviours of Middle Class Households in Ghana, Peru and the Philippines. Energy Sustain. Dev. 2022, 68, 170–181. [Google Scholar] [CrossRef]
- Wolff, A.; Weber, I.; Gill, B.; Schubert, J.; Schneider, M. Tackling the Interplay of Occupants’ Heating Practices and Building Physics: Insights from a German Mixed Methods Study. Energy Res. Soc. Sci. 2017, 32, 65–75. [Google Scholar] [CrossRef]
- Reuter, M. Linking Energy Efficiency Indicators with Policy Evaluation—A Combined Top-down and Bottom-up Analysis of Space Heating Consumption in Residential Buildings. Energy Build. 2021, 244, 110987. [Google Scholar] [CrossRef]
- Toussard, L.; Meyer, T. Autonomous vs. Controlling Communications about the Reduction of Heating Consumption at Home: Spillover to Energy-Saving Intentions and beyond from a Self-Determination Perspective. J. Environ. Psychol. 2024, 97, 102349. [Google Scholar] [CrossRef]
- Merkel, E.; McKenna, R.; Fehrenbach, D.; Fichtner, W. A Model-Based Assessment of Climate and Energy Targets for the German Residential Heat System. J. Clean. Prod. 2017, 142, 3151–3173. [Google Scholar] [CrossRef]
- Boomsma, C.; Jones, R.V.; Pahl, S.; Fuertes, A. Do Psychological Factors Relate to Energy Saving Behaviours in Inefficient and Damp Homes? A Study among English Social Housing Residents. Energy Res. Soc. Sci. 2019, 47, 146–155. [Google Scholar] [CrossRef]
- Dlamini, N.G.; Cromieres, F. Implementing Peak Load Reduction Algorithms for Household Electrical Appliances. Energy Policy 2012, 44, 280–290. [Google Scholar] [CrossRef]
- Gerke, B.F.; Zhang, C.; Murthy, S.; Satchwell, A.J.; Present, E.; Horsey, H.; Wilson, E.; Parker, A.; Speake, A.; Adhikari, R.; et al. Load-Driven Interactions between Energy Efficiency and Demand Response on Regional Grid Scales. Adv. Appl. Energy 2022, 6, 100092. [Google Scholar] [CrossRef]
- Laicane, I.; Blumberga, D.; Blumberga, A.; Rosa, M. Reducing Household Electricity Consumption through Demand Side Management: The Role of Home Appliance Scheduling and Peak Load Reduction. Energy Procedia 2015, 72, 222–229. [Google Scholar] [CrossRef]
- Munankarmi, P.; Maguire, J.; Balamurugan, S.P.; Blonsky, M.; Roberts, D.; Jin, X. Community-Scale Interaction of Energy Efficiency and Demand Flexibility in Residential Buildings. Appl. Energy 2021, 298, 117149. [Google Scholar] [CrossRef]
- Wohlfarth, K.; Worrell, E.; Eichhammer, W. Energy Efficiency and Demand Response—Two Sides of the Same Coin? Energy Policy 2020, 137, 111070. [Google Scholar] [CrossRef]
- Gardner, G.T.; Stern, P.C. The Short List: The Most Effective Actions U.S. Households Can Take to Curb Climate Change. Environ. Sci. Policy Sustain. Dev. 2008, 50, 12–25. [Google Scholar] [CrossRef]
- Steg, L.; Vlek, C. Encouraging Pro-Environmental Behaviour: An Integrative Review and Research Agenda. J. Environ. Psychol. 2009, 29, 309–317. [Google Scholar] [CrossRef]
- Hesselink, L.X.W.; Chappin, E.J.L. Adoption of Energy Efficient Technologies by Households—Barriers, Policies and Agent-Based Modelling Studies. Renew. Sustain. Energy Rev. 2019, 99, 29–41. [Google Scholar] [CrossRef]
- Mills, B.; Schleich, J. Residential Energy-Efficient Technology Adoption, Energy Conservation, Knowledge, and Attitudes: An Analysis of European Countries. Energy Policy 2012, 49, 616–628. [Google Scholar] [CrossRef]
- Testa, F.; Cosic, A.; Iraldo, F. Determining Factors of Curtailment and Purchasing Energy Related Behaviours. J. Clean. Prod. 2016, 112, 3810–3819. [Google Scholar] [CrossRef]
- Iweka, O.; Liu, S.; Shukla, A.; Yan, D. Energy and Behaviour at Home: A Review of Intervention Methods and Practices. Energy Res. Soc. Sci. 2019, 57, 101238. [Google Scholar] [CrossRef]
- McAndrew, R.; Mulcahy, R.; Gordon, R.; Russell-Bennett, R. Household Energy Efficiency Interventions: A Systematic Literature Review. Energy Policy 2021, 150, 112136. [Google Scholar] [CrossRef]
- Yildiz, Ö.; Sagebiel, J. Consumer (Co-)Ownership and Behaviour: Economic Experiments as a Tool for Analysis. In Energy Transition; Lowitzsch, J., Ed.; Springer International Publishing: Cham, Switzerland, 2019; pp. 99–112. ISBN 978-3-319-93517-1. [Google Scholar]
- Umit, R.; Poortinga, W.; Jokinen, P.; Pohjolainen, P. The Role of Income in Energy Efficiency and Curtailment Behaviours: Findings from 22 European Countries. Energy Res. Soc. Sci. 2019, 53, 206–214. [Google Scholar] [CrossRef]
- Frederiks, E.R.; Stenner, K.; Hobman, E.V. Household Energy Use: Applying Behavioural Economics to Understand Consumer Decision-Making and Behaviour. Renew. Sustain. Energy Rev. 2015, 41, 1385–1394. [Google Scholar] [CrossRef]
- Rekker, L.; Hulshof, D.; Kesina, M.; Mulder, M. Willingness-to-Pay for Low-Carbon Residential Heating Systems: A Discrete Choice Experiment among Dutch Households. Energy Build. 2024, 323, 114712. [Google Scholar] [CrossRef]
- Magalhães, R.; Narracci, F.; Lowitzsch, J. Crowdfunding and Energy Efficiency Contracting: Exploring New Pathways for Private Investment in Building Renovations. FinTech 2025, 4, 6. [Google Scholar] [CrossRef]
- Goulden, M.; Bedwell, B.; Rennick-Egglestone, S.; Rodden, T.; Spence, A. Smart Grids, Smart Users? The Role of the User in Demand Side Management. Energy Res. Soc. Sci. 2014, 2, 21–29. [Google Scholar] [CrossRef]
- Barnes, J.; Hansen, P.; Kamin, T.; Golob, U.; Musolino, M.; Nicita, A. Energy Communities as Demand-Side Innovators? Assessing the Potential of European Cases to Reduce Demand and Foster Flexibility. Energy Res. Soc. Sci. 2022, 93, 102848. [Google Scholar] [CrossRef]
- Keirstead, J. Behavioural Responses to Photovoltaic Systems in the UK Domestic Sector. Energy Policy 2007, 35, 4128–4141. [Google Scholar] [CrossRef]
- Hoseinpoori, P.; Hanna, R.; Woods, J.; Markides, C.N.; Shah, N. Comparing Alternative Pathways for the Future Role of the Gas Grid in a Low-Carbon Heating System. Energy Strategy Rev. 2023, 49, 101142. [Google Scholar] [CrossRef]
- Bauwens, T. Explaining the Diversity of Motivations behind Community Renewable Energy. Energy Policy 2016, 93, 278–290. [Google Scholar] [CrossRef]
- Ellsworth-Krebs, K.; Reid, L. Conceptualising Energy Prosumption: Exploring Energy Production, Consumption and Microgeneration in Scotland, UK. Environ. Plan. A 2016, 48, 1988–2005. [Google Scholar] [CrossRef]
- Dütschke, E.; Galvin, R.; Brunzema, I. Rebound and Spillovers: Prosumers in Transition. Front. Psychol. 2021, 12, 636109. [Google Scholar] [CrossRef]
- Havas, L.; Ballweg, J.; Penna, C.; Race, D. Power to Change: Analysis of Household Participation in a Renewable Energy and Energy Efficiency Programme in Central Australia. Energy Policy 2015, 87, 325–333. [Google Scholar] [CrossRef]
- Peñasco, C.; Anadón, L.D. Assessing the Effectiveness of Energy Efficiency Measures in the Residential Sector Gas Consumption through Dynamic Treatment Effects: Evidence from England and Wales. Energy Econ. 2023, 117, 106435. [Google Scholar] [CrossRef]
- Haas, R.; Biermayr, P. The Rebound effect for Space Heating Empirical Evidence from Austria. Energy Policy 2000, 28, 403–410. [Google Scholar] [CrossRef]
- Galvin, R.; Dütschke, E.; Weiß, J. A Conceptual Framework for Understanding Rebound Effects with Renewable Electricity: A New Challenge for Decarbonizing the Electricity Sector. Renew. Energy 2021, 176, 423–432. [Google Scholar] [CrossRef]
- Heinen, S.; Burke, D.; O’Malley, M. Electricity, Gas, Heat Integration via Residential Hybrid Heating Technologies—An Investment Model Assessment. Energy 2016, 109, 906–919. [Google Scholar] [CrossRef]
- Salite, D.; Miao, Y.; Turner, E.; Feng, Y. Assessing the Adoption of Sustainable Heating Technologies in the United Kingdom—A Case Study of Socioeconomically Deprived Neighbourhoods of Nottingham City. Technol. Soc. 2024, 77, 102508. [Google Scholar] [CrossRef]
- Prajapati, B.; Dunne, M.C.M.; Armstrong, R.A. Sample Size Estimation and Statistical Power Analyses. Optomometry Today 2010, 16, 10–18. [Google Scholar]
- Bundesnetzagentur EEG in Zahlen 2019. Available online: https://www.bundesnetzagentur.de/DE/Fachthemen/ElektrizitaetundGas/ErneuerbareEnergien/EE-Statistik/DL/EEGinZahlen_2019_BF.pdf?__blob=publicationFile&v=1 (accessed on 7 May 2025).
- Tews, K. Mapping the Regulatory Features Underpinning Prosumer Activities in Germany: The Case of Residential Photovoltaics; FFU-Report 02-2016; Forschungszentrum für Umweltpolitik, FU: Berlin, Germany, 2016. [Google Scholar]
- Inderberg, T.H.J.; Tews, K.; Turner, B. Is There a Prosumer Pathway? Exploring Household Solar Energy Development in Germany, Norway, and the United Kingdom. Energy Res. Soc. Sci. 2018, 42, 258–269. [Google Scholar] [CrossRef]
- Hirsch, D.; Padley, M.; Stone, J.; Valadez-Martinez, L. The Low Income Gap: A New Indicator Based on a Minimum Income Standard. Soc. Indic. Res. 2020, 149, 67–85. [Google Scholar] [CrossRef]
- Owen, S.V.; Froman, R.D. Uses and Abuses of the Analysis of Covariance. Res. Nurs. Health 1998, 21, 557–562. [Google Scholar] [CrossRef]
- Babbie, E.R. The Basics of Social Research, 4th ed.; Thomson/Wadsworth: Belmont, CA, USA, 2008; ISBN 978-0-495-09468-5. [Google Scholar]
- Ghai, D. Decent Work: Concept and Indicators. Int. Labour Rev. 2003, 142, 113–145. [Google Scholar] [CrossRef]
- Sheeran, P.; Webb, T.L. The Intention–Behavior Gap. Soc. Personal. Psych. 2016, 10, 503–518. [Google Scholar] [CrossRef]
- Fischer, C.; Cludius, J.; Keimeyer, F.; Schumacher, K.; Brischke, L.-A. Stromverbrauch Senken: Energieeinsparung Durch Suffizienzpolitiken im Handlungsfeld “Stromverbrauch”; Öko-Institut and ifeu Institut im Auftrag des Umweltbundesamtes: Dessau-Roßlau, Germany, 2019. [Google Scholar]
- Bergquist, M.; Nilsson, A. I Saw the Sign: Promoting Energy Conservation via Normative Prompts. J. Environ. Psychol. 2016, 46, 23–31. [Google Scholar] [CrossRef]
- Maleetipwan-Mattsson, P.; Laike, T.; Johansson, M. Factors Affecting Optimal Lighting Use in Shared Hospital Environments: A Case-Study. Build. Environ. 2016, 96, 260–269. [Google Scholar] [CrossRef]
- Apolinario, I.; De Barros, C.C.; Coutinho, H.; Ferreira, L.; Madeira, B.; Oliveira, P.; Tavares, A.; Trindade, A.; Verdelho, P. Behavioural Factors’ Influence on Energy Savings. In Proceedings of the IET Conference Publications; IET: Prague, Czech Republic, 2009; p. 930. [Google Scholar]
- Hashizume, A.; Mizuno, T.; Mineno, H. Energy Monitoring System Using Sensor Networks in Residential Houses. In Proceedings of the 2012 26th International Conference on Advanced Information Networking and Applications Workshops, Fukuoka, Japan, 26–29 March 2012; IEEE: Fukuoka, Japan, March, 2012; pp. 595–600. [Google Scholar]
- Levesque, A.; Pietzcker, R.C.; Luderer, G. Halving Energy Demand from Buildings: The Impact of Low Consumption Practices. Technol. Forecast. Soc. Change 2019, 146, 253–266. [Google Scholar] [CrossRef]
- Eerma, M.H.; Manning, D.; Økland, G.L.; Rodriguez Del Angel, C.; Seifert, P.E.; Winkler, J.; Zamora Blaumann, A.; Zozmann, E.; Hosseinioun, S.S.; Göke, L.; et al. The Potential of Behavioral Changes to Achieve a Fully Renewable Energy System—A Case Study for Germany. Renew. Sustain. Energy Transit. 2022, 2, 100028. [Google Scholar] [CrossRef]
- Hong, S.H.; Oreszczyn, T.; Ridley, I. The Impact of Energy Efficient Refurbishment on the Space Heating Fuel Consumption in English Dwellings. Energy Build. 2006, 38, 1171–1181. [Google Scholar] [CrossRef]
- Gustafsson, M.; Gustafsson, M.S.; Myhren, J.A.; Bales, C.; Holmberg, S. Techno-Economic Analysis of Energy Renovation Measures for a District Heated Multi-Family House. Appl. Energy 2016, 177, 108–116. [Google Scholar] [CrossRef]
- Staveckis, A.; Zemitis, J. Impact of the Limited Heat Source Capacity on Indoor Temperature and Energy Consumption in Serial nZEB Residential Buildings across the Baltic Region. Energies 2023, 16, 5924. [Google Scholar] [CrossRef]
- Al-Atari, Z.; Shipman, R.; Gillott, M. Optimisation of Integrated Heat Pump and Thermal Energy Storage Systems in Active Buildings for Community Heat Decarbonisation. Energies 2024, 17, 5310. [Google Scholar] [CrossRef]
- Feng, C.; Wang, H.; Lu, N.; Chen, T.; He, H.; Lu, Y.; Tu, X.M. Log-Transformation and Its Implications for Data Analysis. PubMed 2014, 26, 105–109. [Google Scholar]
- Hammouri, H.M.; Sabo, R.T.; Alsaadawi, R.; Kheirallah, K.A. Handling Skewed Data: A Comparison of Two Popular Methods. Appl. Sci. 2020, 10, 6247. [Google Scholar] [CrossRef]
- Stockhammar, P.; Öller, L.-E. A Simple Heteroscedasticity Removing Filter. Commun. Stat. Theory Methods 2012, 41, 281–299. [Google Scholar] [CrossRef]
- Nair, G.; Gustavsson, L.; Mahapatra, K. Factors Influencing Energy Efficiency Investments in Existing Swedish Residential Buildings. Energy Policy 2010, 38, 2956–2963. [Google Scholar] [CrossRef]
- Ameli, N.; Brandt, N. Determinants of Households’ Investment in Energy Efficiency and Renewables: Evidence from the OECD Survey on Household Environmental Behaviour and Attitudes. Environ. Res. Lett. 2015, 10, 044015. [Google Scholar] [CrossRef]
- Trotta, G. Factors Affecting Energy-Saving Behaviours and Energy Efficiency Investments in British Households. Energy Policy 2018, 114, 529–539. [Google Scholar] [CrossRef]
- Sidqi, Y.; Ferrez, P.; Gabioud, D.; Roduit, P. Flexibility Quantification in Households: A Swiss Case Study. Energy Inf. 2020, 3, 23. [Google Scholar] [CrossRef]
- Chun-sheng, Z.; Shu-wen, N.; Xin, Z. Effects of Household Energy Consumption on Environment and Its Influence Factors in Rural and Urban Areas. Energy Procedia 2012, 14, 805–811. [Google Scholar] [CrossRef]
- Ding, Z.; Wang, G.; Liu, Z.; Long, R. Research on Differences in the Factors Influencing the Energy-Saving Behavior of Urban and Rural Residents in China–A Case Study of Jiangsu Province. Energy Policy 2017, 100, 252–259. [Google Scholar] [CrossRef]
- Wang, S.; Sun, S.; Zhao, E.; Wang, S. Urban and Rural Differences with Regional Assessment of Household Energy Consumption in China. Energy 2021, 232, 121091. [Google Scholar] [CrossRef]
- Tjørring, L.; Jensen, C.L.; Hansen, L.G.; Andersen, L.M. Increasing the Flexibility of Electricity Consumption in Private Households: Does Gender Matter? Energy Policy 2018, 118, 9–18. [Google Scholar] [CrossRef]
- Atkinson, A.C.; Riani, M.; Corbellini, A. The Box–Cox Transformation: Review and Extensions. Statist. Sci. 2021, 36, 239–255. [Google Scholar] [CrossRef]
- Konietschke, F.; Bathke, A.C.; Harrar, S.W.; Pauly, M. Parametric and Nonparametric Bootstrap Methods for General MANOVA. J. Multivar. Anal. 2015, 140, 291–301. [Google Scholar] [CrossRef]
- Cribari-Neto, F.; Zarkos, S.G. Bootstrap Methods for Heteroskedastic Regression Models: Evidence on Estimation and Testing. Econom. Rev. 1999, 18, 211–228. [Google Scholar] [CrossRef]
- Streukens, S.; Leroi-Werelds, S. Bootstrapping and PLS-SEM: A Step-by-Step Guide to Get More out of Your Bootstrap Results. Eur. Manag. J. 2016, 34, 618–632. [Google Scholar] [CrossRef]
- VanderWeele, T.J.; Mathur, M.B. Some Desirable Properties of the Bonferroni Correction: Is the Bonferroni Correction so bad? Am. J. Epidemiol. 2019, 188, 617–618. [Google Scholar] [CrossRef]
- Barnett, M.J.; Doroudgar, S.; Khosraviani, V.; Ip, E.J. Multiple Comparisons: To Compare or Not to Compare, That Is the Question. Res. Soc. Adm. Pharm. 2022, 18, 2331–2334. [Google Scholar] [CrossRef]
- Armstrong, R.A. When to Use the B Onferroni Correction. Ophthalmic Physiol. Opt. 2014, 34, 502–508. [Google Scholar] [CrossRef]
- Gajdzik, B.; Wolniak, R.; Nagaj, R.; Žuromskaitė-Nagaj, B.; Grebski, W.W. The Influence of the Global Energy Crisis on Energy Efficiency: A Comprehensive Analysis. Energies 2024, 17, 947. [Google Scholar] [CrossRef]
- Matar, W. Residential Energy Efficiency Investment and Behavioural Response under Different Electricity Pricing Schemes: A Physical-Microeconomic Approach. Int. J. Sustain. Energy 2021, 40, 1–21. [Google Scholar] [CrossRef]
- Sotnyk, I.; Kurbatova, T.; Trypolska, G.; Sokhan, I.; Koshel, V. Research Trends on Development of Energy Efficiency and Renewable Energy in Households: A Bibliometric Analysis. Environ. Econ. 2023, 14, 13–27. [Google Scholar] [CrossRef]
- Weiner, C.; Szép, T. The Hungarian Utility Cost Reduction Programme: An Impact Assessment. Energy Strategy Rev. 2022, 40, 100817. [Google Scholar] [CrossRef]
- Vijay, A.; Hawkes, A. The Techno-Economics of Small-Scale Residential Heating in Low Carbon Futures. Energies 2017, 10, 1915. [Google Scholar] [CrossRef]
- Tuominen, P.; Forsström, J.; Honkatukia, J. Economic Effects of Energy Efficiency Improvements in the Finnish Building Stock. Energy Policy 2013, 52, 181–189. [Google Scholar] [CrossRef]
- Aunedi, M.; Pantaleo, A.M.; Kuriyan, K.; Strbac, G.; Shah, N. Modelling of National and Local Interactions between Heat and Electricity Networks in Low-Carbon Energy Systems. Appl. Energy 2020, 276, 115522. [Google Scholar] [CrossRef]
- Kokoni, S.; Leach, M. Policy Mechanisms to Support Heat Pump Deployment: A UK Case Study Based on Techno-Economic Modelling. Renew. Sustain. Energy Transit. 2021, 1, 100009. [Google Scholar] [CrossRef]
- Pena-Bello, A.; Schuetz, P.; Berger, M.; Worlitschek, J.; Patel, M.K.; Parra, D. Decarbonizing Heat with PV-Coupled Heat Pumps Supported by Electricity and Heat Storage: Impacts and Trade-Offs for Prosumers and the Grid. Energy Convers. Manag. 2021, 240, 114220. [Google Scholar] [CrossRef]
- Oprea, S.-V.; Bâra, A. Mind the Gap between PV Generation and Residential Load Curves: Maximizing the Roof-Top PV Usage for Prosumers with an IoT-Based Adaptive Optimization and Control Module. Expert. Syst. Appl. 2023, 212, 118828. [Google Scholar] [CrossRef]
- Biondi, A.; Caponi, P.; Cecere, C.; Sciubba, E. An Exergy-Based Analysis of the Effects of Public Incentives on the so-Called “Energy Efficiency” of the Residential Sector, with Emphasis on Primary Resource Use and Economics of Scale. Front. Sustain. 2024, 5, 1397416. [Google Scholar] [CrossRef]
- Calvillo, C.F.; Katris, A.; Alabi, O.; Stewart, J.; Zhou, L.; Turner, K. Technology Pathways, Efficiency Gains and Price Implications of Decarbonising Residential Heat in the UK. Energy Strategy Rev. 2023, 48, 101113. [Google Scholar] [CrossRef]
- Prokopenko, O.; Kovalenko, Y.; Lytvynenko, S.; Riabtsev, D. Development and Analysis of Investment Strategies in Energy Efficiency for Ukrainian Household Prosumers. J. Vasyl Stefanyk Precarpathian Natl. Univ. 2024, 11, 62–78. [Google Scholar] [CrossRef]
- Sloot, D.; Jans, L.; Steg, L. In It for the Money, the Environment, or the Community? Motives for Being Involved in Community Energy Initiatives. Glob. Environ. Change 2019, 57, 101936. [Google Scholar] [CrossRef]
- Krug, M.; Di Nucci, M.R.; Caldera, M.; De Luca, E. Mainstreaming Community Energy: Is the Renewable Energy Directive a Driver for Renewable Energy Communities in Germany and Italy? Sustainability 2022, 14, 7181. [Google Scholar] [CrossRef]
- Maréchal, K. Not Irrational but Habitual: The Importance of “Behavioural Lock-in” in Energy Consumption. Ecol. Econ. 2010, 69, 1104–1114. [Google Scholar] [CrossRef]
- Myers, E.; Souza, M. Social Comparison Nudges without Monetary Incentives: Evidence from Home Energy Reports. J. Environ. Econ. Manag. 2020, 101, 102315. [Google Scholar] [CrossRef]
- Almeida, R.; Georgieva, P.; Martins, N. Heating Setpoint Recommendation Strategy for Thermal Comfort and Energy Consumption Optimization. Energy Build. 2023, 296, 113406. [Google Scholar] [CrossRef]
- Simon, J.; Sánta, R. Energy Efficient Smart Home Heating System Using Renewable Energy Source with Fuzzy Control Design. Decis. Mak. Appl. Manag. Eng. 2023, 6, 948. [Google Scholar] [CrossRef]
- Brown, M.A.; Soni, A.; Lapsa, M.V.; Southworth, K.; Cox, M. High Energy Burden and Low-Income Energy Affordability: Conclusions from a Literature Review. Prog. Energy 2020, 2, 042003. [Google Scholar] [CrossRef]
- Hanke, F.; Lowitzsch, J. Empowering Vulnerable Consumers to Join Renewable Energy Communities—Towards an Inclusive Design of the Clean Energy Package. Energies 2020, 13, 1615. [Google Scholar] [CrossRef]
Disclaimer/Publisher’s Note: The statements, opinions and data contained in all publications are solely those of the individual author(s) and contributor(s) and not of MDPI and/or the editor(s). MDPI and/or the editor(s) disclaim responsibility for any injury to people or property resulting from any ideas, methods, instructions or products referred to in the content. |
© 2025 by the authors. Licensee MDPI, Basel, Switzerland. This article is an open access article distributed under the terms and conditions of the Creative Commons Attribution (CC BY) license (https://creativecommons.org/licenses/by/4.0/).