Article

Demulsification Kinetics of Water-in-Oil Emulsions of Ecuadorian Crude Oil: Influence of Temperature and Salinity

by
Jordy Sarmas-Farfan
1,2,
Antonio Diaz-Barrios
2,
Teresa E. Lehmann
3 and
Vladimir Alvarado
1,*
1
Department of Chemical Engineering, University of Wyoming, Laramie, WY 82071, USA
2
School of Chemical Sciences and Engineering, Yachay Tech University, Urcuqui 100115, Ecuador
3
Department of Chemistry, University of Wyoming, Laramie, WY 82071, USA
*
Author to whom correspondence should be addressed.
Energies 2025, 18(12), 3115; https://doi.org/10.3390/en18123115
Submission received: 10 May 2025 / Revised: 2 June 2025 / Accepted: 10 June 2025 / Published: 13 June 2025

Abstract

:
This work focuses on the stability analysis of water-in-oil macroemulsions with a crude oil from the Sacha Field in Ecuador. This field is an important hydrocarbon resource in Ecuador with a typical bottom freshwater drive. The comprehensive stability analysis includes coalescence, water resolution or phase separation, and water–oil interfacial tension and interfacial dilatational viscoelastic modulus measurements over time. Two main parameters, due to their relevance, were controlled in these experiments: water salinity and temperature. The analysis reported here is the first focused on this important resource in Ecuador. Findings shed light on which mechanisms more likely control the stability of these water-in-oil macroemulsions. Results herein suggest that regardless of temperature, low-salinity water favors emulsion stability, likely due to the tendency of a stiffer interface formation at low-ionic strength, as interfacial viscoelasticity measurements show. This implies that the low-ionic strength water from the aquifer can enable the formation of stable emulsions. In contrast, water resolution depends significantly on temperature, possibly due to higher sedimentation rates. The implication is that if emulsions do not break up before cooling off, the emulsion can become more stable. Finally, analysis of the interface buildup rates could explain the observed increase in emulsion stability over time.

1. Introduction

An emulsion is a dispersion comprised of two or more immiscible phases and an interfacial stabilizer, called an emulsifier or a surfactant. Emulsions emerge during the production of hydrocarbons, by the combined action of natural tensoactive molecules found in crude oil and energetic fluid agitation, induced by pumping or flow through porous media in reservoirs [1,2]. Emulsions can be water-in-oil, where the continuous phase is oil and the dispersed phase is water; oil-in-water, where the oil is the dispersed phase; and multiple emulsions, in which a dispersed phase can exist within a second dispersed phase. Traditionally, emulsions are considered undesirable because emulsified crude oil affects downstream operations such as multiphase flow separation and product quality [3]. Moreover, water-in-oil (W/O) emulsions can hinder recovery as the dispersed water phase in oil increases the continuous (oil) viscosity [4]. However, in recent years, emulsion analysis has been linked to beneficial mechanisms in enhanced oil recovery processes as these dispersions can function as mobility control or conformance agents [5,6].
Some authors have focused on the association between demulsification kinetics and the stability of oil/brine interfaces [7]. This idea highlights that the strengthening of fluid/fluid interactions can give rise to a better connectivity of oil ganglia in porous media and therefore, greater oil recovery. Macro-emulsions are thermodynamically unstable but can exhibit kinetic stability due to the competition of opposing forces acting over the dispersed phase. These forces can be repulsive, like steric and electrostatic interactions, or attractive like van der Waals [8]. London dispersion forces arising from charge fluctuations are the most important of the van der Waals attracting forces. The most important in emulsions are the forces that arise from charge fluctuations. Consequently, in the absence of emulsifiers, flocculation and demulsification should occur spontaneously and rapidly. Because this does not happen, repulsive forces are evidently acting as well. When charged droplets in an emulsion approach each other, their double layers overlap and repulsion takes place. The extent of the double layer hinges on electrolyte concentration and valence, specifically, a decrease in concentration and a low valence will generate an enlarged double layer and more significant repulsion. Finally, steric repulsion arises from the adsorption of nonionic surfactants and polymers at the interface of liquids. The thickness of hydrophilic chains produces repulsion because of an adverse mixing of the chains [9].
Emulsion breakdown encompasses three main steps: flocculation, coalescence, and sedimentation or creaming, before phase separation takes place [10]. Sedimentation happens in W/O emulsions in which water droplets sink due to their density being higher than that of crude oil (provided the API gravity is higher than 10, specifically for heavy oil or less dense fluids). Gravitational sedimentation is approximately predicted by Stokes’ law, which permits calculation of the settling velocity of a suspended sphere in a viscous fluid at a low Reynolds number [11]. On the other hand, creaming is a process similar to sedimentation that takes place in oil-in-water (O/W) emulsions when oil droplets rise because of their lower density compared to that in the continuous aqueous phase. Flocculation or aggregation is frequently the initial stage in emulsion breakage. During flocculation, dispersed phase droplets tend to cluster together, resulting in aggregates. Despite getting closer together, even creating junctures at some contact points, the droplets do not necessarily lose their identity [12]. However, during coalescence, droplets of the dispersed phase exchange mass and release interfacial energy, eventually forming larger drops. This process is irreversible, attaining a lower free-energy state and prompting a decrease in the number of droplets [13].
Several factors influence emulsion stability, including phase density and viscosity, crude oil and brine composition, interface aging and its resulting mechanical properties, volume phase ratio, droplet size, and temperature, among others [14].
Emulsion stability is the ability of emulsions to remain unchanged for extended periods of time, in terms of droplet size distribution. Stability is affected by the components of the phases and the conditions leading to emulsion formation. Some features, such as dispersed phase concentration and droplet size, interface charge and rheology, among others, can be used to assess the stability of emulsions [15].
Microscopy allows the assessment of the droplet size distribution (DSD) to ascertain relative emulsion stability by tracking DSD over time. Flocculation can be determined when droplets approach each other to form aggregates. On the other hand, a non-flocculated emulsion will display homogenously organized droplets of small size [16]. While microscopy is an intuitive, fast, and inexpensive technique for analyzing emulsions qualitatively, the reproducibility problems of the quantitative results make it necessary to use alternative techniques.
After the flocculation and coalescence steps, some methods rely on phase separation measurements. These generally consist of measuring the fraction of the resolved phase from the original dispersion, driven either by naturally induced or external mechanisms. According to this technique, the emulsion is more stable and the smaller the dispersed phase-resolved volume is [17]. Even though this technique provides a simple scheme for unraveling emulsion stability, the demulsification process must be studied in its totality. This means that it is not always feasible to discriminate against the occurrence of diverse demulsification steps. This technique is not suitable for tight, stiff emulsions or those with poorly defined interfaces [18].
The purpose of this research is to determine the effect of aqueous-phase salinity and temperature on the stability of the destabilization response of proxy water-in-oil emulsions generated using an Ecuadorian crude oil. Despite extensive research on emulsion stability, only a few research works quantitatively describe how temperature and salinity affect the demulsification rate through the different stages of emulsion breakdown leading to phase separation. This is particularly important for this type of crude oil produced from a basin where a natural water drive with relatively fresh water takes place. This study is likely the first to report such an analysis for this variety of Amazonian crude oils. Fluid/fluid interactions that reflect equilibrium (interfacial tension) and dynamic response (interfacial viscoelasticity) depend on both the brine and the crude oil characteristics. The ultimate aim of this work is to ascertain the importance of temperature, within the range possible under our experimental conditions, and low versus high salinity conditions on the relative stability of W/O macroemulsions formulated with this Ecuadorian crude oil. Because this type of Amazonian crude oil is often exposed to low-ionic strength water, we aimed to determine if this condition could increase emulsion stability as opposed to an ionic strength like that of seawater. The intention, however, was not to conduct a salinity scan. Both DSD, via Time-Domain Nuclear Magnetic Resonance (TD-NMR), and phase separation, via a bottle test, were conducted as proxies of two dominant stages that reflect emulsion stability. To understand the interfacial mechanisms contributing to emulsion stability, interfacial tension and dilatational interfacial rheology were determined using a pendant-drop tensiometer with an oscillating drop generator (ODG).

2. Materials and Methods

2.1. Crude Oil

A representative sample of a medium crude oil taken from the Sacha Field, in the Ecuadorian Amazon Basin, was used in all experiments. This sample was characterized by density, viscosity and percentage of asphaltenes measurements using the following equipment and conditions: (a) density with an Anton Paar DMA 4500M Density meter (Torrance, CA, USA) at 25 °C; (b) the percentage of asphaltenes by using the ASTM D6560 standard [19], based on the insolubility of these molecules in heptane; c) viscosity with an AR-G2 Magnetic Bearing Rheometer (TA Instruments, New Castle, DE, USA), executing a frequency sweep from 0.05 to 500 Hz at 25 °C. The results of the crude oil characterization are summarized in Table 1.

2.2. Aqueous Phase

Deionized water and a mixture of different analytical grade salts, namely, N a C l , N a H C O 3 , C a C l 2 , a n d M g C l 2 , were used to prepare the aqueous phases. The proportions of the salts were selected to emulate the composition of formation water from the Sacha Field, serving as the mother solution and labeled as 100% formation water (FW). A one-hundred-fold dilution of the mother solution with DI water was labeled as 1% FW. The density of the solutions was measured using an Anton Paar Density meter DMA 4500M (Torrance, CA, USA) at 25 °C. The pH of the solutions was determined by using a VWR B10P (SympHony) pH meter (Radnor, PA, USA). The results of the aqueous phase characterization are presented in Table 2.

2.3. Emulsion Preparation

Emulsions were prepared by mixing 75 mL of crude oil with 25 mL of brine in a homogenizer UltraTurrax T25 Basic (IKA, Wilmington, NC, USA) so that the volumetric ratio of phases was 3:1. Mixing was conducted at an agitation speed of 8000 rpm for 5 min. The volumetric fluid ratio was selected based on our extensive experience with other crude oils leading to W/O emulsions. The fluid shearing procedure was also based on previous experience in our laboratory. The stirring speed and time selected from experience were adequate to effectively produce a dispersion that would not break up too rapidly while also avoiding the generation of tight emulsions. No exogenous emulsifiers were used.

2.4. Bottle Test Measurements

This technique focuses on the analysis of the phase separation step. The bottle tests were performed following the ASTM D1401-02 standard [20], corresponding to the water and oil separability test. A special separability apparatus was used, consisting of a thermal bath and a mixer. Once the emulsions were prepared and the temperature of interest was selected, the volume of resolved water (water volume at the bottom of the bottle) was recorded every 5 min for one hour, as specified by the standard. Fresh crude oil and brines were used for each measurement to avoid the effects of interfacial aging and crude oil oxidation on the results.

2.5. Interfacial Tension (IFT) Measurements

A pendant drop tensiometer (OCA 15, DataPhysics Instruments, Charlotte, NC, USA), set up with a high-speed camera, was used to measure IFT. The solution under study was filtered with a 0.2 nm SFCA filter and placed in a quartz cuvette. A drop of crude oil was formed using a top-to-bottom geometry (J-shaped needle 18, ID: 1.27 mm). The IFT was measured every hour immediately after drop formation. To circumvent the effects of evaporation on the brine concentration, the cuvette was sealed with mineral oil. The Worthington number (Wo) was used to validate the measurements obtained using this technique. Wo = 1 would be the ideal case:
Wo = ∆ρgVd/πγDn
where ∆ρ is the density difference, Dn is the internal diameter of the syringe, g is the gravitational acceleration constant, γ is the equilibrium IFT, and Vd is the drop volume.
The oil droplet volume was selected to be 35 μL for all measurements. With this volume, the Worthington numbers ranged between 0.5 and 0.6. These values provided replicable measurement results.

2.6. Interfacial Dilatational Rheology Measurements

The same tensiometer setup used for the IFT measurements was configured with an oscillating drop generator (ODG, DataPhysics Instruments, Charlotte, NC, USA). Ten cycles were recorded at a capture rate of ten frames per second for oscillatory measurements. The interfacial viscoelasticity (IFVE) measurements were gathered from the examination of the Fourier transforms of the drop area and the IFT harmonics. The relaxation of the oil droplet, induced by a decline in its capillary pressure, had an impact on the character of the oscillations. Short periods (10 s) and appropriate deformation amplitudes were selected to diminish the effects of IFT decay on the harmonics baseline. To define the linear viscoelastic region, the elastic and viscous moduli of the crude oil/diluted formation brine system were measured after 1h of aging at a frequency of 0.1 Hz. The experiment was replicated with different drops. Only the amplitude of the deformations (strain) was changed, ranging between 2% and 6% of the original area of the drop. After defining the frequency and amplitude of the deformation, the viscoelasticity of the system was reported every hour for a period of eight hours, at temperatures of 25, 40, and 54 °C. Although the mineral oil seal successfully controlled the evaporation of the brines, when temperatures higher than those reported were attempted, the excessive thermal agitation of the system, due to the proximity of the boiling point of water, considerably deteriorated the droplet profile and prevented further measurements.

2.7. Shear Rheology Measurements

An ARG2 Magnetic Bearing Rheometer (TA Instruments, New Castle, DE, USA) was used to measure the crude oil shear viscosity as a function of temperature. A cone-and-plate fixture, 40 mm in diameter with a 2° cone, was used. For each measurement, 1 mL of crude oil was placed on the plate forming a 400 μm-thick film. Frequency sweeps ranged from 0.05 to 500 Hz. Temperatures ranged from 25 to 65 °C in 10 °C increments.

2.8. Pulsed Field Gradient Nuclear Magnetic Resonance (PFG-NMR) Measurements

This technique can be used to determine drop size in a non-invasive fashion because it does not require pressing the sample between layers, as in microscopy, or diluting the crude oil required for light scattering techniques. The instrument used was a minispec mq-20 TD-NMR Spectrometer (Bruker, Billerica, MA, USA). The processing software assumes that the droplet distribution of W/O emulsions is log normal. Experimental data indicated that this mathematical function is the most adequate to describe the particle size distribution of these systems. Samples tubes were consistently filled to 1 cm before any measurement was taken. A calibration was performed with doped water samples (0.5% m/m CuSO4.5H2O). Measurements were taken at 25 °C with field gradients of 2 T/m and δ values of 0.3 ms.

3. Results and Discussion

3.1. Salinity Effect

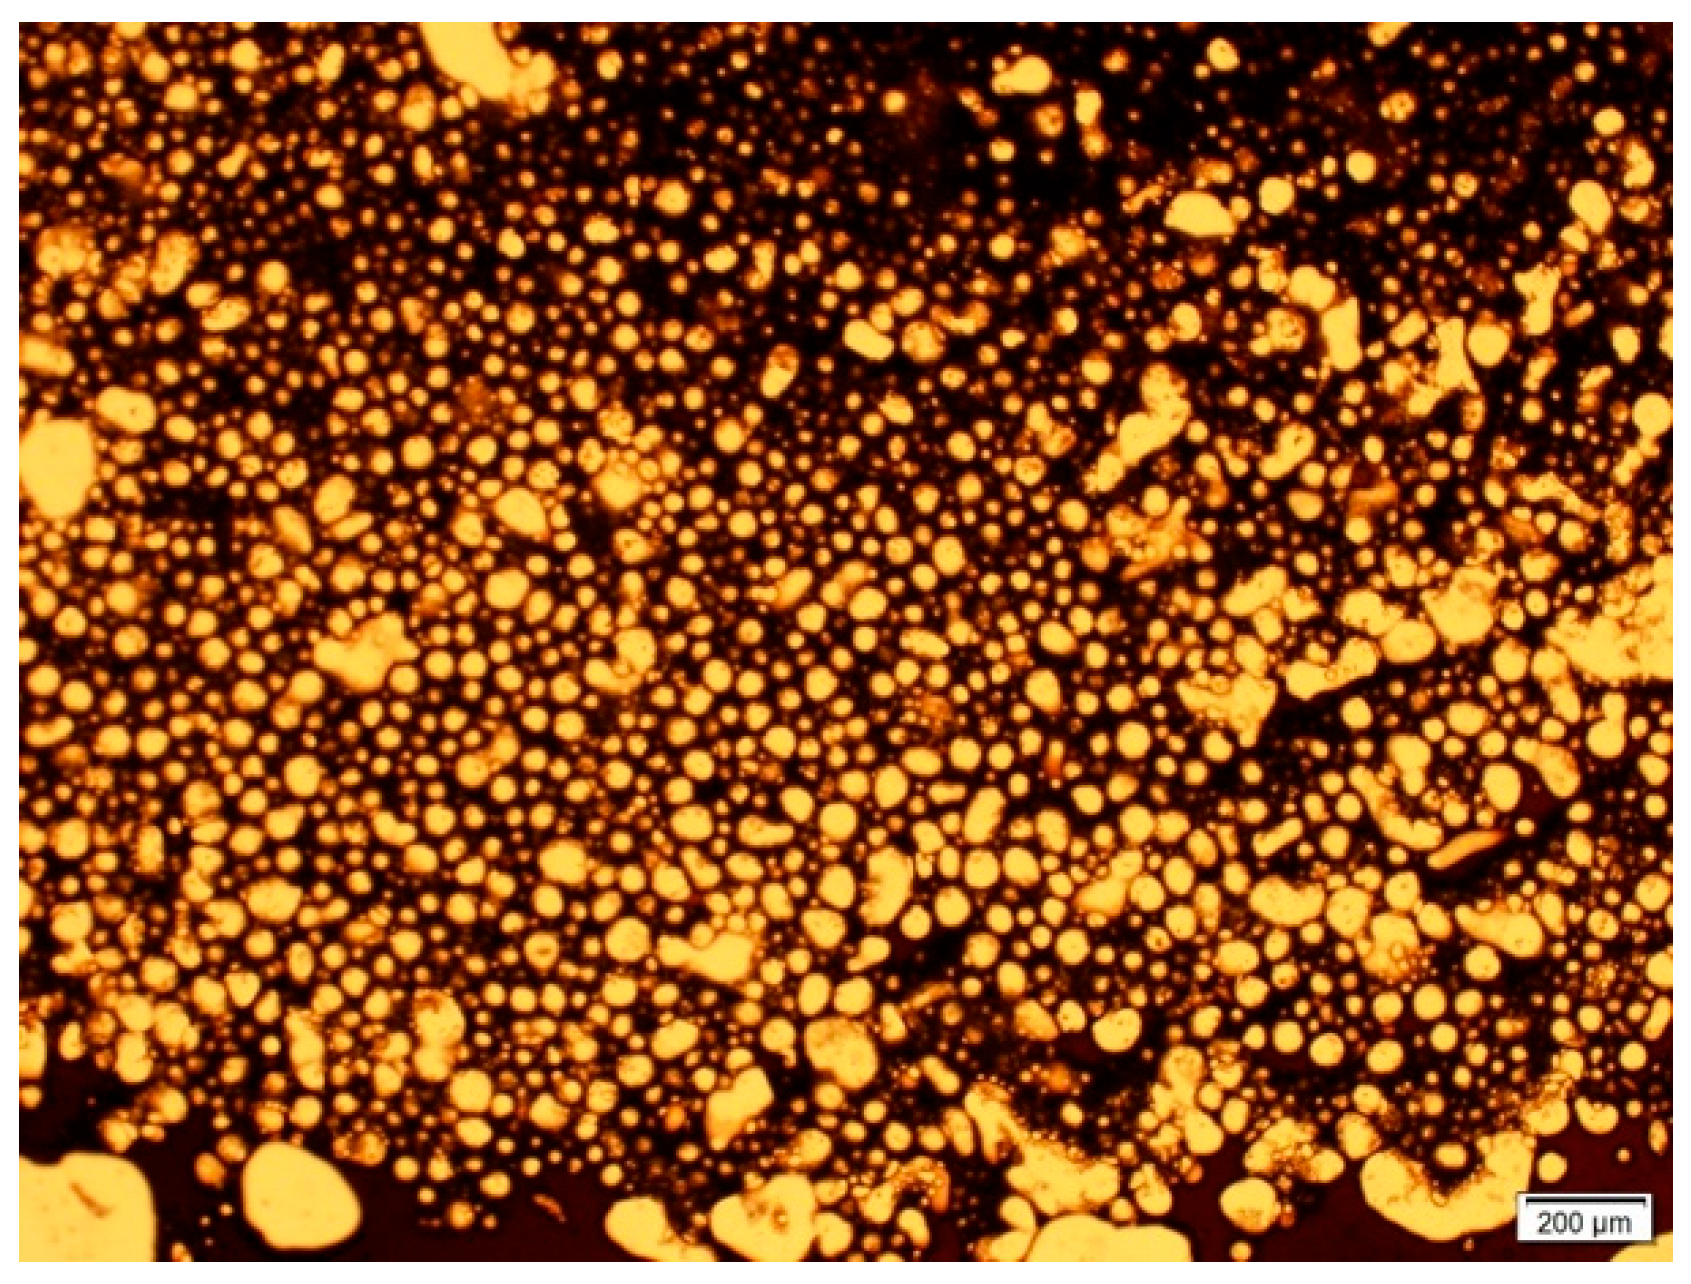
3.1.1. Emulsion Generation

Emulsions generated by mixing crude oil and the selected brines were effectively created without the addition of external emulsifiers. Polar organic substances, namely, resins, organics acids, and asphaltenes in crude oil, are known to exhibit amphiphilic properties and therefore act as surfactants [21]. The type of emulsion generated depends on the nature of the surfactants, the volumetric phase ratio, and other thermodynamic properties [9]. Figure 1 shows that the emulsions generated corresponded to W/O microemulsions with no significant presence of double emulsions.

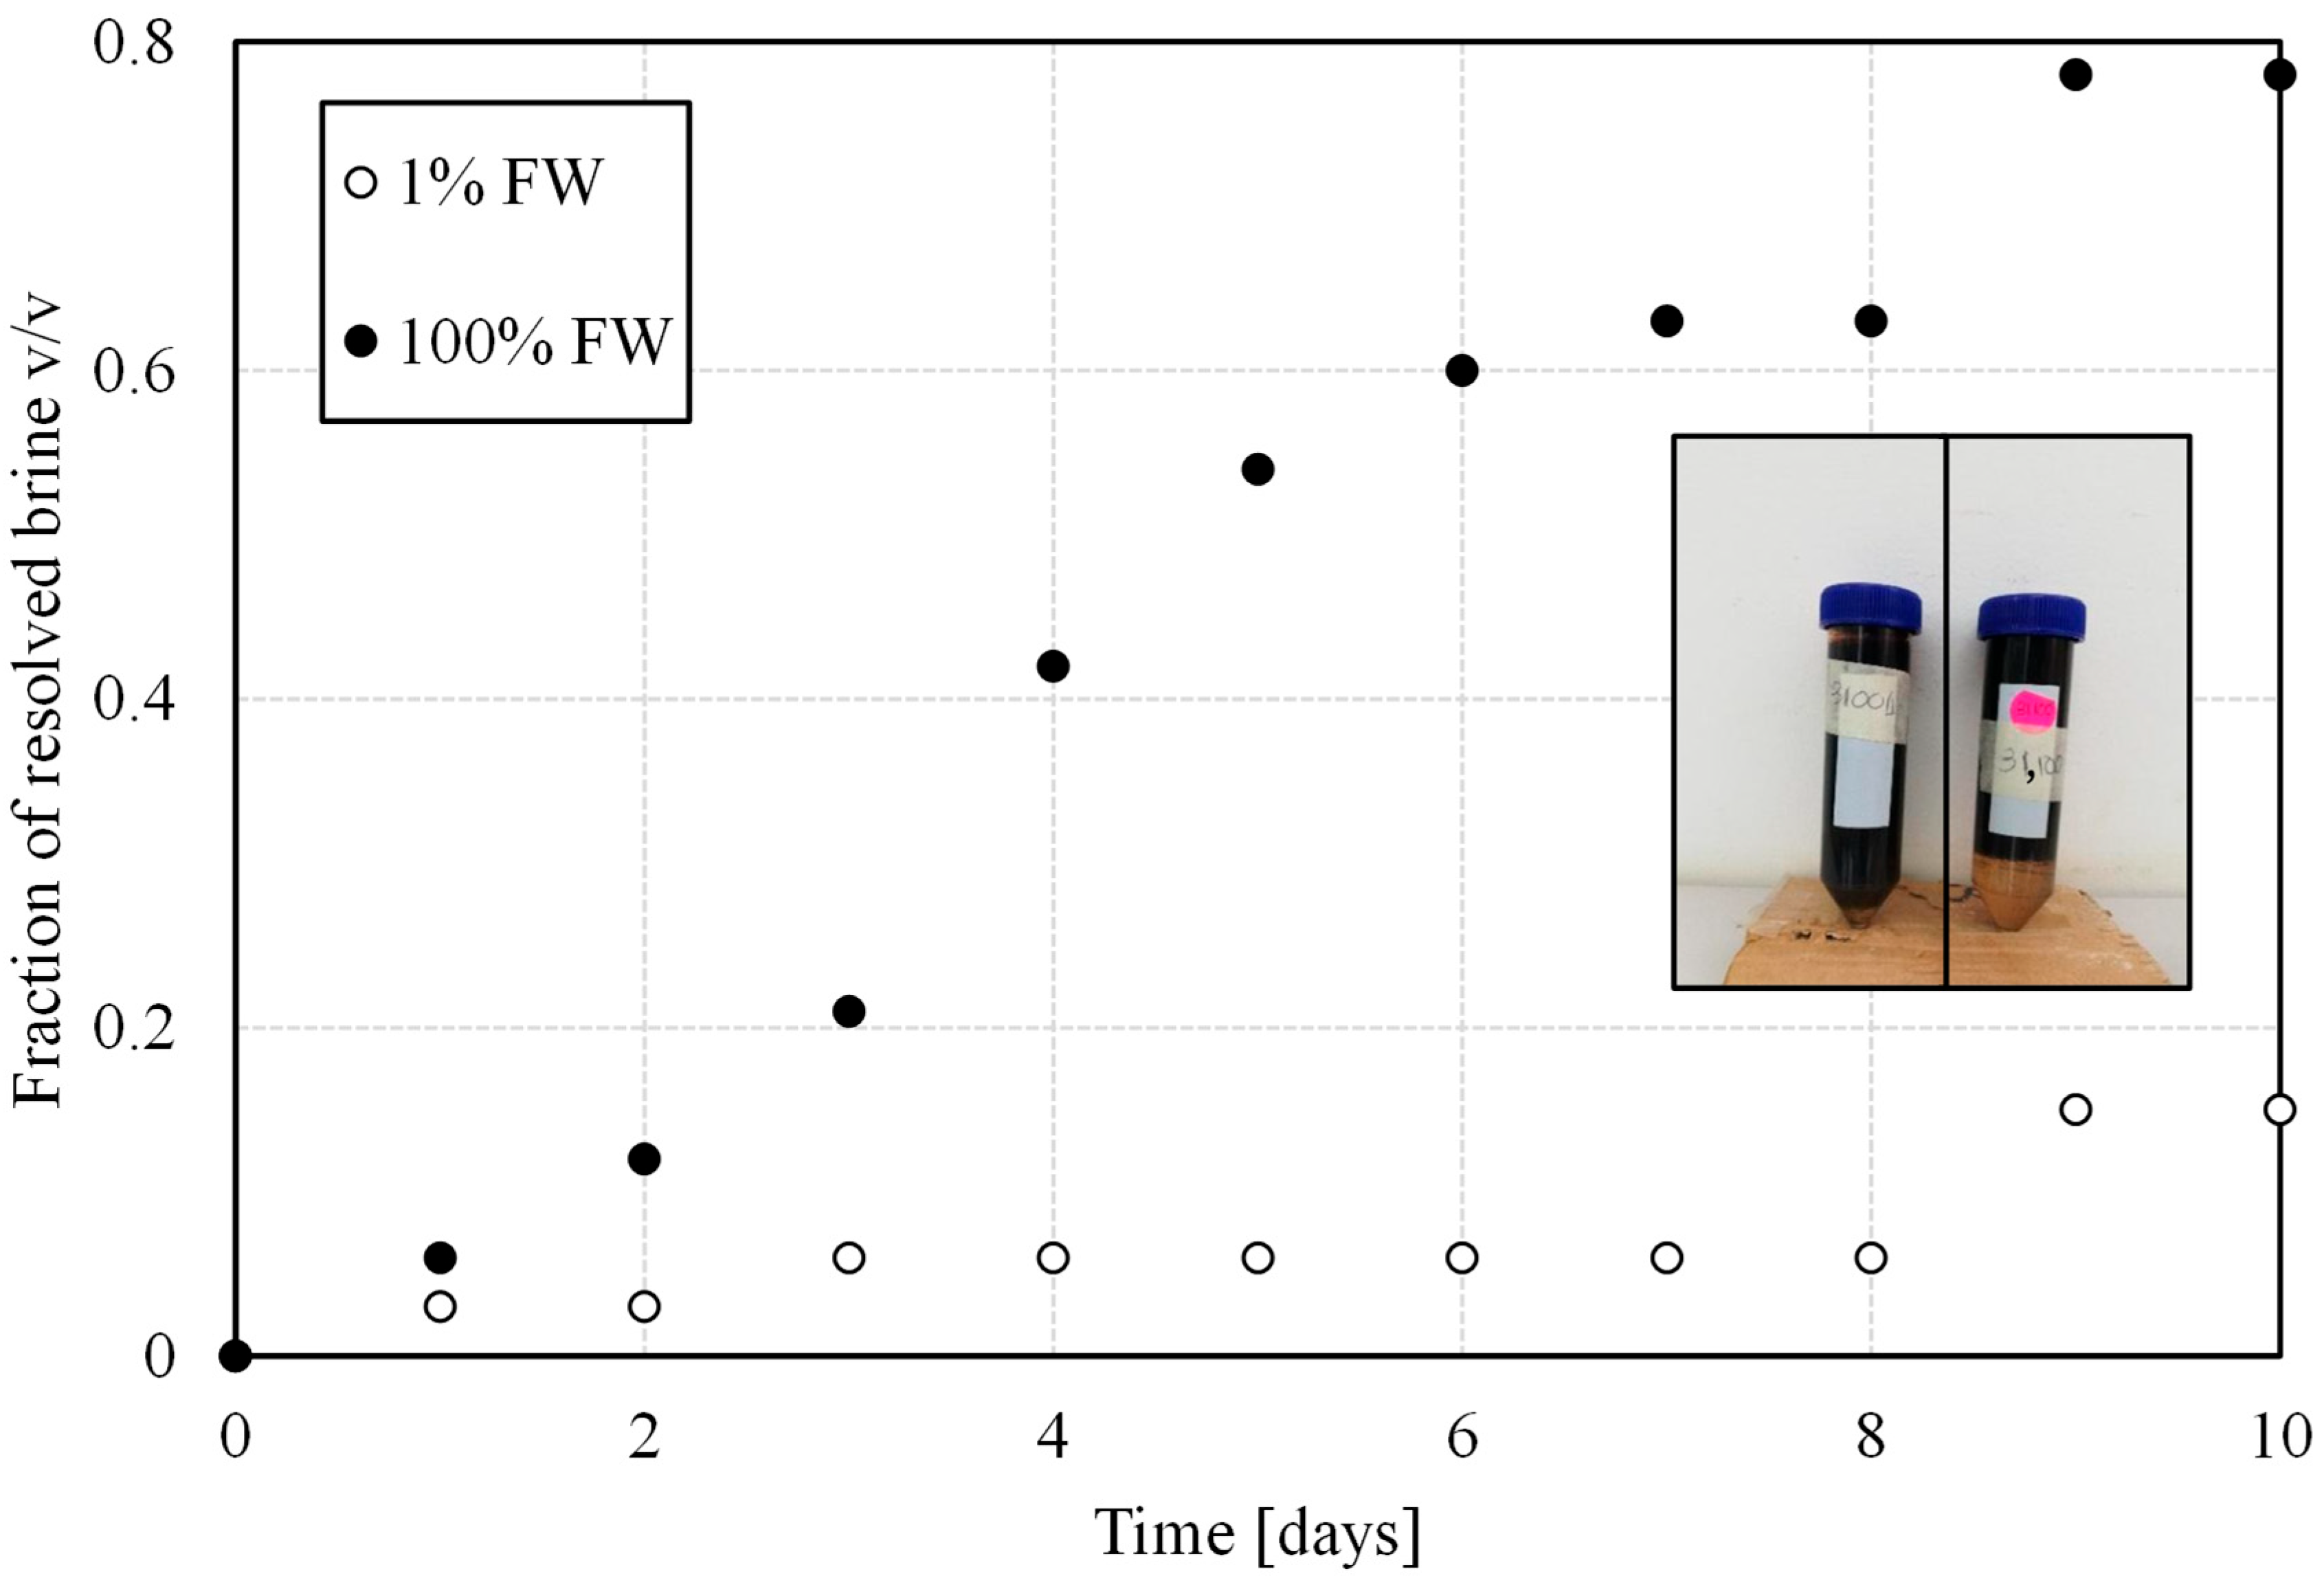
3.1.2. Bottle Tests: Salinity Effect

The bottle tests provided a first estimate of the stability of the emulsions. According to this test, the more stable an emulsion is, the fewer phases will be resolved over time. In the context of emulsions, resolving a phase implies its phase separation from the dispersion. As can be seen in Figure 2, reducing the salinity of the formation water one-hundred-fold led to more stable emulsions. Also from Figure 2, it is evidenced that the phase-separation process initiates during the first day after preparing the emulsions. However, while water resolution can be detected after one day, the total for the high-salinity aqueous phase approaches 80% v/v, in contrast to less than 20% v/v for the 1% salinity aqueous phase. This relative stability difference is significant enough to infer that mechanisms such as coalescence might be hindered by W/O interfacial strengthening. Bottle tests are practical and ideal for rapid analysis, but their simplicity limits the unveiling of processes leading to the emulsion’s breakdown. For this reason, these measurements were complemented with an analysis of droplet size distribution and interfacial properties to quantify the influence of salinity differences in the different demulsification steps.

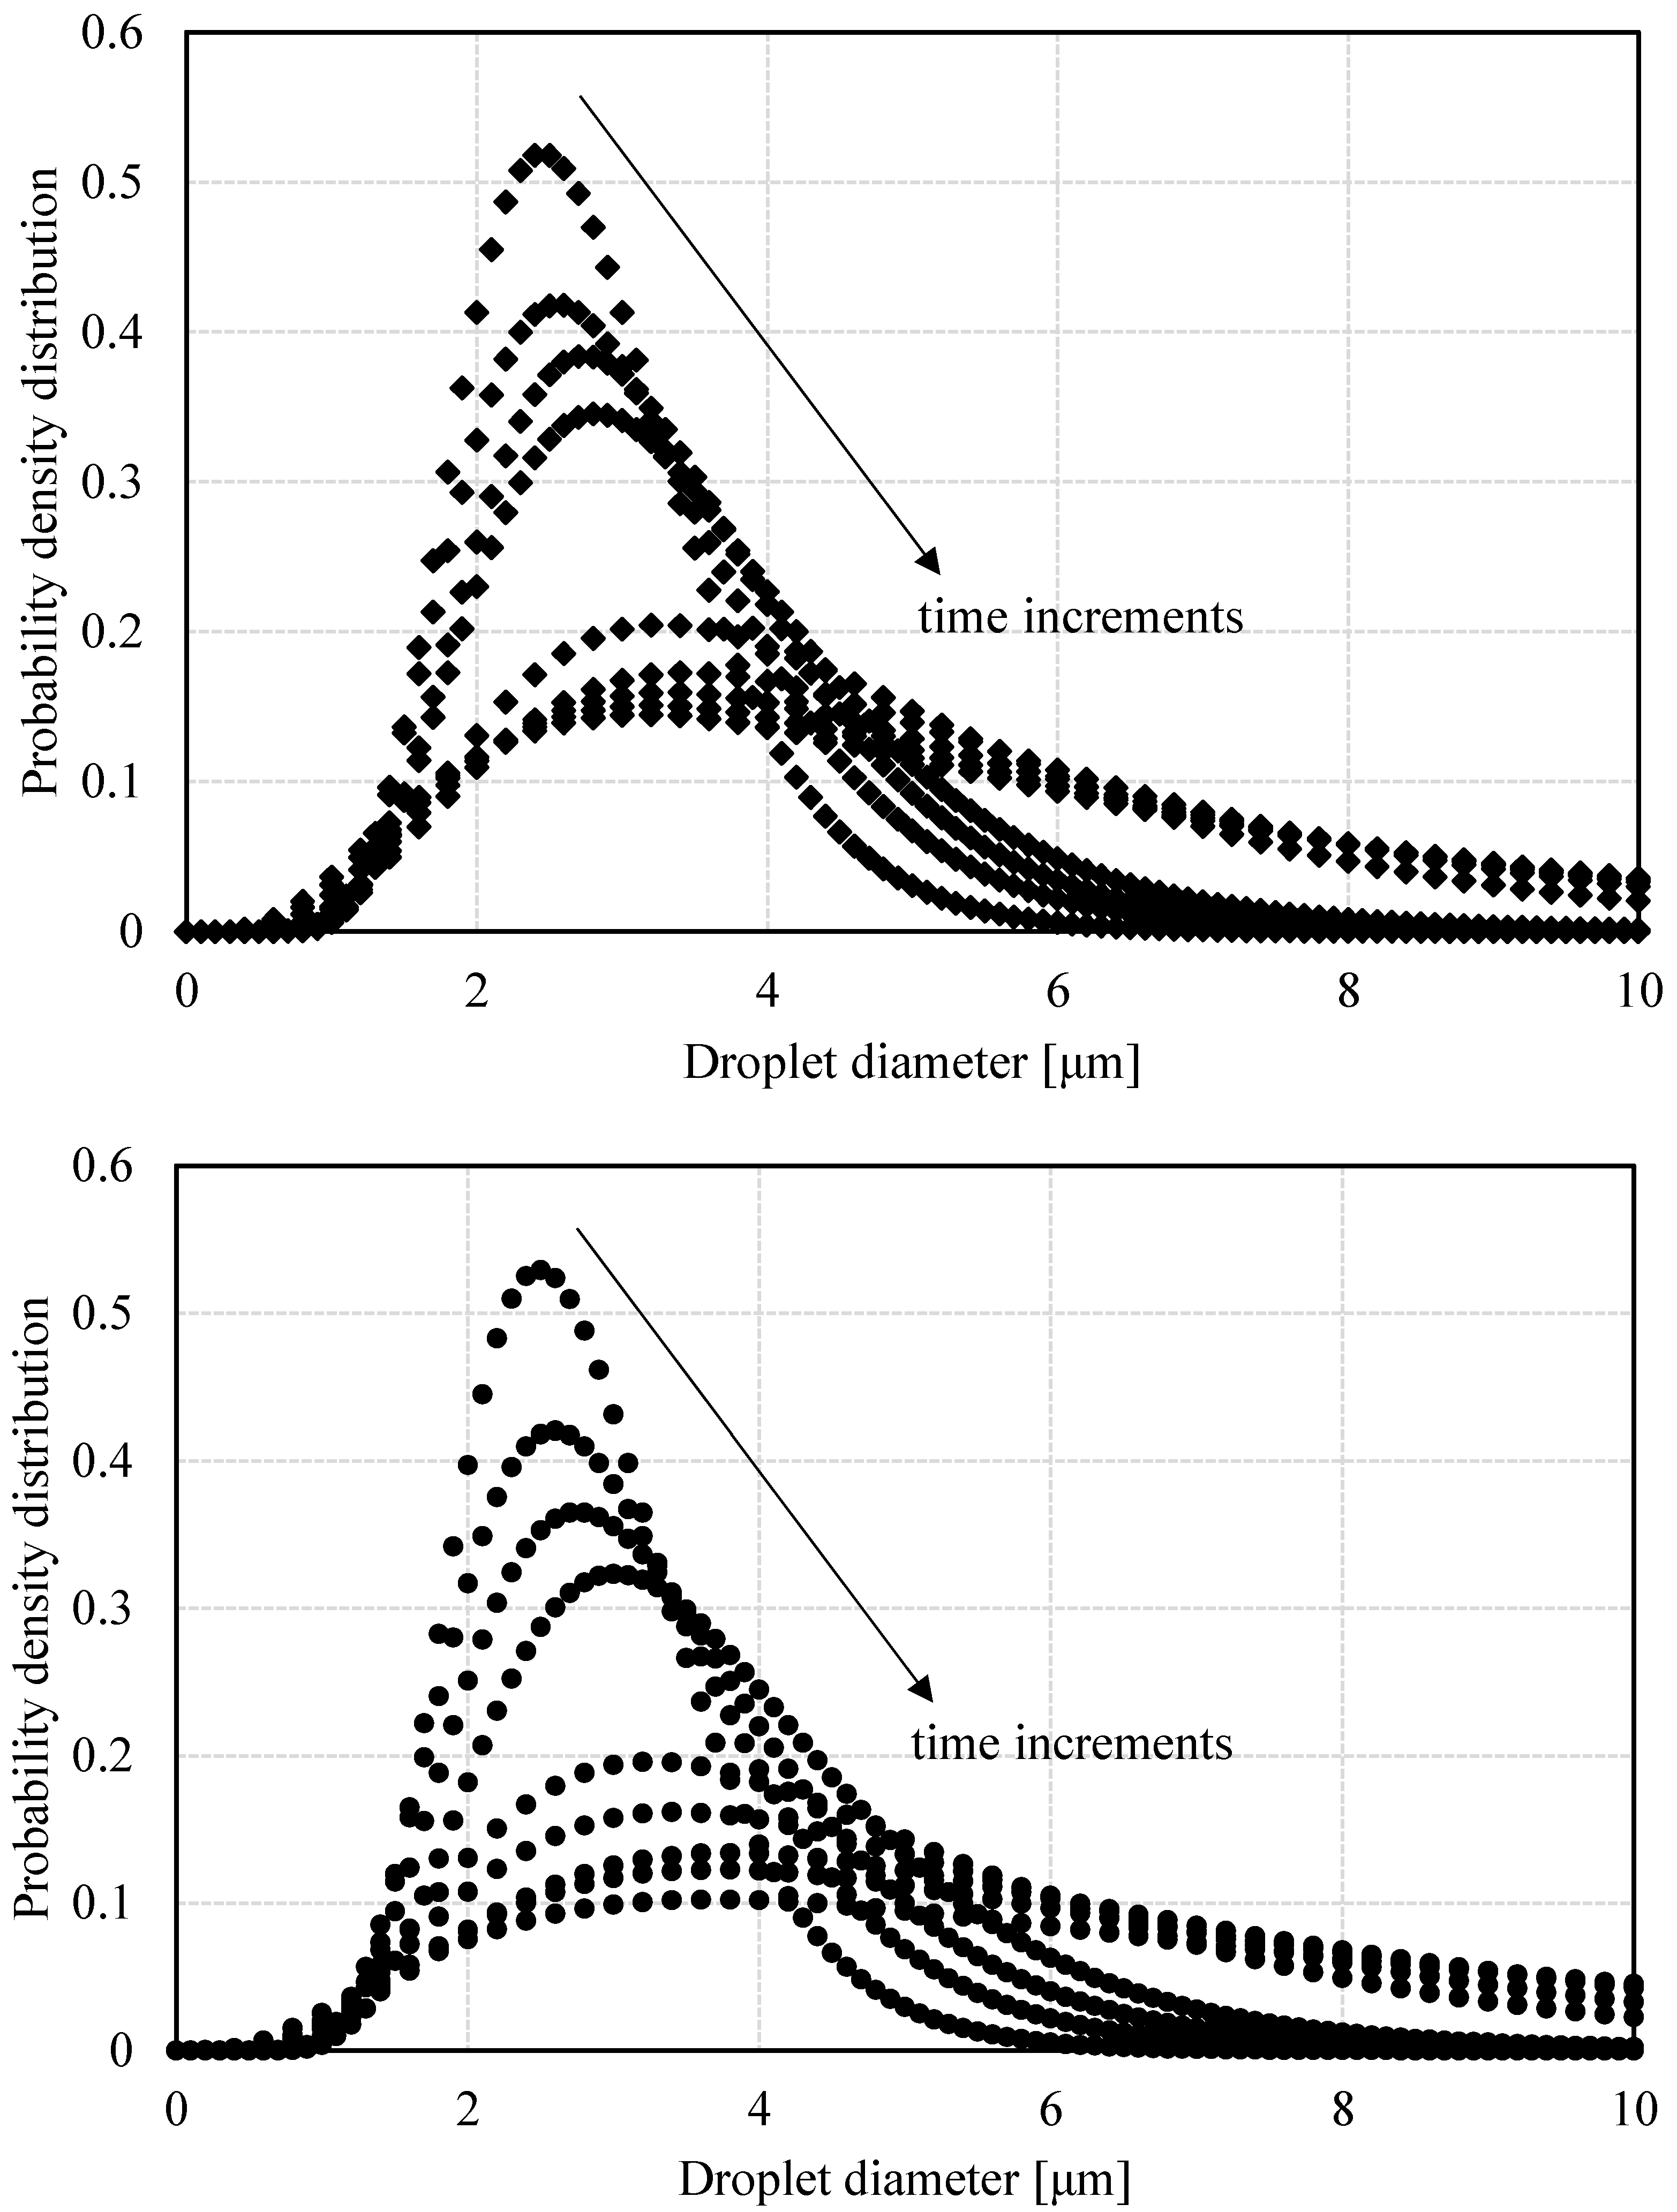
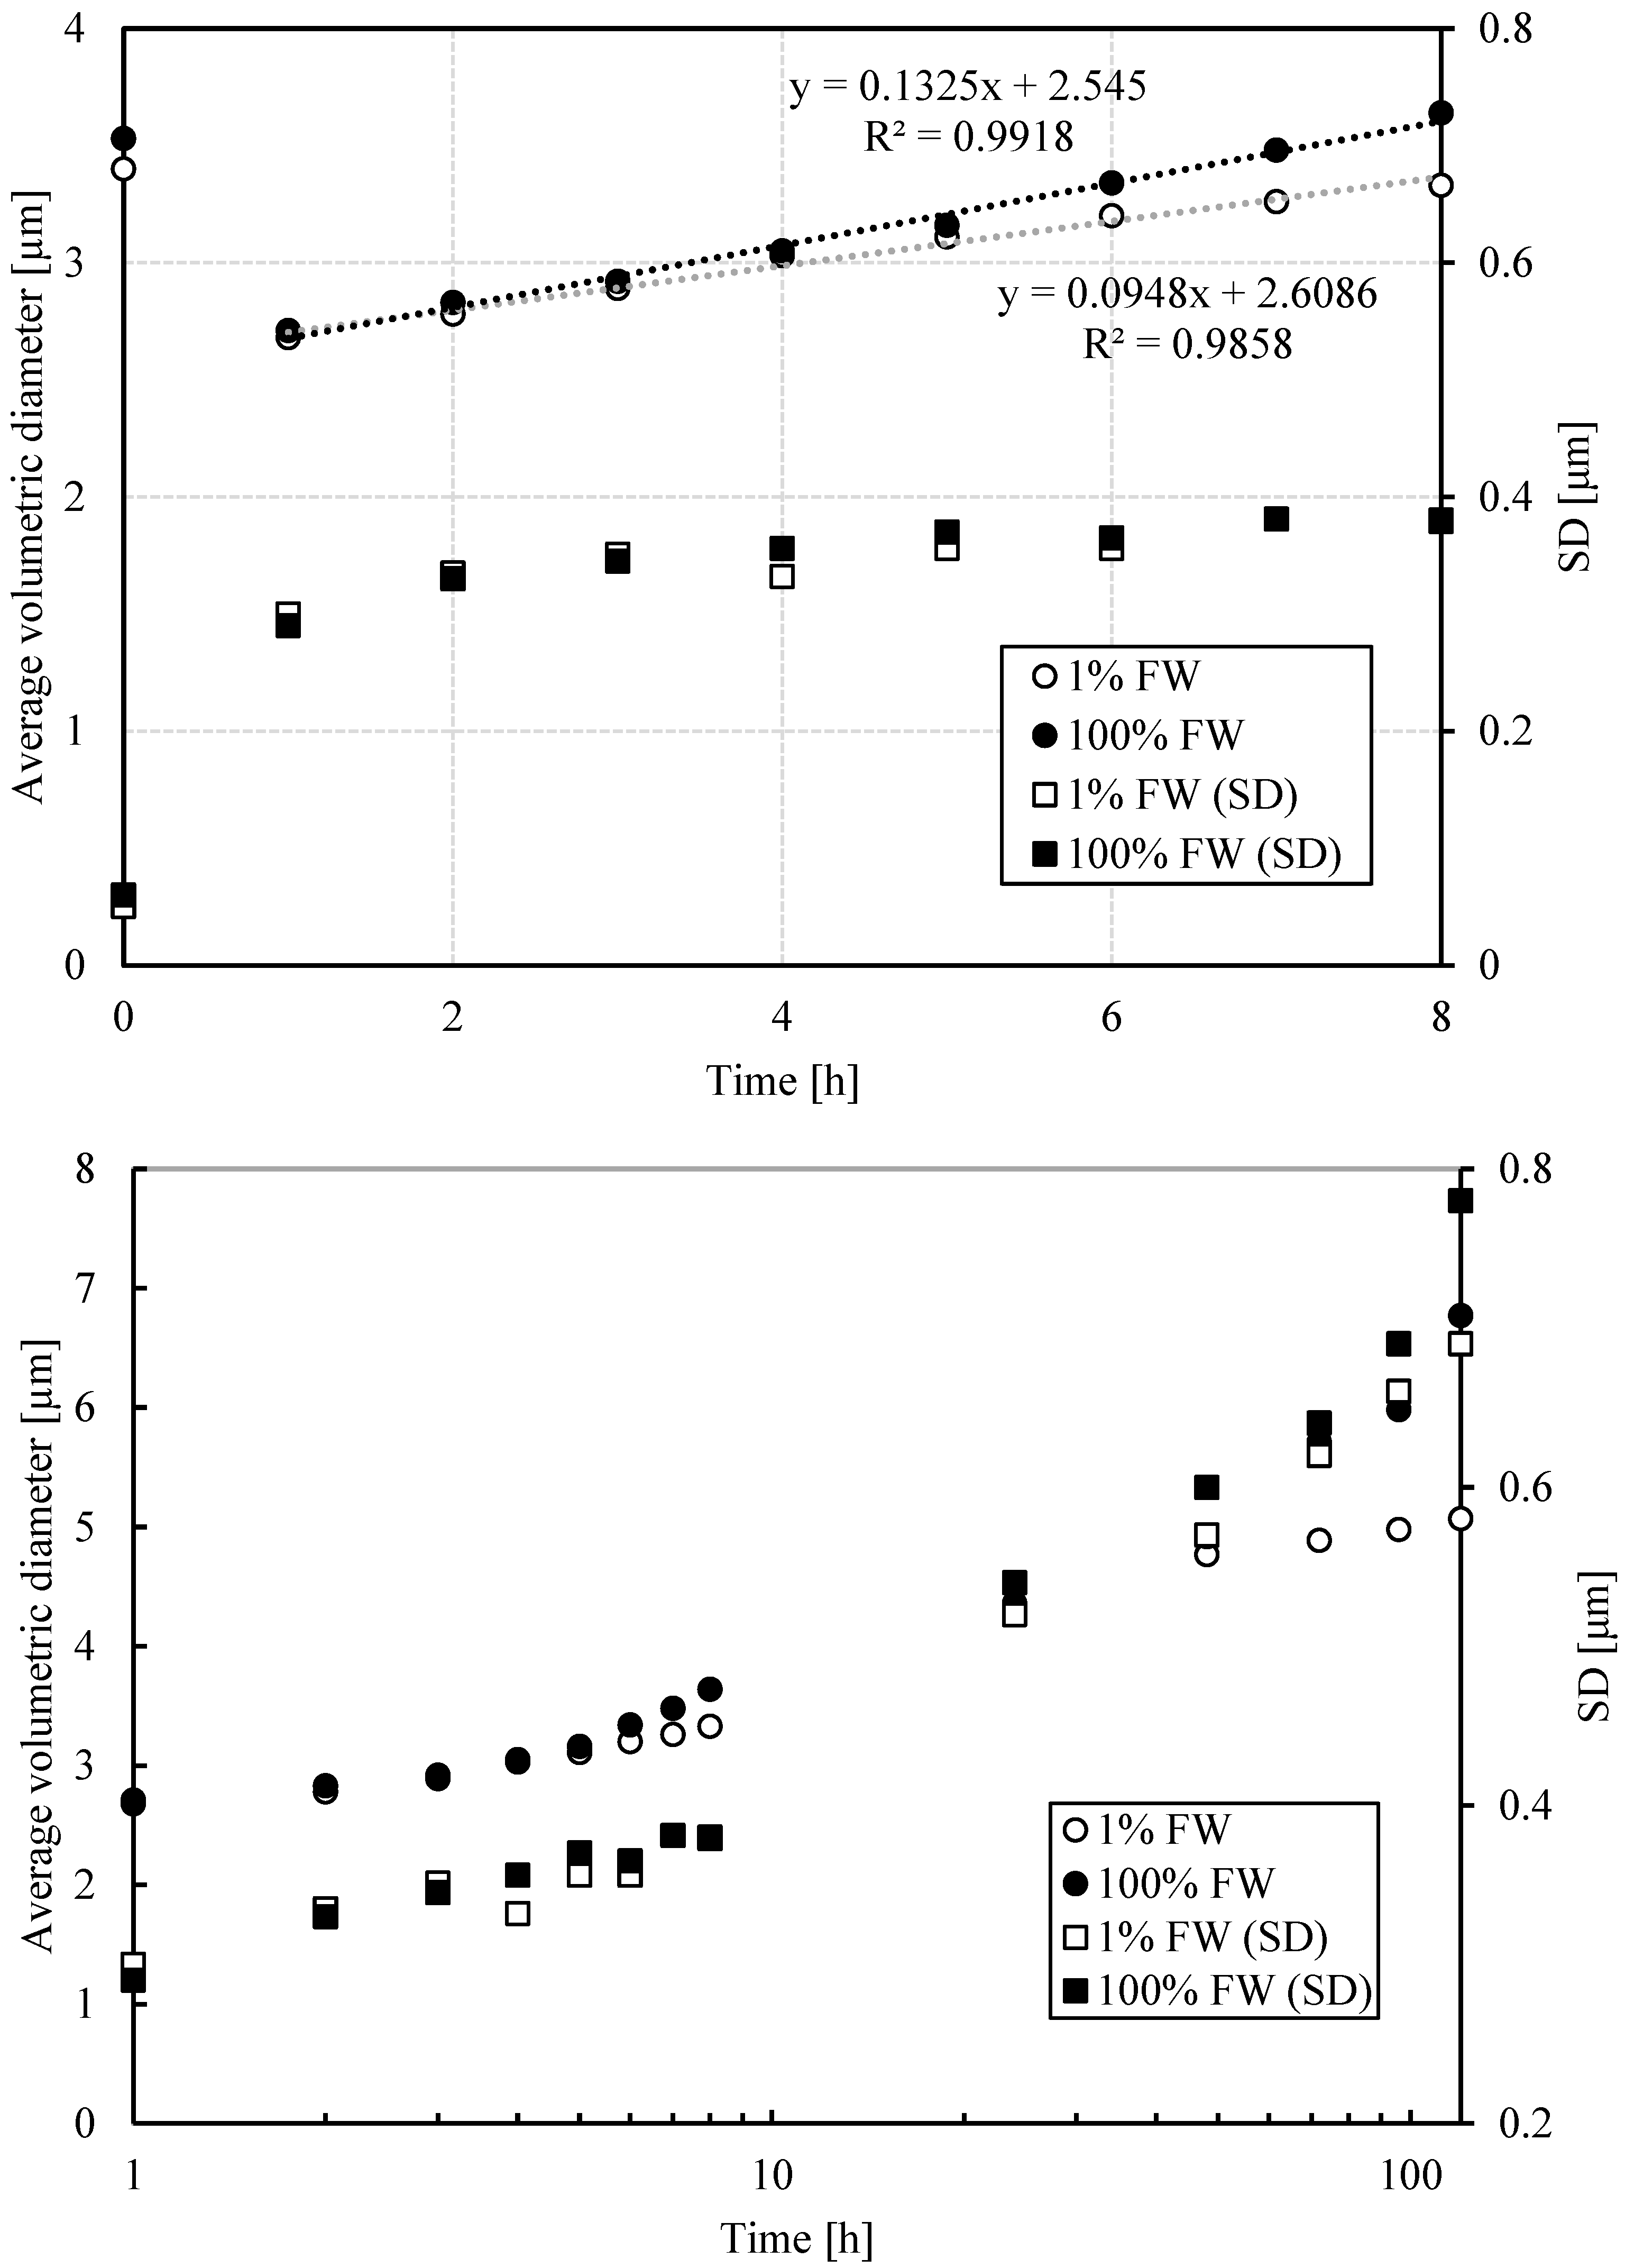
3.1.3. DSD by PFG-NMR

When using PFG-NMR to estimate DSD through restricted diffusion, the analysis software assumes that the distribution is Gaussian, which has been reported to be an ideal model for describing experimental observations [22]. For the respective analysis, the volumetric average radius and its respective standard deviation have been recorded as estimators of the size of the drops and their degree of size dispersion. At the time of emulsion formation, there is a narrow distribution of water droplets whose average radius is roughly 3 µm. During the first hour, there is a decrease in the average droplet radius, possibly due to the rapid initial settling of large droplets, which contribute considerably to the average radius. After this initial sedimentation, a tendency towards an increase in droplet size takes place (Figure 3), which could be attributed to the simultaneous occurrence of flocculation and coalescence. Regardless of salinity, both the average droplet radius and the width of the distribution grow continuously. However, it can be observed that these growth rates are not constant because their values are higher in the first hours of demulsification. Additionally, the drops are slightly smaller when the emulsions are formed with low-salinity brine, which is associated with greater emulsion stability.

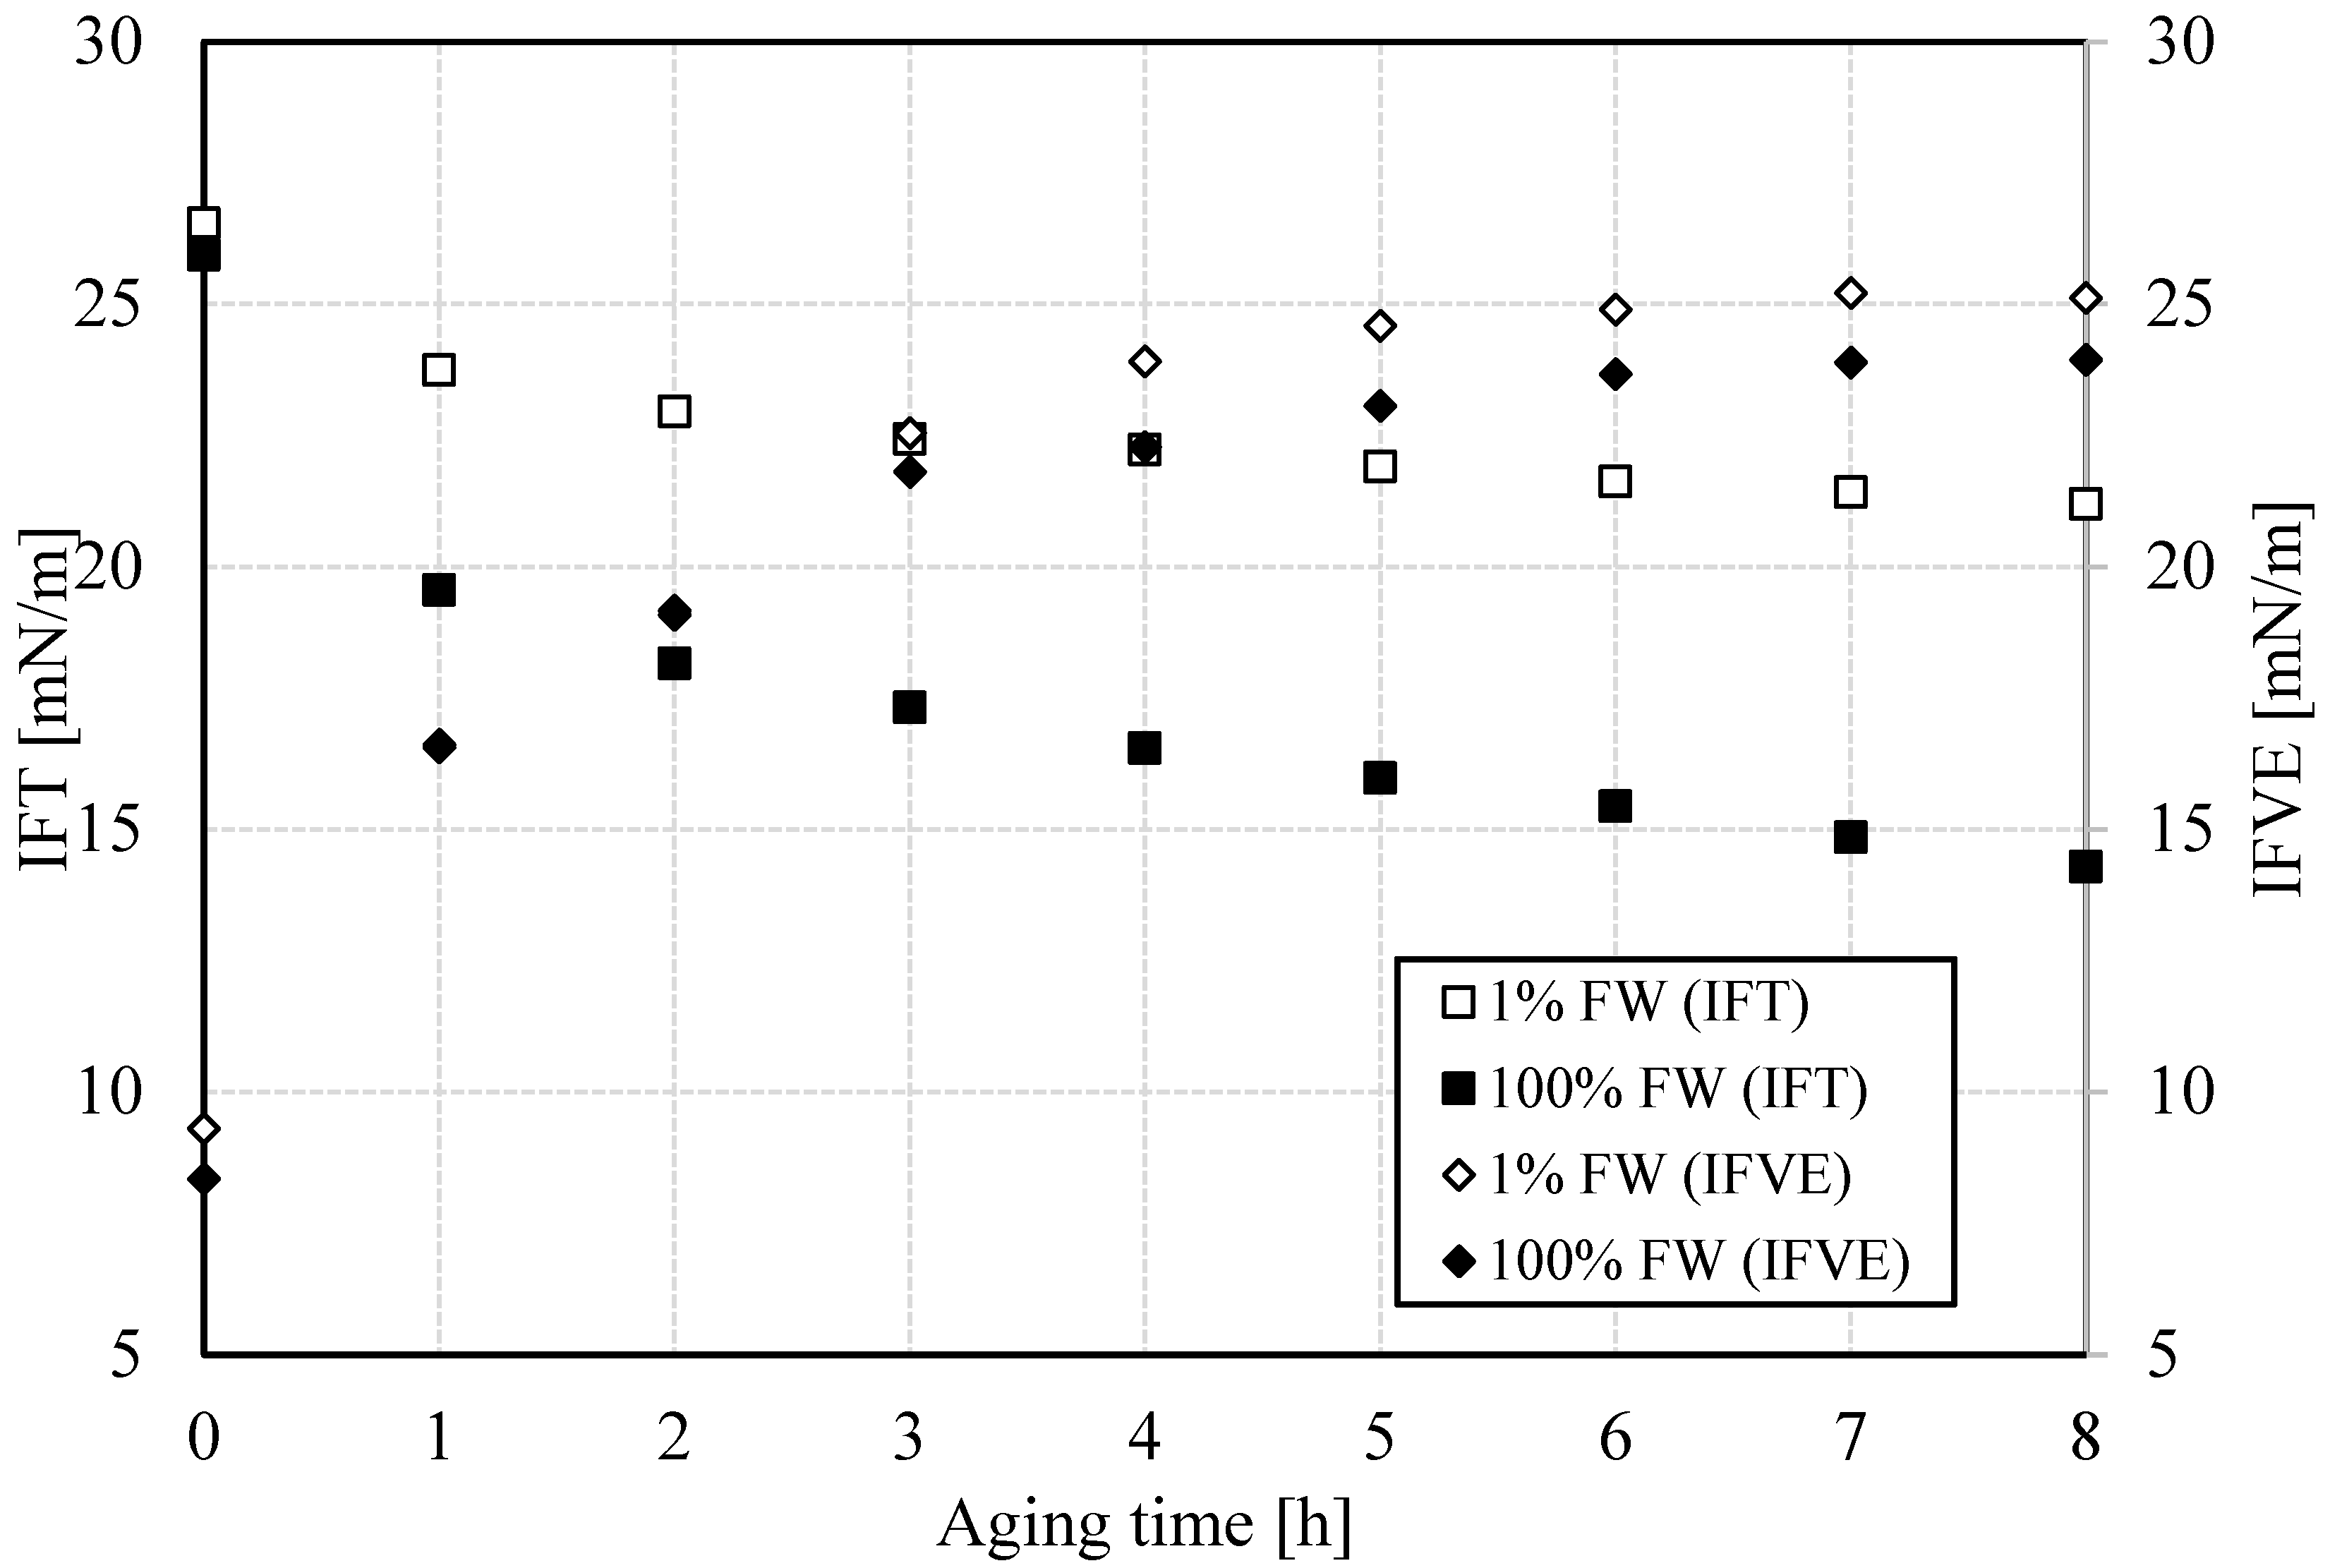
3.1.4. Interfacial Properties: Salinity Dependence

The coalescence of two drops involves the rupture of the water–oil interfacial film that mediates between them, and therefore, the study of the interfacial properties of the film is important to explain what happens in this stage of emulsion destabilization. The IFT exhibits an exponential decay regardless of the brine used (Figure 4). In the system containing formation water, there is a more pronounced decrease in IFT that led to a considerably lower IFT. This difference is due to the more notable migration of natural surfactants towards the interface. As proposed previously, a higher ionic strength in the brine could imply a shorter Debye length and a higher electrostatic gradient and, consequently, a greater capacity to prompt the migration of the polar components of crude oil [23]. However, in the same research, it was implied that compression of the double layer at higher salinity can diminish the attraction of polar molecules to the interface. As some surface-active substances drift from the bulk to the interface, a decrease in interfacial tensions is seen. Additionally, an increase in interfacial viscoelasticity also occurs. A reorganization and cross-linking stage take place at the interface after the initial diffusion of the surfactants. This generates an interfacial film with a rigidity that increases over time [24]. Its configuration is subject to salinity as well. Specifically, at low salinity, the interfacial film becomes slightly stiffer.

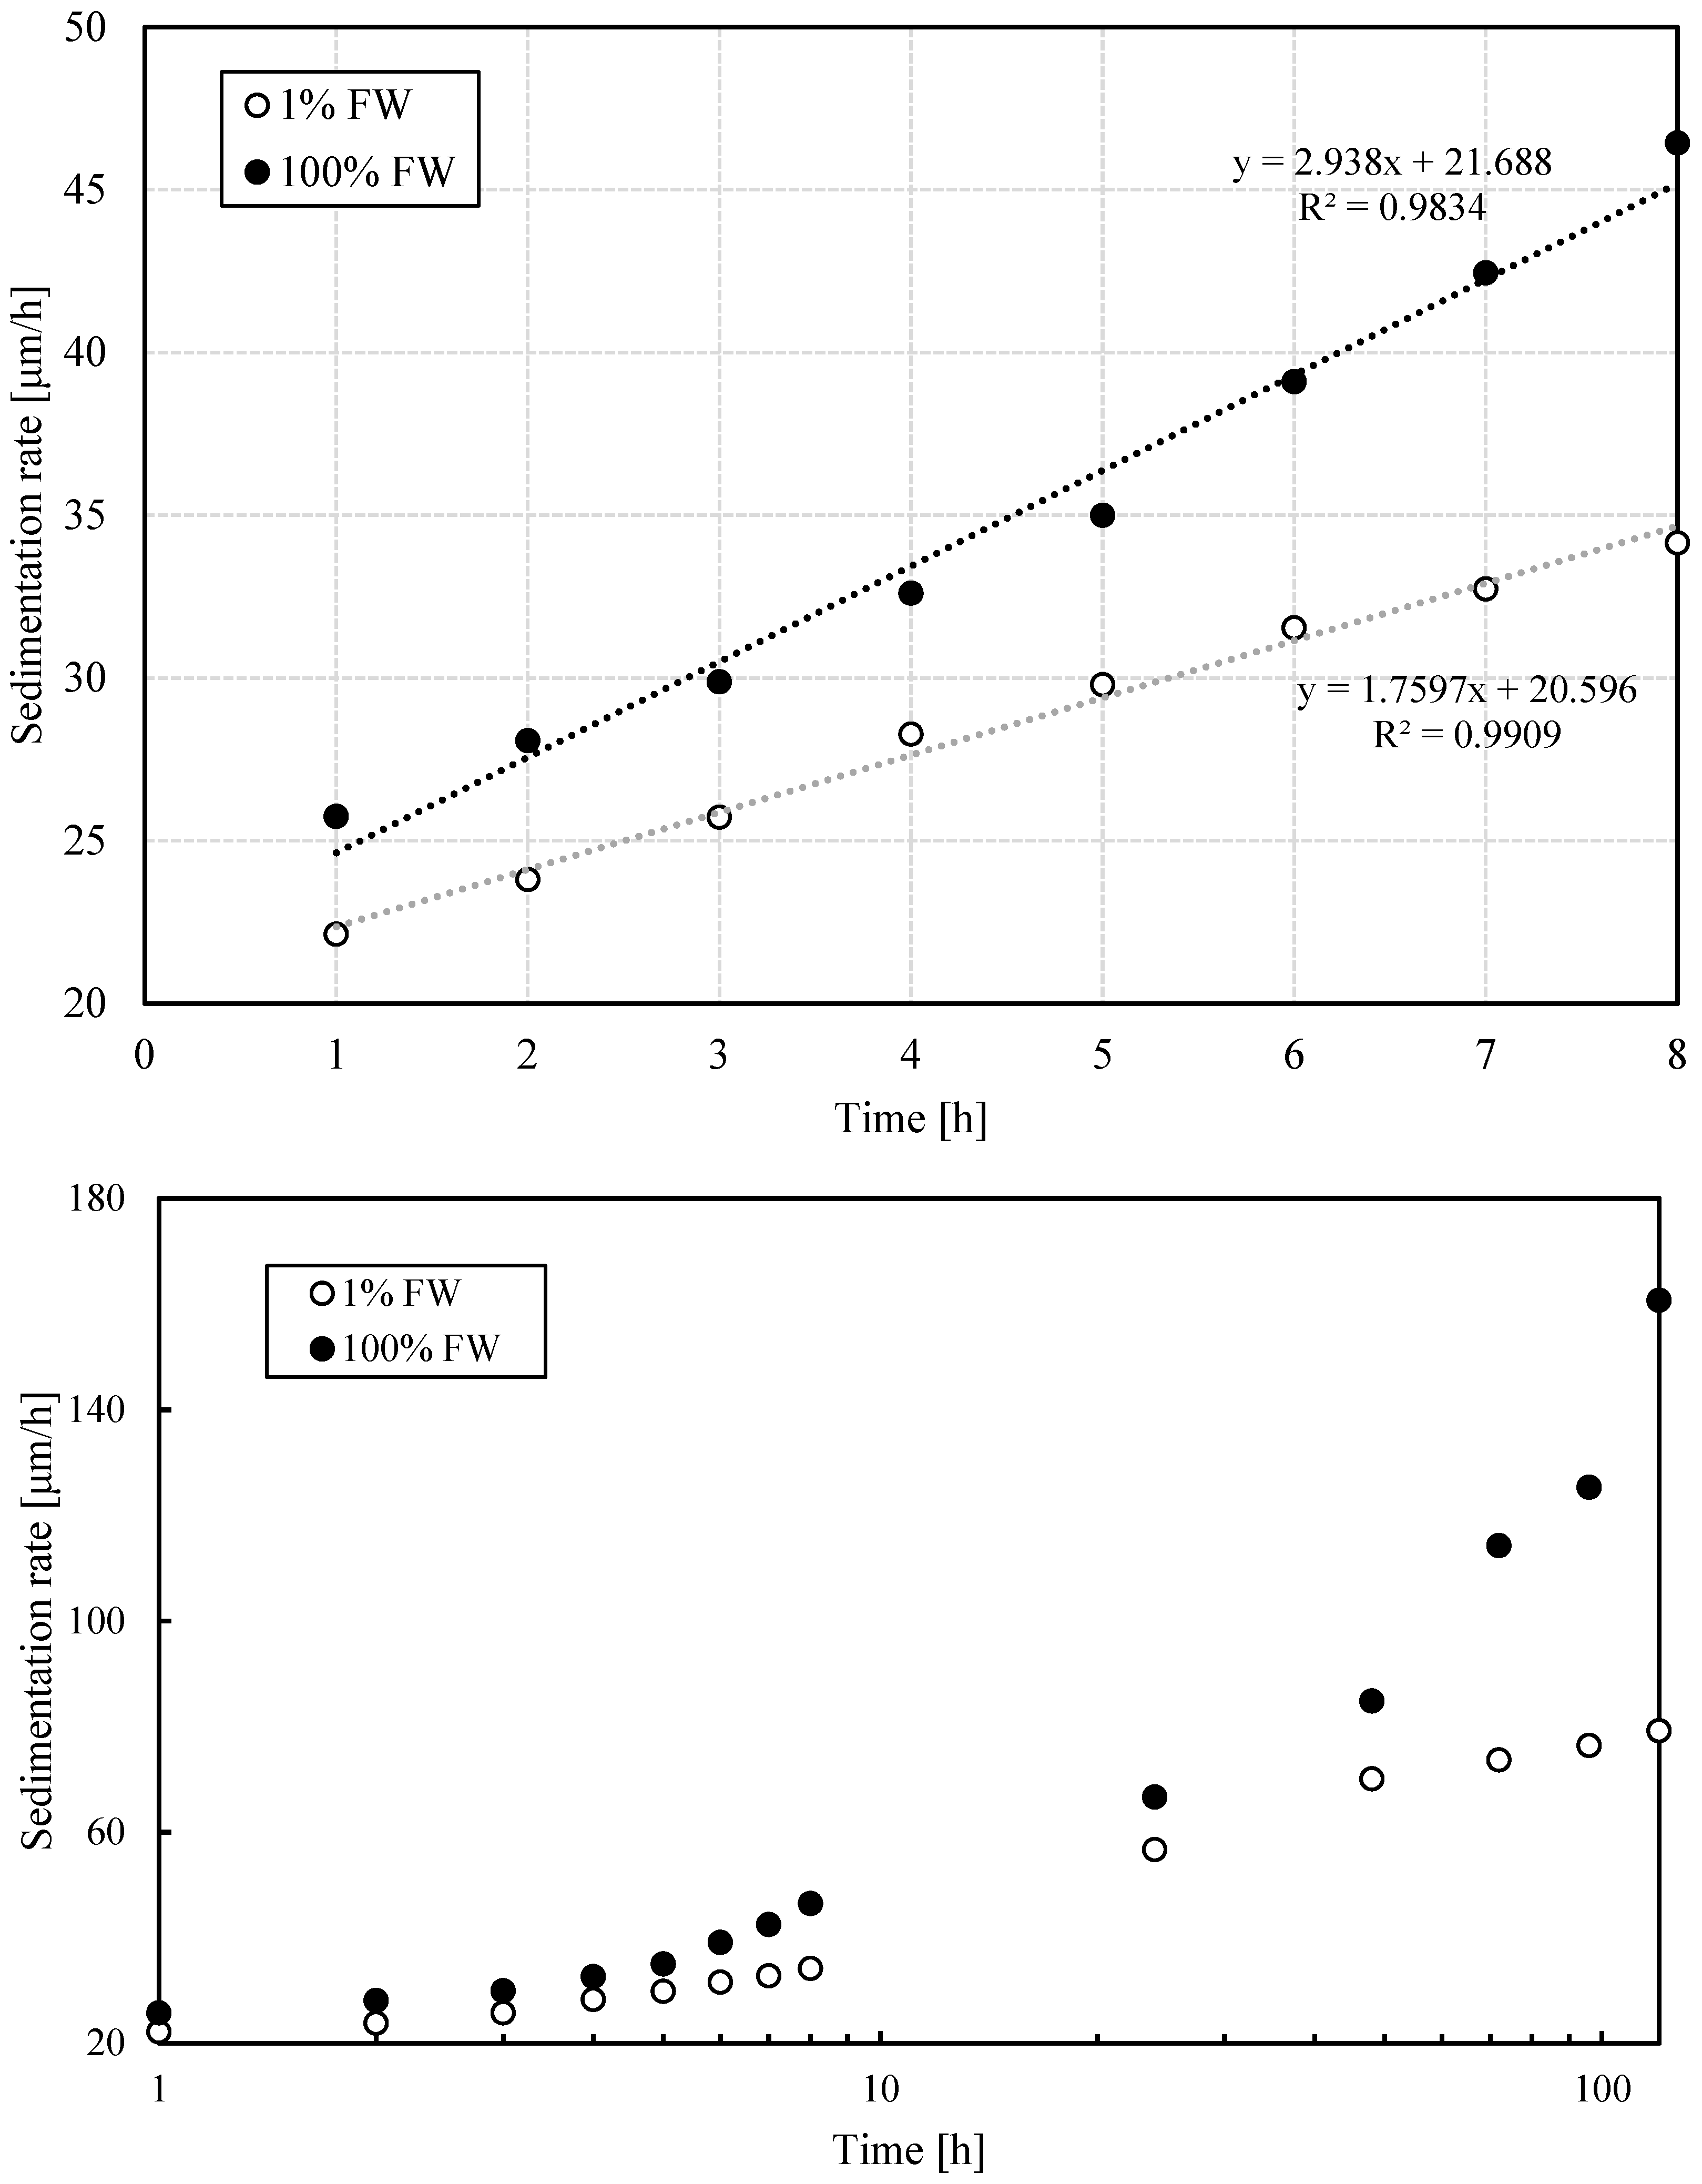
3.1.5. Estimation of Sedimentation, Flocculation and Coalescence Rates

To quantify the rate of coalescence and flocculation, the growth rate of drop size and dispersion were analyzed. As shown in Figure 5, aggregation is delayed in emulsions containing a low-salinity brine relative to their high-salinity counterparts. While the differences for both—the average (volumetric) and the standard deviation of the drop size—are not as noticeable during the first 10 h (top portion of Figure 5), they are quite significant after 100 h (bottom plot in Figure 5). This observation provides strong evidence for differences in relative stability between emulsions formulated at the two different salinities in this work. This becomes clearer when the bottle test results are examined considering the DSD results.
The rate of dispersed phase sedimentation was estimated by means of Stokes’ law. Sacha is a medium crude oil, so the water droplets were denser and consequently moved down to the bottom of the bottle. The initial size of the drops depends on, among other parameters, the agitation intensity. At 6500 rpm, the initial average diameter of the drops was around 2.6 µm, which implied an initial sedimentation rate of 21 µm/h, independently of the salinity of the brine. As time progressed, the simultaneous occurrence of flocculation and coalescence impacted the DSD, which in turn resulted in a progressive increase in sedimentation rates that exhibited salinity dependency. Specifically, emulsions prepared with diluted formation water exhibited considerably lower sedimentation rate changes, 1.8 µm/h2, than emulsions prepared with formation water, 2.9 µm/h2. Figure 6 summarizes the calculation of sedimentation rates at the two aqueous phase salinity values. Notice the acceleration of the sedimentation rate as the emulsions’ estimated drop size increases. These results connect water resolution at both salinities with the inferred coalescence process derived from droplet size distribution measurements. The larger-sized droplets will more rapidly descend to the bottom of the bottles, where the pool of water will favor phase separation, given the more expedited coalescence between pooled water and droplets at the bottom of the bottles. One aspect of these processes that requires additional data is whether interfacial film strengthening continues to increase over time. Given that, after an extended period, phase separation seems to slow down for emulsions prepared with lower-salinity aqueous phase, this seems to be the case.
Regarding the repulsion forces between dispersed phase droplets, which contribute to the stability of the emulsions, the electrostatic and steric forces are remarkable. When crude oil and brine come into contact, ions from the brine migrate to the interface and contribute to the formation of an electrical double layer (EDL). The thickness of this layer depends on the ionic strength and the characteristics of the ions. In a low-salinity regime, a thick EDL, with a weaker electrostatic gradient, is expected. This would lead to lower repulsions, and therefore lower stability in this type of emulsion. The experimental results show the opposite, which could reflect a greater relevance of the steric forces in this phenomenon, at least during the time scales investigated. On the other hand, significant compression of the EDL at high salinity likely weakens the net electric potential more significantly than low-salinity conditions, leading to a weaker attraction of polar molecules, such as asphaltenes, towards the interfaces. These arguments can, in a speculative fashion, indicate that interfacial buildup might be favored under conditions leading to dielectrophoretic attraction of polar molecules such as asphaltenes and resins. In practice, more than one mechanism acting on the interface might explain the observations in this research. The following section will analyze the effect of temperature on the steric component of emulsion stabilization addressed by the study of the interfacial film formed between crude oil and brine.

3.2. Temperature Effect

Some authors have stated that the rate-limiting steps of demulsification kinetics are flocculation and coalescence, and the consequent drainage of the droplets [25]. For this reason, the analysis in this section mainly focuses on the interfacial film that hinders phase separation. It is important to keep in mind that all the mechanisms leading to an emulsion breakdown act on different time scales, which are influenced by temperature in different ways.

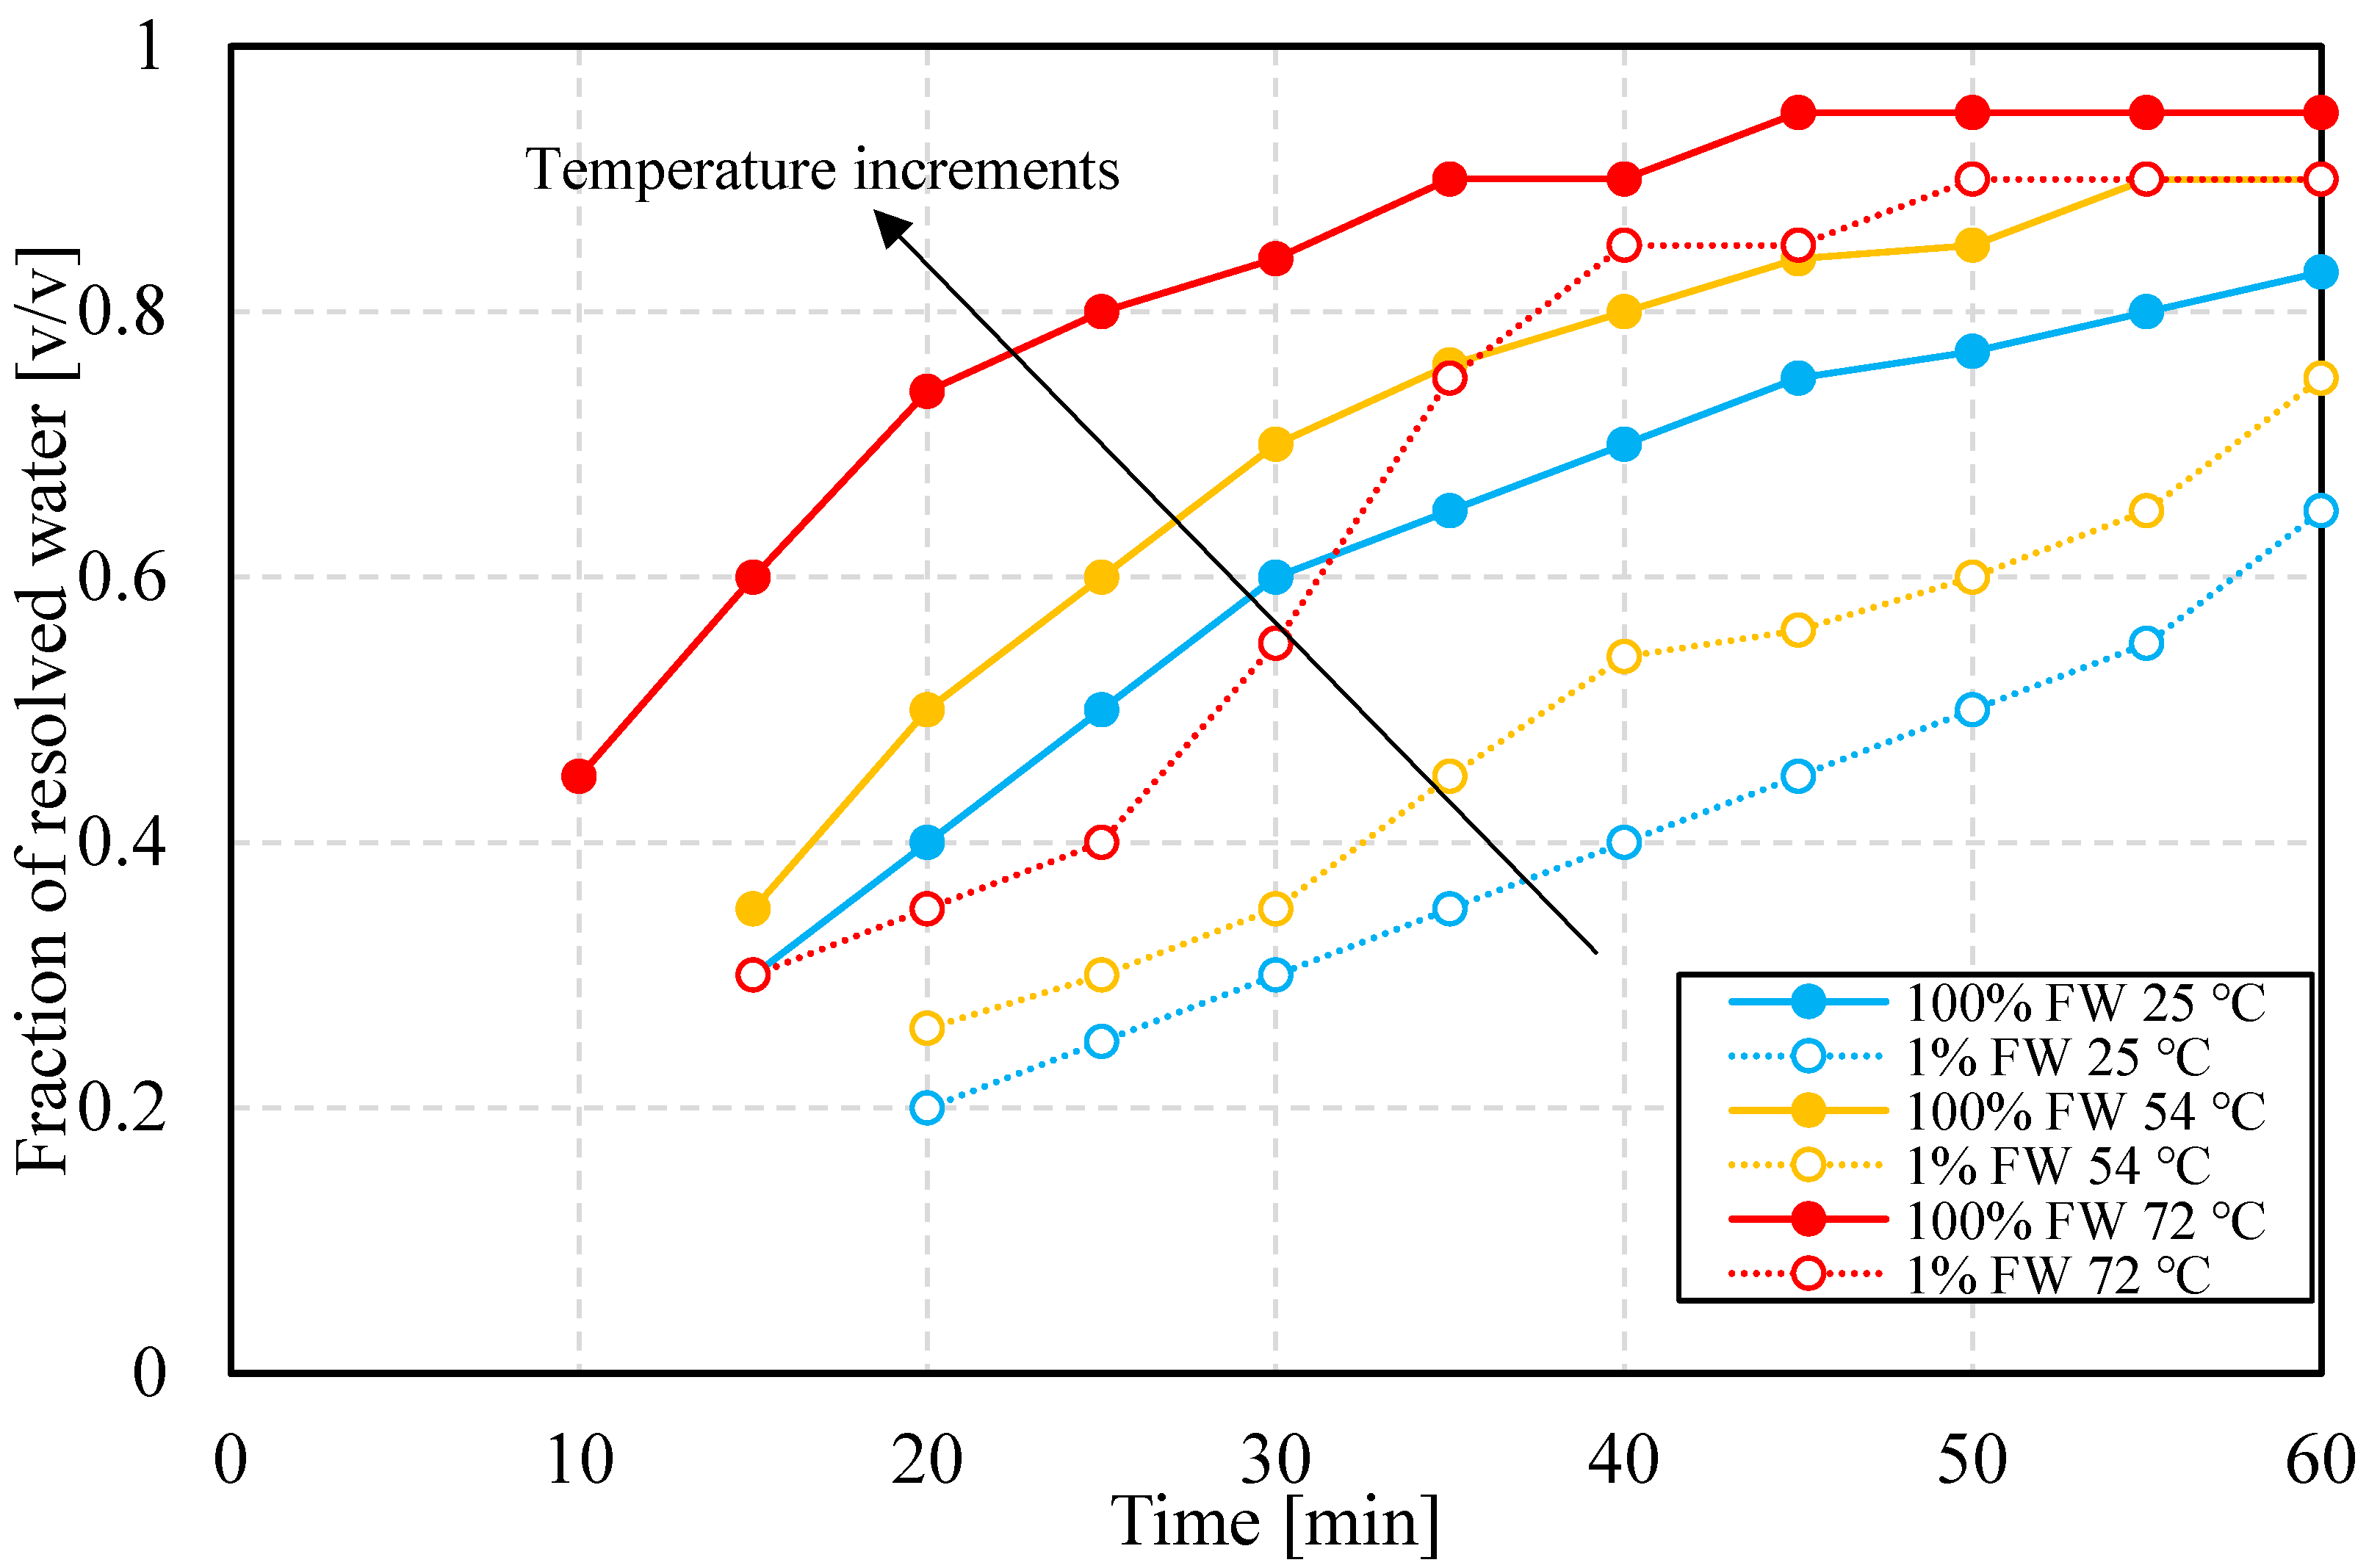
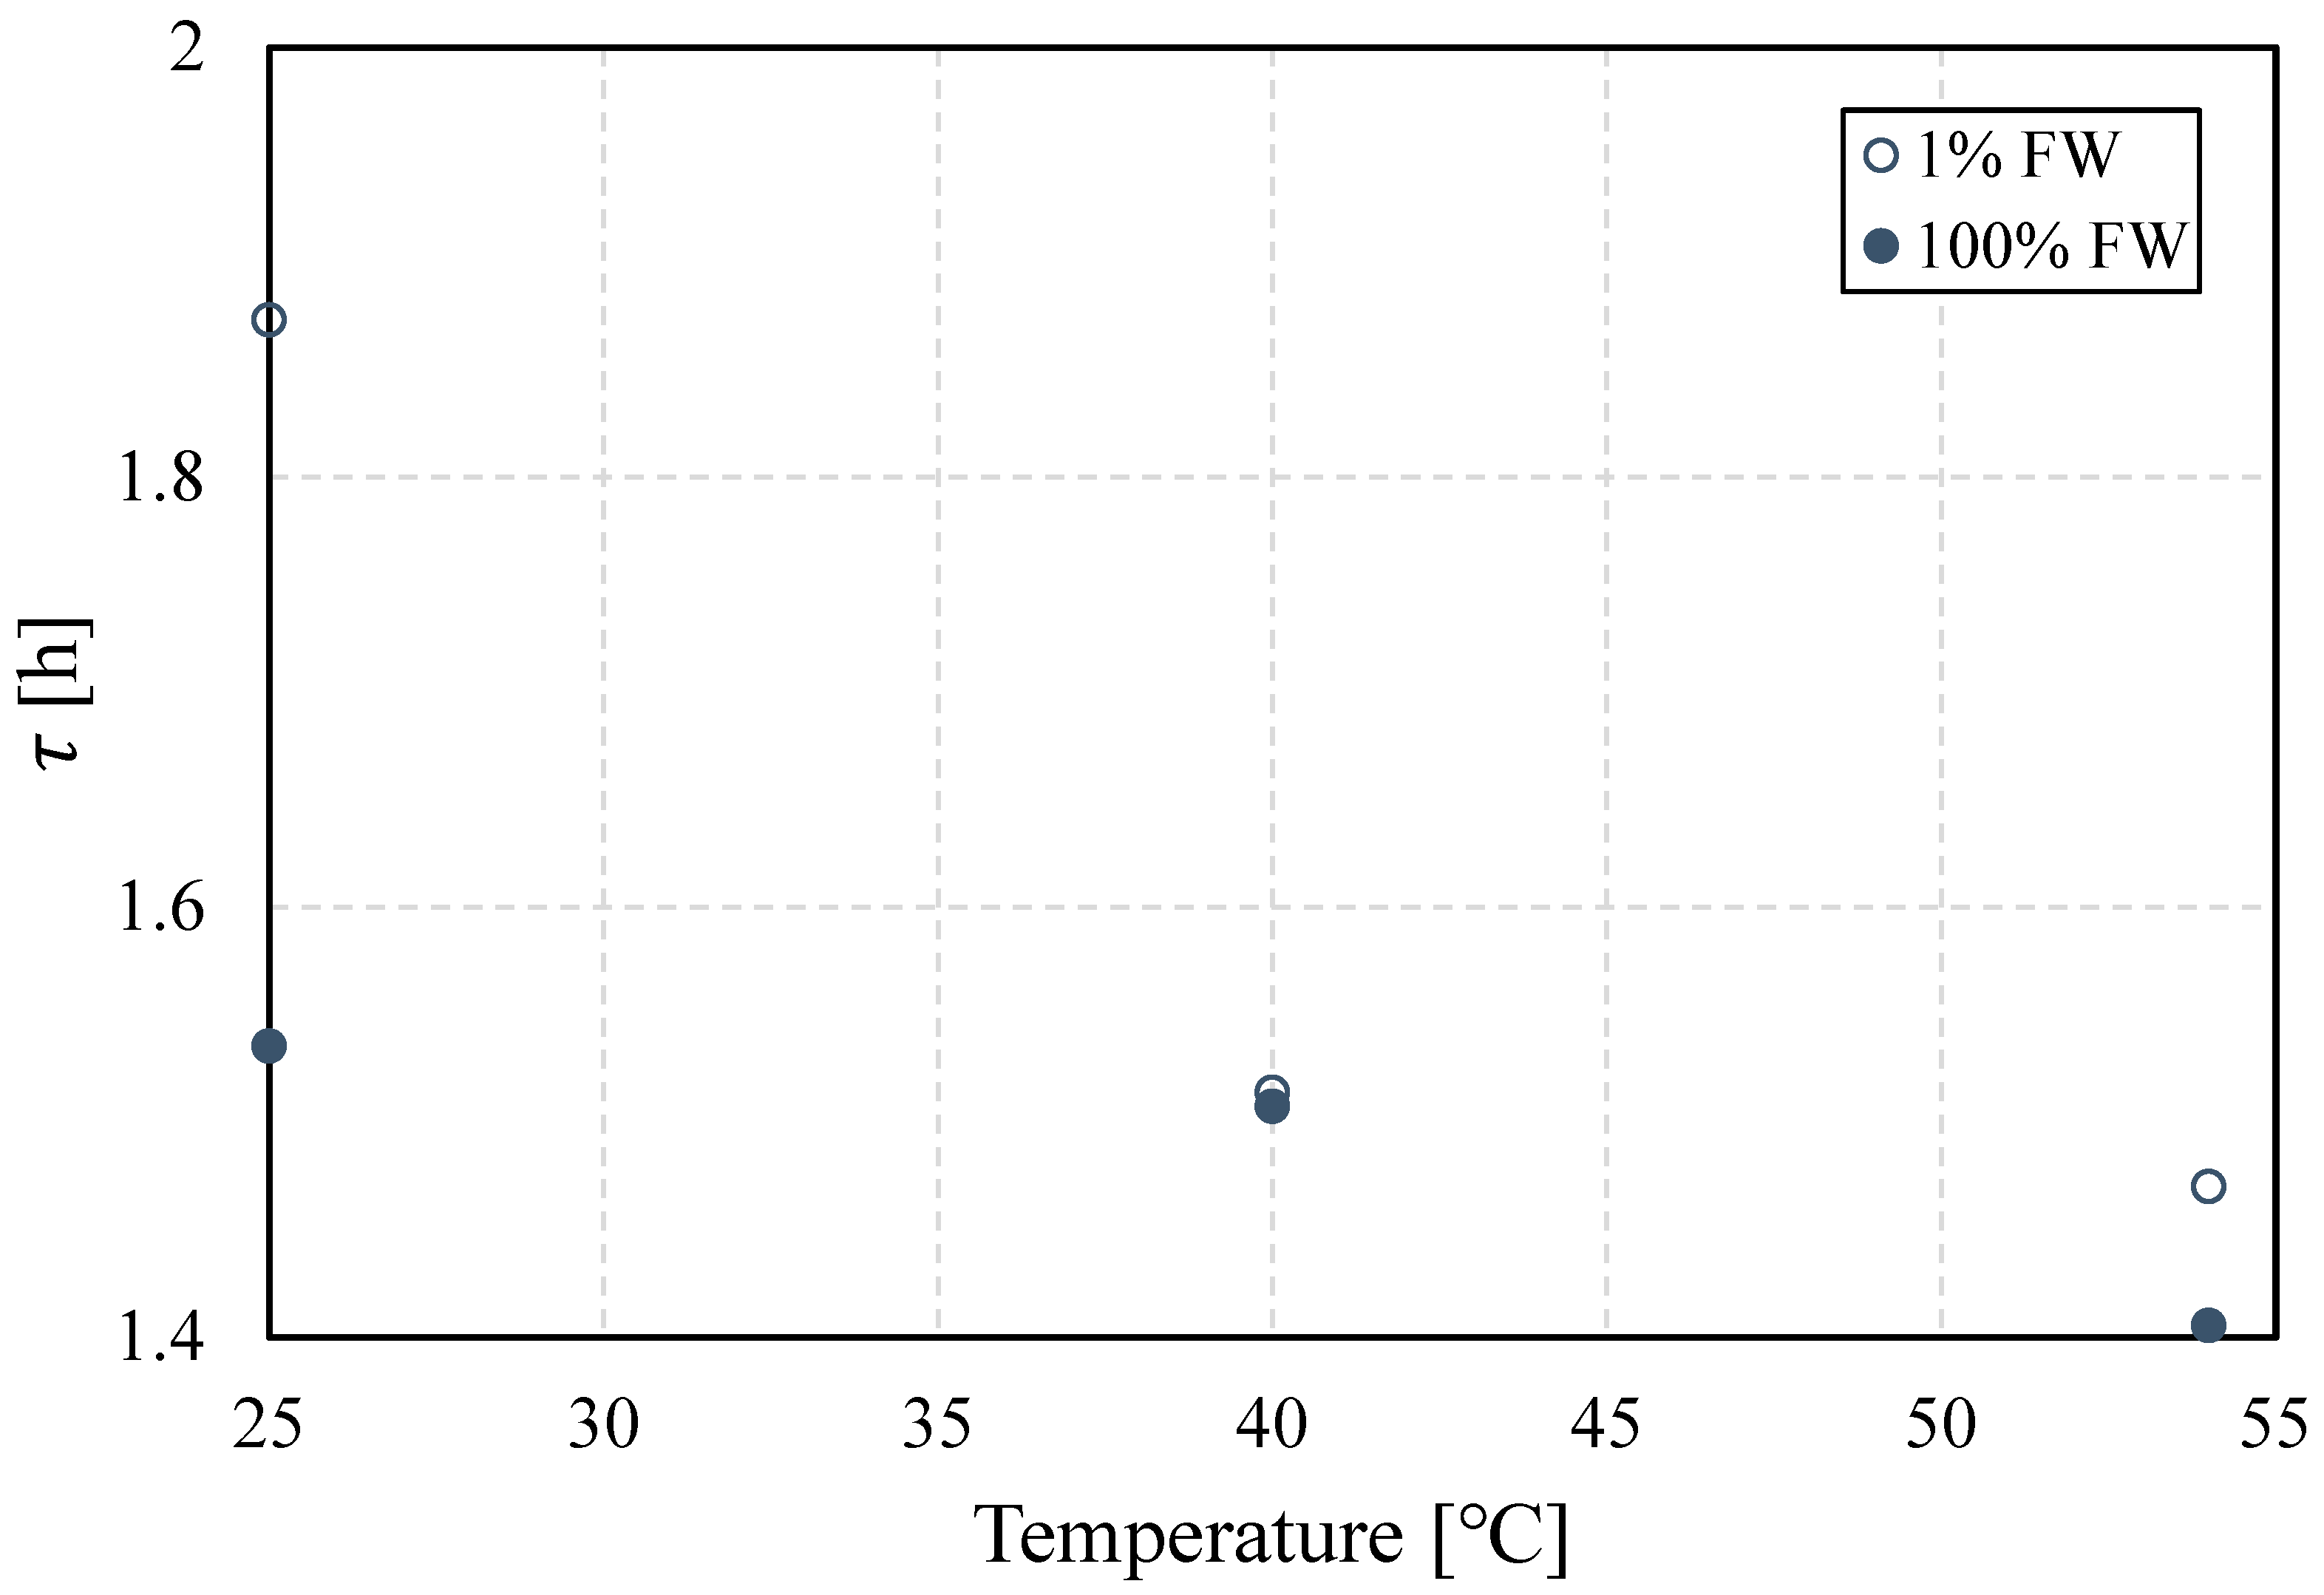
3.2.1. Bottle Tests: Temperature Dependence

Figure 7 shows the fraction of resolved water as a function of time throughout the first 60 min. The first self-evident observation is that, for both values of salinity, the resolved water fraction is higher, the higher the temperature. This trend could be related to sedimentation rates, which are favored by the dependence of oil viscosity on temperature, i.e., viscosity decreases as temperature increases. Moreover, a faster sedimentation rate can trigger accelerated water resolution before the interface stiffens, which hinders coalescence. Secondly, the final water volume fraction resolved appeared to depend on temperature rather than converging to the same value at the end of the observation time. This might have occurred because of the limited observation time. However, the volumetric fraction of resolved water was always lower at lower temperatures. The third observation is that emulsions prepared at the lower aqueous phase salinity were always more stable, in relative terms, than their counterparts at high salinity. This indicates that regardless of what the stabilization mechanism is, it seems that lower-salinity conditions are always favored, regardless of temperature. It goes without saying that the differences between lower and higher salinity cases are smaller at higher temperatures. The last observation points to mechanisms beyond viscosity reduction as a function of increasing temperature. This hints that temperature-dependent interfacial mechanisms are at play. The rates of buildup might be discerned from trends of properties as functions of time.

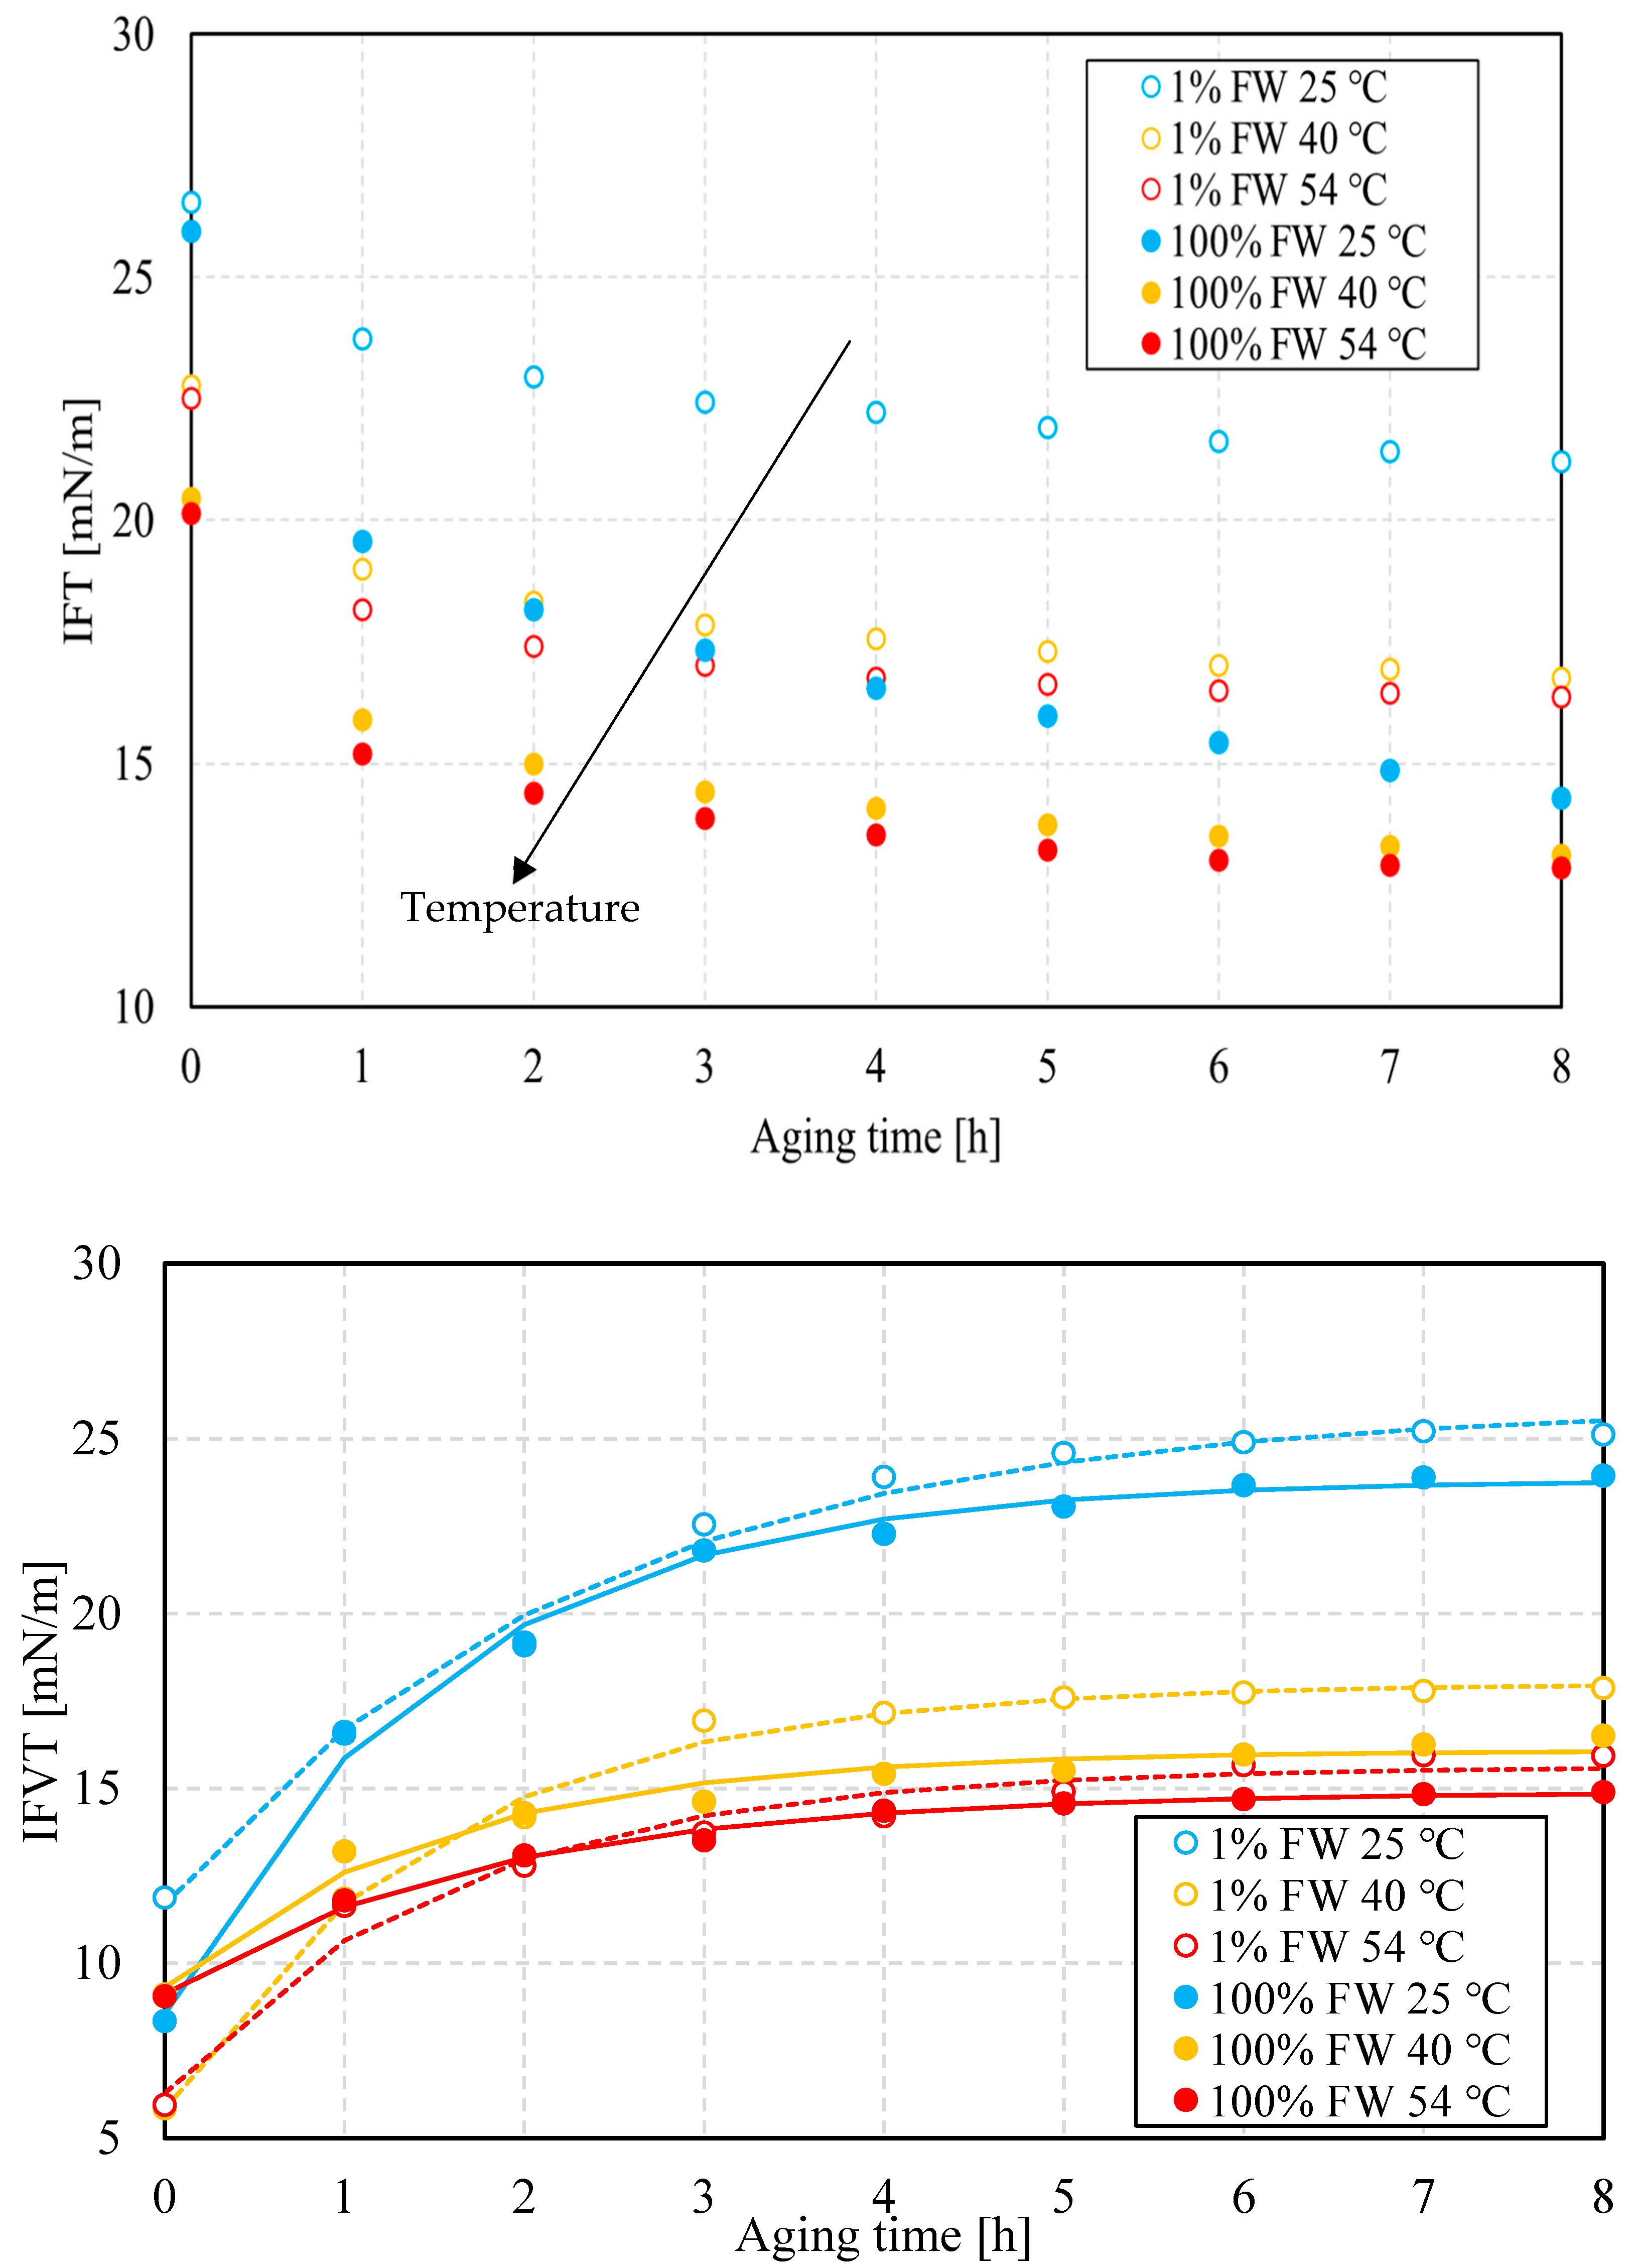
3.2.2. Interfacial Properties: Temperature Effect

The bottle test results herein indicate that temperature-dependent interfacial properties are likely to have a role in the relative stability of the specific macroemulsions in this work. The two main properties studied here are the IFT and the IFVE modulus. The former, measured via the pendant-drop technique, impacts chemical potential gradient, a measure of the driving force for coalescence, between drops or a drop in contact with the bottom water reservoir in the bottle tests. In isolation, the higher the chemical potential gradient, the easier it is for coalescence to occur. For two drops of different radii, in the absence of kinetic barriers, the smaller drop releases excess pressure (associated with the excess interfacial energy) to reach equilibrium with the larger drop, i.e., until the interfacial arrives at a new equilibrium situation. Figure 8 (top) shows the results of the IFT at three temperature values for both aqueous-phase salinities. The first observation is that the IFT, regardless of temperature and salinity, decreases and approaches a plateau value that depends on the specific conditions of the experiments. This is a well-known trend that reflects interfacial buildup and conformation [26]. This implies the kinetic process leading to interface formation, which likely includes multicomponent molecular moieties.
The bottom portion of Figure 8 shows the IFVE modulus, measured at 0.1 Hz using dilatational rheology on the same pendant-drop system used for the IFT measurements, as a function of time. As the figure shows, the IFVE modulus decreases with increasing temperature. Its value is slightly greater at low salinity compared to its high-salinity counterpart. This contrast could contribute to differences in relative stability at the same temperature, but the value of IFT must also be considered. Previous work on interfacial failure in the presence of an elastic interface shows that the ratio of elastic modulus to IFT serves as a kinetic barrier to snap-off [27,28]. A similar mechanism might act during the coalescence process, although the failure mechanism likely occurs through interfacial dimples, rather than through snap-off or pinch-off.
An exponential saturation fitting procedure was followed to estimate the rate or kinetics of interfacial film formation, essentially assuming a first-order kinetic process overall:
E * = E 0 * + E p * ( 1 e t τ )
where E * is the viscoelastic modulus, E 0 * is the initial viscoelastic modulus, E p * is the incremental value, τ is the buildup time, and t is the aging time. Moradi and Alvarado [26] followed a similar approach to estimate the kinetics of interfacial buildup but wrote the equation somewhat differently.
Figure 9 depicts the buildup or relaxation rate time as a function of temperature for both values of salinity. At the three temperatures set for these measurements, the value of this time scale is higher at low salinity, except at 40 °C, which indicates a greater buildup rate. It is important to highlight that as described in previous work (and references therein) [26], the buildup of the interface likely follows an initial step dominated by molecular diffusion towards the interface, along with electrokinetic drive from the polarized interface, and then a second step controlled by local structuring or organization of the interface, e.g., stacking or linkage. Relaxation time lumps both mechanisms’ time scales, regardless of which one dominates. The driving force that attracts polar material towards the water–oil interface might control the thickening of the interface, but structuring might be in part responsible for its stiffening.
In general, the low-salinity aqueous phase likely contributes to a higher electric field at the oil–water interface, but then interfacial reorganization is necessary to create a more viscoelastic interface. At lower temperatures, the viscous environment at the interface likely makes the time scale associated with the thicker interface (at low salinity) more dominant. However, as temperature increases, there is a likely decrease in the viscous contribution at the interface that is probably stiffer for the case of the thicker interface (low salinity). This could explain the decrease in relaxation time ( τ ) for the low-salinity case, which appears to result in a crossover at 40 °C. While both situations exhibit a decrease in τ with respect to temperature, that of the low-salinity case is steeper.
As time elapses, flocculation, coalescence and sedimentation act simultaneously, but these mechanisms act on different time scales. High salinity implies a higher density contrast between the oil and water phases, which benefits sedimentation. This, in turn, favors phase separation through water resolution at the bottom of the bottle. This effect is favored at higher temperatures, due to a combination of changes in oil properties and perhaps more importantly due to oil–viscosity reduction. On the other hand, the rates of coalescence are higher at higher salinity, which indicates that lower salinity contributes to a more resilient interface. While IFT is higher at lower salinity, the dilatational interfacial modulus has a higher value. This is an indicator of a stiffer interface that will suppress coalescence.

4. Conclusions

The water-in-oil emulsion stability analysis and interfacial measurements in this work have led to the following conclusions:
  • A comprehensive stability analysis of W/O emulsions prepared with Sacha crude oil was conducted to elucidate emulsion breakdown controls under conditions established in this research. The resulting emulsions were more resilient at lower salinity. This is the first time that emulsions with oil originated from this basin have been analyzed in this context in the literature, to the best of our knowledge.
  • Emulsions, regardless of aqueous-phase salinity, are more stable at lower temperatures. This is explained by the formation of less viscoelastic water–oil interfaces, as the viscoelastic modulus results show. This in turn indicates that lower salinity favors interfacial viscoelasticity.
  • The interfacial response rate is clearly a function of temperature and salinity. This can be associated with temperature-dependent processes, including the interfacial viscous environment that is temperature-dependent as well as the structure rate of the interface, as shown in the time-course analysis of the interfacial viscoelasticity and interfacial tension.
  • The effectiveness of the phase-separation process at higher salinity in the aqueous phase can be explained by the increased density contrast between water and oil, which favors the sedimentation rate, accompanied by a relative increase in the coalescence rate, as the results here show.

Author Contributions

J.S.-F.: Methodology, formal analysis, investigation, data curation, writing—original draft preparation, visualization. A.D.-B.: Methodology, validation, investigation, writing—original draft preparation. T.E.L.: resources, writing—review and editing, supervision, funding acquisition. V.A.: Conceptualization, Methodology, validation, resources, data curation, writing—review and editing, supervision, project administration, funding acquisition. All authors have read and agreed to the published version of the manuscript.

Funding

This work was supported as part of the Center for Mechanistic Control of Unconventional Formations (CMC-UF), an Energy Frontier Research Center funded by the U.S. Department of Energy, Office of Science under DOE(BES) Award DESC0019165.

Data Availability Statement

The original contributions presented in the study are included in the article, further inquiries can be directed to the corresponding authors.

Acknowledgments

To PETROAMAZONAS EP in the persons of Rommel Castillo (Sacha Oilfield), Dixon Taboada and Rodrigo Loyola (Sacha Oilfield), for allowing the collection of crude oil samples in the facilities of Sacha Oilfield. To Patricio Llerena (Overtech) and Bryan Bravo (Overtech), for sample preservation and transportation. To Luis Calle and José Condor (Universidad Central Ecuador), Francisco Quiroz and José Ivan Chango (CIAP at Escuela Politécnica Nacional, Ecuador) and Yachay Tech University, Ecuador for allowing the access and providing assistance in the laboratories.

Conflicts of Interest

The authors declare no conflicts of interest.

Abbreviations

The following abbreviations are used in this manuscript:
W/Owater-in-oil (W/O)
O/WOil-in-Water
DSDdroplet-size distribution
TD-NMRTime-Domain Nuclear Magnetic Resonance
ODGOscillating drop generator
FWFormation water
TDSTotal Dissolved Solids
IFTInterfacial tension
IFVEinterfacial viscoelasticity
PFG-NMRPulsed Field Gradient Nuclear Magnetic Resonance
SDStandard deviation
EDLElectrical double layer

References

  1. Kim, Y.H.; Wasan, D.T.; Breen, P.J. A study of dynamic interfacial mechanisms for demulsification of water-in-oil emulsions. Colloids Surf. A 1995, 95, 235–247. [Google Scholar] [CrossRef]
  2. Liu, J.; Liu, S.; He, Y.; Zhong, L.; Hao, T.; Liu, Y.; Wang, P.; Gao, P.; Guo, Q. Experimental study of produced fluid emulsification during water/steam flooding for heavy oil recovery. Energy Fuel 2022, 36, 14838–14851. [Google Scholar] [CrossRef]
  3. Maaref, S.; Ayatollahi, S. The effect of brine salinity on water-in-oil emulsion stability through droplet size distribution analysis: A case study. J. Disper. Sci. Technol. 2018, 39, 721–733. [Google Scholar] [CrossRef]
  4. Liu, J.; Zhong, L.; Lyu, C.; Liu, Y.; Zhang, S. W/O emulsions generated by heavy oil in porous medium and its effects in reemulsification. Fuel 2022, 310, 12344. [Google Scholar] [CrossRef]
  5. Alvarado, V.; Wang, X.; Moradi, M. Stability Proxies for water in oil emulsions.and implications in aqueous-based enhanced oil recovery. Energies 2011, 4, 1058–1086. [Google Scholar] [CrossRef]
  6. Pal, N.; Alzahid, Y.; AlSofi, A.; Ali, M.; Hoteit, H. Review on microemulsions for conformance improvement technology: Fundamentals, design considerations and perspectives. Energy Fuel 2023, 37, 858–875. [Google Scholar] [CrossRef]
  7. Rocha, J.; Baydak, E.; Yarranton, H.; Sztukowski, D.; Ali-Marcano, V.; Gong, L.; Shi, C.; Zeng, H. Role of aqueous phase chemistry, interfacial film properties, and surface coverage in stabilizing water-in-bitumen emulsions. Energy Fuel 2016, 30, 5240–5252. [Google Scholar] [CrossRef]
  8. Dimitrova, T.D.; Leal-Calderon, F.J. Forces between emulsion droplets stabilized with Tween 20 and proteins. Langmuir 1999, 15, 8813–8821. [Google Scholar] [CrossRef]
  9. Tian, Y.; Zhou, J.; He, C.; He, L.; Li, X.; Sui, H. The formation, stabilization, and separation of oil-water emulsions: A review. Processes 2022, 10, 738. [Google Scholar] [CrossRef]
  10. Zhao, F.; Tian, Z.; Yu, Z.; Shang, H.; Wu, Y.; Zhang, Y. Research status and analysis of stabilization mechanisms and demulsification methods of heavy oil emulsions. Energy Sci. Eng. 2020, 8, 4158–4175. [Google Scholar]
  11. Hu, Y.; Ting, Y.; Hu, J.; Hsieh, S. Techniques and methods to study functional characteristics of emulsions systems. JFDA 2017, 25, 16–26. [Google Scholar] [CrossRef]
  12. Dickinson, E. Strategies to control and inhibit the flocculation of protein-stabilized oil-in-water emulsions. Food Hydrocoll. 2019, 96, 209–223. [Google Scholar] [CrossRef]
  13. Dinh, H.; Carreras, E.; Schmitt, V.; Lequeux, F. Coalescence in concentrated emulsions: Theoretical predictions and comparision with experimental bottle test behavior. Soft Matter 2020, 16, 10301–10309. [Google Scholar] [CrossRef]
  14. Abdulredha, M.; Hussain, S.; Abdullah, L. Overview on petroleum emulsions, formation, influence and demulsification treatment techniques. Arab. J. Chem. 2020, 13, 3403–3428. [Google Scholar] [CrossRef]
  15. Russ, J.C. Image Analysis of Food Microstructure; CRC Press: Boca Raton, FL, USA, 2004. [Google Scholar]
  16. Alade, O.; Mahmoud, M.; Al Shehri, D.; Sultan, A. Rapid determination of emulsion stability using turbidity measurement incorporating artificial neural network (ANN): Experimental validation using video/optical microscopy and kinetic modeling. ACS Omega 2021, 6, 5910–5920. [Google Scholar] [CrossRef]
  17. Manickam, S.; Sivakumar, K.; Pang, C. Investigations on the generation of oil-in-water (O/W) nanoemulsions trough the combination of ultrasound and microchannel. Ultrason. Sonochem. 2020, 69, 105258. [Google Scholar] [CrossRef]
  18. Marques, D.; White, R. The digitalization of bottle tests nuclear magnetic resonance evaluation of emulsion stability. J. Pet. Technol. 2020, 7, 40–42. [Google Scholar] [CrossRef]
  19. D6560; Standard Test Method for Determination of Asphaltenes (Heptane Insolubles) in Crude Petroleum and Petroleum Products. ASTM: Conshohocken, PA, USA, 2022.
  20. D14011-02; Standard Test Method for Water Separability of Petroleum Oils and Synthetic Fluids. ASTM: Conshohocken, PA, USA, 2002.
  21. Mansoori, G.; Vazquez, D.; Shariaty-Niassar, M. Polidispersity of heavy organics in crude oils and their role in oil well fouling. J. Pet. Sci. Eng. 2007, 58, 375–390. [Google Scholar] [CrossRef]
  22. Khadem, B.; Parrott, A.; Nordon, A.; Sheibat-Othman, N. Low field high resolution PFG-NMR to predict the size distribution of inner droplets in double emulsions. Eur. J. Lipid Sci. Technol. 2021, 123, 2000193. [Google Scholar] [CrossRef]
  23. Garcia, B.; Saraji, S. Transient interfacial rheology and polar component dynamics at oil-brine interfaces. Colloids Surf. A Physicochem. Eng. Asp. 2021, 624, 126773. [Google Scholar] [CrossRef]
  24. Sarmas-Farfan, J.; Medina-Rodriguez, B.; Alvarado, V. Dynamic stability of a crude oil/brine interface: Effect of anion type. Fuel 2023, 335, 127002. [Google Scholar] [CrossRef]
  25. Song, X.; Shi, P.; Duan, M.; Fang, S.; Ma, Y. Investigation of demulsification efficiency in water-in-crude oil emulsions using dissipative particle dynamics. RSC Adv. 2015, 5, 62971. [Google Scholar] [CrossRef]
  26. Moradi, M.; Alvarado, V. Influence of Aqueous-Phase Ionic Strength and Composition on the Dynamics of Water–Crude Oil Interfacial Film Formation. Energy Fuel 2016, 30, 9170–9180. [Google Scholar] [CrossRef]
  27. Hoyer, P.; Carvalho, M.S.; Alvarado, V. Snap-off in Constricted Capillary with Elastic Interface. Phys. Fluids 2016, 28, 012104. [Google Scholar] [CrossRef]
  28. Hoyer, P.; Alvarado, V. Stability of liquid bridge with elastic interface. RSC Adv. 2017, 7, 49344–49352. [Google Scholar] [CrossRef]
Figure 1. Micrograph of emulsions produced by mixing crude oil and formation water diluted one hundred times at 8000 rpm after 10 days.
Energies 18 03115 g001
Figure 2. Volumetric fraction of resolved brine as a function of time. The image corresponds to the emulsions prepared with 1% FW (left of the inset picture) and 100% FW (right of the inset picture) after 10 days.
Energies 18 03115 g002
Figure 3. Evolution of droplet size distribution of emulsions prepared with diluted formation water (diamonds) and formation water (circles), after 1, 3, 5, 7, 24, 48, 72, 96, and 120 h. The log normal density functions were obtained via PFG-NMR, i.e., restricted diffusion, which provides the estimated mean value and standard deviation of the droplet size distribution.
Energies 18 03115 g003
Figure 4. IFT and IFVE as a function of aging time at 25 °C.
Energies 18 03115 g004
Figure 5. Average volumetric diameter and its standard deviation (SD) as a function of time.
Energies 18 03115 g005
Figure 6. Estimation of sedimentation rate of water droplets in W/O emulsions. The first 10 h of the sedimentation rate are shown at the top, while the long-term behavior is shown at the bottom. Calculations are based on average drop size.
Energies 18 03115 g006
Figure 7. Fraction of resolved water vs. time for the emulsions generated at 1500 rpm. Lines are provided as visual guidance.
Energies 18 03115 g007
Figure 8. IFT and IFVE as functions of aging time at different temperatures for the crude oil/brine system at 100% formation water and 1% formation water. Lines correspond to numerical fitting by the equation E * = E 0 * + E p * ( 1 e t τ ) .
Energies 18 03115 g008
Figure 9. Relaxation time τ for the interface buildup as a function of temperature.
Energies 18 03115 g009
Table 1. Crude oil properties.
Crude Oil SampleDensity [g/mL]Viscosity [cP]Asphaltene Content [% m/m]
Campo Sacha0.913653.208.65
Table 2. Brines composition and properties.
BrinesComposition [ppm][kg/mol][g/mL]pH
NaCl NaHCO3 CaCl2MgCl2TDS *IS **Density
100% FW13,19537063732114,5230.26901.00876.38
1% FW1324631450.00270.99726.89
* Total dissolved Solids, ** Ionic strength.
Disclaimer/Publisher’s Note: The statements, opinions and data contained in all publications are solely those of the individual author(s) and contributor(s) and not of MDPI and/or the editor(s). MDPI and/or the editor(s) disclaim responsibility for any injury to people or property resulting from any ideas, methods, instructions or products referred to in the content.

