Abstract
Ammonia is a carbon-free fuel with strong potential for emission reduction. However, its high auto-ignition temperature and low reactivity lead to poor ignitability and unstable combustion. In contrast, coal-to-liquid (CTL) fuel offers high cetane number, low sulfur content, and low aromaticity, making it a clean fuel with excellent ignition performance. Blending CTL with ammonia can effectively compensate for ammonia’s combustion limitations, offering a promising pathway toward low-carbon clean combustion. This study explores the effects of post-injection strategies on combustion and emission characteristics of a CTL–ammonia dual-fuel engine under different levels of ammonia energy fractions (AEFs). Results show that post-injection significantly improves combustion and emission performance by expanding ammonia’s the favorable reactivity range of ammonia and enhancing NH3 oxidation, particularly under moderate AEF conditions (5–10%) where ammonia and CTL demonstrate strong synergy. For emissions, moderate post-injection notably reduces CO at low AEFs, while NOX emissions consistently decrease with increasing post-injection quantity, with greater suppression observed at higher AEFs. Soot emissions are also effectively reduced under post-injection conditions. Although total hydrocarbon (THC) emissions increase due to ammonia’s low reactivity, post-injection mitigates this accumulation trend to some extent, demonstrating overall co-benefits for emission control. Comprehensive evaluation indicates that the combination of 5–10% AEF, 8–12 mg post-injection quantity, and post-injection timing of 10–15 °CA achieves the most favorable balance of combustion efficiency, emissions reduction, and reaction stability, confirming the potential of the CTL–ammonia dual-fuel system for clean and efficient combustion.
1. Introduction
Internal combustion engines continue to dominate global transportation, industrial equipment, and distributed power generation sectors due to their high thermal efficiency, strong fuel adaptability, and operational stability []. However, the heavy reliance on fossil fuel combustion has imposed a substantial environmental burden. It is a major source of atmospheric pollutants such as NOX and particulate matter, and also the primary contributor to greenhouse gas emissions such as CO2, posing ongoing threats to both climate stability and human health []. In particular, in China, where the energy structure is heavily dependent on coal and petroleum, the oil import dependency continues to rise and is projected to exceed 85% by 2035, further exacerbating energy security concerns []. Against the backdrop of increasingly stringent emission regulations and mounting energy pressures, promoting the transition of ICE toward cleaner and more efficient technologies has become imperative. Studies have shown that the introduction of alternative fuels offers a practical pathway to reduce pollutant emissions and mitigate energy dependency, enabling lower emissions while maintaining output performance, and thus demonstrating promising technological potential [].
Given China’s resource structure characterized by abundant coal, limited oil, and scarce natural gas, coal remains the dominant component of the national energy mix and is unlikely to be fully replaced by other energy sources in the short term []. Coal-to-liquid (CTL) fuels, produced through chemical processing of coal, exhibit favorable physicochemical properties, including a high cetane number, moderate kinematic viscosity, and low contents of sulfur and aromatic hydrocarbons []. The production of CTL fuels primarily follows two fundamental pathways: direct coal liquefaction (DCL) and indirect coal liquefaction (ICL) []. Compared with DCL, CTL fuels derived from ICL processes can significantly reduce nitrogen oxides (NOX) and particulate matter (PM) emissions, making them a promising candidate for clean alternative fuels [].
Lyu et al. [] investigated the spray and atomization characteristics of coal-to-liquid (CTL) fuels and reported that compared to conventional diesel, coal-based fuels exhibited a longer spray penetration distance and better atomization performance, which facilitated fuel-air mixing. Jin et al. [] studied a six-cylinder heavy-duty diesel engine and found that NOX emissions from indirect coal liquefaction (ICL) fuels were lower than those of diesel and direct coal liquefaction (DCL) fuels under low injection pressure, along with improved fuel economy. Zhang et al. [] systematically compared the combustion and emission characteristics of CTL and conventional diesel on a heavy-duty engine platform, concluding that CTL fuels exhibited a shorter ignition delay, more concentrated combustion, and a notable reduction in soot emissions, although CO, NOX and HC emissions were higher than those of diesel. Zhu et al. [] combined experiments and simulations to investigate the synergistic combustion characteristics of methanol and CTL fuels under reactivity-controlled compression ignition (RCCI) mode and found that RCCI operation significantly reduced NOX and particulate matter emissions, but CO and HC emissions increased notably at high methanol blending ratios. Redel and Patiño et al. [,] explored the effects of short-chain alcohols blended with diesel on engine emissions. Kozak et al. [] investigated the impact of oxygenated diesel alternative fuels on particulate emissions. The results indicated that increasing the oxygen content in the fuel can improve the mixing uniformity and enhance oxidation reactions during combustion, thereby reducing the formation of soot precursors and effectively reducing particulate matter emissions. Zhang et al. [] achieved simultaneous suppression of NOX and particulate emissions through coordinated control of exhaust gas recirculation (EGR) and injection timing in a CTL/n-butanol dual-fuel combustion mode. Zheng et al. [] investigated the effects of various CTL/dimethyl carbonate blending ratios and injection strategies on combustion and emissions, demonstrating that the dual-injection strategy improved combustion stability and, under optimized control, achieved concurrent reductions in soot and NOX emissions. Zhang et al. [] demonstrated that under high-load conditions, the gasoline/CTL dual-fuel mode exhibits a more stable combustion process and higher indicated thermal efficiency (ITE). Upon optimization of injection strategies, a 2% increase in ITE, a 46.1% reduction in the peak pressure rise rate (PPRR), and a 19.8% decrease in particulate emissions can be achieved, without compromising NOX levels.
Ammonia, as a zero-carbon fuel, does not emit carbon dioxide during combustion, producing only water and nitrogen gas [,]. It is easily liquefied at ambient conditions, convenient for storage and transportation, and possesses a higher energy density than liquid hydrogen. Additionally, its associated production and distribution infrastructure is relatively mature, making ammonia a key component in the clean energy development strategies of several countries []. However, ammonia’s high autoignition temperature, low flame propagation speed, large latent heat of vaporization, and low heating value render it unstable for standalone combustion in compression ignition engines, resulting in difficulties achieving effective ignition and sustained combustion [,,]. Consequently, a high-reactivity fuel is often employed to assist in igniting ammonia. To address these challenges, researchers have commonly introduced ammonia into high-reactivity fuel systems to establish dual-fuel combustion modes, aiming to improve combustion characteristics while maintaining low carbon emissions [,]. Park et al. [] found that increasing the compression ratio enhanced the thermal efficiency and combustion stability of ammonia/diesel dual-fuel engines and reduced unburned NH3 emissions by approximately 10%. However, raising the compression ratio alone was insufficient to completely eliminate NH3 emissions. Zhou et al. [] observed that increasing the ammonia energy fraction significantly improved thermal efficiency and carbon emission performance but also led to higher unburned NH3 and N2O emissions. They further demonstrated that increasing injection pressure could enhance the combustion process and effectively suppress unburned NH3 emissions, while advancing the injection timing accelerated ignition and improved efficiency at the expense of higher NOX emissions. Dong et al. [] found that increasing intake temperature and optimizing the spray arrangement angle in ammonia/diesel dual-injection strategies effectively improved ammonia fuel reactivity and combustion rates. Wen et al. [] demonstrated that blending highly reactive fuels improved early-stage combustion stability, reduced misfire rates, and expanded the feasible ammonia substitution ratio.
Injection strategy is a critical technique for controlling fuel–air mixing, adjusting combustion phasing, and optimizing pollutant formation. Previous studies have shown that approaches such as split injection and multiple injections can effectively improve combustion efficiency and emission performance [,,]. Among them, post-injection has demonstrated multiple benefits, including increased exhaust temperature, extended combustion duration, and enhanced soot oxidation [,]. Zhou et al. [] reported that increasing post-injection quantity in a high-pressure common-rail diesel engine promoted secondary oxidation of soot and suppressed high-temperature regions formed by the main injection, thereby reducing both soot and NOX emissions. Similarly, Lu et al. [] found that under medium to high-speed conditions, a combination of double pilot injection and main injection improved fuel–air mixing and combustion characteristics, leading to lower NOX and soot emissions as well as improved thermal efficiency.
Current research primarily focuses on the combustion characteristics of ammonia–diesel dual-fuel engines, while studies involving ammonia blending based CTL fuels remain limited. Additionally, the issue of elevated ammonia slip emissions in ammonia-diesel systems has yet to be resolved. This study investigates the effects of post-injection strategies on combustion and emission behavior in a four-cylinder, four-stroke diesel engine fueled with CTL and different levels of ammonia energy fractions (0–15%), aiming to provide technical support for the efficient and clean utilization of ammonia. The objective is to elucidate the regulatory mechanism of post-injection strategies on the coupled combustion and emission behavior of CTL–ammonia dual-fuel systems, thereby providing theoretical support for developing efficient and low-emission ammonia-blended fuel applications.
2. Materials and Methods
2.1. Experimental Bench and Instruments
The experiments were conducted on a four-cylinder, four-stroke, turbocharged diesel engine with charging air cooler, with its main specifications listed in Table 1.

Table 1.
Main parameters of the test engine.
The engine operation control and parameter settings were jointly implemented by the calibration software INCA7.2 and the ECU. By configuring relevant parameters within the INCA interface, the injection quantity, timing, and pressure could be flexibly adjusted to control the injection strategy, thereby meeting the fuel injection requirements under different experimental conditions. The combustion analysis system consisted of a Kistler piezoelectric pressure sensor (Kistler Instrumente AG, Winterthur, Switzerland) and a DEWE-800 signal processing module (DEWETRON GmbH, Graz, Austria). The in-cylinder pressure signal was acquired with a resolution of 0.5 °CA and averaged over 50 consecutive cycles under each operating condition to reduce the impact of cycle-to-cycle fluctuations. After conversion and processing, the pressure signal was transmitted to the analysis software. Based on a first-law heat release model, the system calculated the instantaneous net heat release rate curve in units of J/°CA by combining the measured pressure and crank angle data, engine geometric parameters, and the specified specific heat ratio. In addition, the system was capable of real-time calculation of other key combustion parameters, such as in-cylinder pressure, average gas temperature, and combustion phasing. The AVL 415SE smoke meter (AVL List GmbH, Graz, Austria) measured the smoke concentration in the engine exhaust using a filter paper absorption method. The MEXA-7100DEGR gas analyzer (Horiba Ltd., Kyoto, Japan) measured the concentrations of major gaseous pollutants such as CO, THC, and NOx in the exhaust. Particle number concentration and size distribution in the exhaust were measured using the DMS500 MKII fast particle analyzer (Cambustion Ltd., Cambridge, UK). Real-time monitoring of unburned NH3 in the exhaust was carried out using the NH3CAN module, which employs an electrochemical sensor to convert the current generated by electrode reactions into concentration values and transmits the data via CAN bus for continuous acquisition and analysis. The test bench layout is shown in Figure 1. The measurement uncertainties of the relevant instruments are summarized in Table 2.
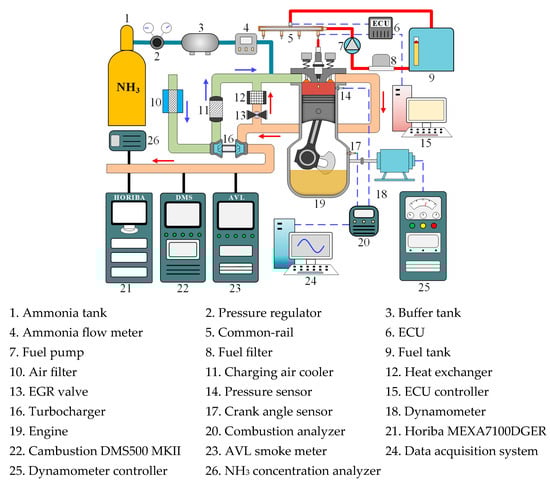
Figure 1.
Engine experimental bench.
Table 2.
Instrument uncertainties.
2.2. Test Fuels
The CTL fuel used in this study was an indirectly liquefied fuel synthesized via the Fischer–Tropsch process, supplied by Shanxi Baixi Technology Co., Ltd. (Changzhi, China). The ammonia used was purchased from Guangxi Ruida Chemical Co., Ltd. (Nanning, China), with a purity exceeding 99.9%. A dual-fuel separated supply strategy was employed in the experiments: CTL, as the primary liquid fuel, was directly injected into the combustion chamber via a high-pressure common rail system, while ammonia was introduced in gaseous form into the intake manifold through an independent pressurized gas supply system. The two fuels were then mixed and co-combusted within the cylinder. Four fuel conditions were tested, corresponding to ammonia energy fractions (AEFs) of 0%, 5%, 10%, and 15% (i.e., AEF = 0%, AEF = 5%, AEF = 10%, and AEF = 15%), to systematically evaluate the effects of ammonia blending ratio on combustion and emission characteristics.
To ensure that the proportion of ammonia in the total fuel energy accurately matches the set AEF, this study first calculated the fuel input thermal power under pure CTL conditions based on fuel consumption and lower heating value and determined the BTE using the measured brake power. On this basis, the required fuel input energy per unit of output power was derived. Then, according to the definition of AEF given in Equation (1), the required ammonia mass flow rate was accurately calculated. The key physicochemical properties of the fuels are summarized in Table 3.
Table 3.
Physicochemical properties of test fuels.
2.3. Experimental Procedure and Test Conditions
The experiments were conducted at a fixed engine speed of 1200 rpm with a main injection timing of 10 °CA BTDC, a rail pressure of 140 MPa, an indicated mean effective pressure (IMEP) of 1.4 MPa, and an exhaust gas recirculation (EGR) rate of 0%. Prior to data acquisition, the engine was preheated and calibrated to ensure that all parameters remained within allowable tolerances. Once stable operation at the target condition was achieved, data collection commenced.
The test fuels were prepared by blending CTL with varying proportions of ammonia to achieve four ammonia energy fractions (AEFs): 0%, 5%, 10%, and 15%.
For each AEF, engine performance was evaluated under different post-injection quantities (Q0, Q4, Q8, Q12, Q16, Q20, corresponding to 0, 4, 8, 12, 16, and 20 mg) and post-injection timings (C10, C15, C20, C25, C30, corresponding to 10°, 15°, 20°, 25°, and 30 °CA ATDC). All experiments were conducted under steady-state load conditions, with each operating point measured no fewer than three times and the average value taken to enhance the representativeness and repeatability of the results. The experimental matrix is summarized in Table 4.
Table 4.
Experimental matrix and operating parameters.
Two fuels with different reactivity levels were used in this study. To ensure calculation accuracy, the definitions of ammonia energy fraction (AEF), total fuel consumption (mmix), and brake thermal efficiency (BTE) are provided as follows:
The ammonia energy fraction (AEF) is defined as shown in Equation (1):
The total fuel consumption (mmix) is defined as shown in Equation (2):
The brake thermal efficiency (BTE) is defined as shown in Equation (3):
where and represent the lower heating value (MJ/kg) and mass flow rate (kg/h) of ammonia fuel, respectively; and represent the lower heating value (MJ/kg) and mass flow rate (kg/h) of CTL fuel, respectively; and Pe denotes the brake power (kW).
3. Results
3.1. Combustion and Emission Characteristics Under Different Post-Injection Quantities
To investigate the effects of varying post-injection quantities on engine combustion and emissions, experiments were conducted under the following operating conditions: an engine speed of 1200 rpm, a main injection timing of 10 °CA BTDC, an injection pressure of 140 MPa, an IMEP of 1.4 MPa, and a post-injection timing of 20 °CA ATDC. In this study, the post-injection quantities were set to 0, 4, 8, 12, 16, and 20 mg, corresponding to six different post-injection levels, with 0 mg representing a single injection.
3.1.1. Combustion Characteristics Under Different Post-Injection Quantities
Figure 2 illustrates the effects of post-injection quantity on in-cylinder pressure and heat release rate (HRR) under different AEFs. Across all conditions, the peak pressure induced by the main injection consistently occurred around 5 °CA ATDC, with peak pressure variations within 4 bar among different post-injection quantities, suggesting a limited influence of post-injection during the main combustion phase. However, in the later combustion phase (beyond 20 °CA), the pressure decay rate was noticeably affected by post-injection. At higher post-injection levels (16 mg and 20 mg), the decline in pressure during the expansion stroke slowed, indicating enhanced late-stage combustion. This trend persisted with increasing AEF, suggesting that post-injection fuel reacted within the high-temperature residual gas environment, delaying pressure drop and intensifying late-stage combustion. In all cases, the main heat release peak occurred near TDC. Under single injection (C0Q0), the HRR exhibited a single peak. As post-injection quantity increased, a distinct secondary HRR peak emerged between 20–35 °CA for conditions with ≥8 mg post-injection. This secondary peak intensified with increasing fuel quantity, confirming successful ignition of the post-injection fuel under elevated pressure and temperature. Notably, this secondary peak was further enhanced with rising AEF. At AEF = 15% and post-injection of 20 mg, the late-stage HRR reached 77.6 J/deg, indicating that the CTL post-injection facilitated the combustion of unburned NH3.
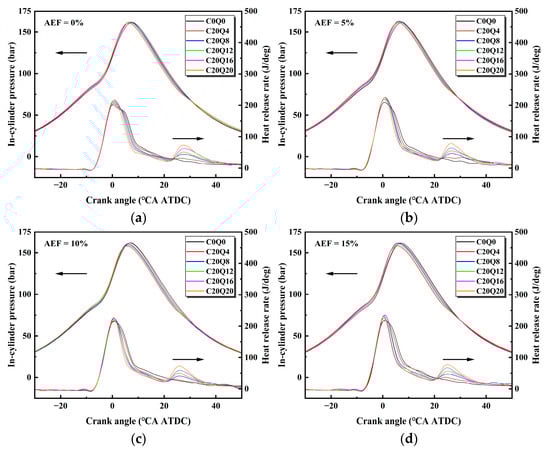
Figure 2.
Variations of in-cylinder pressure and heat release rate under different post-injection fuel quantities. (a) AEF = 0%, (b) AEF = 5%, (c) AEF = 10%, (d) AEF = 15%.
Figure 3 presents the variation in in-cylinder temperature under different post-injection quantities. As seen in Figure 3a, at AEF = 0%, the peak temperature decreased from 1804 K (without post-injection) to 1606 K with 20 mg post-injection, representing an 11% reduction. This suggests that increased post-injection may dilute the local air–fuel ratio in the main combustion zone. In Figure 3b (AEF = 5%), a slight post-injection (4 mg) led to a marginal rise in peak temperature, followed by a gradual decline with further increases in injection quantity. This indicates that a small amount of post-injection can enrich the combustible mixture under low AEF conditions, enhancing combustion efficiency. For higher ammonia fractions (Figure 3c,d), AEF = 10% and 15%) the trend differs. Unlike the continuous temperature decline observed at AEF = 5%, a moderate increase in peak temperature was observed in the mid-range injection quantities. This is attributed to post-injection fuel vaporizing and mixing effectively in the early expansion phase, where high pressure and temperature persist, thus promoting the secondary combustion of residual NH3 and elevating local temperature after the main combustion peak. A comparison of peak temperatures without post-injection across different AEFs reveals a general decline with increasing ammonia content. This is primarily due to ammonia’s low reactivity, high heat capacity, and long ignition delay, which limit heat release during the main injection phase. However, the peak temperature at AEF = 15% was slightly higher than that at 10%, potentially due to reduced in-cylinder charge density caused by NH3’s lower density. This may have improved spray penetration and air entrainment, enhancing mixture formation and combustion intensity. Overall, post-injection quantity had a limited effect on peak temperature at low doses but led to a significant reduction at higher levels, while increasing AEF consistently lowered the peak temperature ceiling.
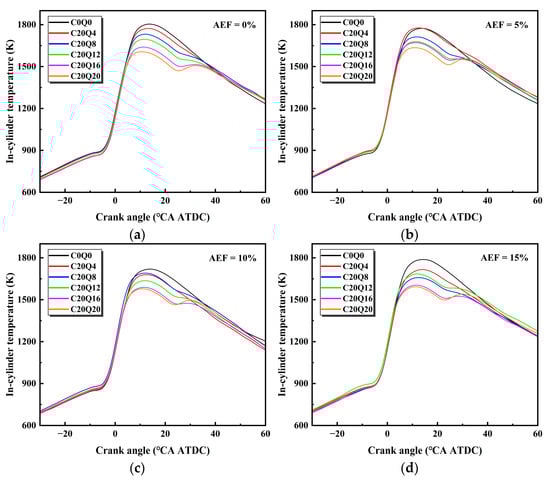
Figure 3.
Variation of in-cylinder temperature under different post-injection quantities. (a) AEF = 0%, (b) AEF = 5%, (c) AEF = 10%, (d) AEF = 15%.
Figure 4 shows the variations in ignition delay (ID), combustion duration (CD), and combustion phasing-defined as the crank angle at 50% heat release (CA50), under different AEFs and post-injection quantities. As shown in Figure 4a, ID remains nearly constant at approximately 8 °CA across all conditions, with a slight increase observed at higher AEFs. This is attributed to the low reactivity of ammonia, which prolongs ignition under high AEFs. Since post-injection occurs after the main injection, its influence on initial ignition is minimal. In contrast, CD shows a more pronounced sensitivity to post-injection quantity. At low AEFs, CD increases with post-injection quantity, suggesting that the additional fuel forms a stable reaction zone during the latter stage of combustion, thereby extending the overall heat release duration. Interestingly, at AEF = 10%, CD under post-injection conditions is shorter than that without post-injection, indicating that moderate post-injection promotes earlier participation of unburned ammonia, enhances fuel reactivity, and concentrates heat release, ultimately shortening the combustion process.
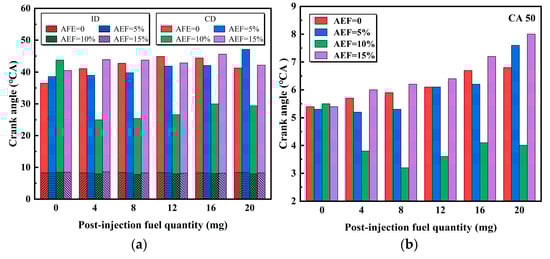
Figure 4.
Variation of ignition delay, combustion duration, and CA50 under different post-injection quantities. (a) Ignition delay and combustion duration, (b) CA50.
Figure 4b shows that CA50 generally shifts later with increasing post-injection quantity at low and high AEFs, reflecting delayed heat release due to the slow reaction of post-injected fuel. However, under AEF = 10%, CA50 initially advances and then stabilizes, with the most pronounced effect at 8 mg. This indicates an optimal post-injection range where combustion is more concentrated and occurs earlier, enhancing thermal efficiency. Beyond this range, the marginal benefit declines, and CA50 shifts back, implying diminished post-injection effectiveness. These findings suggest that under moderate AEFs, there exists an optimal post-injection quantity that helps refine combustion phasing by balancing reaction intensity and timing.
Figure 5 shows the effect of post-injection quantity on brake thermal efficiency (BTE) under different AEFs. At AEF = 5%, the highest BTE of 42.66% was achieved with 8 mg post-injection. Under this condition, post-injected fuel promoted localized high-temperature zones during the late combustion phase, enhancing the oxidation of unburned NH3 and improving both pressure development and combustion phasing, thereby increasing useful work output. When post-injection quantity was further increased to 16 and 20 mg, BTE declined due to delayed combustion phasing, which reduced the conversion of heat to mechanical energy and increased exhaust losses. It is noteworthy that within the AEF range of 0–10%, the BTE at 4 mg is slightly higher than that at 12 mg, indicating that a moderately small post-injection quantity may be more favorable for combustion phasing control and efficiency improvement. At AEF = 15%, BTE initially rose and then declined with increasing post-injection quantity. A relatively high efficiency was still maintained within the 8–12 mg range, indicating that moderate ammonia addition did not significantly compromise efficiency. Instead, post-injection helped compensate for ammonia’s low reactivity and sustained overall combustion quality.
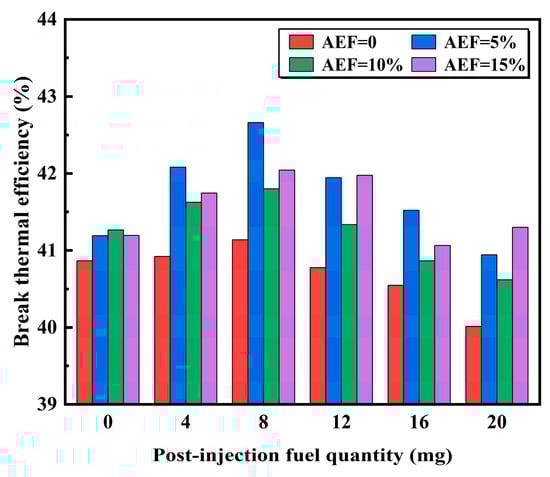
Figure 5.
Variation of brake thermal efficiency under different post-injection quantities.
3.1.2. Emissions Characteristics Under Different Post-Injection Quantities
Figure 6 presents the variations in CO, NOX, THC, and soot emissions under different post-injection quantities and ammonia energy fractions. As shown in Figure 6a, the effect of post-injection quantity on CO emissions under different AEFs. CO emissions increased significantly with rising AEF, with the highest values observed at AEF = 15%, reaching up to 0.18 g/kW·h. This trend is attributed to ammonia’s low reactivity and slow ignition, which at high substitution levels leads to mixture inhomogeneity and incomplete combustion, thereby promoting CO formation. Across all AEFs, CO emissions generally followed a declining-then-rising trend with post-injection quantity. Moderate post-injection facilitated further oxidation of unburned hydrocarbons from the main combustion phase, enhancing CO-to-CO2 conversion and improving combustion completeness. However, at higher injection quantities, excessive spray penetration caused wall wetting and local over-rich zones, which impeded complete oxidation. As shown in Figure 3, cylinder temperature in the late combustion phase was already reduced, making ignition of excess fuel more difficult and leading to increased CO emissions.
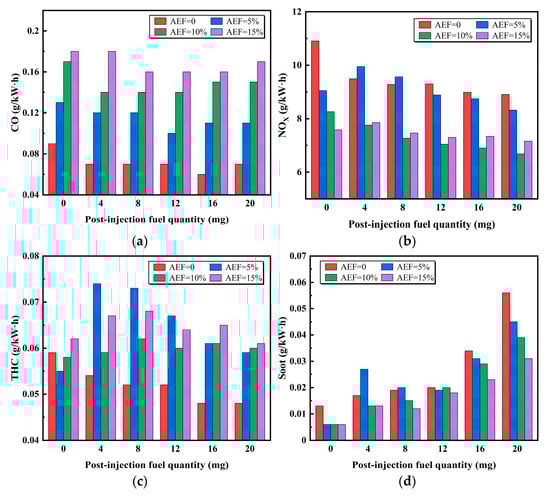
Figure 6.
Variations of emission characteristics under different post-injection quantities. (a) CO, (b) NOX, (c) THC, (d) Soot.
As shown in Figure 6b, the effect of post-injection quantity on NOX emissions under different ammonia energy fractions (AEFs). In all cases, NOX emissions decreased steadily with increasing post-injection. At AEF = 10% with 20 mg post-injection, NOX reached a minimum of 6.68 g/kW·h, representing a 38.77% reduction compared to the peak value of 10.91 g/kW·h under the pure CTL condition. This highlights the strong potential for NOX reduction with ammonia. As shown in Figure 3, moderate post-injection helps smooth the heat release following the main combustion phase, avoiding sharp temperature spikes that drive thermal NOX formation. The additional heat release also slows the temperature drop during expansion, extending high-temperature residence time. Under these conditions, ammonia decomposition produces NH2 radicals, which can reduce NO via chain reactions such as NH2 + NO → N2 + H2O, further lowering NOX emissions.
As shown in Figure 6c, the effect of post-injection quantity on THC emissions under different AEFs. For AEF = 0, THC emissions steadily decreased as post-injection increased, reaching a minimum at 16 mg. This indicates that appropriate post-injection enhances combustion completeness and suppresses unburned hydrocarbon formation when ammonia is not present. At AEF = 5%, THC emissions rose significantly from 0 to 4 mg, peaking at 4 mg before gradually decreasing. This suggests that small post-injection quantities at low AEFs may disturb mixture homogeneity or compromise ignition stability, leading to increased hydrocarbon residues. At higher AEFs (10–15%), the impact of post-injection on THC emissions was relatively limited. Only a slight reduction was observed at post-injection quantities above 12 mg. This is attributed to the inherently slow reaction kinetics and low reactivity of ammonia, which hinder complete oxidation in zones where combustion remains incomplete. As the AEF increases, ammonia plays a more dominant role in the combustion process. The overall reaction becomes increasingly governed by ammonia’s slow chemical reactivity. Although post-injection can improve local mixture formation, it is insufficient to overcome the oxidation limitations imposed by ammonia, resulting in reduced effectiveness in reducing THC emissions.
As shown in Figure 6d, the effect of post-injection quantity on engine soot emissions under different AEFs. At AEF = 0, soot emissions increase steadily with higher post-injection quantities and show a sharp rise beyond 12 mg, indicating a strong tendency for soot formation. This is mainly due to the high aromatic and heavy hydrocarbon content in CTL fuel, which promotes the formation of polycyclic aromatic hydrocarbon (PAH) precursors and facilitates soot nucleation during the early combustion phase. Under post-injection conditions, fuel is introduced during the flame diffusion stage, where in-cylinder mixing is poor and pyrolysis or incomplete combustion is more likely, accelerating soot production. With ammonia addition, overall soot levels are significantly reduced compared to pure CTL, and the rising trend with post-injection is noticeably suppressed. At AEF = 15%, the suppression is most pronounced, demonstrating ammonia’s mitigating effect on soot formation. This is primarily because NH3 is carbon-free and does not contribute directly to soot precursors. Moreover, the thermal decomposition of NH3 produces reactive radicals such as H, NH, and NH2, which enhance soot oxidation during combustion.
Figure 7 shows the effect of post-injection quantity on unburned NH3 emissions under different AEFs. In all AEF cases, unburned NH3 emissions declined continuously with increasing post-injection, indicating that post-injection improves ammonia combustion efficiency. This reduction is mainly attributed to the slow and multi-step oxidation pathway of ammonia, which proceeds through NH3 → NH2 → NH → NO/N2 and requires an extended high-temperature residence time. The additional heat release from post-injection prolongs the high-temperature window following the main combustion phase, providing more favorable thermodynamic conditions and reaction time for ammonia oxidation. Moreover, the post-injected spray enhances in-cylinder turbulence, improving the mixing between ammonia, oxygen, and fuel. This reduces the likelihood of fuel-rich or poorly mixed zones that may hinder complete reaction. As a result, post-injection demonstrates strong potential for reducing unburned NH3 emissions.
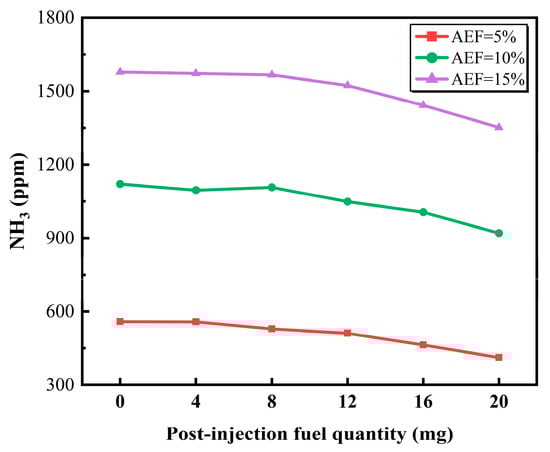
Figure 7.
Variation of unburned NH3 emissions under different post-injection quantities.
Figure 8 illustrates the effect of post-injection quantity on particulate emissions under different AEFs. Across all AEF conditions, total particle number concentration increased with post-injection, while the size distribution patterns remained consistent. In general, all cases exhibited a clear bimodal distribution, corresponding to nucleation mode particles (diameter < 50 nm) and accumulation mode particles (50–1000 nm). At AEF = 0, the number concentration of accumulation mode particles rose significantly as post-injection increased from 0 to 20 mg, indicating a strong tendency toward soot formation under high injection quantities. This trend is primarily attributed to prolonged ignition delay and an increased likelihood of wall impingement, both of which promote soot precursor generation and particle growth. In contrast, under ammonia-blended conditions (AEF = 5–15%), although PN concentrations still increase with the post-injection quantity, the rate of increase is notably suppressed. This indicates that ammonia addition effectively reduces the formation of soot precursors and inhibits the agglomeration process, demonstrating a strong potential for soot reduction. Notably, the particle number distribution curves for AEF = 15% and AEF = 10% are quite similar in both magnitude and shape. This can be attributed to the fact that, beyond a certain level of ammonia blending, the dilution effect and thermal capacity enhancement tend to saturate, resulting in diminished incremental impacts on particle formation pathways. As a result, similar control effectiveness is observed across the 8–20 mg post-injection range.
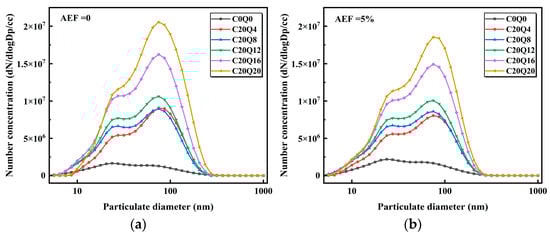
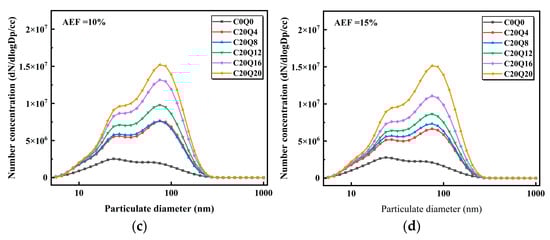
Figure 8.
Variation of particle emissions under different post-injection quantities. (a) AEF = 0%, (b) AEF = 5%, (c) AEF = 10%, (d) AEF = 15%.
3.2. Combustion and Emission Characteristics Under Different Post-Injection Timings
To investigate the effects of different post-injection timings on engine combustion and emissions, experiments were conducted under the following conditions: an engine speed of 1200 rpm, a main injection timing of 10 °CA BTDC, a post-injection quantity of 12 mg, an injection pressure of 140 MPa, and an IMEP of 1.4 MPa. In this study, the post-injection timings were set at 10°, 15°, 20°, and 30° crank angle after top dead center (ATDC), which correspond to four post-injection advance angles.
3.2.1. Combustion Characteristics Under Different Post-Injection Timings
Figure 9 illustrates the effects of post-injection timing on in-cylinder pressure and HRR under different AEF. As post-injection timing was delayed from 0 °CA to 30 °CA, peak pressure generally showed a decreasing-then-increasing trend, more pronounced at higher AEFs. At 10 °CA, poor coupling between the post-injected fuel and the main combustion led to the lowest peak pressure. At 30 °CA, post-injection occurred within the high-temperature region near the end of main combustion, enhancing oxidation and increasing peak pressure. The highest peak pressure of 163.5 bar was observed at AEF = 5%, indicating stronger combustion enhancement at lower ammonia substitution. Across all conditions, HRR curves exhibited a distinct main peak near TDC, with similar profiles. Increasing AEF slightly reduced the main HRR peak, particularly at AEF = 15%, due to the lower reactivity and slower flame propagation of ammonia. At 15 °CA, the secondary HRR peak and combustion duration were maximized, shifting heat release into the expansion stroke, reducing the maximum pressure rise rate, and improving thermal efficiency and emissions. Further delaying post-injection to 25 °CA or 30 °CA weakened the secondary peak, indicating missed optimal reaction timing and incomplete participation of post-injected fuel, leading to reduced combustion efficiency.
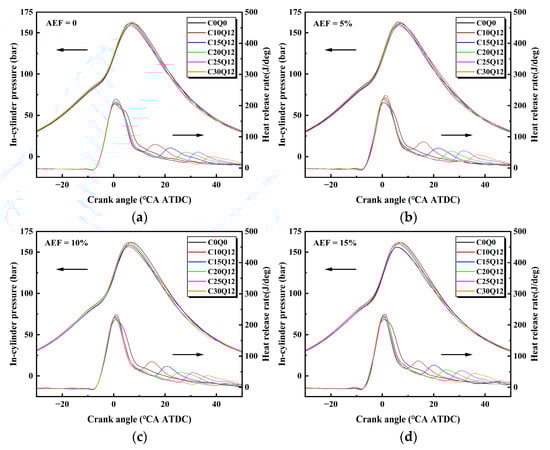
Figure 9.
Variations of in-cylinder pressure and heat release rate under different post-injection timings. (a) AEF = 0%, (b) AEF = 5%, (c) AEF = 10%, (d) AEF = 15%.
Figure 10 shows the in-cylinder temperature profiles under varying post-injection timings and AEF conditions. At AEF = 5%, the effect of post-injection angle on peak temperature was most pronounced. Compared to the no post-injection case (1773 K), the peak temperature rose to 1825 K at 10 °CA post-injection with 12 mg, an increase of 2.9%. This enhancement was not observed at other AEF levels, indicating that under low AEF conditions, appropriate post-injection timing can intensify overall heat release and elevate combustion temperature, thereby improving combustion performance. At AEF = 10%, the lowest peak temperature of 1719 K was recorded, reflecting a clear weakening of heat release. This is primarily due to the reduced reactivity caused by NH3 addition, which lowers the combustion intensity during the main phase and limits the post-injection’s ability to restore peak temperature.
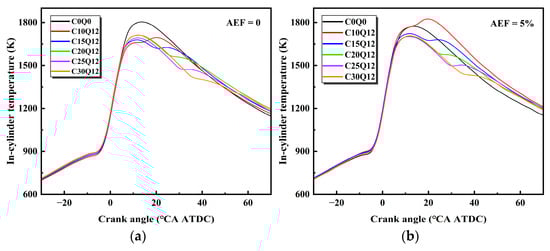
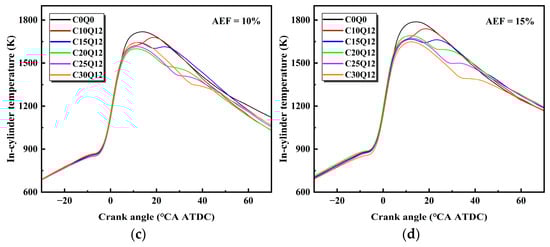
Figure 10.
Variation of in-cylinder temperature under different post-injection timings. (a) AEF = 0%, (b) AEF = 5%, (c) AEF = 10%, (d) AEF = 15%.
Figure 11 presents he effects of post-injection timing on combustion phasing characteristics, including ID, CD, and CA50. As shown in Figure 11a, ID remained relatively unchanged across different post-injection timings and was mainly influenced by the AEF. With AEF increasing from 0% to 15%, ID gradually extended due to the low reactivity of NH3, which delays ignition as its proportion rises. Since post-injection occurs after the main injection, when in-cylinder temperature and pressure are already high, its direct influence on ID was minimal. In contrast, CD was more sensitive to post-injection timing. A general increase in CD was observed as post-injection was delayed, indicating that later injections promote additional heat release during the late combustion phase. At AEF = 10%, CD first decreased and then increased with advancing post-injection angle, suggesting the existence of an optimal post-injection window where unburned NH3 can be more effectively utilized. This led more to a shorter combustion duration with improved phasing and a shorter duration. Figure 11b shows that at AEF = 10%, CA50 remained relatively stable despite post-injection delay, indicating that appropriate post-injection timing under moderate AEF conditions enhances mixture homogeneity and combustion concentration. As a result, the heat release phase is preserved closer to the ideal crank angle, which is beneficial for thermal efficiency.
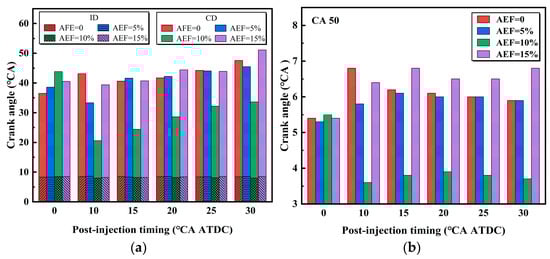
Figure 11.
Variation of ignition delay, combustion duration, and CA50 under different post-injection timings. (a) Ignition delay and combustion duration, (b) CA50.
Figure 12 shows the BTE under different post-injection timings. In all AEF conditions, BTE peaked around 10 °CA post-injection, followed by a consistent decline with further delay. Specifically, at AEF = 5%, BTE first increased and then decreased, reaching a maximum of 42.92% at 10 °CA. This improvement is attributed to enhanced utilization of residual NH3 in the high-temperature and high-pressure environment formed at the end of the main combustion, which helped concentrate heat release and improve energy conversion. This trend aligns with earlier findings on combustion phasing and temperature behavior, highlighting the synergistic effect of post-injection and moderate ammonia blending. Similar BTE peaks were observed near 10 °CA in other AEF conditions, but efficiency declined as post-injection was further delayed to 30 °CA. This suggests that excessively late injection misses the optimal in-cylinder temperature range for efficient combustion, leading to incomplete fuel oxidation, increased exhaust losses, and reduced conversion of heat to mechanical work.
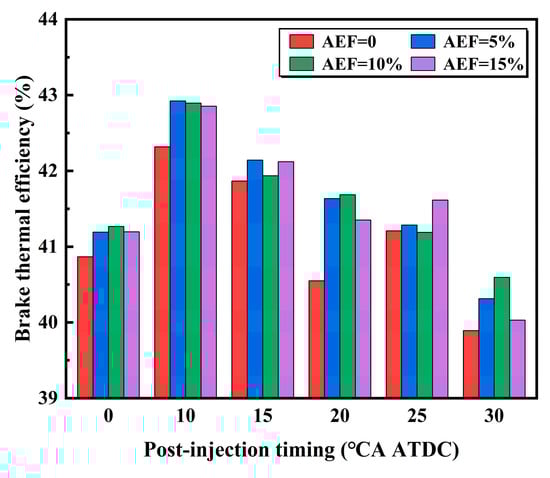
Figure 12.
Variation of brake thermal efficiency under different post-injection timings.
3.2.2. Emissions Characteristics Under Different Post-Injection Timings
Figure 13 presents the effects of post-injection timing on CO, NOX, THC, and soot emissions under different ammonia energy fractions. As shown in Figure 13a, there was a variation in CO emissions under different post-injection timings. Overall, CO emissions increased significantly with rising AEF and exhibited a nonlinear response to post-injection timing. At AEF = 0, CO levels remained low, reaching a minimum of 0.06 g/kW·h at 15 °CA but rising to 0.11 g/kW·h at 30 °CA. This suggests that a moderate post-injection delay improves heat release uniformity and fuel–air mixing, enhancing oxidation and reducing CO formation. However, excessive delay may lead to locally rich zones and shifted combustion, thereby increasing CO emissions. Under ammonia-blended conditions, CO emissions were consistently higher and increased with AEF. At AEF = 15%, CO levels peaked at 30 °CA. This trend is attributed to the low reactivity and long ignition delay of NH3, which hinders complete oxidation of residual fuel after the main combustion. Additionally, late post-injection at high AEF exacerbates spray penetration and uneven fuel distribution, increasing the likelihood of over-rich or lean zones near cylinder walls and leading to local quenching or incomplete combustion.
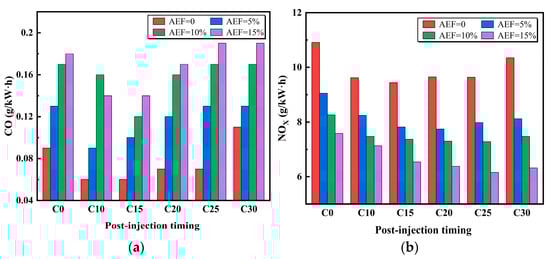
Figure 13.
Variations of emission characteristics under different post-injection timings. (a) CO, (b) NOX, (c) THC, (d) Soot.
As shown in Figure 13b, the effect of post-injection timing on NOX emissions across different AEFs. Overall, NOX emissions declined markedly with increasing AEF, highlighting the reduction potential of NH3. At AEF = 0, NOX emissions were significantly higher than those of ammonia-containing fuels, peaking at 10.91 g/kW·h. A slight decrease was observed at mid-range injection timings, but emissions rose again at 30 °CA, suggesting that excessive post-injection delay may trigger secondary heat release peaks, thereby limiting NOX suppression. With higher AEFs, NOX levels steadily decreased. For instance, at AEF = 15%, NOX reached a minimum of 6.16 g/kW·h at 25 °CA, representing a 43.5% reduction compared to the peak value at AEF = 0. This decline is primarily due to the thermal decomposition of NH3 at high temperatures, producing reactive intermediates that promote NO reduction via chain reactions, thus reducing thermal NOX formation. Across all AEFs, NOX generally declined with post-injection delay between 15° and 25 °CA, as moderate delay facilitated smoother late-stage heat release, reduced peak temperatures, and limited NOX accumulation. However, delaying injection beyond 25–30 °CA may induce local ignition delay during the expansion stroke, causing localized high-temperature zones and a slight rebound in NOX emissions.
As shown in Figure 13c, the variation in total hydrocarbon (THC) emissions with post-injection timing under different AEFs. Post-injection timing exhibited a clear influence on THC emissions, with distinct responses across AEF levels. Generally, advancing the post-injection (0–15 °CA) helped reduce THC emissions, while delaying it to 30 °CA significantly increased unburned hydrocarbon accumulation. At AEF = 0, THC reached its lowest value of 0.047 g/kW·h at 10 °CA, indicating that moderate post-injection timing enhances oxidation by utilizing residual heat from the main combustion. In contrast, at 30 °CA, THC rose to 0.061 g/kW·h due to poor oxidation of the post-injected fuel, which no longer benefited from high-temperature conditions. At higher AEFs, the timing sensitivity of THC emissions diminished. This is attributed to the inherently low reactivity of NH3, which limits the oxidation of hydrocarbon species even when post-injection improves local mixing. As a result, the ability of delayed injection to reduce THC emissions becomes less effective with increasing ammonia substitution.
As shown in Figure 13d, the influence of post-injection timing on soot emissions under different AEFs. At AEF = 0, soot emissions increased significantly with delayed injection, as late spraying occurred during the expansion stroke when in-cylinder temperature and pressure were low, resulting in poor atomization and incomplete combustion. With ammonia addition, the overall soot emission level decreased. This reduction is primarily attributed to the fact that ammonia contains no carbon and therefore does not contribute to the formation of soot precursors. However, when post-injection timing was further delayed, soot emissions rose again, likely due to the development of fuel-rich, oxygen-deficient regions that limited soot oxidation. These results indicate that while ammonia’s non-carbon composition helps mitigate soot formation, effective control requires appropriate injection timing to maintain favorable conditions for oxidation.
Figure 14 shows the variation in unburned NH3 emissions under different post-injection timings. A general rise-then-fall trend is observed across all AEF conditions, with emission levels increasing significantly as AEF rises. At AEF = 5%, unburned NH3 initially increases before 10 °CA, followed by a steady decline, reaching a minimum of 456.84 ppm at 25 °CA. This indicates that under low ammonia content, early post-injection fails to sustain sufficient thermal conditions for NH3 activation, and the resulting spray may disrupt the flame structure, limiting NH3 participation. As the post-injection timing is delayed, extended heat release prolongs the high-temperature window of the main combustion phase, enhancing NH3 decomposition and reducing unburned emissions. At AEF = 10%, NH3 emissions are consistently higher than at 5%, following a similar rise-then-fall trend, with the maximum and minimum appearing at 10 °CA and 30 °CA, respectively. At AEF = 15%, emissions remain high across all timings, indicating strong dependence on NH3 concentration. A peak occurs at 10 °CA, while a delayed injection at 25 °CA yields the lowest value. This suggests that under high NH3 ratios, the conversion efficiency is limited and exhibits a delayed decay behavior, highly dependent on the thermal continuity established by injection timing.
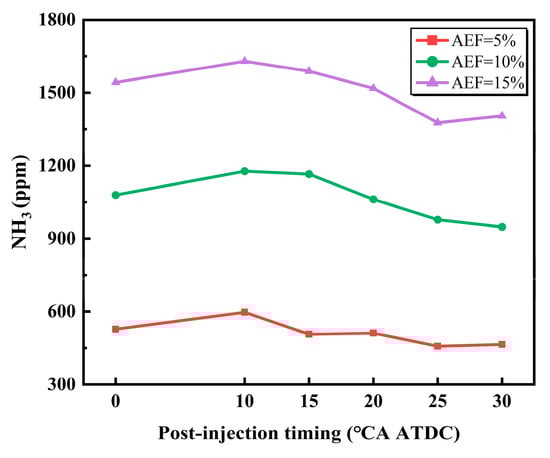
Figure 14.
Variation of unburned NH3 emissions under different post-injection timings.
Figure 15 illustrates the effect of post-injection timing on particle emissions under different AEF conditions. Across all AEFs, the particle size distributions consistently exhibit a distinct bimodal pattern, with nucleation mode peaks appearing around 20–30 nm and accumulation mode peaks between 50 and 80 nm. At earlier post-injection timings (0–15 °CA), both peak intensities remain relatively low, indicating that injected fuel effectively couples with the high-temperature residual gases from the main injection, promoting complete oxidation and reducing particle formation. However, when post-injection is delayed to 20–30 °CA, both nucleation and accumulation mode particle concentrations rise sharply, particularly the latter. At 30 °CA, the highest particle concentrations are observed for all AEFs. This increase is attributed to a decline in in-cylinder temperature during delayed injection, leading to poorer atomization and localized oxygen deficiency. These conditions promote the accumulation and agglomeration of soot precursors (e.g., PAHs and THC), forming larger accumulation mode particles. Simultaneously, delayed pyrolysis and condensation of lighter hydrocarbons during the expansion stroke contribute to a surge in small nucleation mode particles, amplifying the bimodal structure overall. Importantly, post-injection delay also alters the particle size distribution. The peak diameter of accumulation mode particles shifts from 80 nm to 50–60 nm as injection timing is retarded. This indicates that delayed injection enhances early soot nucleation but limits growth and agglomeration due to shorter high-temperature residence time and incomplete mixing, resulting in more fine particles escaping without sufficient growth.
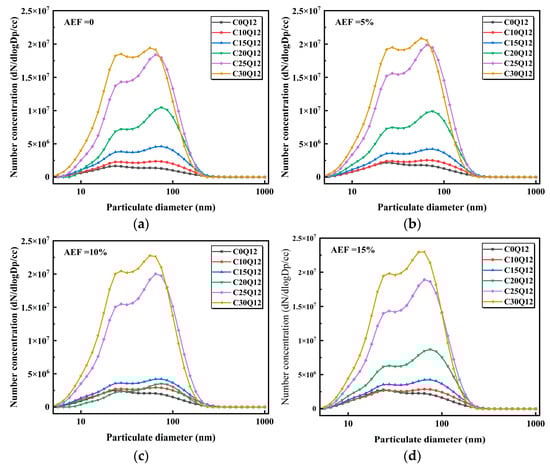
Figure 15.
Variation of particle emissions under different post-injection timings. (a) AEF = 0%, (b) AEF = 5%, (c) AEF = 10%, (d) AEF = 15%.
4. Conclusions
This study investigated the combustion and emission characteristics of a CTL–ammonia dual-fuel engine using a four-cylinder, four-stroke, turbocharged diesel engine with a charging air cooler. The focus was on evaluating the effects of post-injection strategies under different AEFs. Based on experimental data obtained under medium to high load conditions, the key findings are summarized as follows:
- (1)
- With increased post-injection quantities, heat release in the late combustion stage was enhanced, leading to a delayed CA50 and prolonged CD, particularly under medium-to-high AEF conditions. The post-injection strategy effectively promoted NH3 oxidation and facilitated the release of its latent energy.
- (2)
- At moderate post-injection quantities (8–12 mg), an increase in BTE was observed across all AEF conditions, indicating that appropriate post-injection enhances combustion efficiency. However, excessive injection led to reduced BTE due to deteriorated atomization and increased wall wetting, which impaired fuel-air mixing and heat release.
- (3)
- At low AEF conditions, CO emissions initially decreased and then increased with higher post-injection quantities, indicating that moderate post-injection improves combustion completeness, while excessive injection leads to incomplete combustion and elevated CO levels. NOX emissions consistently declined with increasing post-injection, with greater suppression observed at higher AEFs. THC emissions, governed by the low reactivity of ammonia, rose significantly under medium to high AEF conditions, and post-injection had a limited mitigation effect. Soot emissions were highly sensitive to injection quantity, but ammonia blending effectively diluted carbon sources and suppressed nucleation, resulting in notable soot reduction under high AEF conditions.
- (4)
- Unburned NH3 emissions decreased with increasing post-injection quantity, indicating that post-injection extended the ammonia combustion window and improved its utilization. The most significant reduction occurred at AEF = 5%, where 20 mg of post-injection reduced NH3 slip emissions by 26.3% compared to the no post-injection condition.
- (5)
- Regarding particulate emissions, increasing the post-injection fuel quantity intensifies particle number emissions by promoting the formation of accumulation mode particles. Delayed injection timing leads to an increase in nucleation mode particles, resulting in a higher proportion of ultrafine particles and elevated health risks. Moderate ammonia blending (AEF = 10–15%) helps dilute soot precursors and reduce local peak temperatures, thereby reducing particle formation.
Author Contributions
S.T.: Methodology, Investigation, Formal analysis, Writing—original draft; H.H.: Resources, Methodology, Funding acquisition; L.Z.: Formal analysis, Data curation; Y.W.: Formal analysis, Data curation. All authors have read and agreed to the published version of the manuscript.
Funding
This work is supported by the Guangxi Science and Technology Major Program (AA23062012, AA23062090).
Data Availability Statement
The data used in this study are available from the corresponding author upon reasonable request, provided that there are no privacy or ethical restrictions.
Conflicts of Interest
The authors declare no conflicts of interest.
Abbreviations
The following abbreviations are used in this manuscript:
| AEF | Ammonia energy fraction |
| AEFs | Ammonia energy fractions |
| ATDC | After top dead center |
| BTDC | Before top dead center |
| BTE | Brake thermal efficiency |
| CA | Crank angle |
| CA50 | Crank angle at 50% heat release |
| CD | Combustion duration |
| CTL | Coal-to-liquid |
| DCL | Direct coal liquefaction |
| EGR | Exhaust gas recirculation |
| HRR | Heat release rate |
| ICL | Indirect coal liquefaction |
| ID | Ignition delay |
| NOX | Nitrogen oxides |
| PAHs | Polycyclic aromatic hydrocarbons |
| TDC | Top dead center |
| THC | Total hydrocarbons |
References
- Reitz, R.D. Directions in internal combustion engine research. Combust. Flame 2013, 160, 1–8. [Google Scholar] [CrossRef]
- Fayyazbakhsh, A.; Bell, M.L.; Zhu, X.; Mei, X.; Koutný, M.; Hajinajaf, N.; Zhang, Y. Engine emissions with air pollutants and greenhouse gases and their control technologies. J. Clean. Prod. 2022, 376, 134260. [Google Scholar] [CrossRef]
- Odgaard, O.; Delman, J. China’s energy security and its challenges towards 2035. Energy Policy 2014, 71, 107–117. [Google Scholar] [CrossRef]
- Othman, M.F.; Adam, A.; Najafi, G.; Mamat, R. Green fuel as alternative fuel for diesel engine: A review. Renew. Sustain. Energy Rev. 2017, 80, 694–709. [Google Scholar] [CrossRef]
- Qin, S.; Zhang, X.; Wang, M.; Cui, H.; Li, Z.; Yi, W. Comparison of BGL and Lurgi gasification for coal-to-liquid fuels (CTL): Process modeling, simulation and thermodynamic analysis. Energy 2021, 229, 120697. [Google Scholar] [CrossRef]
- Gill, S.S.; Tsolakis, A.; Dearn, K.D.; Rodríguez-Fernández, J. Combustion characteristics and emissions of Fischer–Tropsch diesel fuels in IC engines. Prog. Energy Combust. Sci. 2011, 37, 503–523. [Google Scholar] [CrossRef]
- Höök, M.; Aleklett, K. A review on coal-to-liquid fuels and its coal consumption. Int. J. Energy Res. 2010, 34, 848–864. [Google Scholar] [CrossRef]
- Williams, R.H.; Larson, E.D. A comparison of direct and indirect liquefaction technologies for making fluid fuels from coal. Energy Sustain. Dev. 2003, 7, 103–129. [Google Scholar] [CrossRef]
- Lyu, Z.; Tang, X.; Zhang, H.; Qiao, X.; Jin, Z.; Shi, L. Experimental characterization on injection and spray of coal-derived liquid fuel. Energy 2024, 310, 133238. [Google Scholar] [CrossRef]
- Jin, C.; Mao, B.; Dong, F.; Liu, X.; Yang, Y.; Chen, P.; Zheng, Z. Effects of indirect and direct coal-to-liquid fuel on combustion, performance, and emissions in a six-cylinder heavy-duty diesel engine. J. Energy Eng. 2018, 144, 4018024. [Google Scholar] [CrossRef]
- Zhang, G.; Qiao, X.; Miao, X.; Hong, J.; Zheng, J. Effect of coal-to-liquid fuel on combustion and emission in a heavy-duty diesel engine. Proc. Inst. Mech. Eng. Part D J. Automob. Eng. 2013, 227, 481–489. [Google Scholar] [CrossRef]
- Zhu, J.; Wang, Z.; Li, R.; Liu, S.; Li, M. Experimental and simulation study of methanol/coal-to-liquid (CTL) reactivity and combustion characteristics of diesel engines in RCCI mode. Fuel 2024, 357, 129799. [Google Scholar] [CrossRef]
- Redel-Macías, M.D.; Leiva-Candia, D.E.; Soriano, J.A.; Herreros, J.M.; Cubero-Atienza, A.J.; Pinzi, S. Influence of short carbon-chain alcohol (ethanol and 1-propanol)/diesel fuel blends over diesel engine emissions. Energies 2021, 14, 1309. [Google Scholar] [CrossRef]
- Patiño-Camino, R.; Cova-Bonillo, A.; Villanueva, F.; Ramos, Á.; Domínguez, V.M.; Rodríguez-Fernández, J.; Hernández, J.J. Impact of short-chain alcohols on carbonyl emissions in dual-fuel compression ignition engines. Fuel 2025, 392, 134916. [Google Scholar] [CrossRef]
- Kozak, M.; Merkisz, J. Oxygenated Diesel Fuels and Their Effect on PM Emissions. Appl. Sci. 2022, 12, 7709. [Google Scholar] [CrossRef]
- Zhang, H.; Guo, L.; Yan, Y.; Sun, W.; Li, J.; Wang, Q.; Sun, Y. Experimental investigation on the combustion and emissions characteristics of an n-butanol/CTL dual-fuel engine. Fuel 2020, 274, 117696. [Google Scholar] [CrossRef]
- Zheng, Q.; Huang, H.; Guo, X.; Liu, Q.; Chen, K.; Li, J.; Tian, S. Study on the combustion and emission of coal-to-liquid/dimethyl carbonate blends under different injection strategies. Fuel 2025, 390, 134729. [Google Scholar] [CrossRef]
- Zhang, H.; Sun, W.; Guo, L.; Yan, Y.; Li, J.; Lin, S.; Wang, Q.; Sun, Y. An experimental study of using coal-to-liquid (CTL) and diesel as pilot fuels for gasoline dual-fuel combustion. Fuel 2021, 289, 119962. [Google Scholar] [CrossRef]
- Tornatore, C.; Marchitto, L.; Sabia, P.; De Joannon, M. Ammonia as green fuel in internal combustion engines: State-of-the-art and future perspectives. Front. Mech. Eng. 2022, 8, 944201. [Google Scholar] [CrossRef]
- Jafar, U.; Nuhu, U.; Khan, W.U.; Hossain, M.M. A review on green ammonia as a potential CO2-free fuel. Int. J. Hydrogen Energy 2024, 71, 857–876. [Google Scholar] [CrossRef]
- Qi, Y.; Liu, W.; Liu, S.; Wang, W.; Peng, Y.; Wang, Z. A review on ammonia–hydrogen fueled internal combustion engines. eTransportation 2023, 18, 100288. [Google Scholar] [CrossRef]
- Li, T.; Zhou, X.; Wang, N.; Wang, X.; Chen, R.; Li, S.; Yi, P. A comparison between low- and high-pressure injection dual-fuel modes of diesel-pilot ignition ammonia combustion engines. J. Energy Inst. 2022, 102, 362–373. [Google Scholar] [CrossRef]
- Scharl, V.; Sattelmayer, T. Ignition and combustion characteristics of diesel-piloted ammonia injections. Fuel Commun. 2022, 11, 100068. [Google Scholar] [CrossRef]
- He, X.; Liu, Y.; Zhang, H.; Bi, S.; Xu, K.; Zhao, J. Characteristics of high-pressure liquid ammonia sprays and combustion process in ammonia/diesel HPDI dual-fuel engines. J. Energy Inst. 2025, 120, 102059. [Google Scholar] [CrossRef]
- Bjørgen, K.O.P.; Emberson, D.R.; Lovås, T. Combustion of liquid ammonia and diesel in a compression ignition engine operated in high-pressure dual fuel mode. Fuel 2024, 360, 130269. [Google Scholar] [CrossRef]
- Nadimi, E.; Przybyła, G.; Lewandowski, M.T.; Adamczyk, W. Effects of ammonia on combustion, emissions, and performance of the ammonia/diesel dual-fuel compression ignition engine. J. Energy Inst. 2023, 107, 101158. [Google Scholar] [CrossRef]
- Park, C.; Jang, I.; Kim, M.; Park, G.; Kim, Y. Effect of high compression ratio on thermal efficiency and unburned ammonia emissions of a dual-fuel high-pressure direct injection marine ammonia engine. Appl. Therm. Eng. 2025, 261, 125183. [Google Scholar] [CrossRef]
- Zhou, Y.; Sun, P.; Ji, Q.; Ni, X.; Wang, M. Investigation on combustion and emissions of ammonia–diesel dual-fuel engine in relation to ammonia energy ratio and injection parameters. Int. J. Hydrogen Energy 2025, 100, 713–726. [Google Scholar] [CrossRef]
- Dong, P.; Liu, K.; Zhang, L.; Zhang, Z.; Long, W.; Tian, H. Study on the synergistic control of nitrogenous emissions and greenhouse gas of ammonia/diesel dual direct injection two-stroke engine. Energy 2024, 307, 132657. [Google Scholar] [CrossRef]
- Wen, M.; Cui, Y.; Liu, H.; Ming, Z.; Yao, M. Optical study of combustion stability in dual-fuel approach using ammonia and high reactivity fuel. Energy Convers. Manag. 2024, 319, 118910. [Google Scholar] [CrossRef]
- Huang, L.; Zheng, L.; Zhang, R.; Wang, W.; Pan, J.; Feng, M. Experimental study on combustion and emissions of an ammonia/diesel dual-fuel engine using split-injection strategy. Fuel 2024, 378, 132869. [Google Scholar] [CrossRef]
- Lang, M.; Su, Y.; Wang, Y.; Zhang, Y.; Wang, B.; Chen, S. Experimental study on the effects of pilot injection strategy on combustion and emission characteristics of ammonia/diesel dual-fuel engine under low load. Energy 2024, 303, 131913. [Google Scholar] [CrossRef]
- Mohan, B.; Yang, W.; Chou, S.K. Fuel injection strategies for performance improvement and emissions reduction in compression ignition engines—A review. Renew. Sustain. Energy Rev. 2013, 28, 664–676. [Google Scholar] [CrossRef]
- Wang, Z.; Shen, L.; Lei, J.; Yao, G.; Wang, G. Impact characteristics of post injection on exhaust temperature and hydrocarbon emissions of a diesel engine. Energy Rep. 2022, 8, 4332–4343. [Google Scholar] [CrossRef]
- Yousefi, A.; Guo, H.; Birouk, M.; Liko, B.; Lafrance, S. Effect of post-injection strategy on greenhouse gas emissions of natural gas/diesel dual-fuel engine at high load conditions. Fuel 2021, 290, 120071. [Google Scholar] [CrossRef]
- Zhou, L.; Yang, K.; Ping, Z.; Nie, T.; Biao, X.; Huang, L. Experimental study on the effect of post-injection parameters on performance of extra-high pressure common-rail diesel engine. Energy Rep. 2022, 8, 152–160. [Google Scholar] [CrossRef]
- Lu, Y.; Fan, C.; Chen, Y.; Liu, Y.; Pei, Y. Effect of injection strategy optimization on PCCI combustion and emissions under engine speed extension in a heavy-duty diesel engine. Fuel 2023, 332, 126053. [Google Scholar] [CrossRef]
Disclaimer/Publisher’s Note: The statements, opinions and data contained in all publications are solely those of the individual author(s) and contributor(s) and not of MDPI and/or the editor(s). MDPI and/or the editor(s) disclaim responsibility for any injury to people or property resulting from any ideas, methods, instructions or products referred to in the content. |
© 2025 by the authors. Licensee MDPI, Basel, Switzerland. This article is an open access article distributed under the terms and conditions of the Creative Commons Attribution (CC BY) license (https://creativecommons.org/licenses/by/4.0/).