Article

Hydrological Effects of the Planned Power Project and Protection of the Natura 2000 Areas: A Case Study of the Adamów Power Plant

by
Tomasz Kałuża
1,*,
Ireneusz Laks
2,
Jolanta Kanclerz
3,
Ewelina Janicka-Kubiak
3,
Mateusz Hämmerling
1 and
Stanisław Zaborowski
1
1
Department of Hydraulic and Sanitary Engineering, Poznań University of Life Sciences, Piątkowska 94E, 60-649 Poznań, Poland
2
Department of Construction and Geoengineering, Poznań University of Life Sciences, Piątkowska 94E, 60-649 Poznań, Poland
3
Department of Land Improvement, Environmental Development and Spatial Management, Poznań University of Life Sciences, Piątkowska 94E, 60-649 Poznań, Poland
*
Author to whom correspondence should be addressed.
Energies 2025, 18(12), 3079; https://doi.org/10.3390/en18123079
Submission received: 25 April 2025 / Revised: 2 June 2025 / Accepted: 9 June 2025 / Published: 11 June 2025

Abstract

:
The planned construction of a steam–gas unit at the Adamów Power Plant raises questions about the potential hydrological impact on the neighboring Natura 2000 protected areas, particularly the Middle Warta Valley (PLB300002) and the Jeziorsko Reservoir (PLB100002). These ecosystems play a key role in protecting bird habitats and biodiversity, and any changes in water management can affect their condition. This paper presents a detailed hydrological analysis of the Warta River and Jeziorsko Reservoir for 2018–2022, with a focus on low-flow periods. The Peak Over Threshold (POT) method and Q70% threshold were used to identify the frequency, length, and seasonality of low-flow periods in three water gauge profiles: Uniejów, Koło, and Sławsk. The longest recorded low-flow episode lasted 167 days. The permissible water intake for the investment (up to 0.8 m3∙s–1) is in accordance with the applicable permits and is used mainly for cooling purposes. Calculations indicate that under maximum intake conditions, the water level reduction in the Jeziorsko Reservoir would be between 1.7 and 2.0 mm∙day–1, depending on the current level of filling. Such changes do not disrupt the natural functions of the reservoir under typical conditions, although during prolonged droughts, they can pose a threat to protected areas. An analysis of the impact of periodic water overflow into the Kiełbaska Duża River indicates its negligible effect on water levels in the reservoir and flows in the Warta River. The results underscore the need for the integrated management of water and power resources, considering the increasing variability in hydrological conditions. Ensuring a balance between industrial needs and environmental protection is key to minimizing the potential impact of investments and implementing sustainable development principles.

1. Introduction

The sustainable management of surface water is a main challenge of modern energy policy, especially in the face of climate change, which is leading to more frequent and intense periods of drought [1,2,3,4]. Both global and national reports indicate that droughts result in lower groundwater and reservoir levels [5]. Moreover, droughts hinder replenishing water supplies and can result in long-term socioeconomic problems. In many regions of the world, this can pose serious challenges to designing water resource systems to cope with more frequent periods of limited water availability [6,7]. The Polish government’s Institute of Meteorology and Water Management (IMGW) indicates that low-flow periods in Poland are becoming longer, which may negatively affect the management of water resources and the operation of protected natural areas, such as Natura 2000. The long-term low-flow periods in the Warta River basin in Poland threaten the sustainable management of water resources in the region [8] and affect environmental flows [9]. As indicated by the IMGW reports (2020), the longest low-flow periods in 2018–2022 reached 167 days, which could impede the provision of sufficient water resources for industrial purposes. In this context, balancing the needs of the power industry with the requirements of environmental protection, especially in the Natura 2000 areas, is crucial. Another problem during low flows is the increased temperature of water drawn and discharged from the cooling circuit of the water-powered energy reactor. Research in this area has been conducted by Kuznetsov [10]. He analyzed the water flow rate and temperature using data from the RNPP hydrological post on the Styr River below the water intake for the water-powered energy reactor. The analysis showed a positive correlation between water temperature in the Styr River at the intake and discharge sites. In addition, Kuznetsov observed that there is an increase in water consumption in the RNPP circuit during the summer season.
The use of multi-criteria analysis [11,12] to assess opportunities for the development of the power sector has indicated the importance of the availability of water resources in determining the feasibility of new investments. Changes in the availability of water resources may lead to the need to modify the ways in which power plants are cooled, which in turn may affect their efficiency and environmental emissions [13]. The development of the power sector introduces numerous environmental challenges, especially in the context of dwindling water resources. Thermal power plants, including coal, gas, and nuclear units, are among the largest users of water in the industry, which can significantly impact local aquatic ecosystems [14]. Water intake leads to changes in surface water levels and can negatively affect water-dependent ecosystems, especially during periods of drought. Power plants also pollute river waters with industrial wastewater. In addition, cooling systems can contribute to the thermal pollution of rivers and disrupt the migration of fish and other aquatic organisms.
Other forms of energy, both conventional and renewable, also have a significant impact on the environment. Research [6] has shown that the construction of hydropower plants in the Amazon has led to serious ecological consequences, including deforestation and the loss of natural habitats. Similar challenges have been identified in Southeast Asia, where renewable energy development—especially hydroelectric power and biofuel production—contributes to ecosystem fragmentation and biodiversity loss [13,15]. According to Rüland [16], the construction of coal and hydropower plants in China, Japan, South Korea, and, to a lesser extent, Thailand and Malaysia, has led to a reduction in biodiversity and to significant environmental losses. Although considered one of the greener energy sources, geothermal power plants can also affect local ecosystems, as exemplified in Kenya, where most geothermal power plants are located near key biodiversity areas [17]. Geothermal power plants can also alter vegetation and wildlife habitats, reducing plant diversity and species composition [18]. In contrast, Santangeli [19] indicated that the main focus of future large-scale studies will be the impact of RES (Renewable Energy Sources) implementation on biodiversity. While renewable energy is essential for lowering greenhouse gas outputs, its expansion also poses challenges for maintaining ecological integrity [20,21]. In developing countries such as Brazil and Indonesia, energy development is associated with the intensive exploitation of natural resources, leading to significant losses in biodiversity [22]. Therefore, it is necessary to develop strategies to minimize the negative effects of energy investments on the environment, and especially on areas of natural value. The evidence presented by Santangeli [19] suggests directions for the sustainable development of RES that can contribute to the goals of global climate change mitigation and biodiversity conservation.
In the global context, balancing energy needs with environmental commitments remains an ongoing challenge. A key issue here is the impact of existing and planned energy investments on protected areas, including Natura 2000 sites. Natura 2000 is a system of protected areas established by the European Union, covering nearly 18% of its territory. The network is governed by strict legal frameworks enforced by the European Commission. Due to its scale and conservation status, potential overlaps with energy development projects are difficult to avoid [23]. Owing to its potential environmental impacts, the planned investment in the construction of a steam–gas unit at the Adamów Power Plant raises a number of questions about the impact of industrial activities on protected areas, including those included in the Natura 2000 network. The key areas of potential impact that require special attention include the Middle Warta Valley (PLB300002) and the Jeziorsko Reservoir (PLB100002), whose ecosystems are vulnerable due to potential water deficits. These areas play a key role in maintaining biodiversity, providing a habitat for numerous species of birds and other aquatic organisms [24]. As an important retention reservoir in Poland, Jeziorsko plays a crucial role in preserving biodiversity, and changes in its level can affect the wetland bird habitat. The reservoir also contributes to regulating the flows of the Warta River and supporting the power sector, by providing water to cool power plant units in the Pątnów–Adamów–Konin region. For this reason, water management at the reservoir and any changes in water levels or flows in the Warta River can have far-reaching effects on the protection of valuable natural habitats. As a result, in the context of the planned investment at the Adamów Power Plant, a detailed hydrological analysis that considers the potential impact of the investment in both the short and long term was necessary.
The purpose of this study is to analyze the potential hydrological effects of the planned investment at the Adamów Power Plant and to assess to what extent its operation may affect the balance between industrial needs and environmental protection. This article focuses on issues related to water management, the ecological consequences of water intake, and the possibility of introducing solutions to minimize the impact of energy on protected ecosystems. This analysis provides a basis for further research and recommendations for future investments in the power sector in Poland and Europe.

2. Research Methodology and Materials

2.1. Research Object

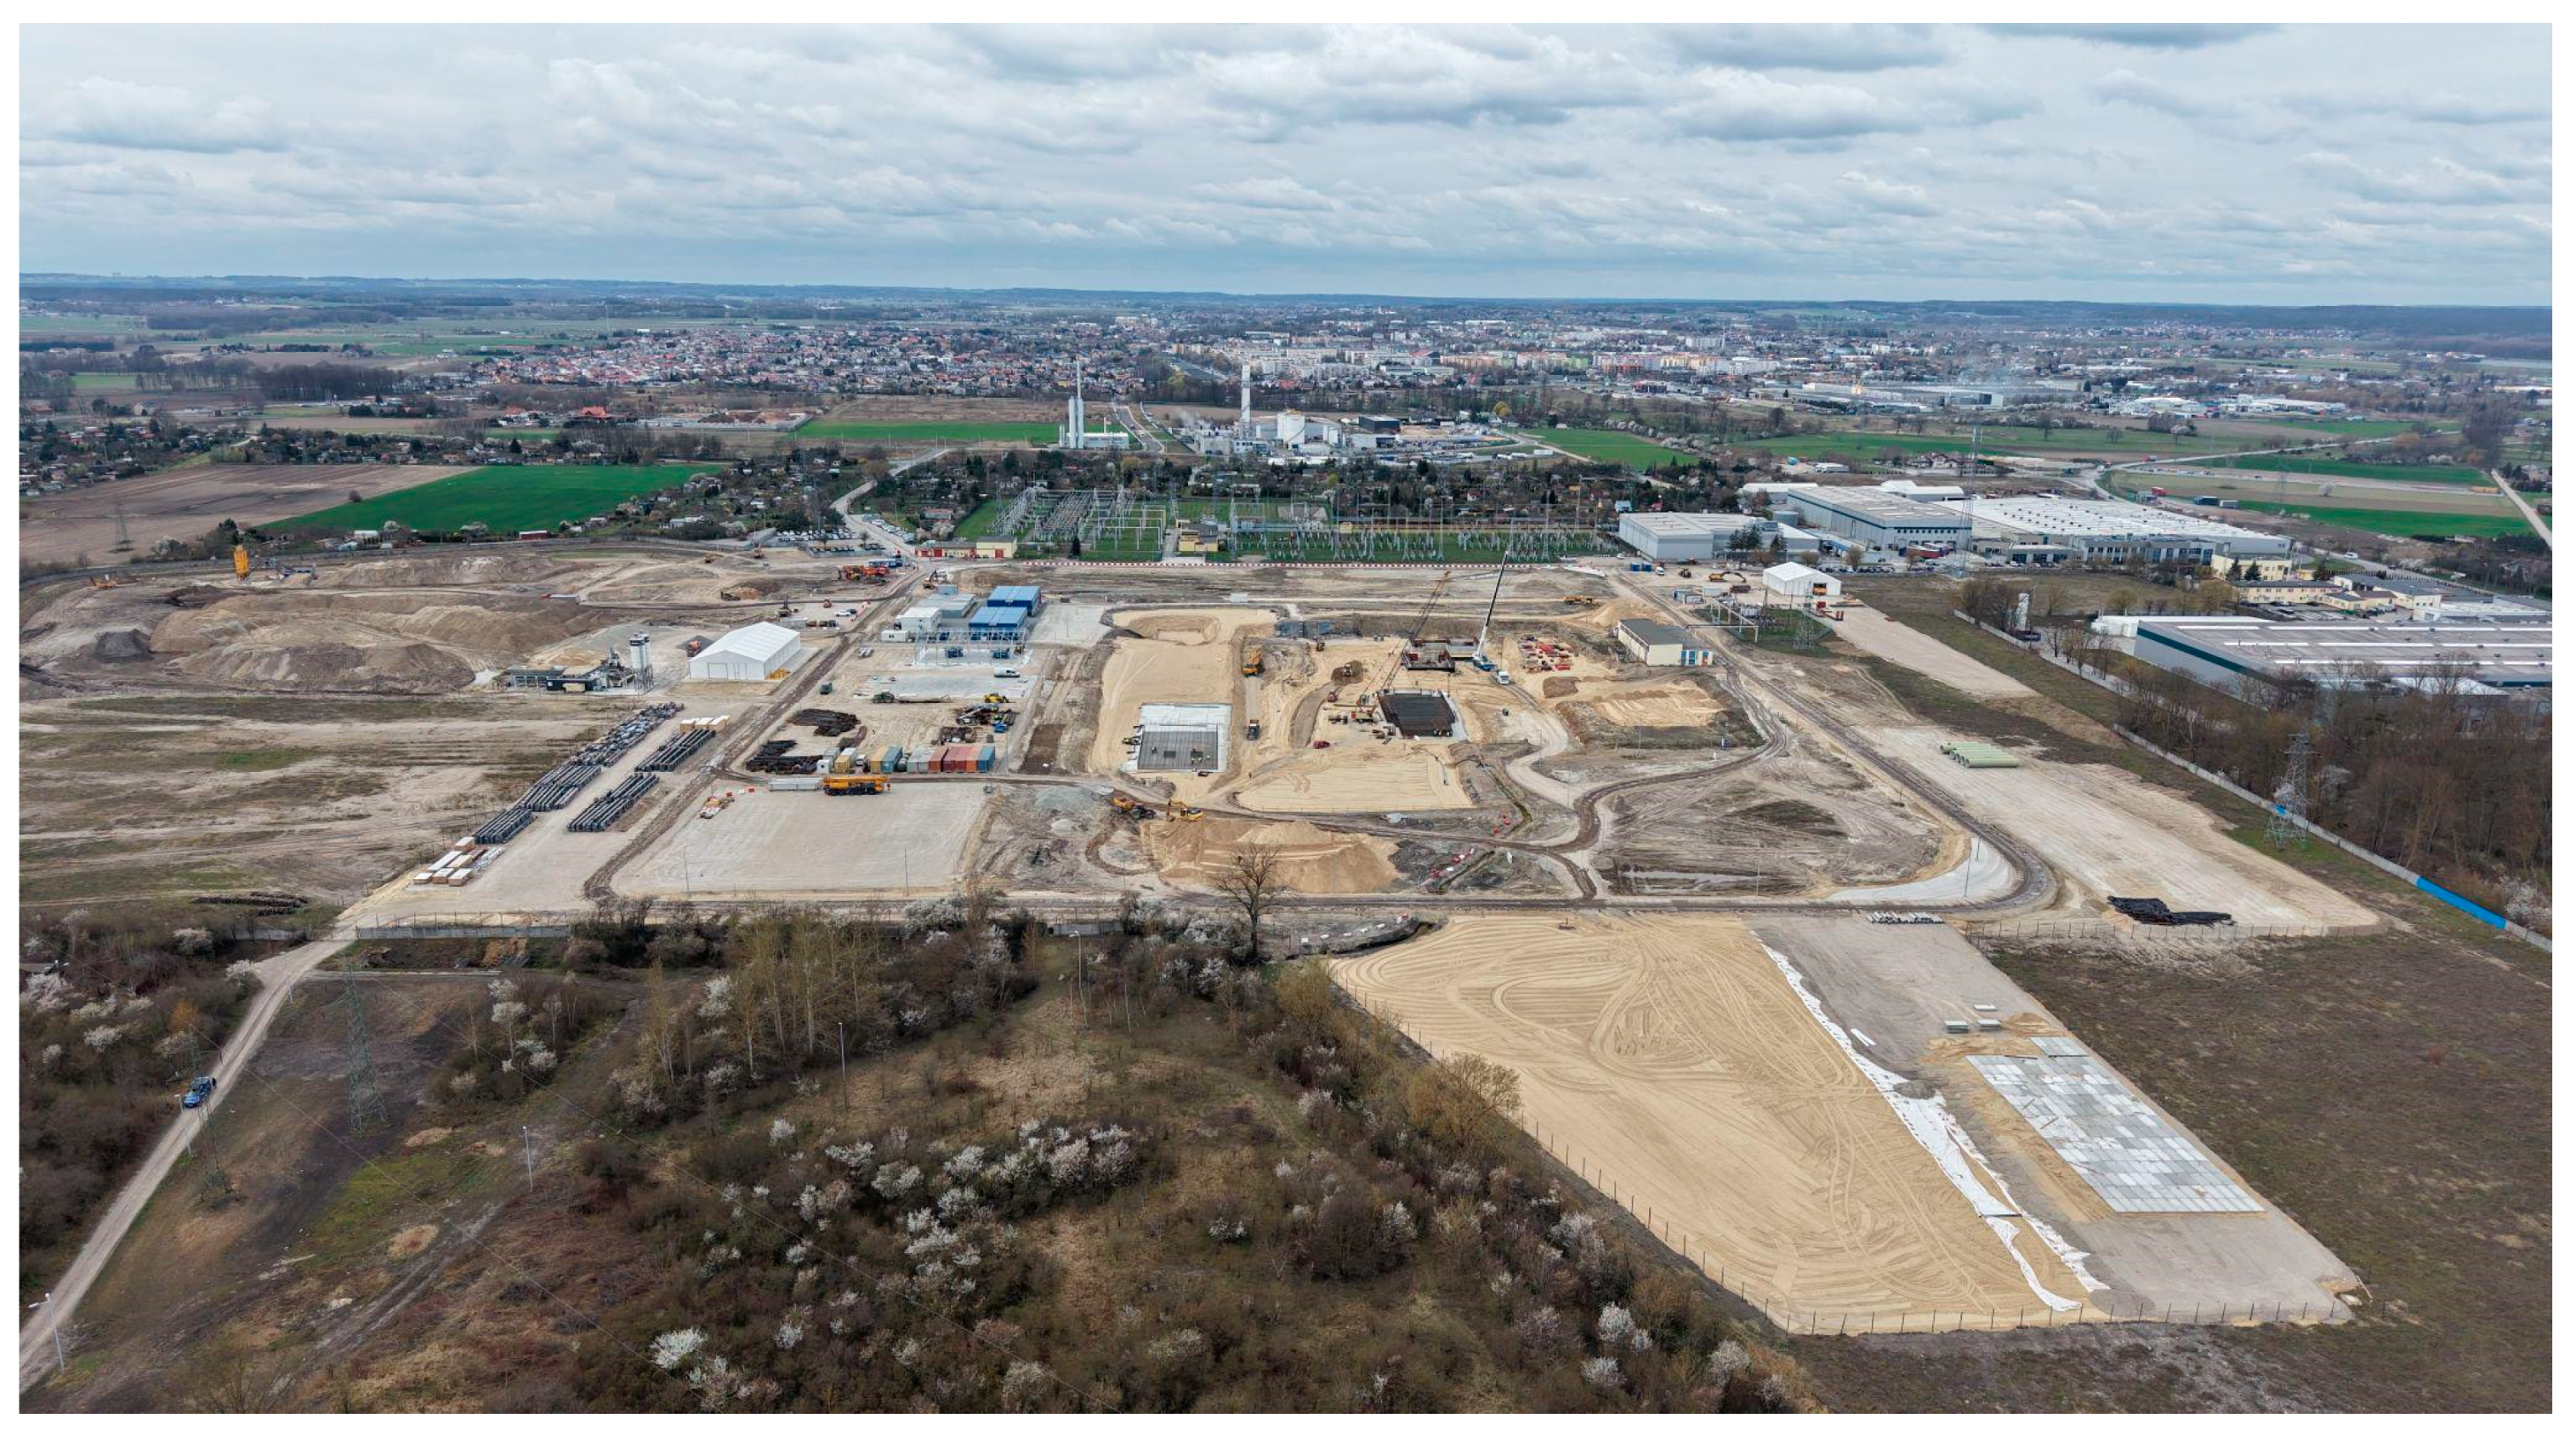
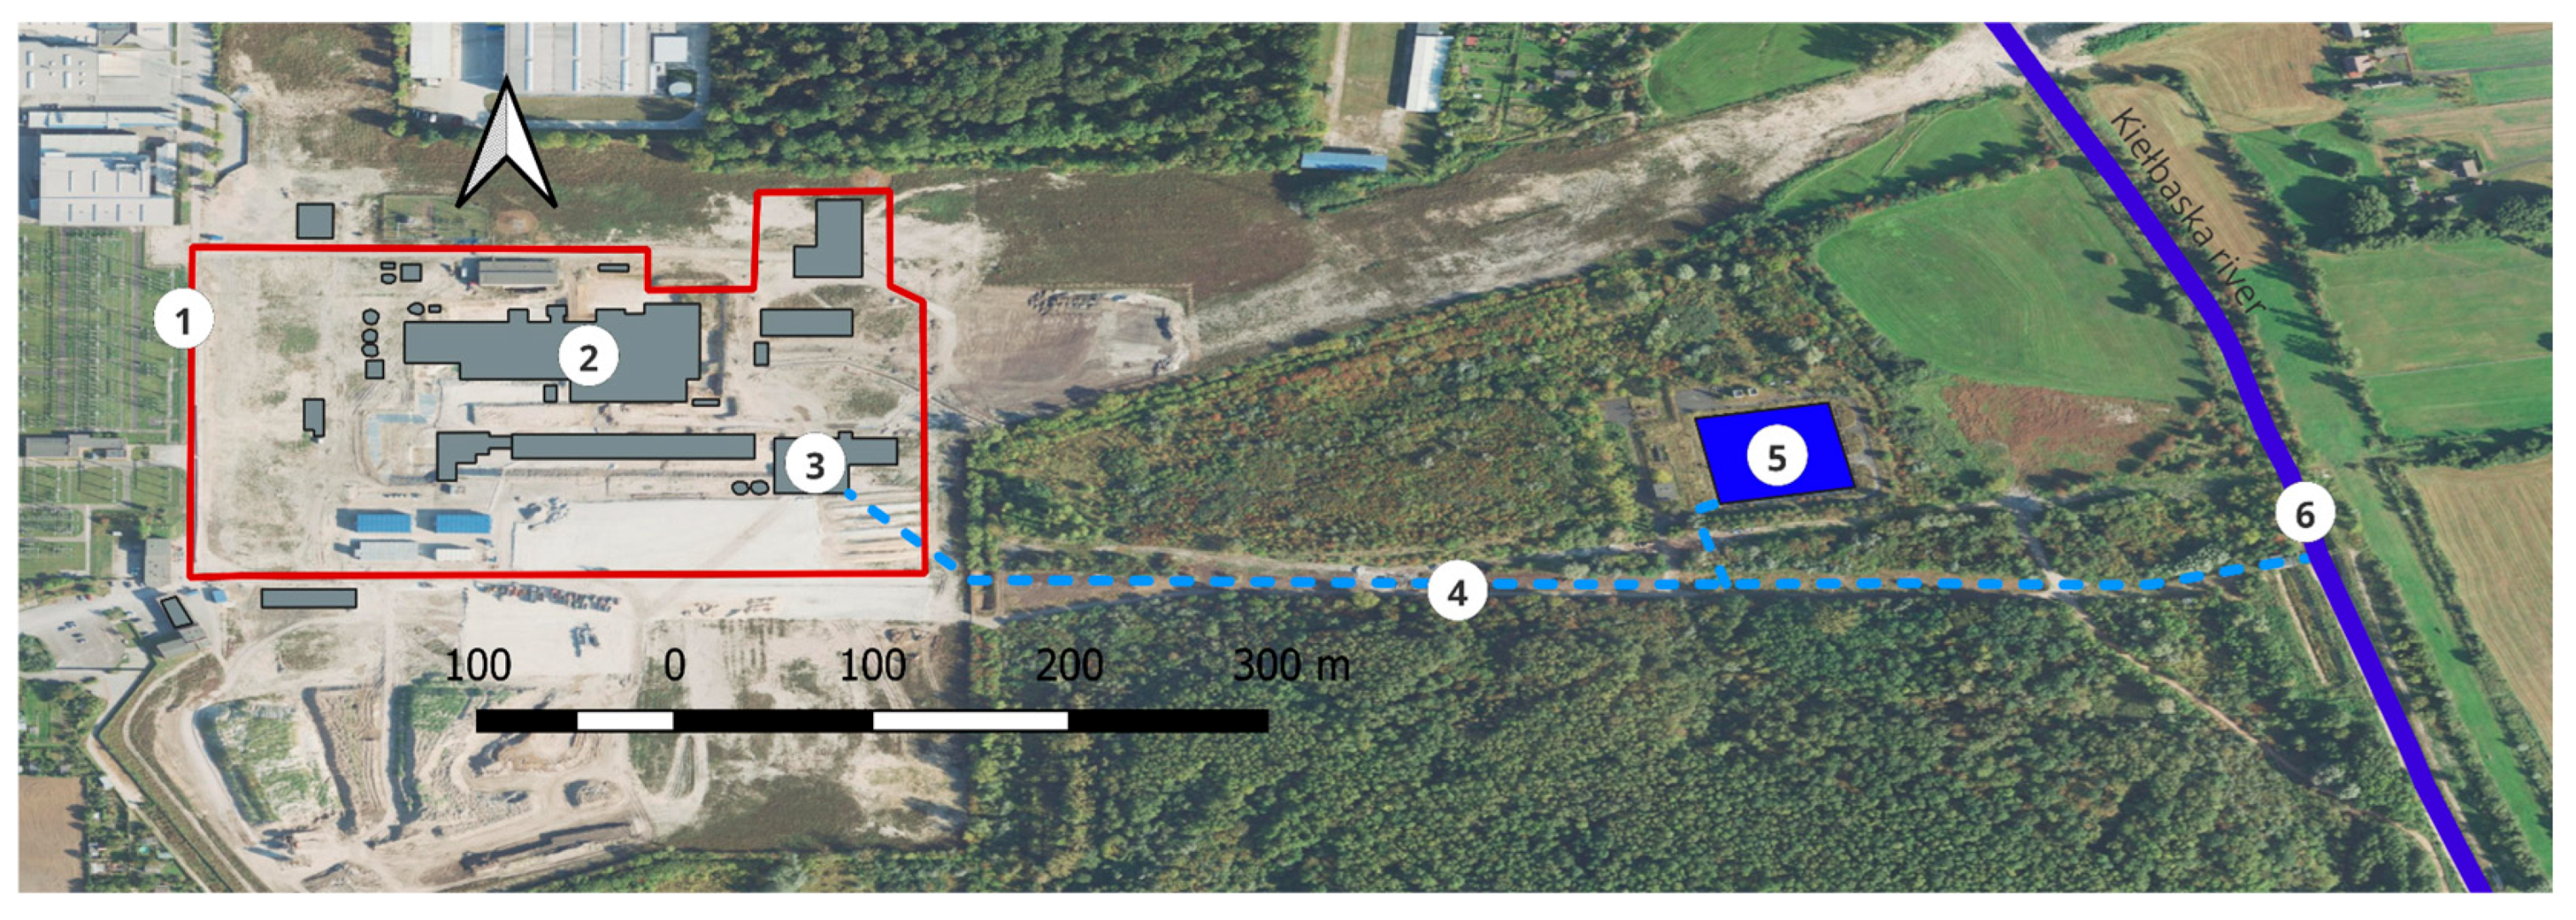
2.1.1. Investment Description—Adamów Power Plant

A decision was made in 1960–1967 to construct the Adamów Power Plant in the municipality of Turek, on the left bank of the Kiełbaska Duża River. Its total capacity was 600 MW, and it consisted of 5 turbine sets, 120 MW each. The source of primary energy was lignite from nearby lignite open pits. As part of its activity, the power plant supplied the city of Turek and nearby factories with heat and supplied the “Miranda” Silk Industry Plant in Turek with process steam. The Adamów Power Plant was part of a group of four power plants of the Pątnów–Adamów–Konin Power Plant Complex (ZE PAK S.A.). Because the necessary upgrades in 2010 were not profitable, the decision was made to close the plant. An additional factor was the depletion of coal deposits at the Adamów Mine [25], which ruled out the possible modernization of the power plant. Electricity production ended when the last unit was shut down in 2018. The preparatory work then began, followed by demolition. The last component of the power plant was demolished on 9 September 2022. The area was cleared and prepared for future development [26].
The location chosen for the new 600 MWe gas and steam unit (BGP) is the site of the decommissioned and dismantled Adamów coal-fired power plant, owned by ZE PAK S.A. (Figure 1). The gas and steam units will be located in the central part of the closed power plant [27]. Due to the location and recent industrial use of the site, the planned development will impose a relatively low burden on the environment. The existing infrastructure will have a large impact on reducing costs, including water intake from the Kiełbaska Duża River, an industrial wastewater discharge site, or an extensive infrastructure for electricity offtake. This will reduce the necessary work and cost and the time required to start up the power plant. Taking into account the absence of equipment associated with coal blocks, such as coal storage, coal unloading siding, or electrofilters, and the decidedly smaller dimensions of the recovery boiler, the planned investment will be spread over a significantly limited area. This will allow the facility to be expanded on a parcel of land of the same area, relative to the area for a coal-fired power plant, without having to convert land adjacent to the planned development.
In addition to the necessary elements of the gas turbine with a recovery boiler and a condensing tank-cooled steam turbine for electricity generation, we can highlight the following components: a natural gas preparation, preheating, and compression station and a wet fan cooler. To ensure reliable operation of the power plant, a water source and a water treatment plant with a water demineralization station are included. The water source and its own demineralization station will ensure adequate necessary water parameters for process purposes. The location of the plant, along with storage, will be in the water treatment plant building (Figure 2, No. 3). Water will be drawn from the Kiełbaska Duża River and brought to the plant via a through pipeline. Equalization tanks located at the pipeline will provide access to the necessary raw material during times of increased demand or water shortages (Figure 2 and Figure 3, No. 4–6).
The overall efficiency of the planned unit exceeds 85%, compared to 45–47% for a coal-fired unit. This is made possible by the technical solutions applied, which, in order to produce electricity (61%), allow for the recovery and reuse of heat (24%) during the cooling stage [28]. The fuel mixture used in the power plant under development will consist of natural gas and a high oxygen content thanks to compressors and will be fed into the combustion chamber. The resulting exhaust gas generated in the first stage during expansion drives the gas turbine. In this process, the thermal energy is converted successively into mechanical energy and electrical energy. In the recovery boiler, the rest of the unused thermal energy is used to generate superheated steam that feeds the steam turbine to produce electricity.

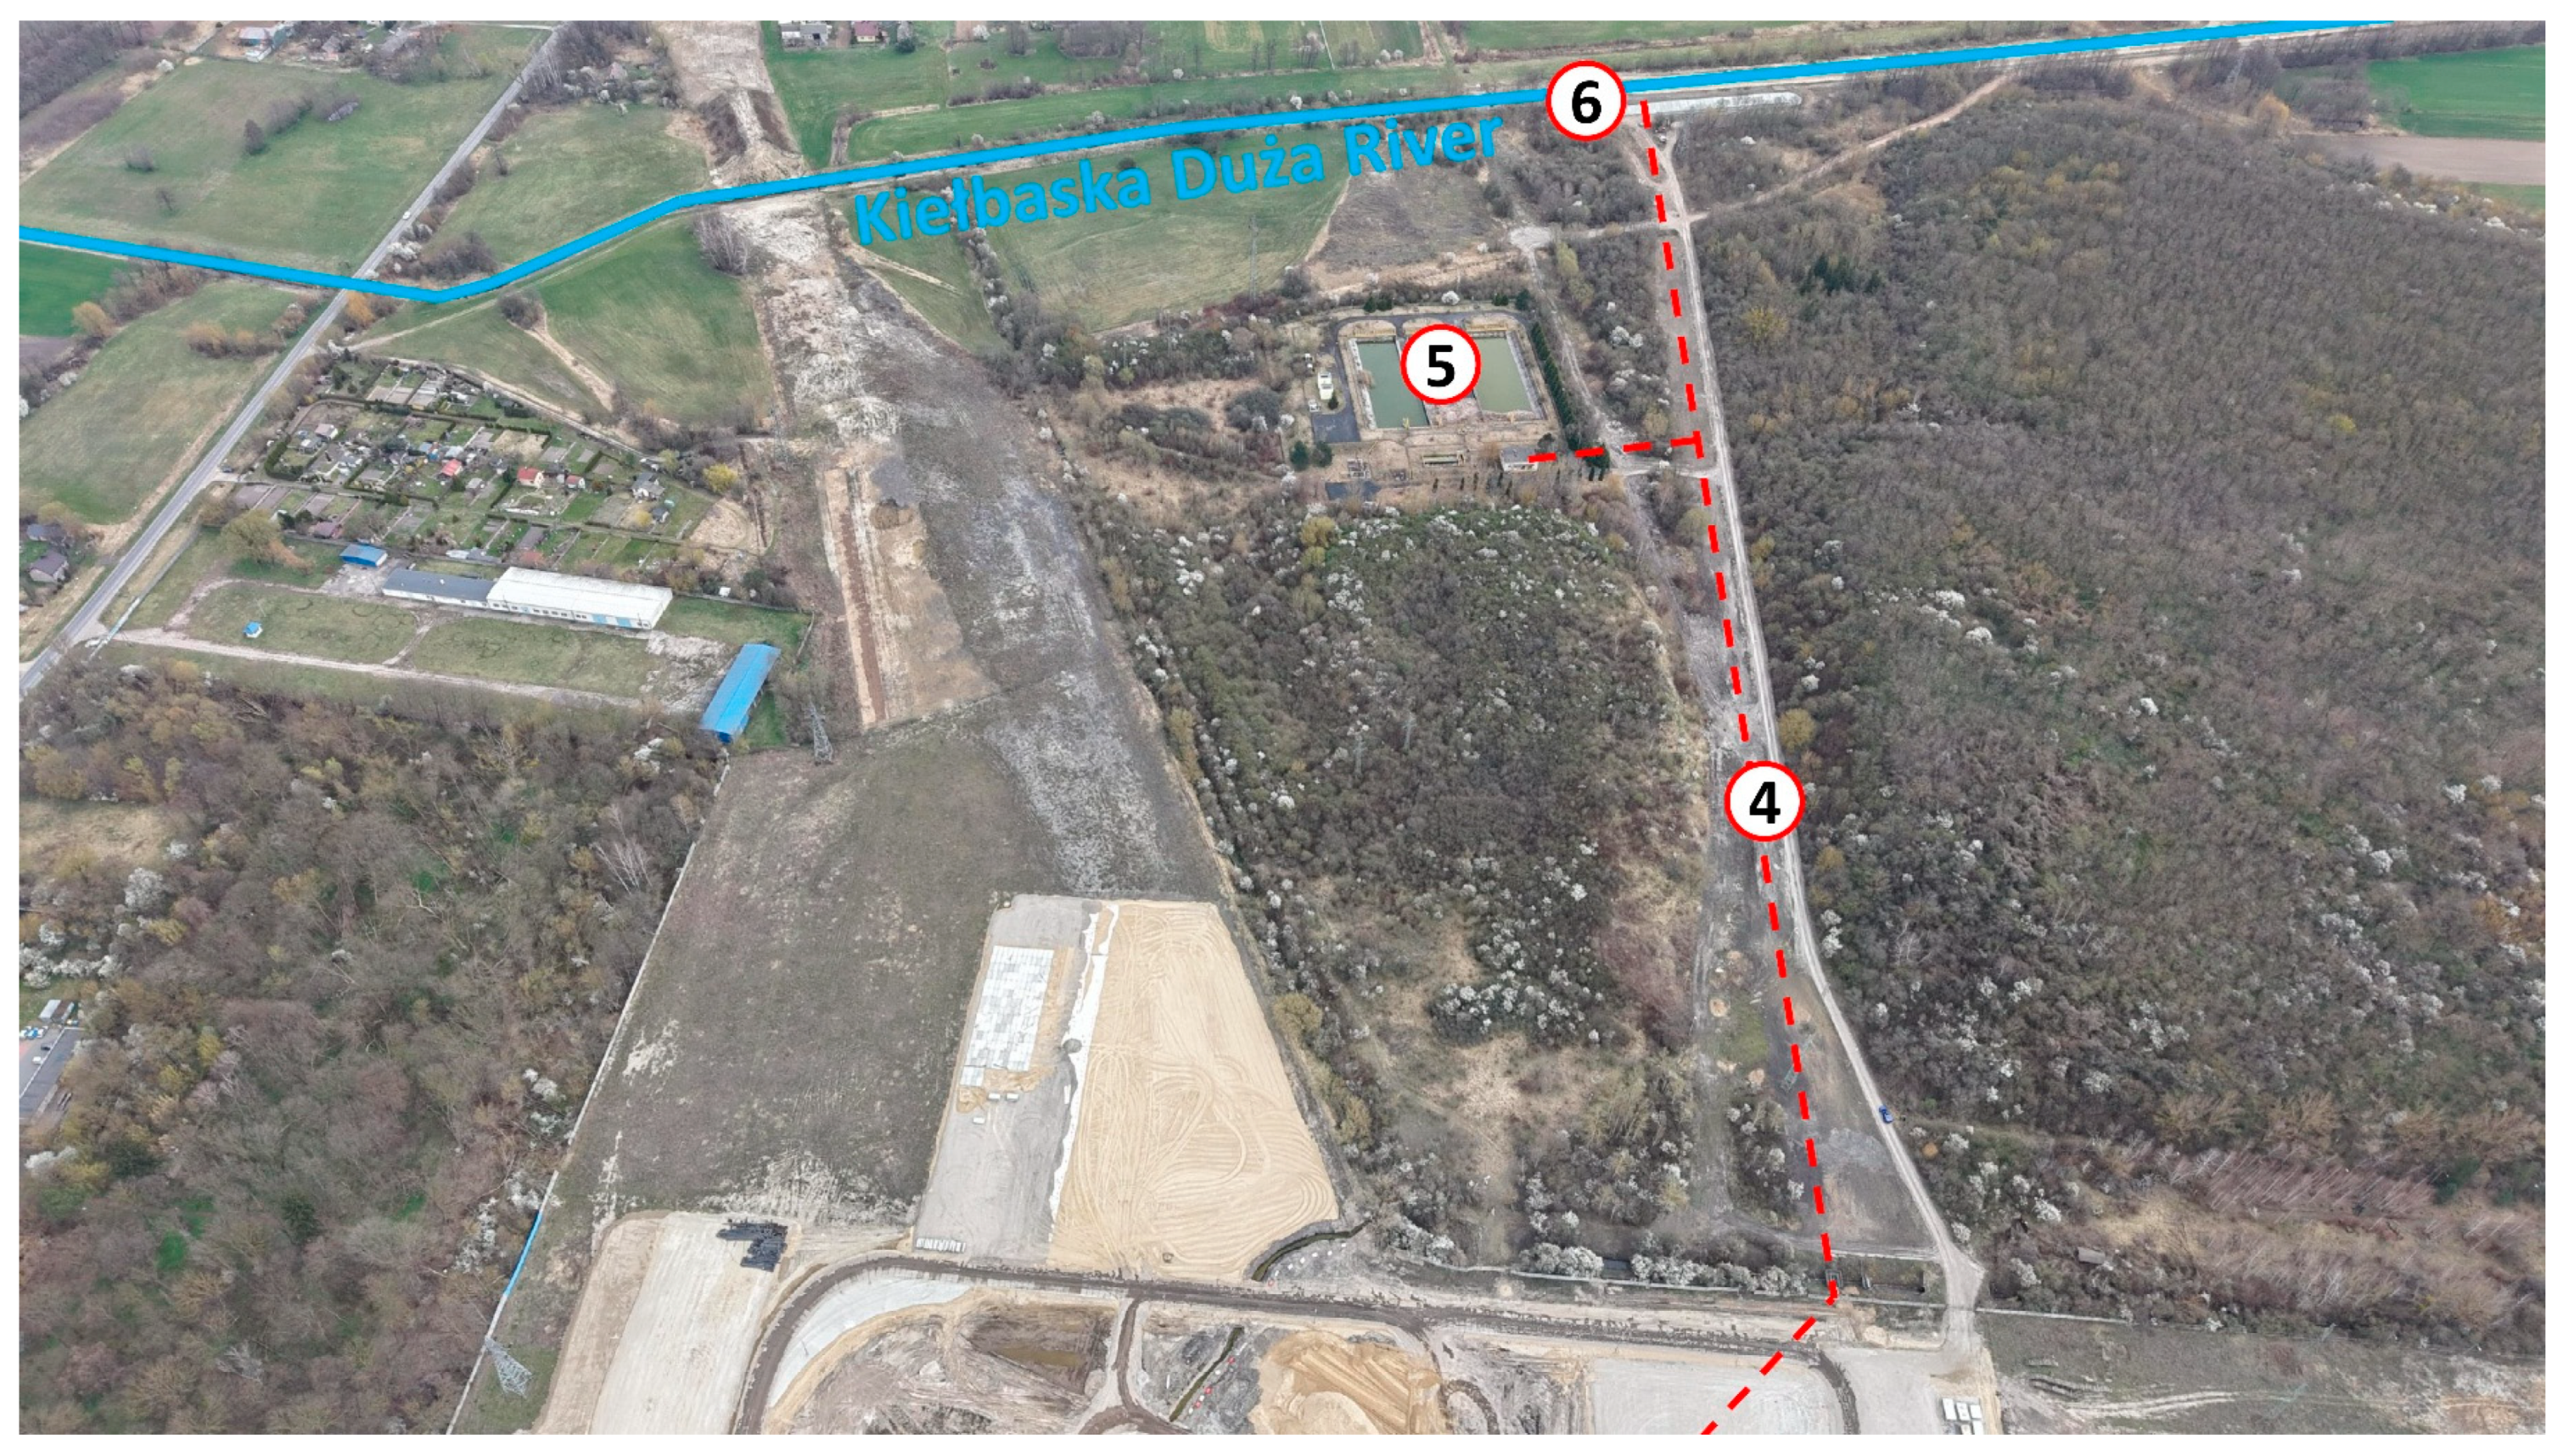
2.1.2. Hydrological Characteristics of the Kiełbaska Duża River Catchment

The Kiełbaska Duża River (code PL18334) is a 45 km long left-bank tributary of the Warta River—the third largest river in Poland (Figure 4). Its catchment area covers 324 km2 and is situated in central Poland, in the eastern part of the Wielkopolskie province. Both the source and the mouth of the river are located at coordinates 51°56′19″ N 18°25′27″ E. Hydrological monitoring of the river is conducted at the “Kościelec” station, located 6.95 km along its course, and operated by the Institute of Meteorology and Water Management–National Research Institute (IMGW-PIB). Additionally, near the boundary of the catchment lies the “Dobra” weather station, which supports meteorological observations relevant to the area.

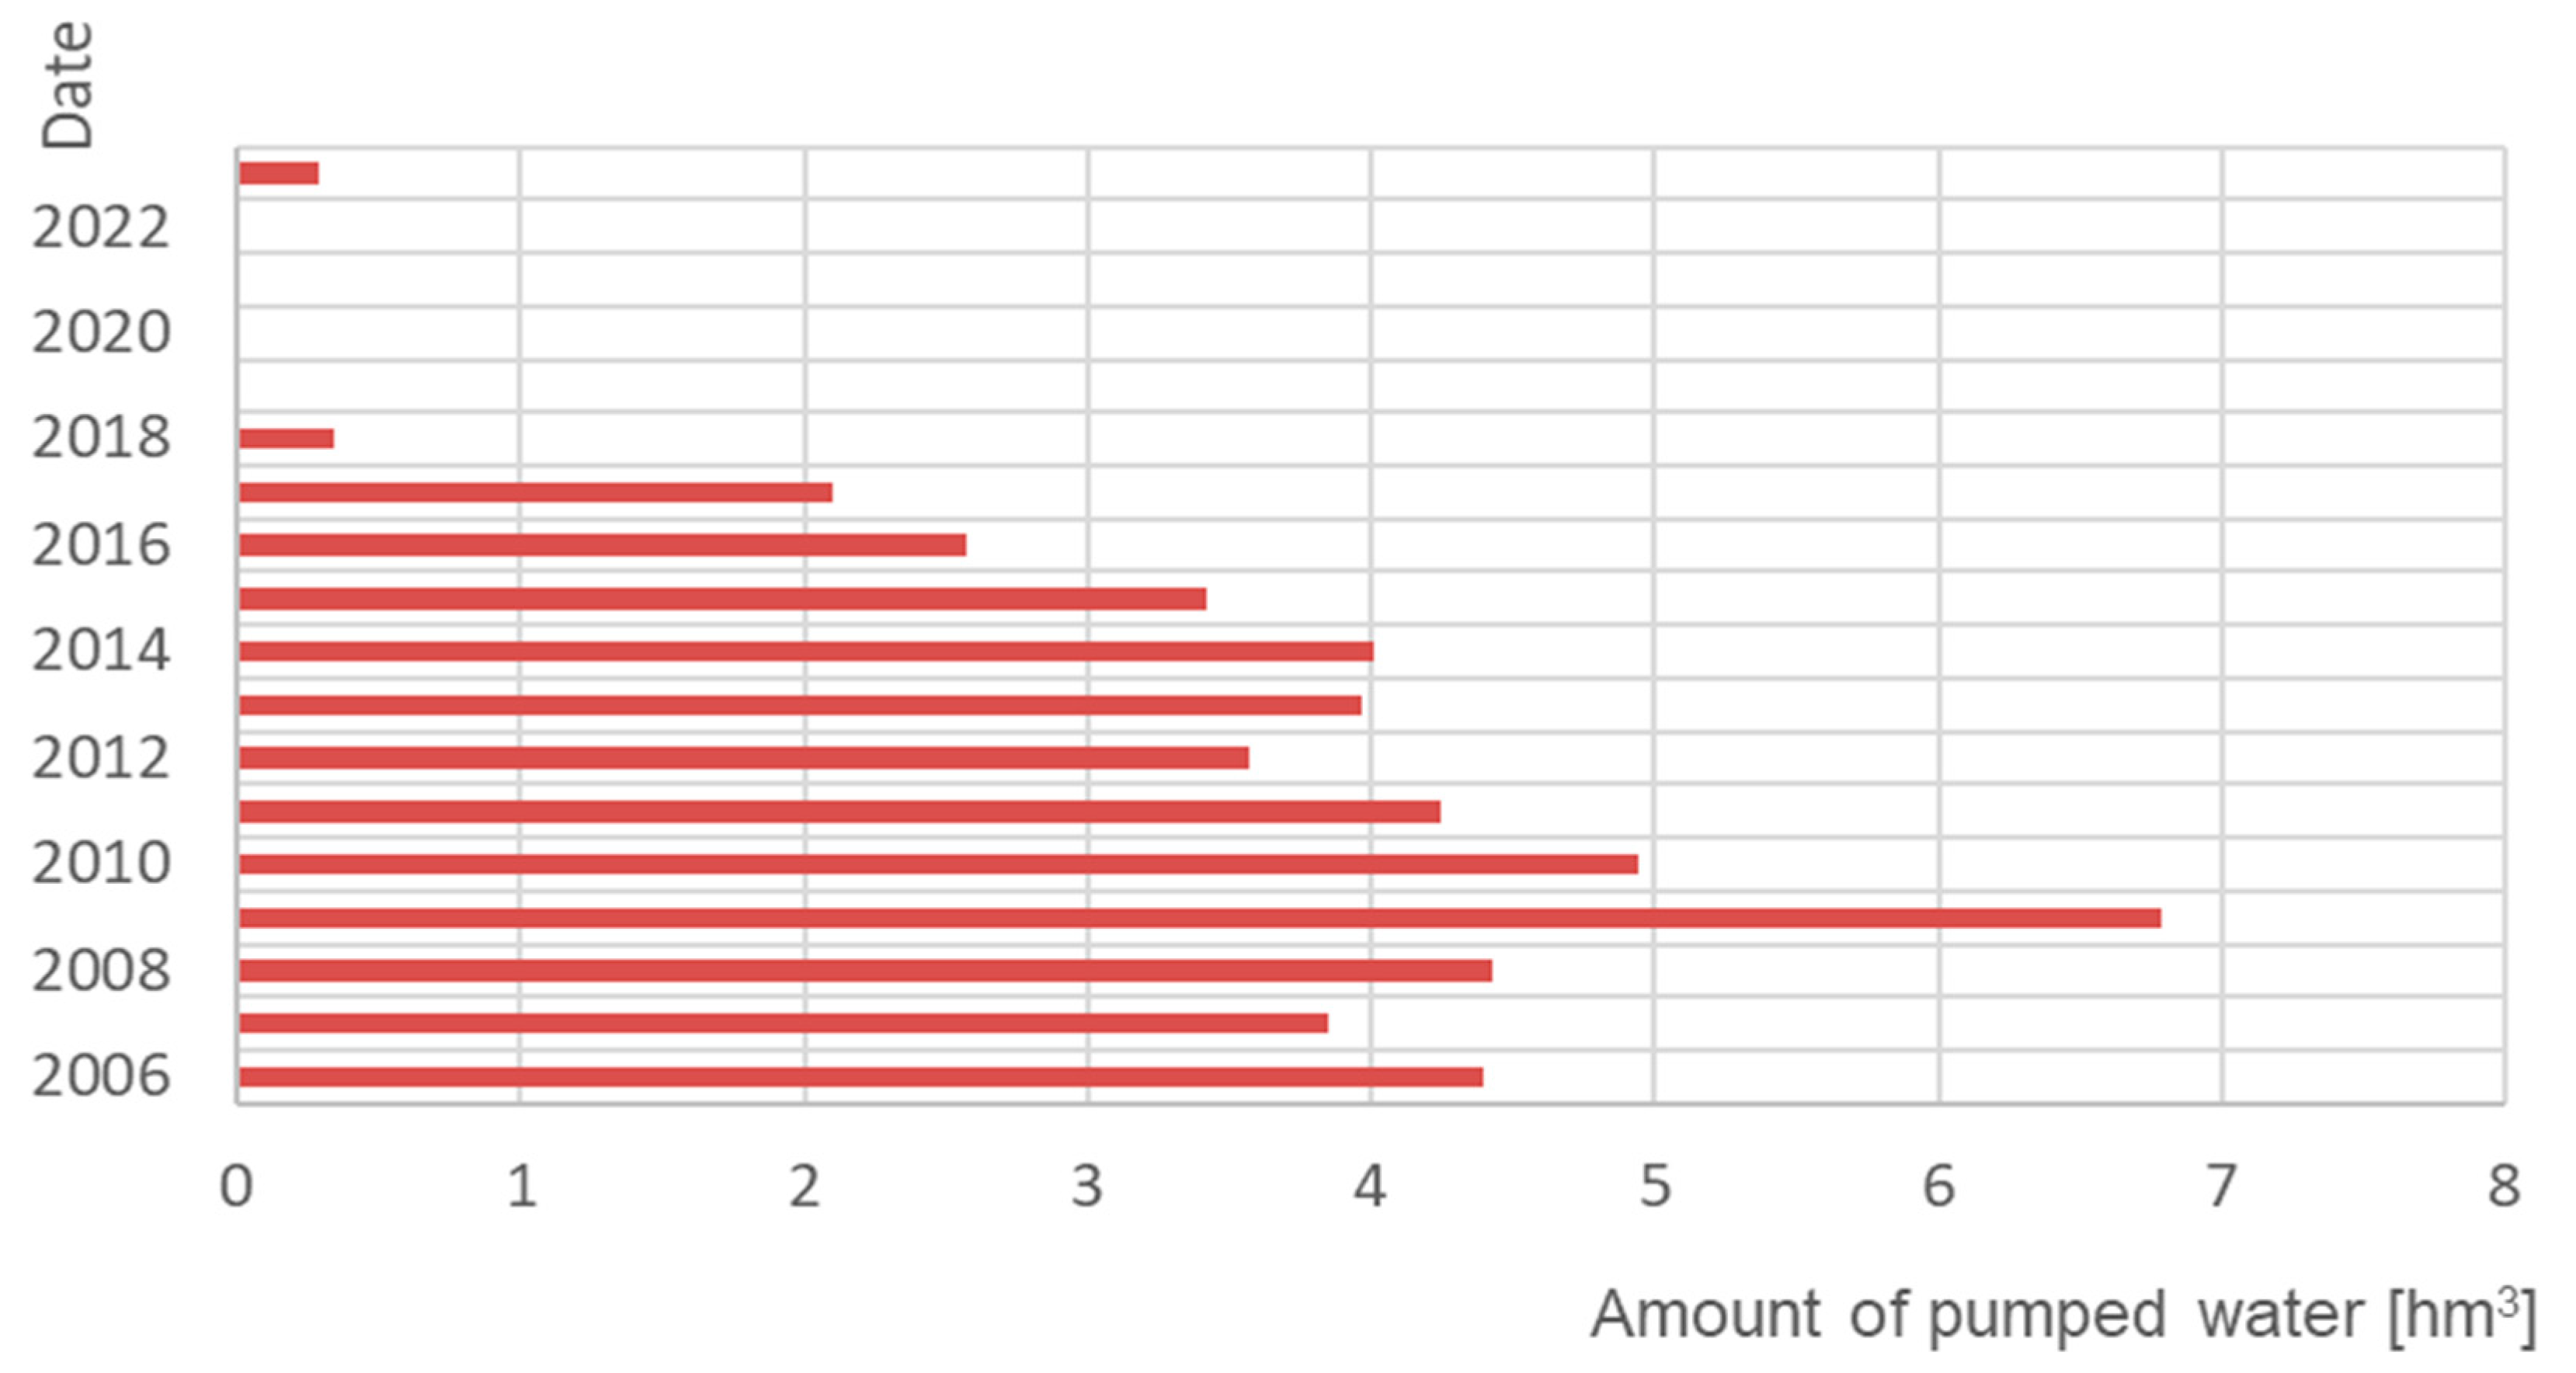
2.1.3. Water Transfer to the Catchment Area of the Kiełbaska Duża River

As described above, the source of raw water for the proper operation of the gas and steam unit will be the Kiełbaska Duża River. Using an upgraded pumping station on the river, the plant will be supplied with raw water, which will then be distributed by newly constructed systems to the respective gas and steam unit facilities/installations. In accordance with the water permit issued and with the help of the Miłkowice II pumping station located in Ostrów Warcki (Figure 5), replenishment of low levels of water flow in the Kiełbaska Duża and Teleszyna Rivers will continue to be carried out. The pumped water used for feeding these rivers will come from the Warta River flowing through the Jeziorsko Reservoir. The aforementioned water permit was issued by the Marshal of the Łódzkie Province in 2011 to ZE PAK S.A. for the specific use of transferring water from the Warta River at a rate from 0.4 m3∙s–1 to a maximum of 0.8 m3∙s–1 through the Jeziorsko Reservoir to the Kiełbaska Duża River and damming the waters of the Teleszyna River in the Żeronice Reservoir.
It is worth adding that the volume of water demand for the PAK Power Plant is 0.347 m3∙s–1; the surplus will be directed to accelerate the process of flooding the final pits after the Adamów open pit: the Adamów Intermediate and Adamów Final reservoirs, which will affect the restoration of local water resources. To a small degree, the intake of water from Jeziorsko at a maximum of 0.8 m3∙s–1 affects the water capacity of the Jeziorsko Reservoir during the summer.

2.2. Protected Areas

Along the studied section of the Warta River, nature protection measures have been implemented in accordance with the Nature Protection Act of 16 April 2004 (Journal of Laws 2024, item 1478, as amended) [29] and the Regulation of the Minister of the Environment of 12 January 2011 on Special Bird Protection Areas (Journal of Laws of 2011, No. 25, item 133) [30] (Figure 4).
The Middle Warta Valley Special Protection Area for birds (Natura 2000 site, code PLB300002) covers 571.04 km2 and stretches along the Warta River from 473 + 300 km—just above the confluence with the Brodnia River—to 322 + 770 km, located 9.2 km downstream from the Lutynia River mouth (which joins the Warta at 331 + 970 km). The area lies 9.5 km from the Jeziorsko Reservoir, itself protected under the Natura 2000 network as the Jeziorsko Reservoir Special Protection Area (code PLB100002). In addition, the catchment of the Kiełbaska Duża River is surrounded by several Natura 2000 Special Areas of Conservation, including Ostoja Nadwarciańska (PLH300009), Pradolina Bzury-Neru (PLH100006), Puszcza Pyzdry (PLH300060), and Lipickie Mokradła (PLH100025).
The Warta River Valley displays a diverse landscape shaped by both natural processes and human intervention. In the Kolska Basin section, the river is confined by embankments on both sides. Within this regulated stretch, the floodplains—comprising meadows, pastures, and patches of riparian vegetation such as Salicetum triandro-viminalis—occupy the inter-embankment zone and areas near the mouths of the Prosna and Kiełbaska Duża Rivers. Further downstream, in the Konin–Pyzdrska Valley, the river valley remains in a more natural state. The western section, which has not been embanked, experiences regular seasonal flooding. This has allowed for the development of a varied and ecologically valuable landscape, consisting of extensively managed meadows, pastures, riparian woodlands, and oxbow lakes bordered by reedbeds. Particularly notable is the area west of the Prosna River confluence, which includes a large complex of floodplain forests, with remnants of natural ash–elm riparian forests and lowland hornbeam woodlands, many of which are protected under nature reserve status.
The creation of the Jeziorsko Dam and Reservoir significantly altered the Warta River’s natural water regime, leading to various ecological changes in the surrounding habitats. The Jeziorsko Reservoir (PLB100002) is part of Poland’s National Ecological Network ECONET and represents a key conservation zone. In the southern part of the area is the Jeziorsko ornithological reserve. In the Jeziorsko PLB100002 area, the conservation functions focus on the protection of the animal species that are important for Europe. Twenty-six species of birds are thus protected.

2.3. Hydrological Analyses

2.3.1. Calculation of Low-Flow Periods

The hydrological characteristics of the Warta River at the Uniejów, Koło, and Sławsk gauging stations were analyzed using daily mean, minimum, maximum, and annual average flow data for the hydrological years 2018–2022, obtained from the Institute of Meteorology and Water Management (IMGW-PIB). To identify low-flow events at the selected profiles, the Peak Over Threshold (POT) method was applied using daily discharge data. The analysis was conducted in the R programming environment, employing the hydroTSM, remotes, and dplyr packages [31,32]. An analysis of the dynamics of low-flow periods was made in comparison with the multi-year perspective, thus obtaining a comprehensive picture of the variability in water resources. The 70th percentile, the most commonly used cutoff threshold for determining periods of ordinary drought, was used as a cutoff value for the occurrence of low-flow periods [33]. The Q70% threshold was individually calculated for each gauging profile based on flow duration curves derived from daily observations. To ensure significance, only flow deficits lasting at least 7 consecutive days were classified as low-flow periods. To further refine the understanding of low-flow dynamics, a seasonal classification of drought events was performed using the same Q70% threshold. This allowed for the identification of intra-annual variations in drought occurrence. Comparative methodological insights were drawn from Bezak et al. [34], who evaluated the low-flow characteristics in the Sava River (Slovenia) using both the POT and Annual Maximum (AM) approaches. Their findings indicated the superior performance of the POT method for capturing short-term low-flow dynamics. A similar POT-based approach was also adopted by Rivera [35] in their drought-related hydrological research.
As part of the hydrological analyses, the daily water demand was calculated based on the maximum water intake (Formula (1)), as well as the water table drawdown rate ∆H, which can be calculated for any ordinate at the reservoir in accordance with Formula (2).
V d = Q · t   [ m 3 · day 1 ]
H = V d V   mm · day 1

2.3.2. Hydrodynamic Modeling Using the SPRuNeR System

SPRuNeR is a one-dimensional system for analyzing and forecasting transient traffic in a river network. The system was developed within the framework of a research project at the University of Life Sciences in Poznań. The system is suitable for modeling flow transformations in long and complex sections of lowland rivers, with tributaries and a variety of hydraulic structures, as well as short sections of ditches and canals [36]. The flow transformation for sections without hydraulic engineering is described by the Saint-Venant equations. A finite–difference method using a stable implicit four-point Preissmann scheme was used for solving them. The system allows assigning different transformation equations for each computational section with development (sections with separation, with tributary, with embankment overflow, with bridge, etc.), which facilitates its expansion and adaptation to the requirements of the modeled part of the river network [36]. The system has been extended to model the operation of a complex system of polders with embankment overflows, barrages, and wide flood valleys (implementation of an active flow zone) [37].
A verified and validated numerical flow model provides a reliable tool for hydraulic analyses of river sections, including hypothetical scenarios mapping extreme situations for both flood flows and long-term low-flow periods. A transient flow modeling system based on Saint-Venant’s equations allows for obtaining state and flow distributions along the length of the river for each time step. Hydrographs of the levels and flows in each computational section are obtained, forming a numerical model.

3. Results

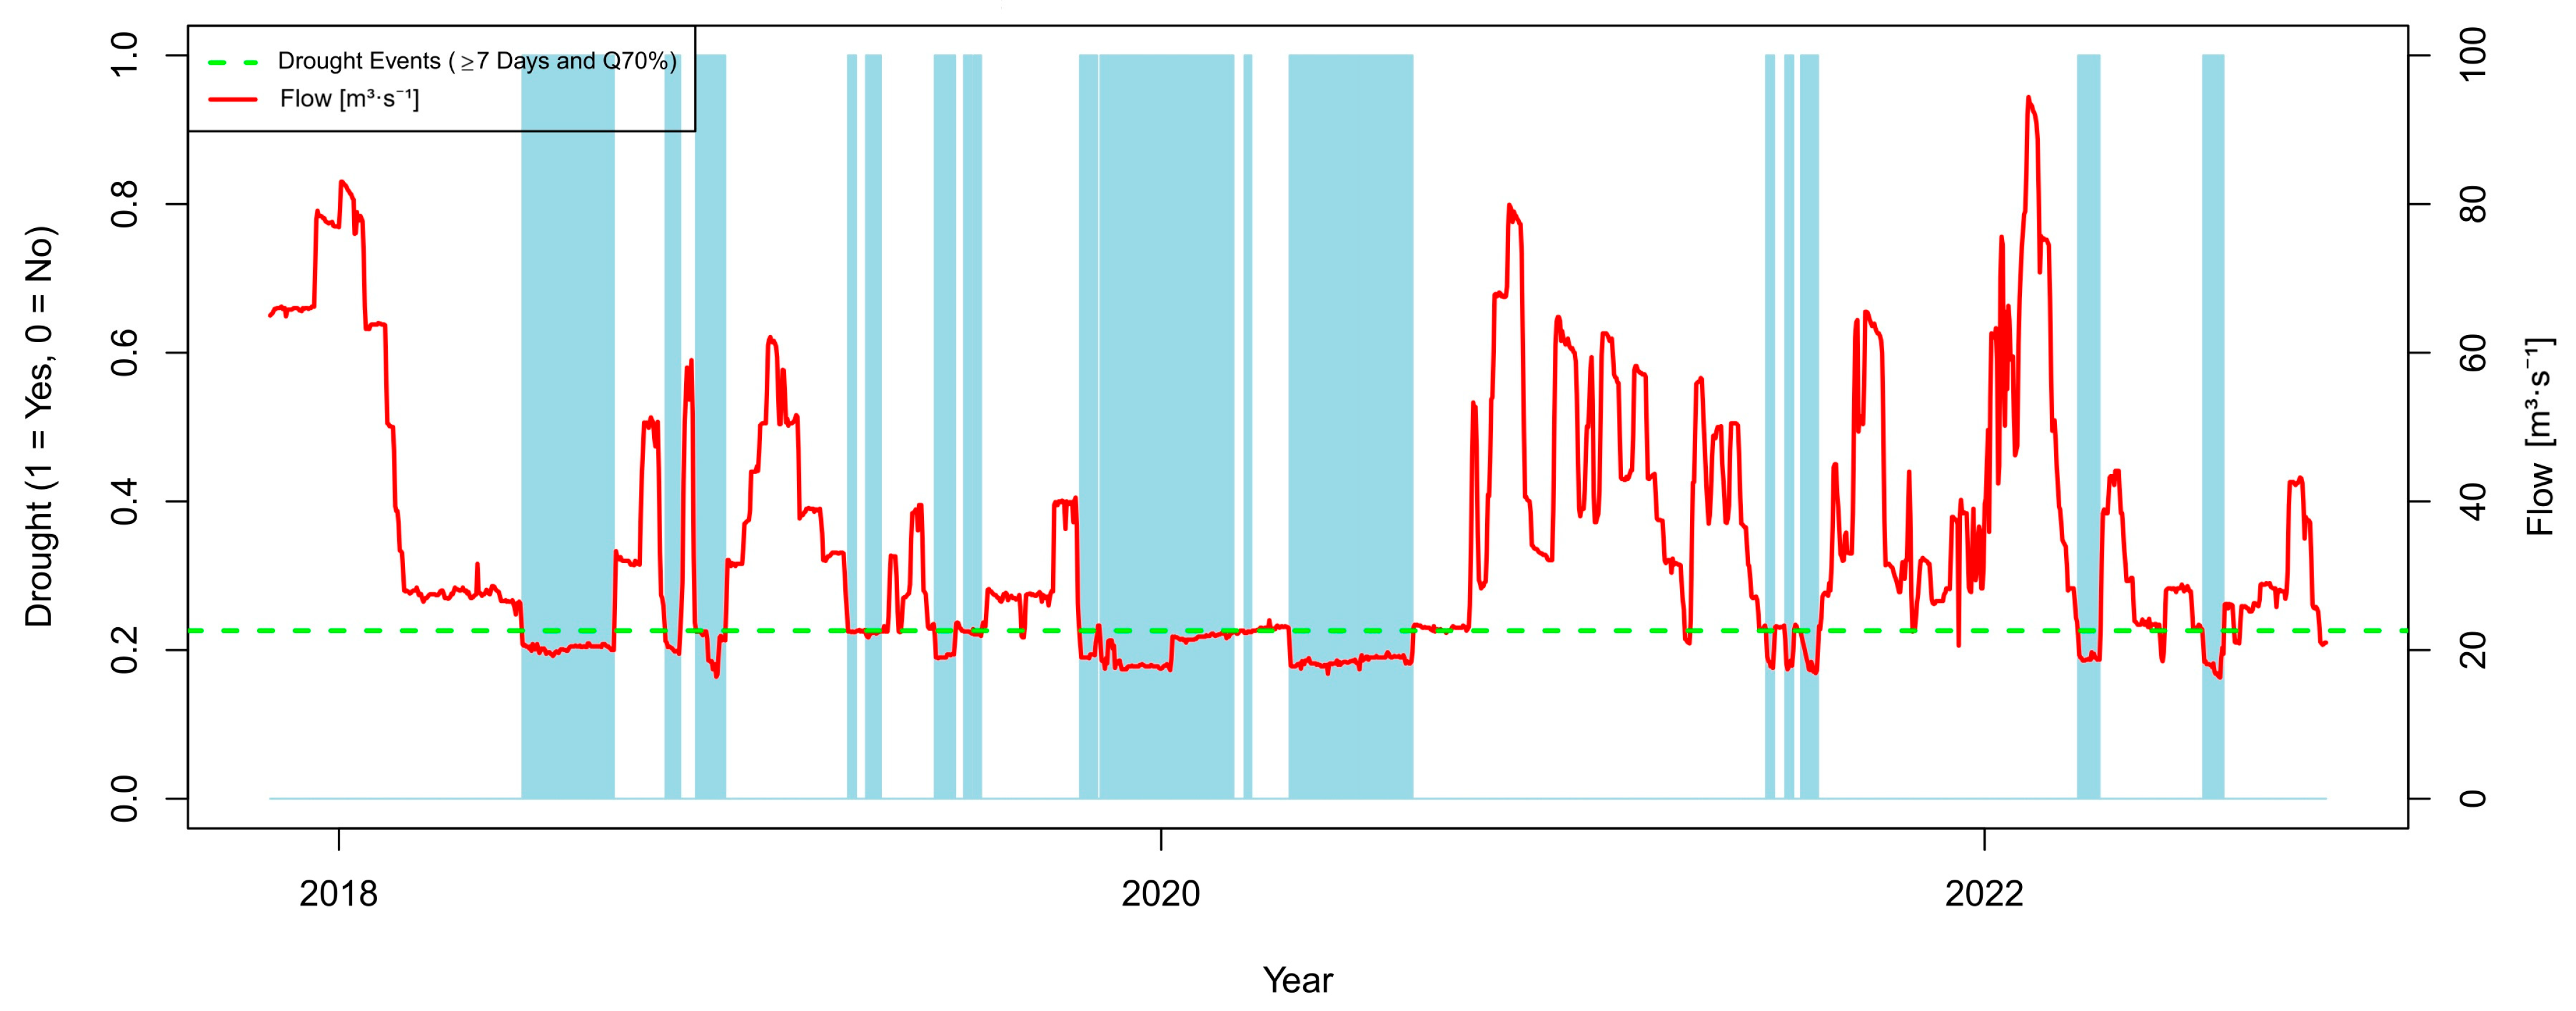
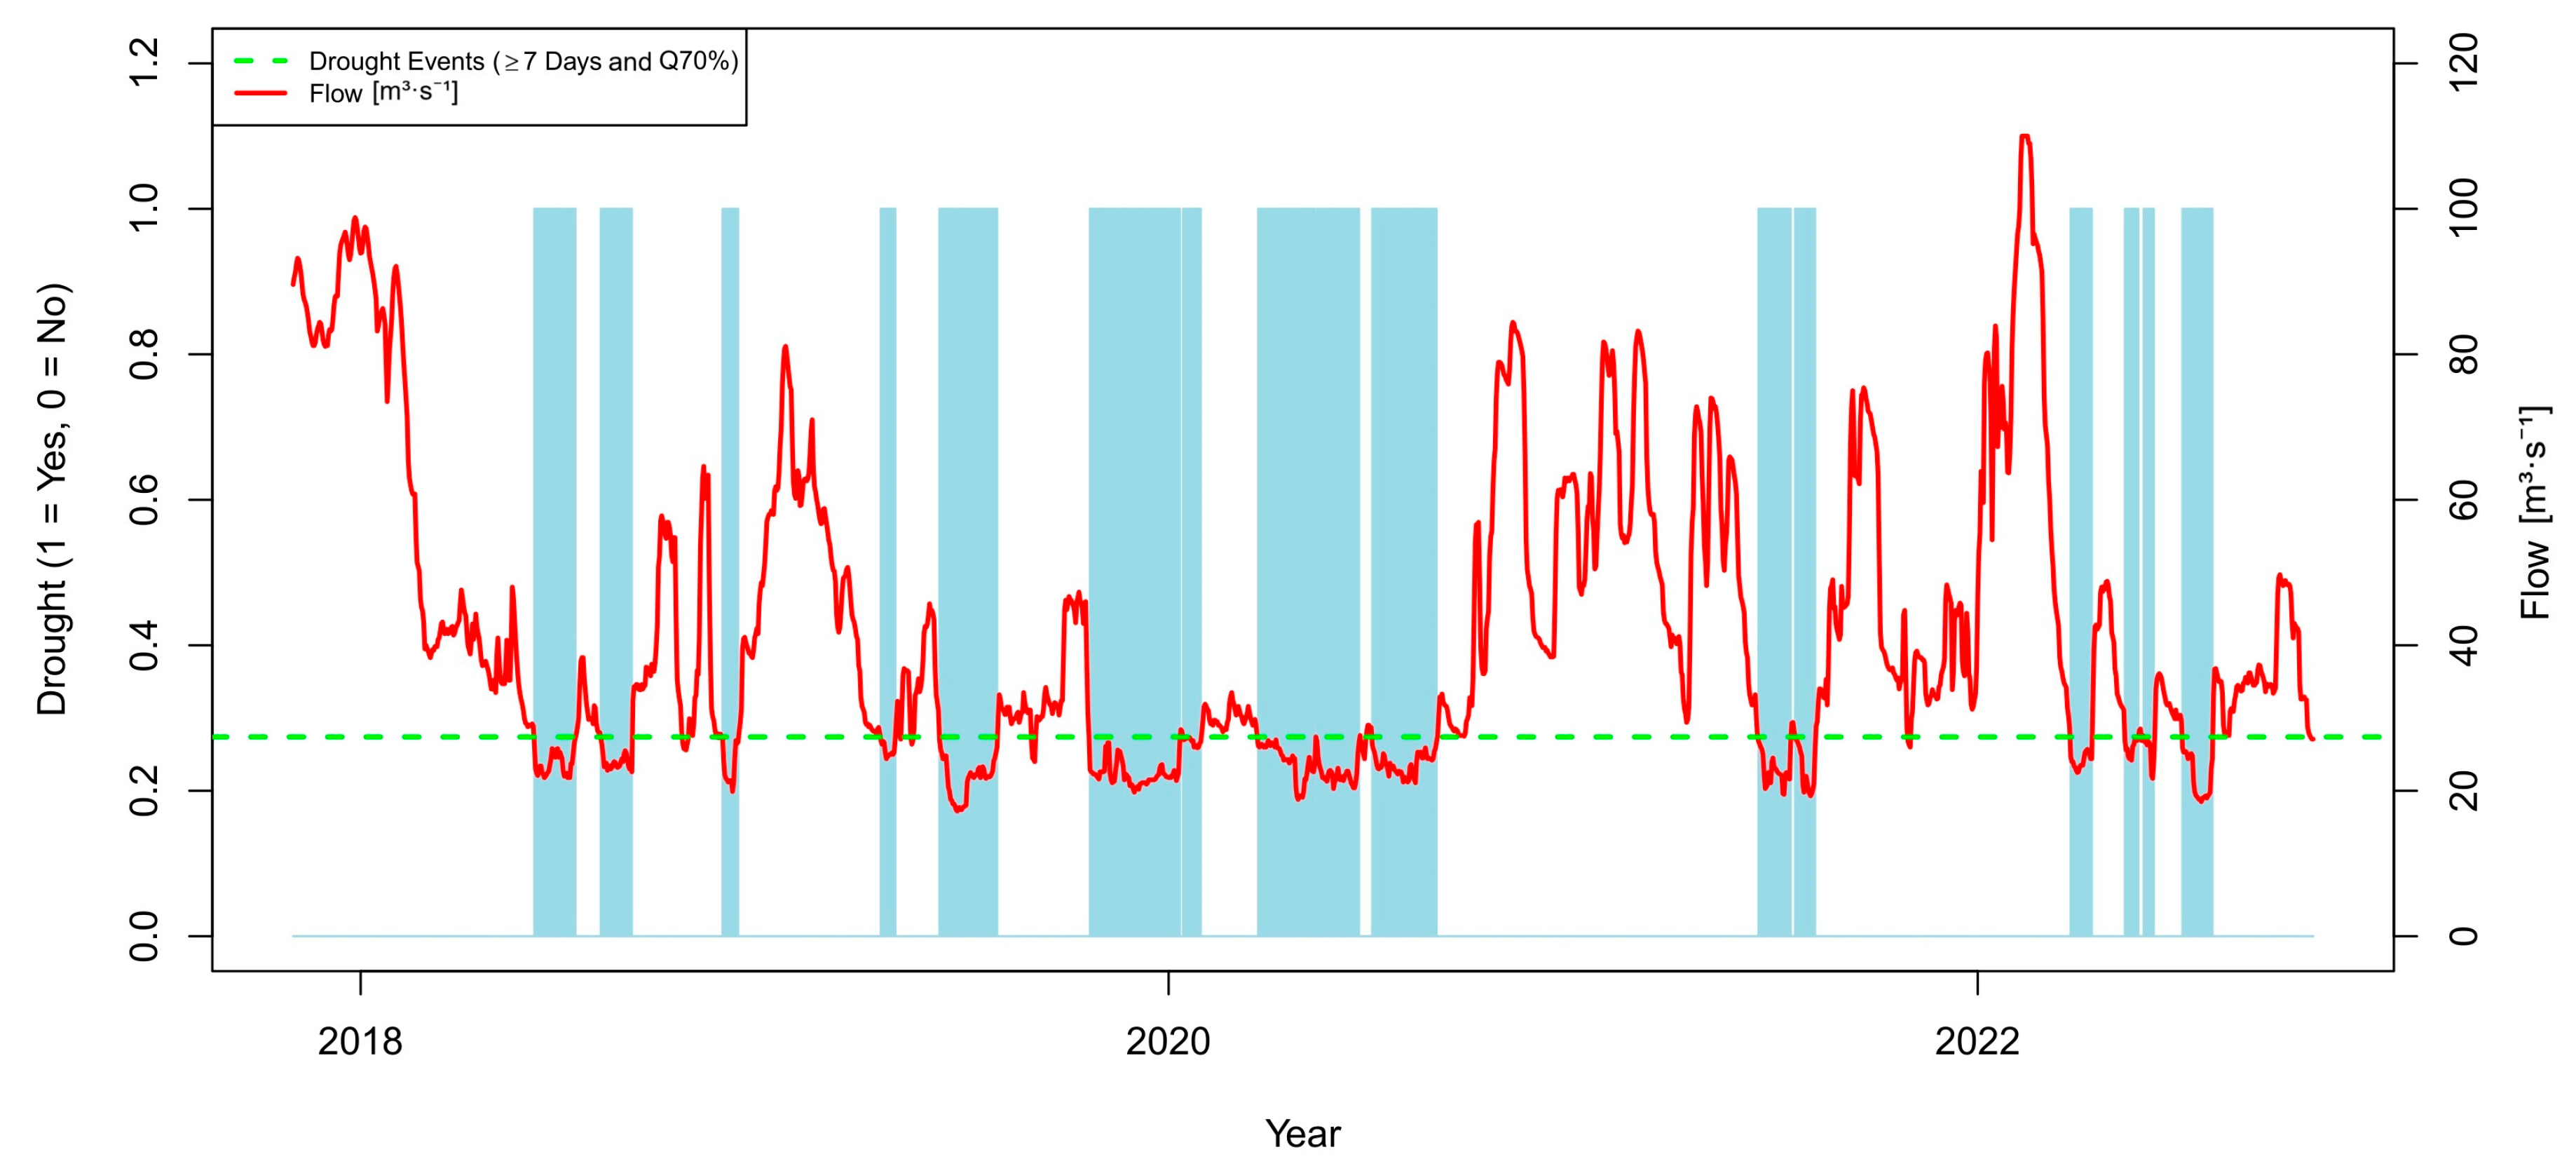
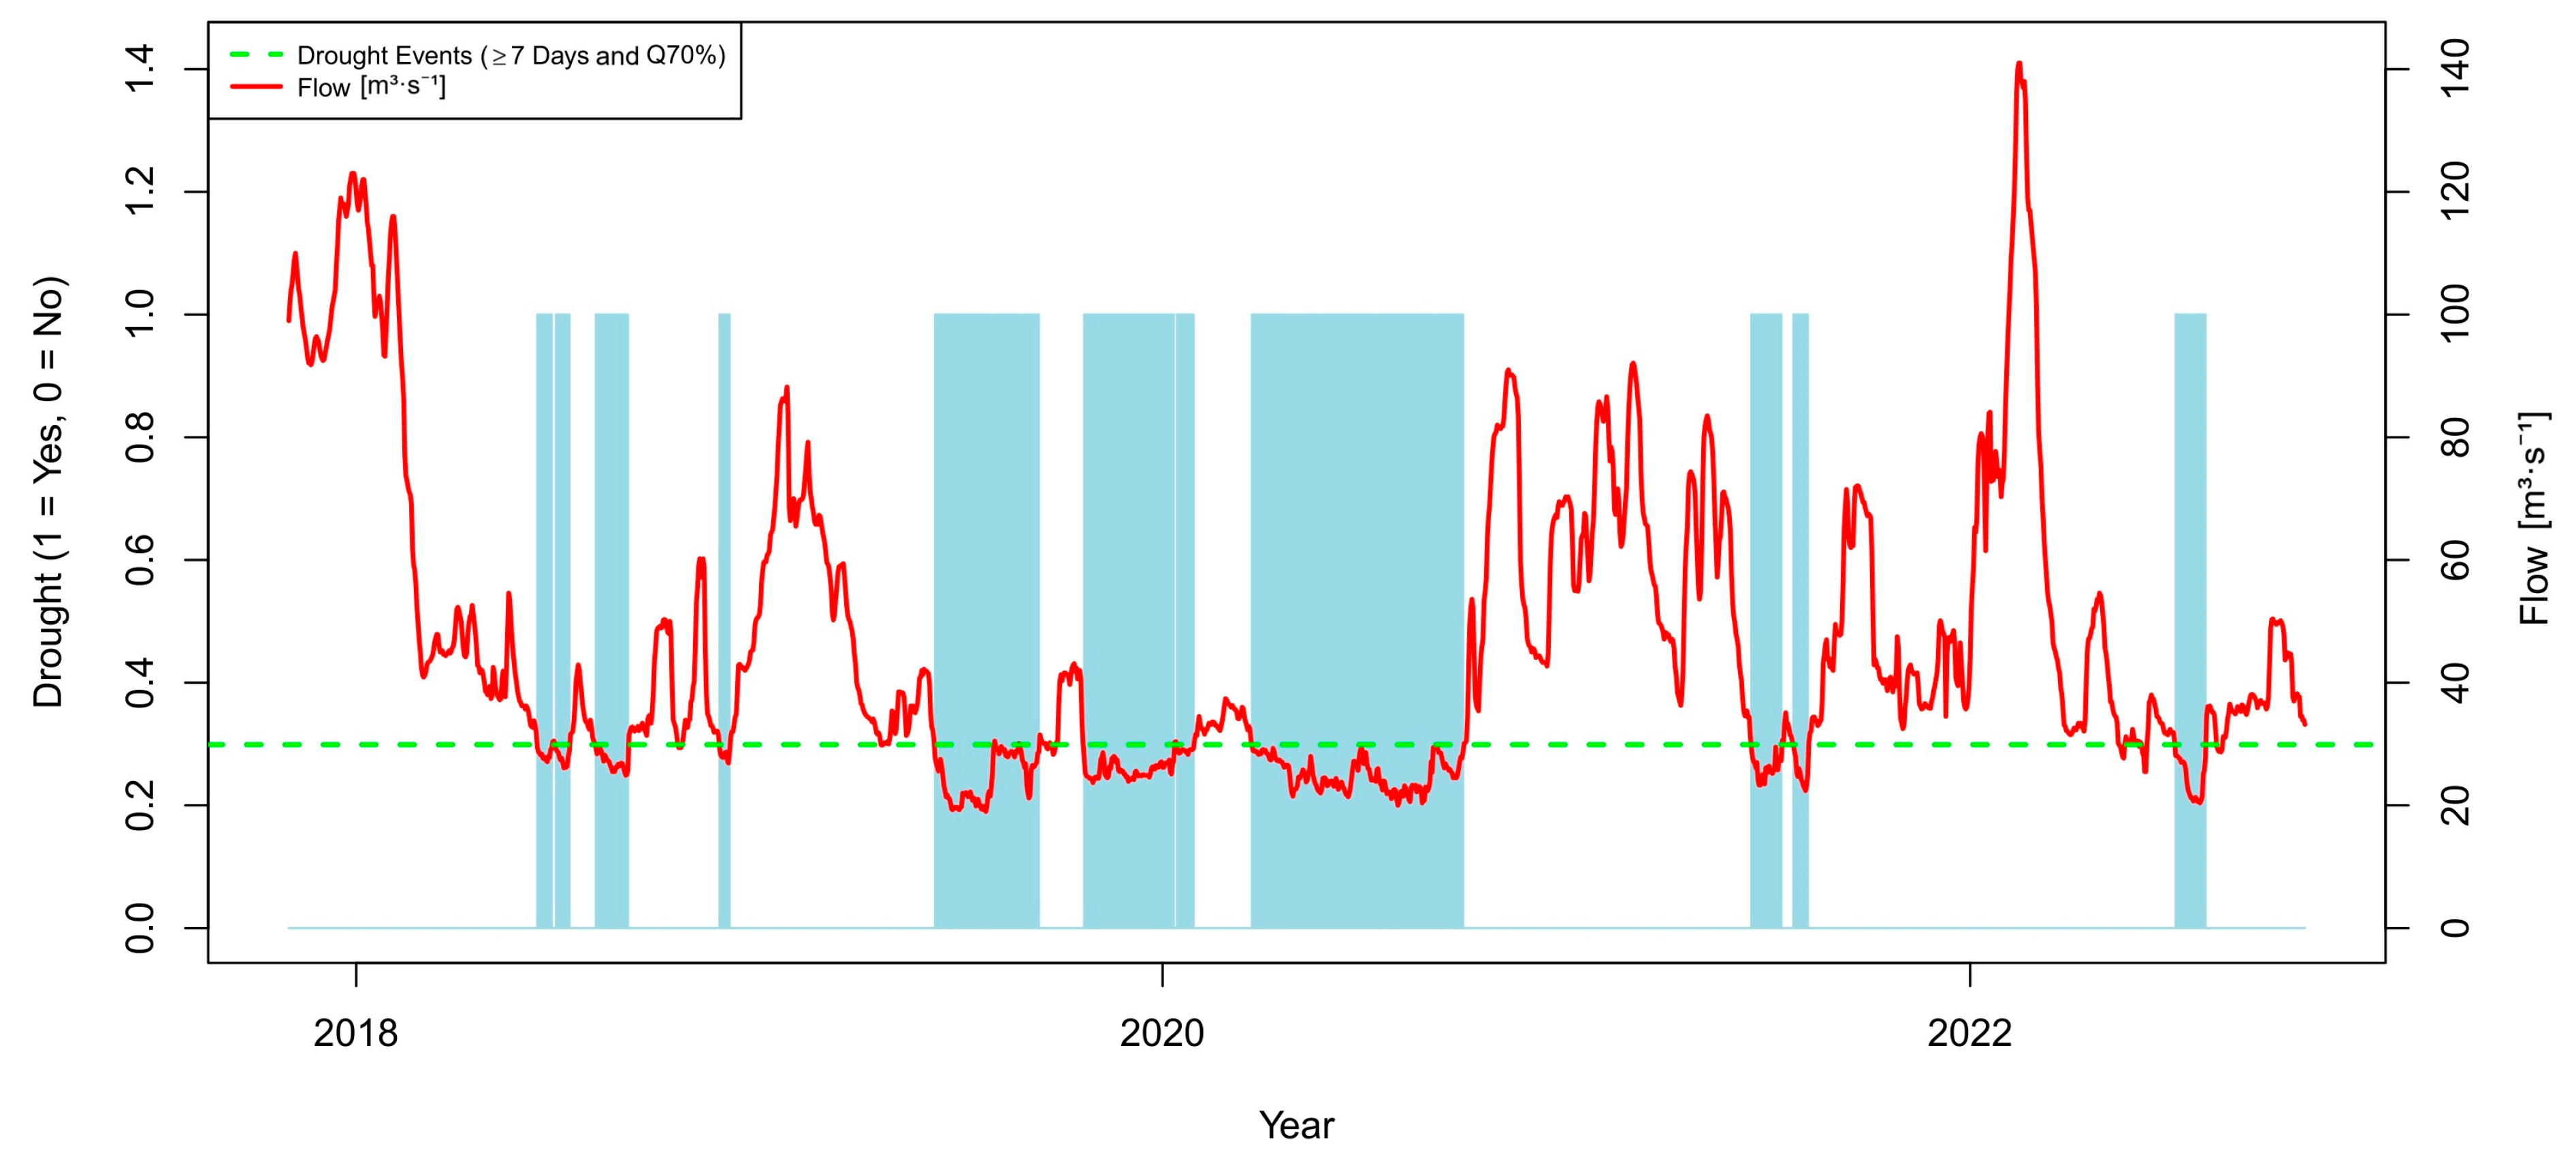
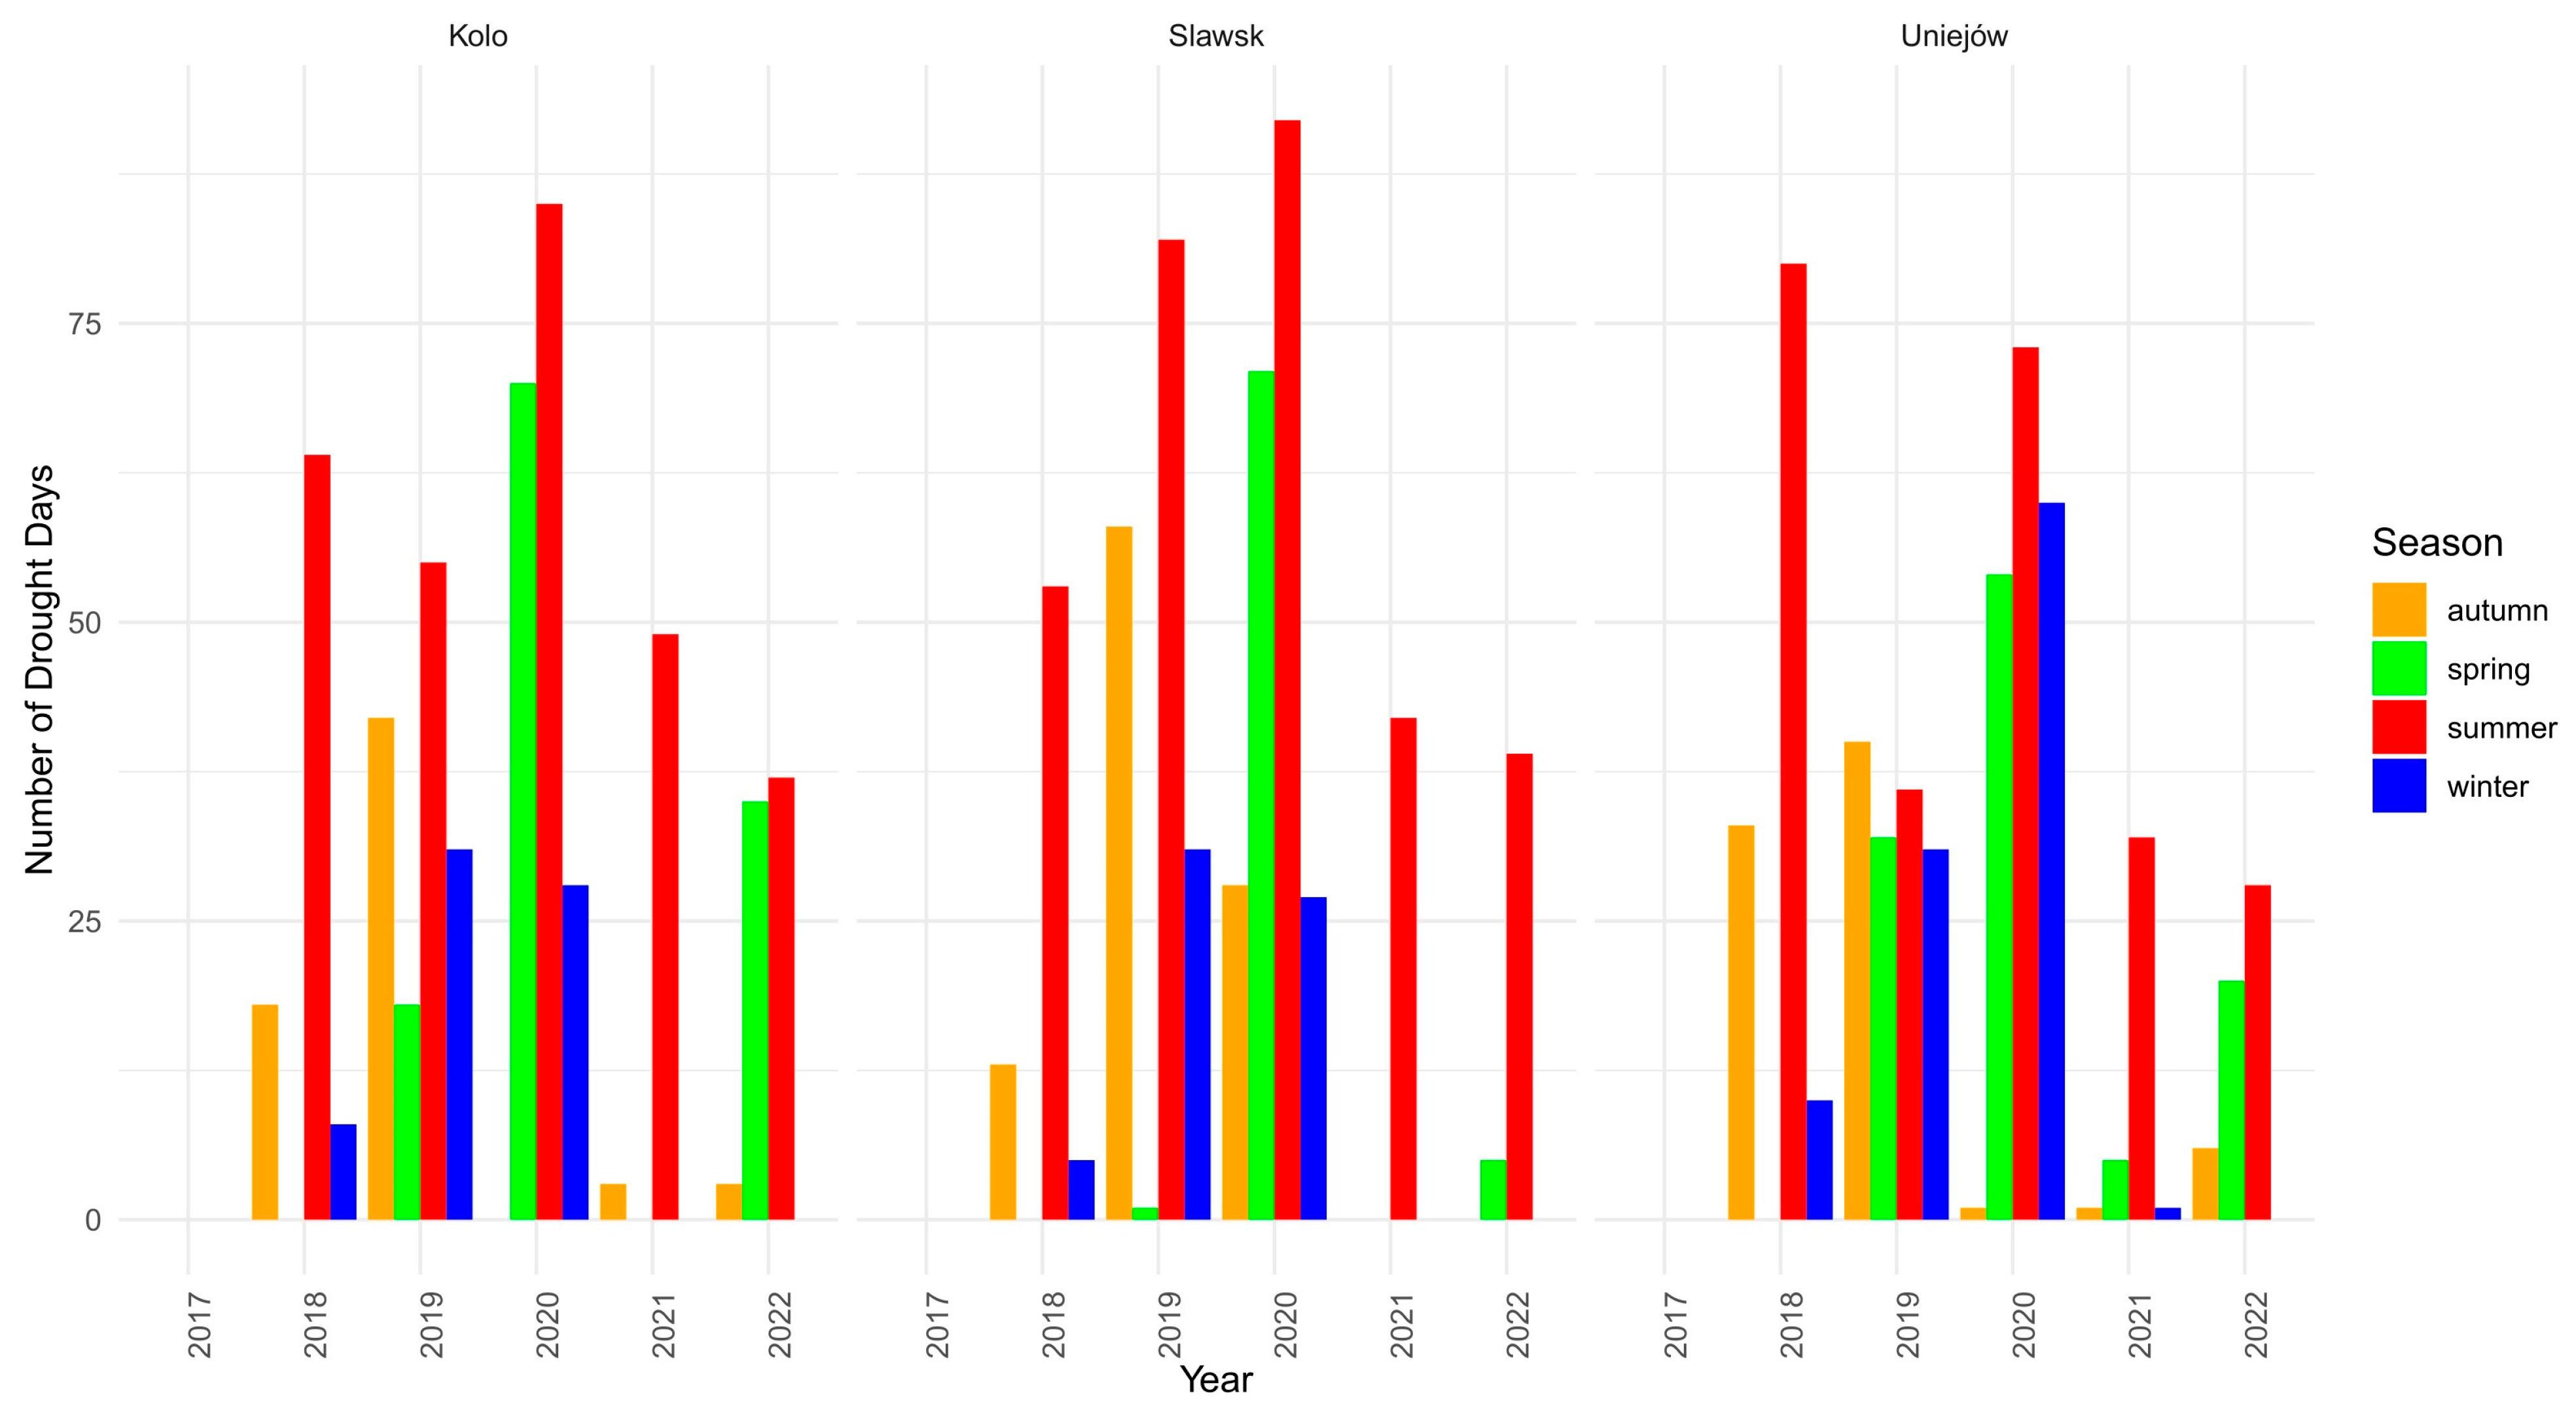
3.1. Hydrological Characteristics of the Analyzed Section of the Warta River Including Analysis of Low-Flow Periods

To assess the potential impact of the Kiełbaska Duża River inflow on adjacent Natura 2000 sites, the hydrological conditions of the Warta River were analyzed along the section between the Jeziorsko Reservoir and the Uniejów gauging station. The hydrological characteristics in the selected section included an analysis of river flows at three water gauge profiles: Uniejów (466 + 600 km), Koło (436 + 400 km), and Sławsk (392 + 300 km).
The Uniejów water gauge profile is located at 466 + 600 km of the Warta River (A = 9183.47 km2) 16.2 km downstream of the Jeziorsko Reservoir; 30.2 km farther is the Koło profile at 436 + 400 km of the Warta River (12,001.7 km2), and farther on, at 392 + 300 km of the Warta River, is the Sławsk profile (A = 13,758.78 km2).
At the Uniejów water gauge profile, the mean annual flow (SSQ) for hydrological years 2018–2022 was 34.00 m3∙s−1 (Figure 6), while the mean annual flows ranged from 22.70 m3∙s–1 in 2020 to 41.30 m3∙s–1 in 2021. Extreme flows were observed during the hydrological year, ranging from NNQ = 11.90 m3∙s–1 to WWQ = 95.60 m3∙s–1 in 2022 (Figure 6, Table 1). Hydrological year 2020 was characterized by lower daily flows compared to the other hydrological years in question. In 2020, the average flow was 22.7 m3∙s–1.
Daily discharge data from the Warta River at the three previously mentioned gauging stations were analyzed for low-flow periods using the POT method [31,32]. For the 2018–2022 multi-year period, an analysis of the dynamics of low-flow periods was made in comparison with the multi-year perspective, thus obtaining a comprehensive picture of the variability in water resources. The threshold for identifying low-flow events (Q70%) was determined from the curve of the sum of flow durations for each station based on flow duration curves and corresponded to 22.60 m3∙s⁻1 at Uniejów, 27.40 m3∙s⁻1 at Koło, and 29.90 m3∙s⁻1 at Sławsk (Figure 6, Figure 7 and Figure 8).
Analyzing the daily flows of the Warta River in the Uniejów profile for the hydrological years 2018–2022, 11 low-flow periods were observed, with a duration of between 14 and 119 days, where the flow rate was lower than Q70% = 22.60 m3∙s–1. All the low-flow periods are marked in blue in Figure 6. The longest-lasting low-flow period of 119 days was observed in the hydrological year 2020 (from 8 November 2019 to 5 March 2020), during which the flow ranged from 17.4 to 22.6 m3∙s–1 (Table 2). As previously mentioned, hydrological year 2020 was characterized by lower flows compared to other hydrological years, resulting in the low-flow periods observed during this time. Referring to the entire analyzed multi-year period of 2018–2022, the average duration of low-flow periods was 41 days.
In the Koło water gauge profile, the mean annual flow (SSQ) for 2018–2022 was 41.74 m3∙s–1 (Figure 7). The average annual flows ranged from 27.80 m3∙s–1 in 2020 to 50.40 m3∙s–1 in 2021. The extreme flows ranged from NNQ = 17.00 m3∙s–1 in 2019 to WWQ = 111.00 m3∙s–1 in 2021 (Table 1).
Analyzing the daily flows of the Warta River in the Koło profile, the hydrological years 2018–2022 included 16 low-flow periods with durations ranging from 10 to 82 days (Figure 7). The longest-lasting low-flow period of 82 days was observed at the end of hydrological years 2019 and 2020 (from 22 October 2019 to 11 January 2020), where the flow ranged from 19.8 to 27.4 m3∙s–1 (Table 3). During a similar period, the longest-lasting low-flow period was observed at the Uniejów station. For the Koło station, the average duration of low-flow periods in the 2018–2022 multi-year period was slightly shorter than for the Uniejów profile, at 32 days.
In the Sławsk water gauge profile, the mean annual flow (SSQ) for 2018–2022 was 45.90 m3∙s–1 (Figure 8). The average annual flows ranged from 29.20 m3∙s–1 in 2020 to 57.80 m3∙s–1 in 2018. The extreme flows ranged from NNQ = 17.40 m3∙s–1 in 2019 to WWQ = 142.00 m3∙s–1 in 2021 (Table 1).
When analyzing the daily flows of the Warta River in the Sławsk profile, the hydrological years 2018–2022 included 14 low-flow periods with durations ranging from 10 to 167 days (Figure 8). The longest-lasting low-flow period of 167 days was observed in the hydrological year 2020 (from 22 March 2020 to 4 September 2020), where the flow ranged from 20.0 to 29.9 m3∙s–1 (Table 4). Of the three profiles analyzed, the Sławsk profile was characterized by the longest low-flow period when considering the Q70% cutoff threshold and the analyzed multi-year period. During the longest low-flow period in the Sławsk profile at the same time, three shorter low-flow periods of 52, 39, and 59 days were observed in the Koło profile, including one of the longest low-flow periods in this profile. In the case of the Sławsk profile, the average duration of low-flow periods in the 2018–2022 multi-year period was 35 days and thus was similar to the average duration of low-flow periods in the Koło profile.
Analyzing the number of days with low-flow periods on a seasonal basis, the greatest number of such days was recorded during the summer season in the hydrological years 2018 and 2020. The hydrological year 2020 was distinguished not only by the large number of days with low-flow periods in summer but also by their frequent occurrence in other seasons, such as spring and winter. The total durations of low-flow periods in the analyzed profiles located on the Warta River were 456 days in the Uniejów profile and 519 days in the Koło and Uniejów profiles (Figure 9). In summary, the duration of low-flow periods in the hydrological years 2018-2022 for two profiles (Koło and Uniejów) was equal to and 63 days higher than the duration of low-flow periods in the Uniejów profile. Statistically, for each hydrological year, there were 91 and 103 days of low-flow periods in the Uniejów as well as the Koło and Sławsk profiles, respectively. Frequent low-flow periods in Natura 2000 sites may hinder the natural growth of vegetation and disrupt the habitats of sensitive species. At the same time, the occurrence of low-flow periods adversely affects the ability to maintain stable electricity production. Prolonged and frequent low-flow periods, such as those observed in 2018–2022, pose a significant challenge to the continued operation of power plants that depend on access to water.

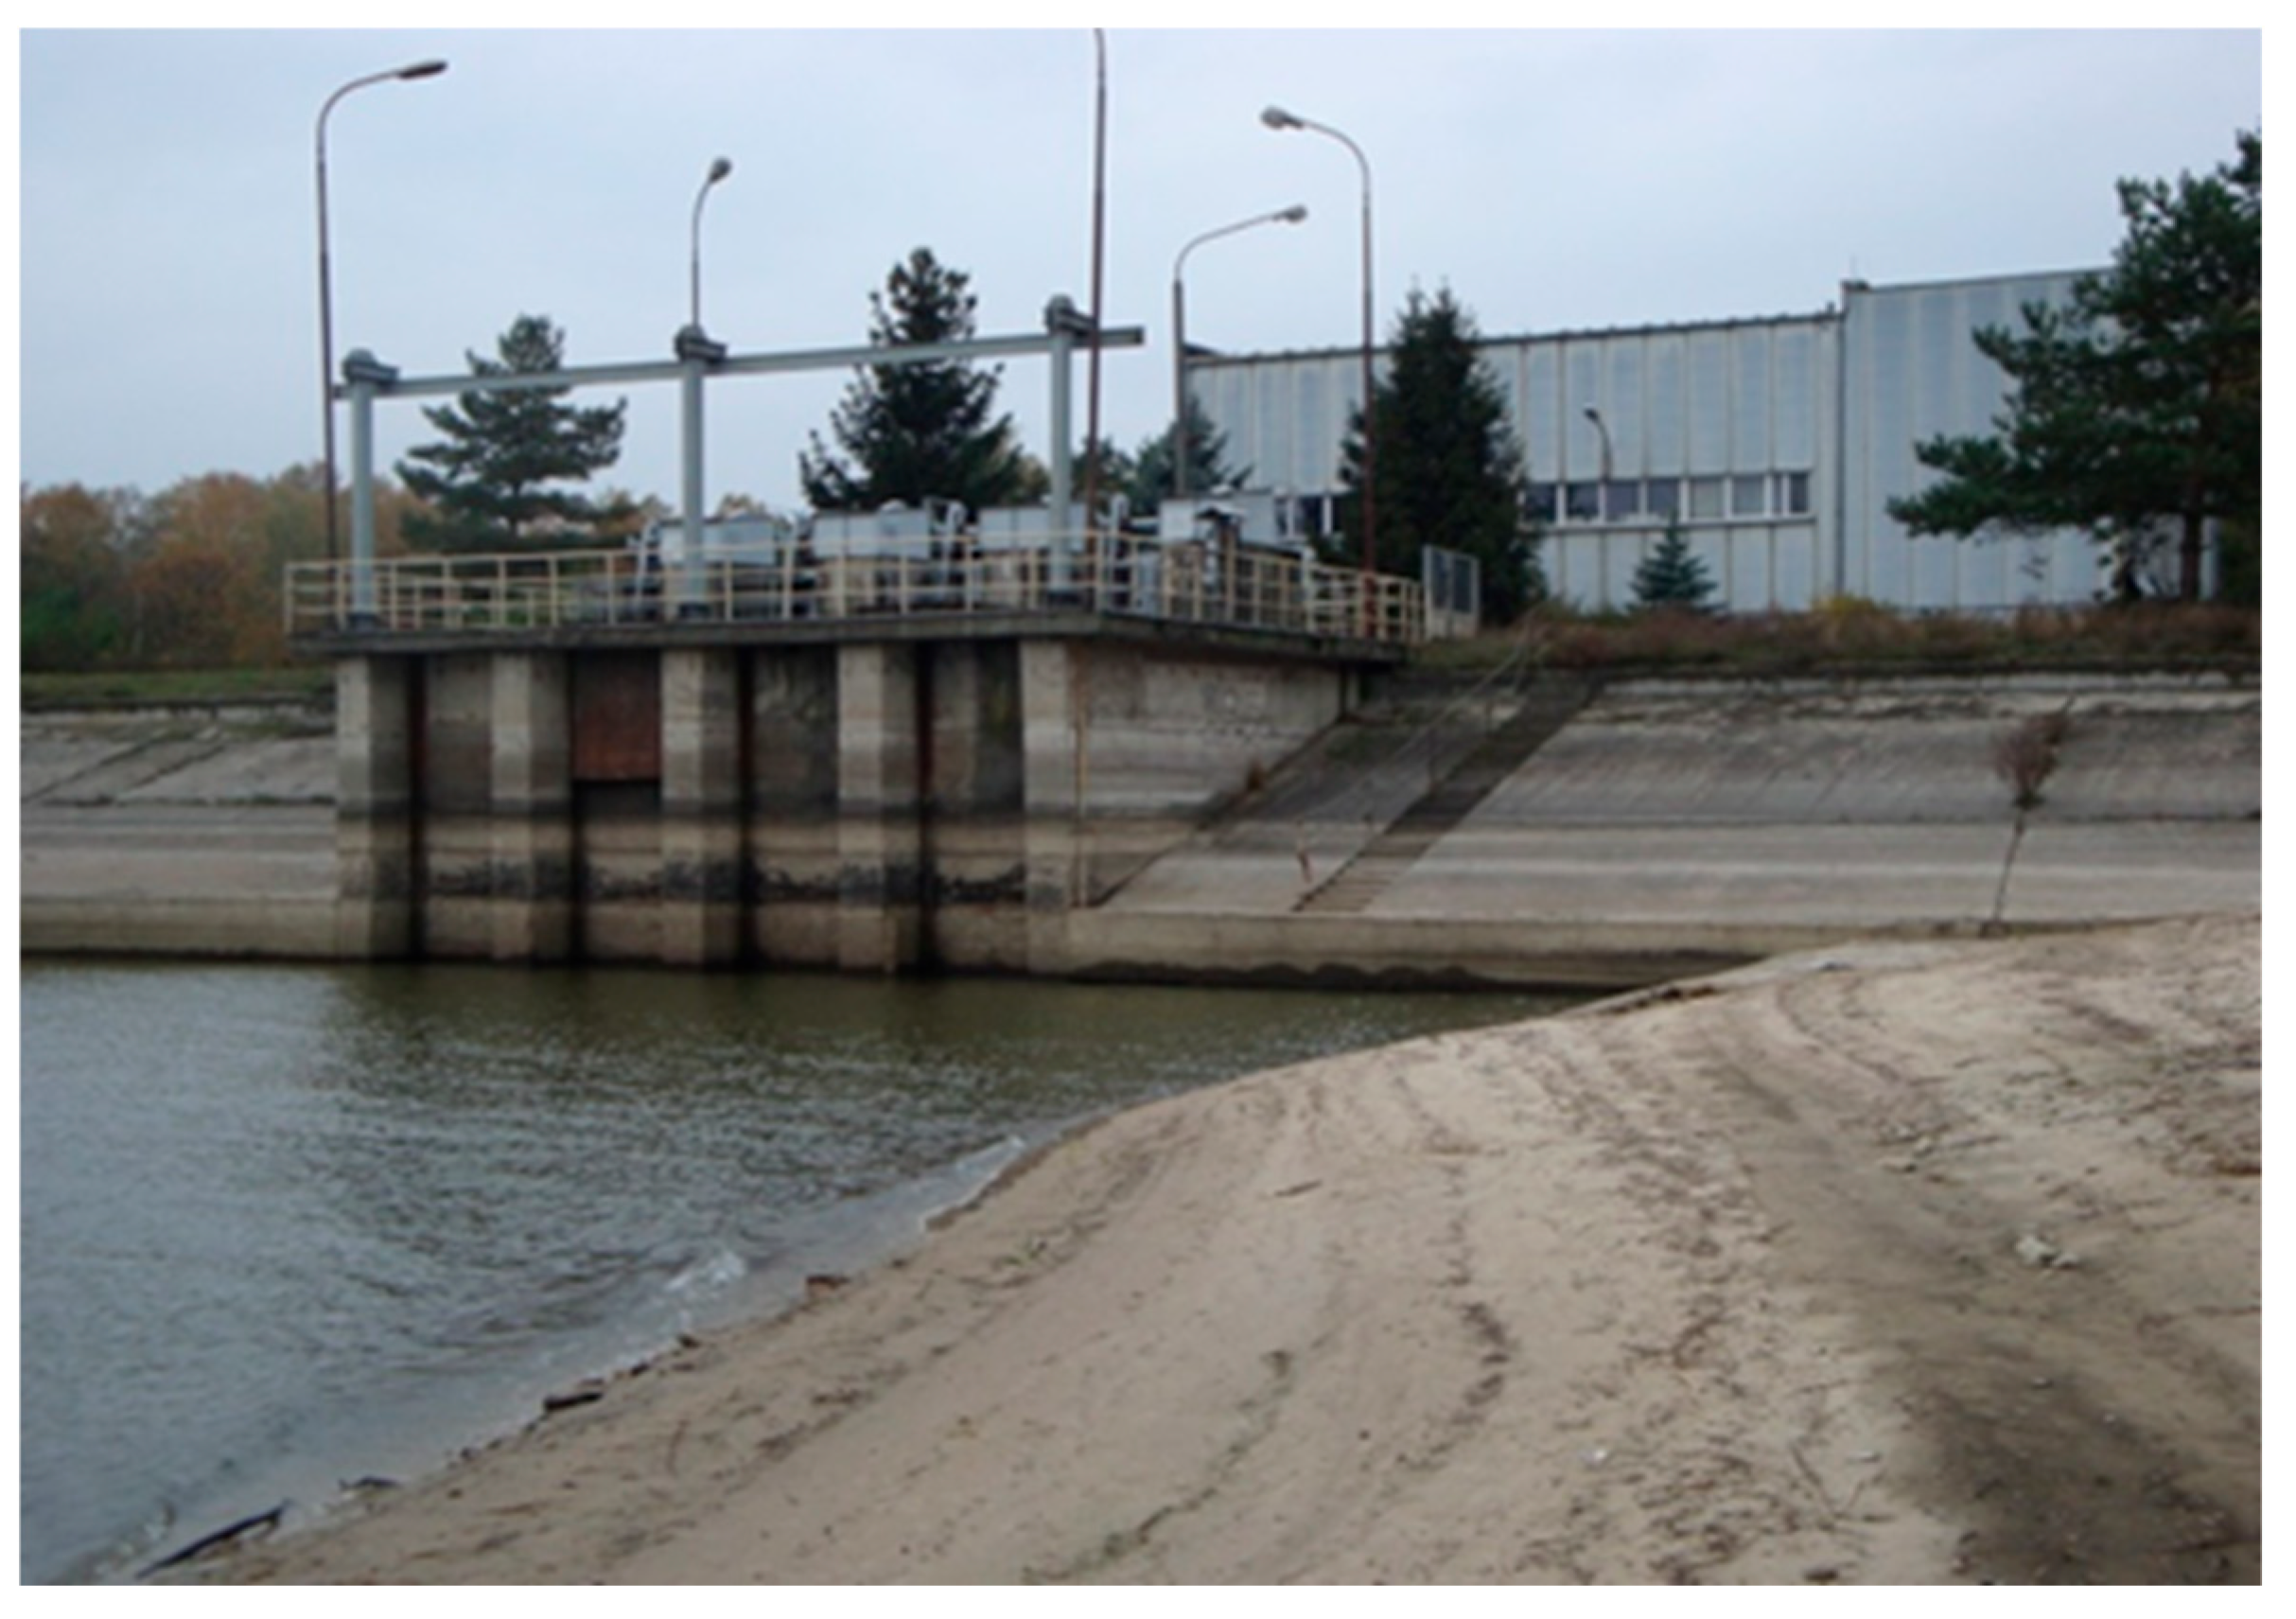
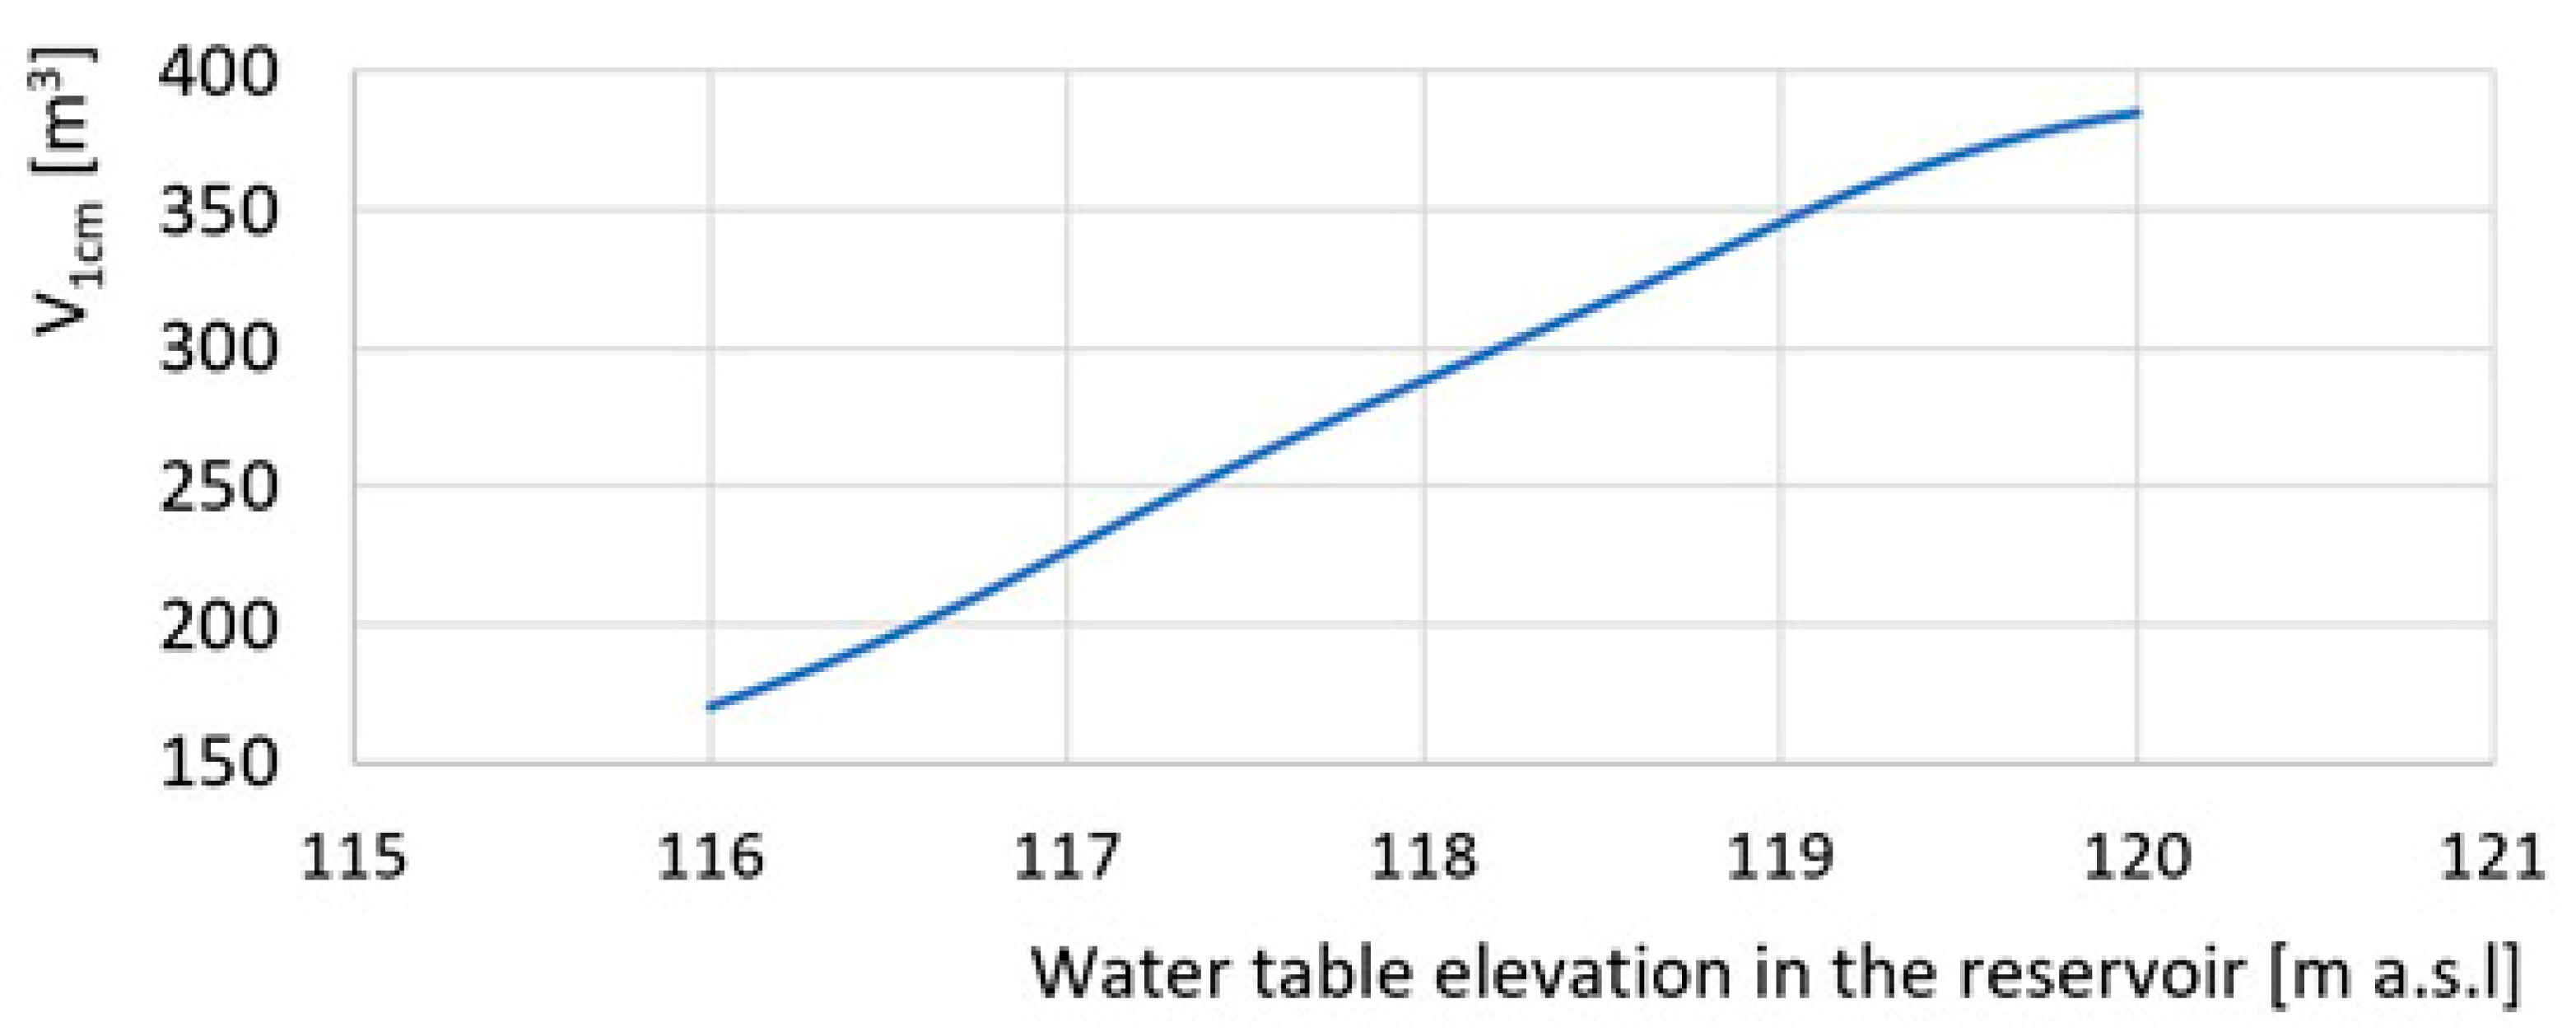
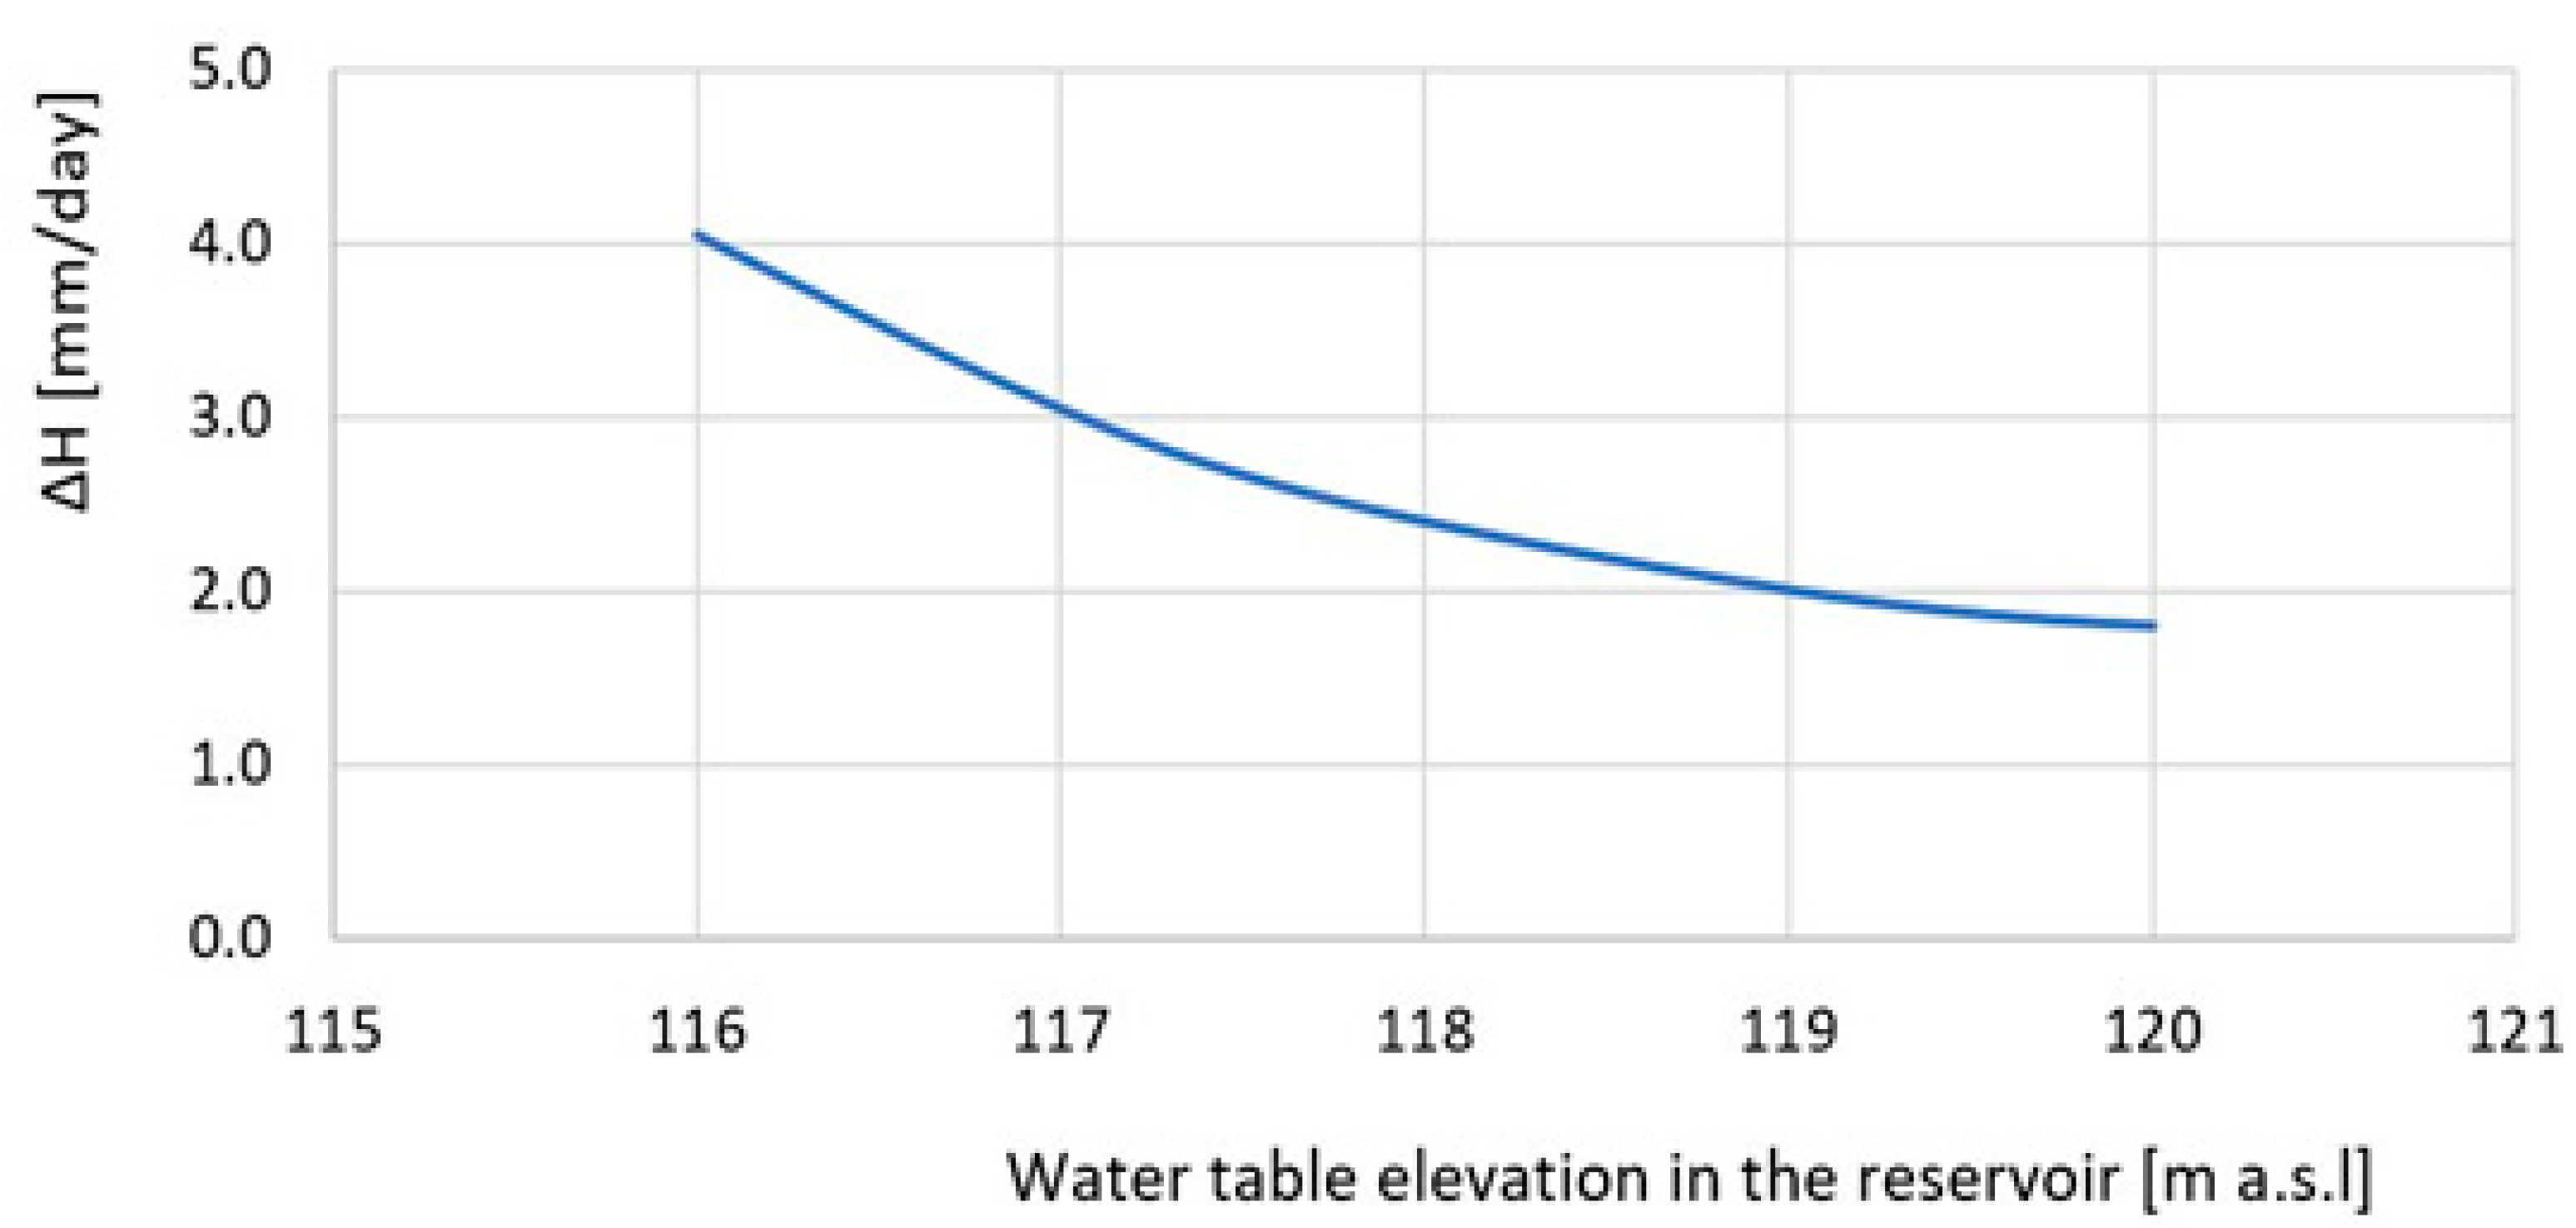
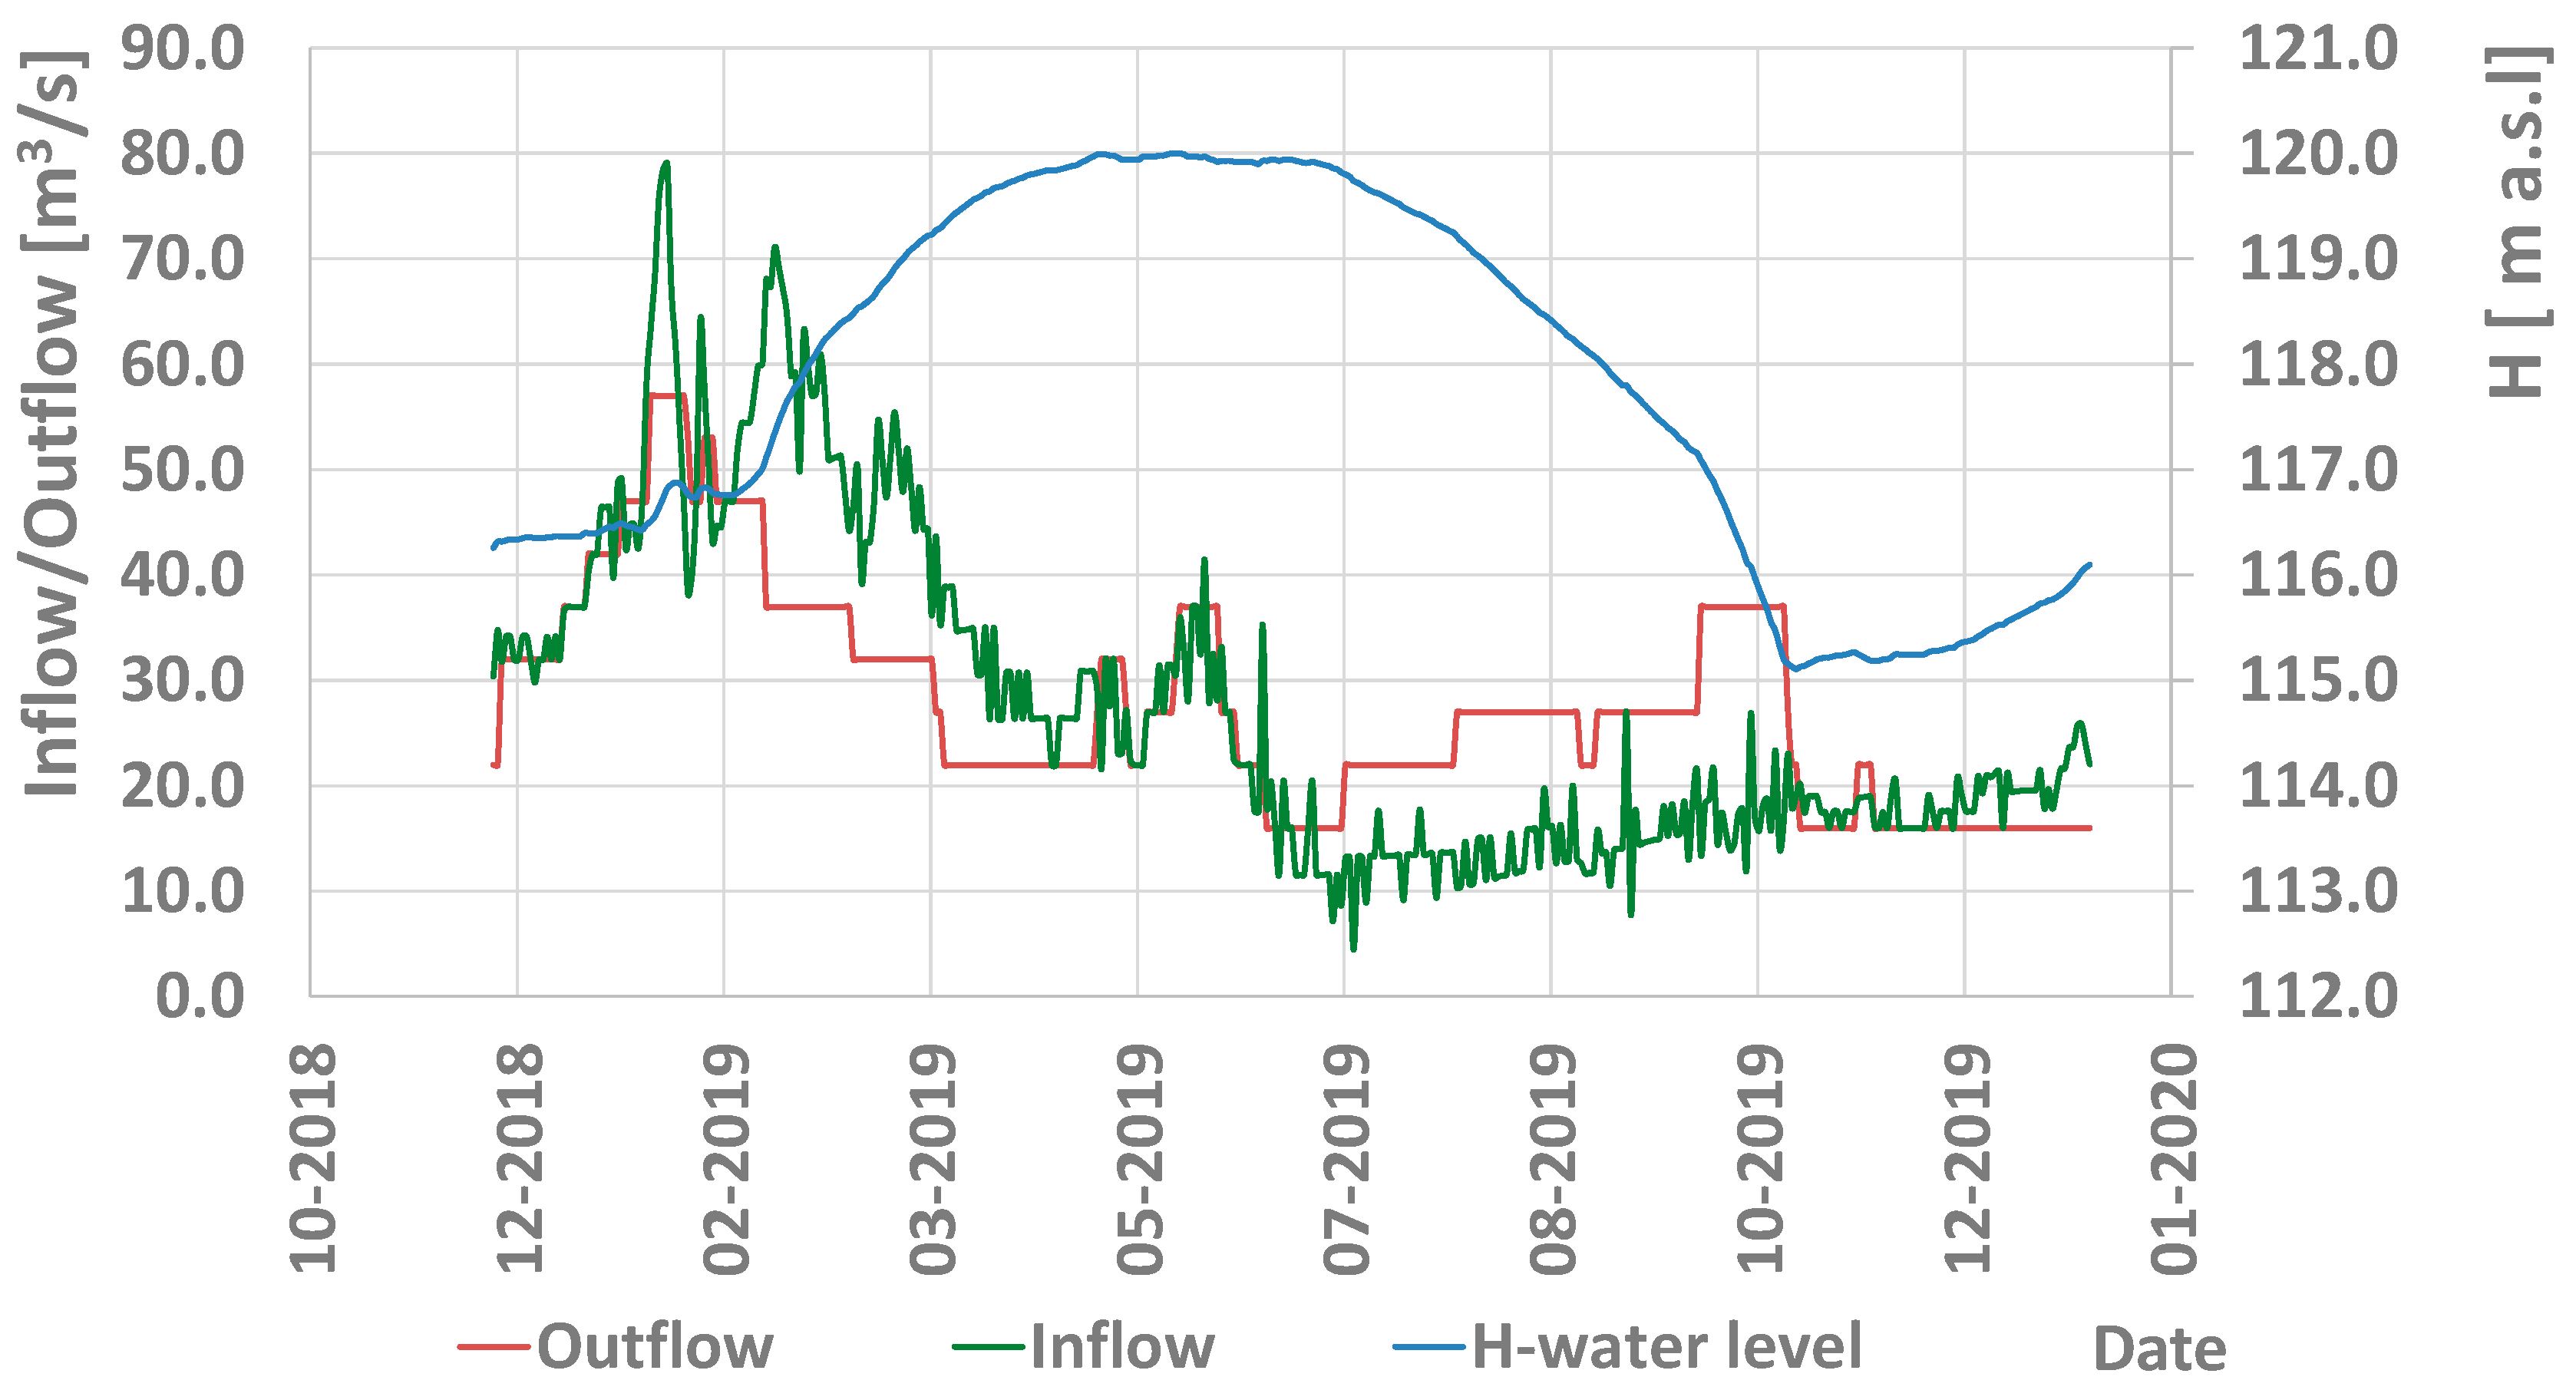
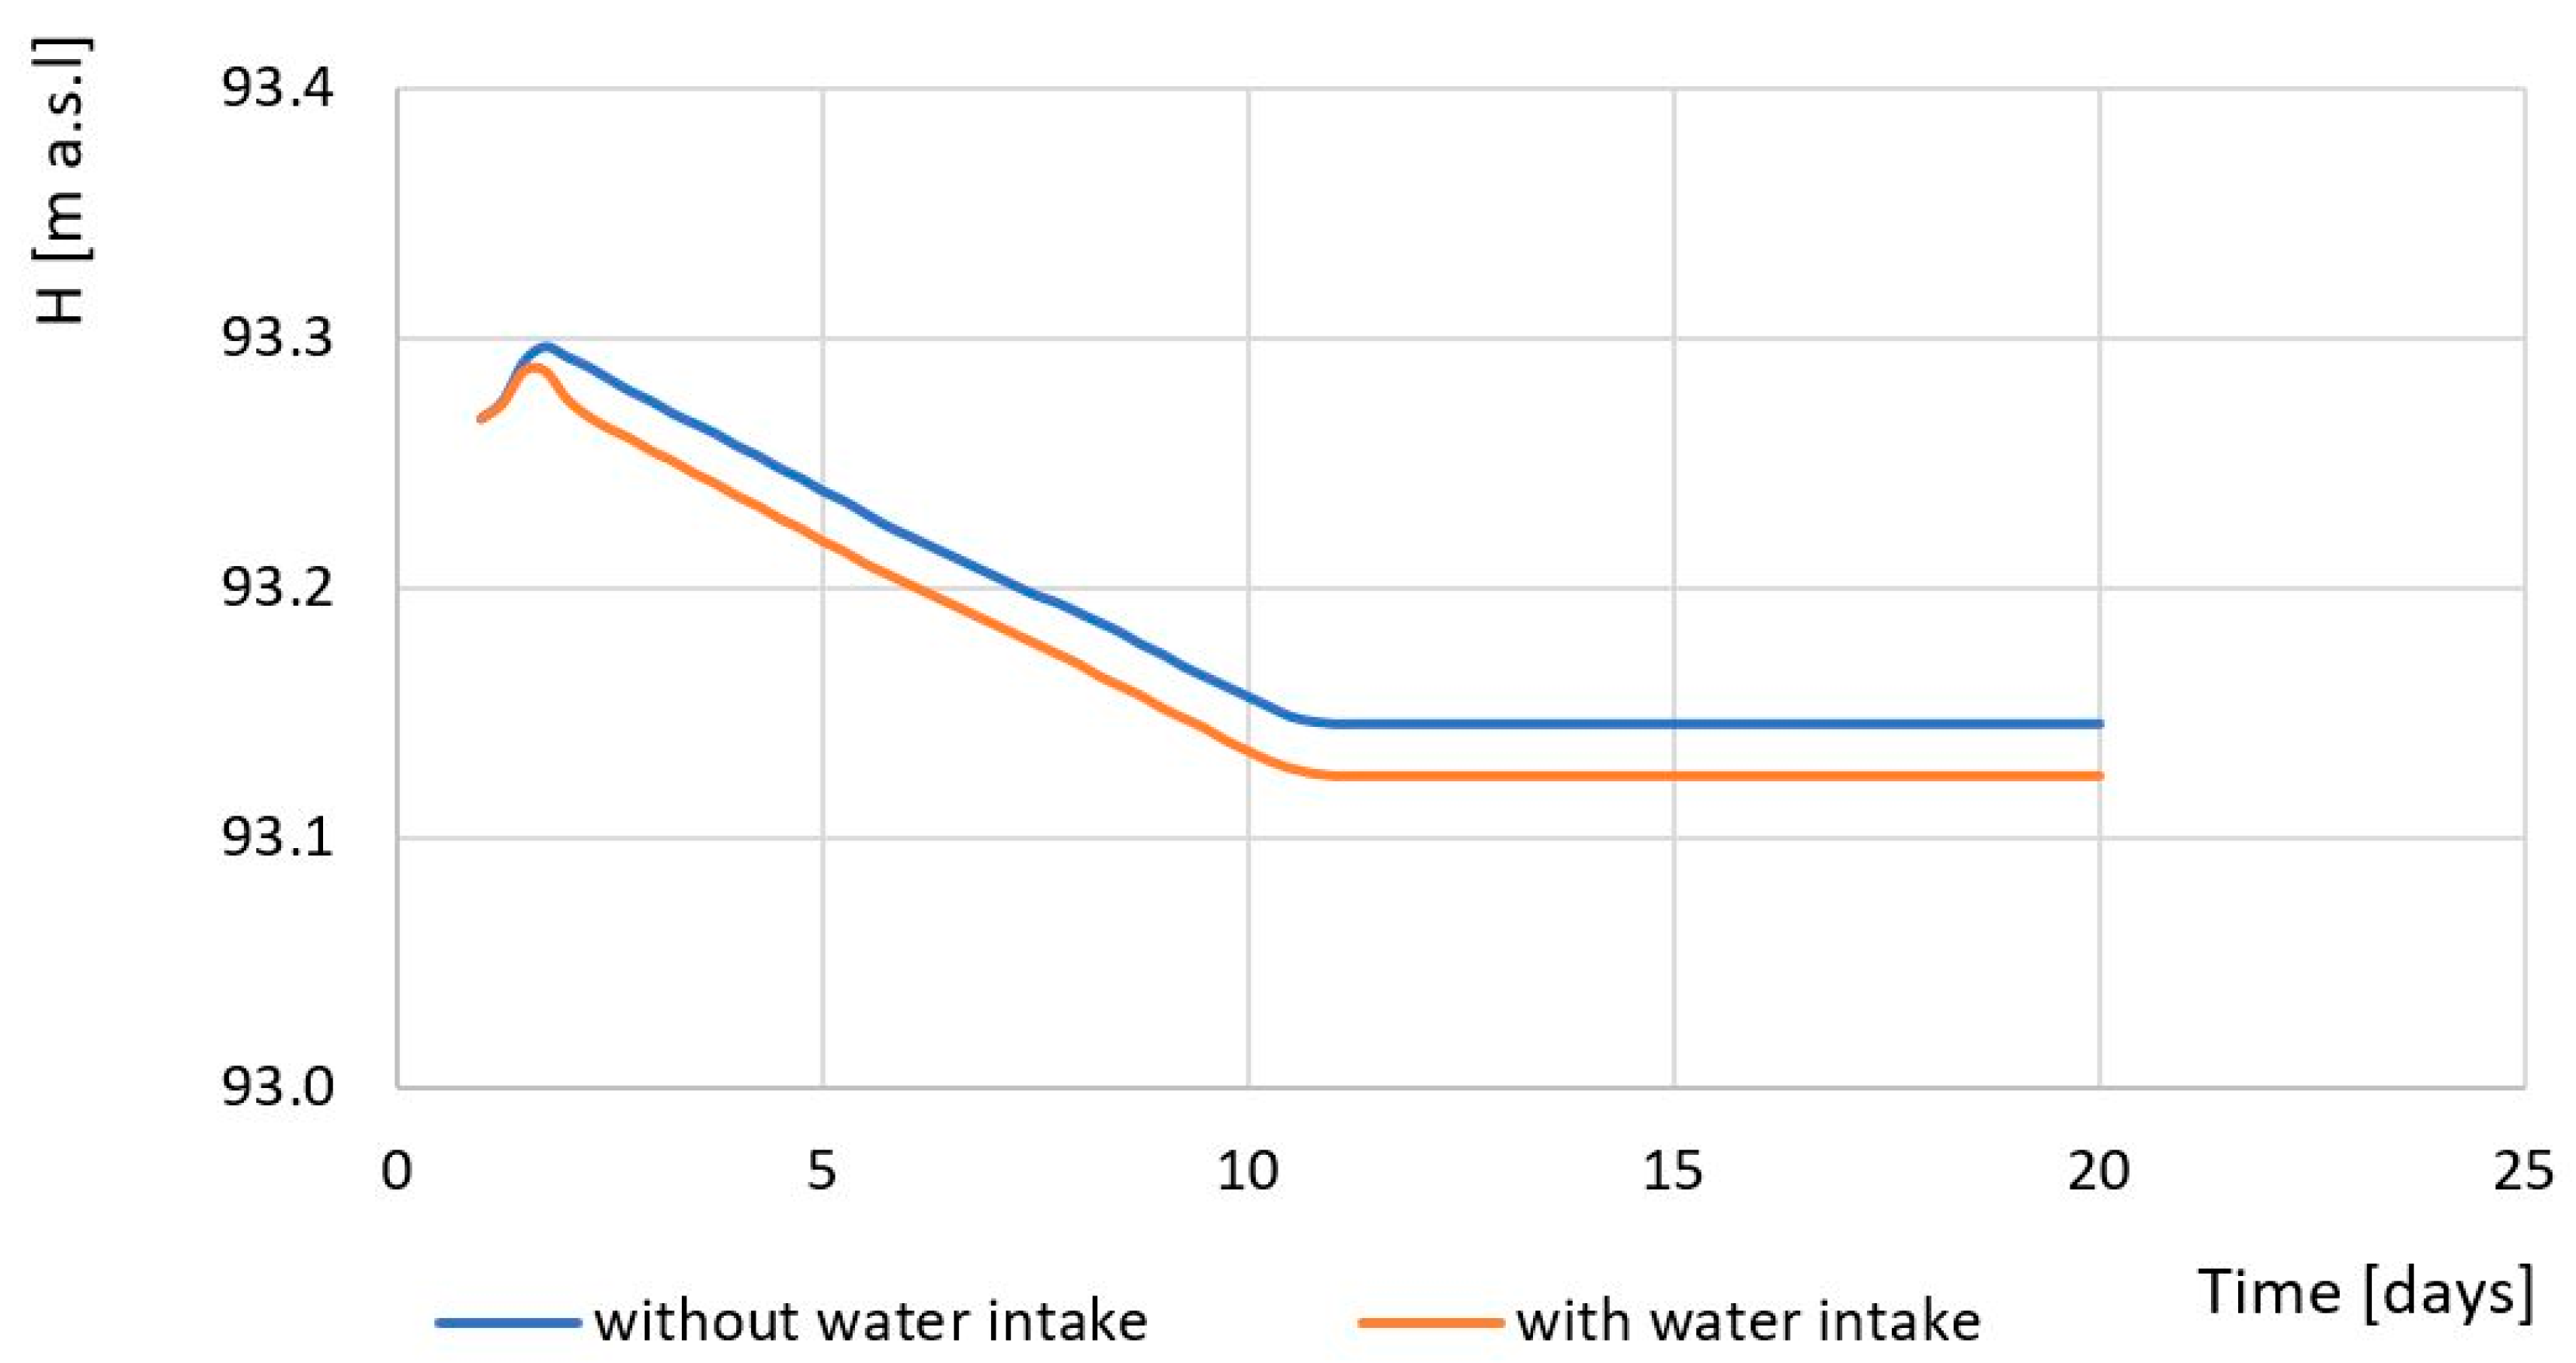
3.2. Analysis of the Impact of Water Intake for the Purpose of Recharging the Kiełbaska Duża River on the Retention Capacity of the Jeziorsko Reservoir and the Natura 2000 Site at the Reservoir

Under the water permits issued, water intake for the purpose of recharging the Kiełbaska Duża River during low-flow periods was allowed to reach a maximum of 0.8 m3∙s–1. The analysis assumptions included the most unfavorable system, where the intake with a maximum value can occur during periods of drought, in which the inflow to the Jeziorsko Reservoir can be lower than the guaranteed outflow. According to the reservoir’s Water Management Manual, this is 14.5 m3∙s–1. Additional water intake will increase the rate of fall of the water table on the reservoir. The purpose of the analysis was to quantify the impact of intake on filling the reservoir and thus on the protected areas located within the Jeziorsko Reservoir.
Water intake for the purpose of recharging the Kiełbaska Duża River is among the tasks associated with the use of retained water by industry in the Warta Valley region, according to the current 2014 Water Management Manual for the Jeziorsko Reservoir. The normal level of water damming in the Jeziorsko Reservoir is set at 120.00 m above sea level. At this level, the volume of water in the reservoir is 142.84 million m3. The change in volume from the filling of the reservoir is included in the Water Management Manual. Based on this information, an analysis was prepared of the impact of water intake into the Kiełbaska Duża catchment on the lowering of the water table in the Jeziorsko Reservoir.
In the first step, we determined what volume of water is needed for the ordinate of the water table in the reservoir to rise by 1 cm. These volumes will change as the reservoir filling level increases. A graph of these volumes is shown in Figure 10. For the ordinate of 116.00, the volume is equal to 170,000 m3, and for the normal damming level ordinate of 120.00, it rises to 385,000 m3.
Assuming that the inflow to the reservoir is equal to its outflow, the additional water intake will result in a lower water level in the reservoir. The extreme situation will occur when the inflow and outflow have an inviolable flow value of 14.5 m3∙s–1. The reservoir operator must maintain the flow regime, and a water loss will lower the water level. The daily demand was determined for the maximum intake of 0.8 m3∙s–1, which was equal to 69,120 m3∙day–1.
V d = 0.8 · 86400 = 69120   m 3 · day 1
A graph of the change in ΔH with filling is shown in Figure 11.
For the lowest ordinate of 116.00 m above sea level, the rate of precipitation is 4 mm per day, and for the ordinate corresponding to the normal damming level (120.00 m above sea level), it is equal to 1.7 mm. Recharging the Kiełbaska Duża will occur during summer periods, when the reservoir is filled to a level between 119.00 and 120.00 m. For these periods, the rate of falling ΔH will vary from 1.7 to 2 mm·d−1. It is worth noting that a change of 10 cm in the water table level—which can be experienced as a permanent change by the fauna of the protected area on the reservoir—requires 50 days of such a situation. Based on the presented analysis of the impact of water intake on the periodic recharging of the Kiełbaska Duża River, it was shown to have a minimal impact on the water management of the Jeziorsko Reservoir and consequently on the Natura 2000 protected areas.

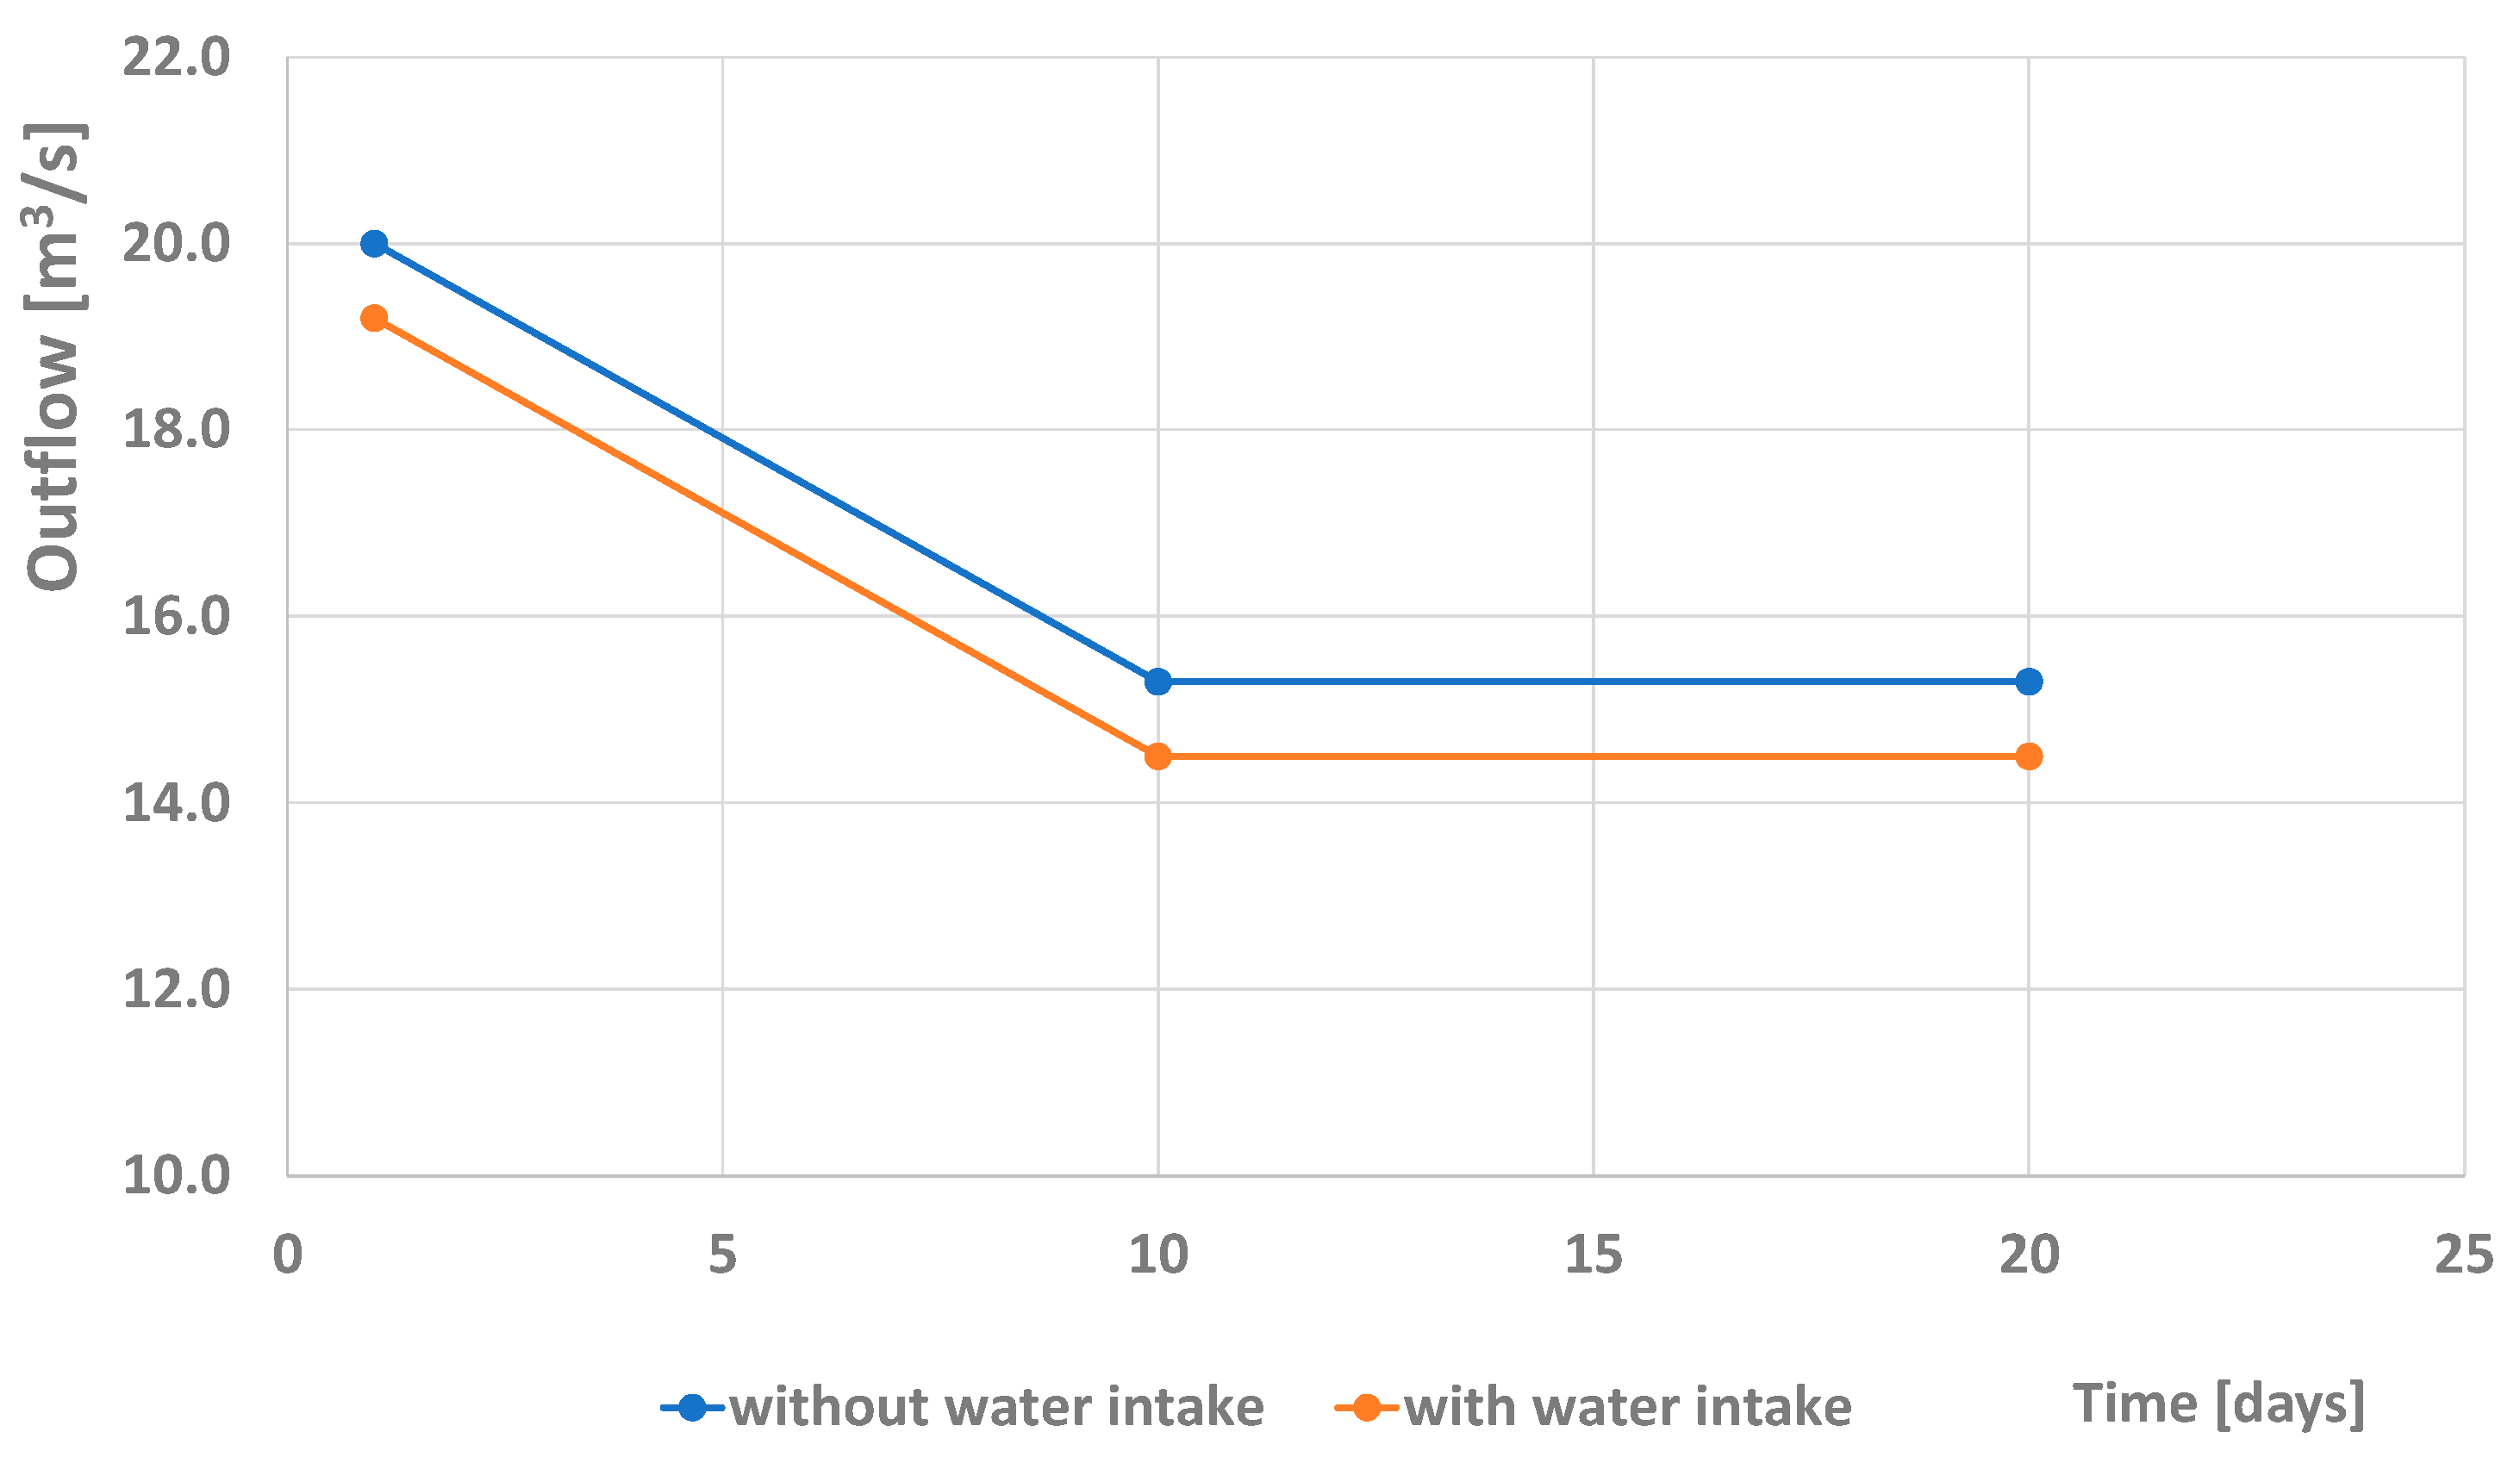
3.3. Impact of Water Intake for the Purpose of Recharging the Kielbasa Duża River on the Section of the Warta River Below the Head Dam of the Jeziorsko Reservoir, Including Natura 2000 Sites

According to the Water Management Manual, a constant level of damming is maintained on the reservoir from 16 April to 15 September, which is not higher than the normal damming level. Following the manual, the operator provides an inviolable flow Qn or higher resulting from the demand by the industry or other areas of the economy. During this period, water intake for recharging the Kiełbaska Duża River does not affect areas located below the Jeziorsko Reservoir. Any impact may occur when the inflow to the reservoir Qi slightly exceeds the outflow. Then, the loss associated with water intake will affect the amount of water discharge from the reservoir QJ, which will be lower than the inflow. For example, in 2019, the normal damming level in the reservoir was achieved (H = 120 m a.s.l), but as early as 28 June, the inflow to the reservoir was lower than the outflow, as a result of which the Warta River was recharged by reservoir retention (Figure 12).
Analyses were carried out assuming that the intake would occur in the most unfavorable scenario of a slight exceedance of the inflow value (by 0.8 m3∙s–1). Under these conditions, the inflow to the reservoir will be 15.3 m3∙s–1 and the outflow will correspond to the inviolable flow value of 14.5 m3∙s–1. At the same time, there will be an intake of water for the purpose of recharging the catchment area of the Kiełbaska Duża River at a maximum rate of 0.8 m3∙s–1.
To determine the impact of water abstraction for the purpose of recharging the Kiełbaska Duża on the section of the Warta River below the head dam of the Jeziorsko Reservoir, including Natura 2000 areas, an analysis was conducted of the effect of reducing the water discharge from a value of 15.3 to 14.5 m3∙s–1 on the levels of the Warta River at cross-sections located near the protected areas. For this purpose, the SPRuNeR numerical transient flow model was used. The model was used for calculating the two variants of the reservoir outflow schedules shown in Figure 13. It was assumed that the calibrated numerical model would provide a sufficiently accurate representation of the relative quantitative variations in both water levels and flow rates along the modeled river reach. On this basis, the model was used to simulate the potential impact of water intake scenarios under hydrologically unfavorable conditions.
Due to the lack of observational data corresponding to the assumed extreme scenario, a direct validation of the simulation results against field measurements was not feasible. However, under the premise that the model consistently captures relative changes across different conditions, the simulation output was considered reliable for comparative analysis.
Moreover, it was assumed that any potential systematic errors in model outputs remain uniform across all scenarios, which supports a robust comparative interpretation of the results. This approach allowed for a quantitative assessment of the differences between scenarios and the identification of potential risks associated with water intake in sensitive ecological areas.
The boundary conditions were the hydrograph of flows in the cross-section of the Jeziorsko Reservoir head dam (upper condition) and the hydrograph of levels in the cross-section of km 206 + 300 (lower boundary condition). The model was tared for historical flood surges and waves (including 2010 and 2019).
For the purpose of the analysis, the cross-sections were selected that are located in the section between the water gauge in Uniejów (km 466 + 600) and the mouth of the Ner River (km 445 + 030). As mentioned earlier, the Middle Varta Valley bird protection area extends from 473 + 300 to 322 + 770 km of the Warta River, 9.2 km below the tributary of the Lutynia River, which flows into the Warta at 331 + 970 km. Cross-sections 445 + 423, 447 + 769, and 447 + 769 are located within protected areas. Hence, they represent instances of determining the environmental impact of additional water intake on the water levels of the Warta River. The section above the first major tributary, which is the Ner, was selected because the additional volume of water supplied to the Warta River through tributaries will offset the impact of the lower discharge from the reservoir. Figure 14 shows the hydrographs of the levels in cross-section 445 + 423 for both hypothetical variants of the Jeziorsko Reservoir outflow.
Graphs similar to those in Figure 14 can be obtained for each computational section, forming a numerical model of transient flows. For the aforementioned three cross-sections, aggregate results were compiled in the form of the average level from the modeled period and the maximum ordinate difference for each variant. The results are shown in Table 5.
Both the average values in the simulation period and the minimum conditions differ for the two variants by ca. 2 cm. Of course, these differences will decrease as the flow rate increases because the percentage of flow reduction in the total outflow will decrease.
The presented analyses of the impact of water intake on the periodic recharging of the Kiełbaska Duża River indicate that it has minimal impact on lowering levels in the Warta below the head dam. A possible maximum 2 cm lowering of the water table ordinates in the cross-sections of the Warta River will occur in the section above the larger tributary. The hypothetical situation shown is highly unlikely due to the functions of the reservoir, which in low-flow periods recharges the Warta River with a flow greater than the inviolable flow.

4. Discussion

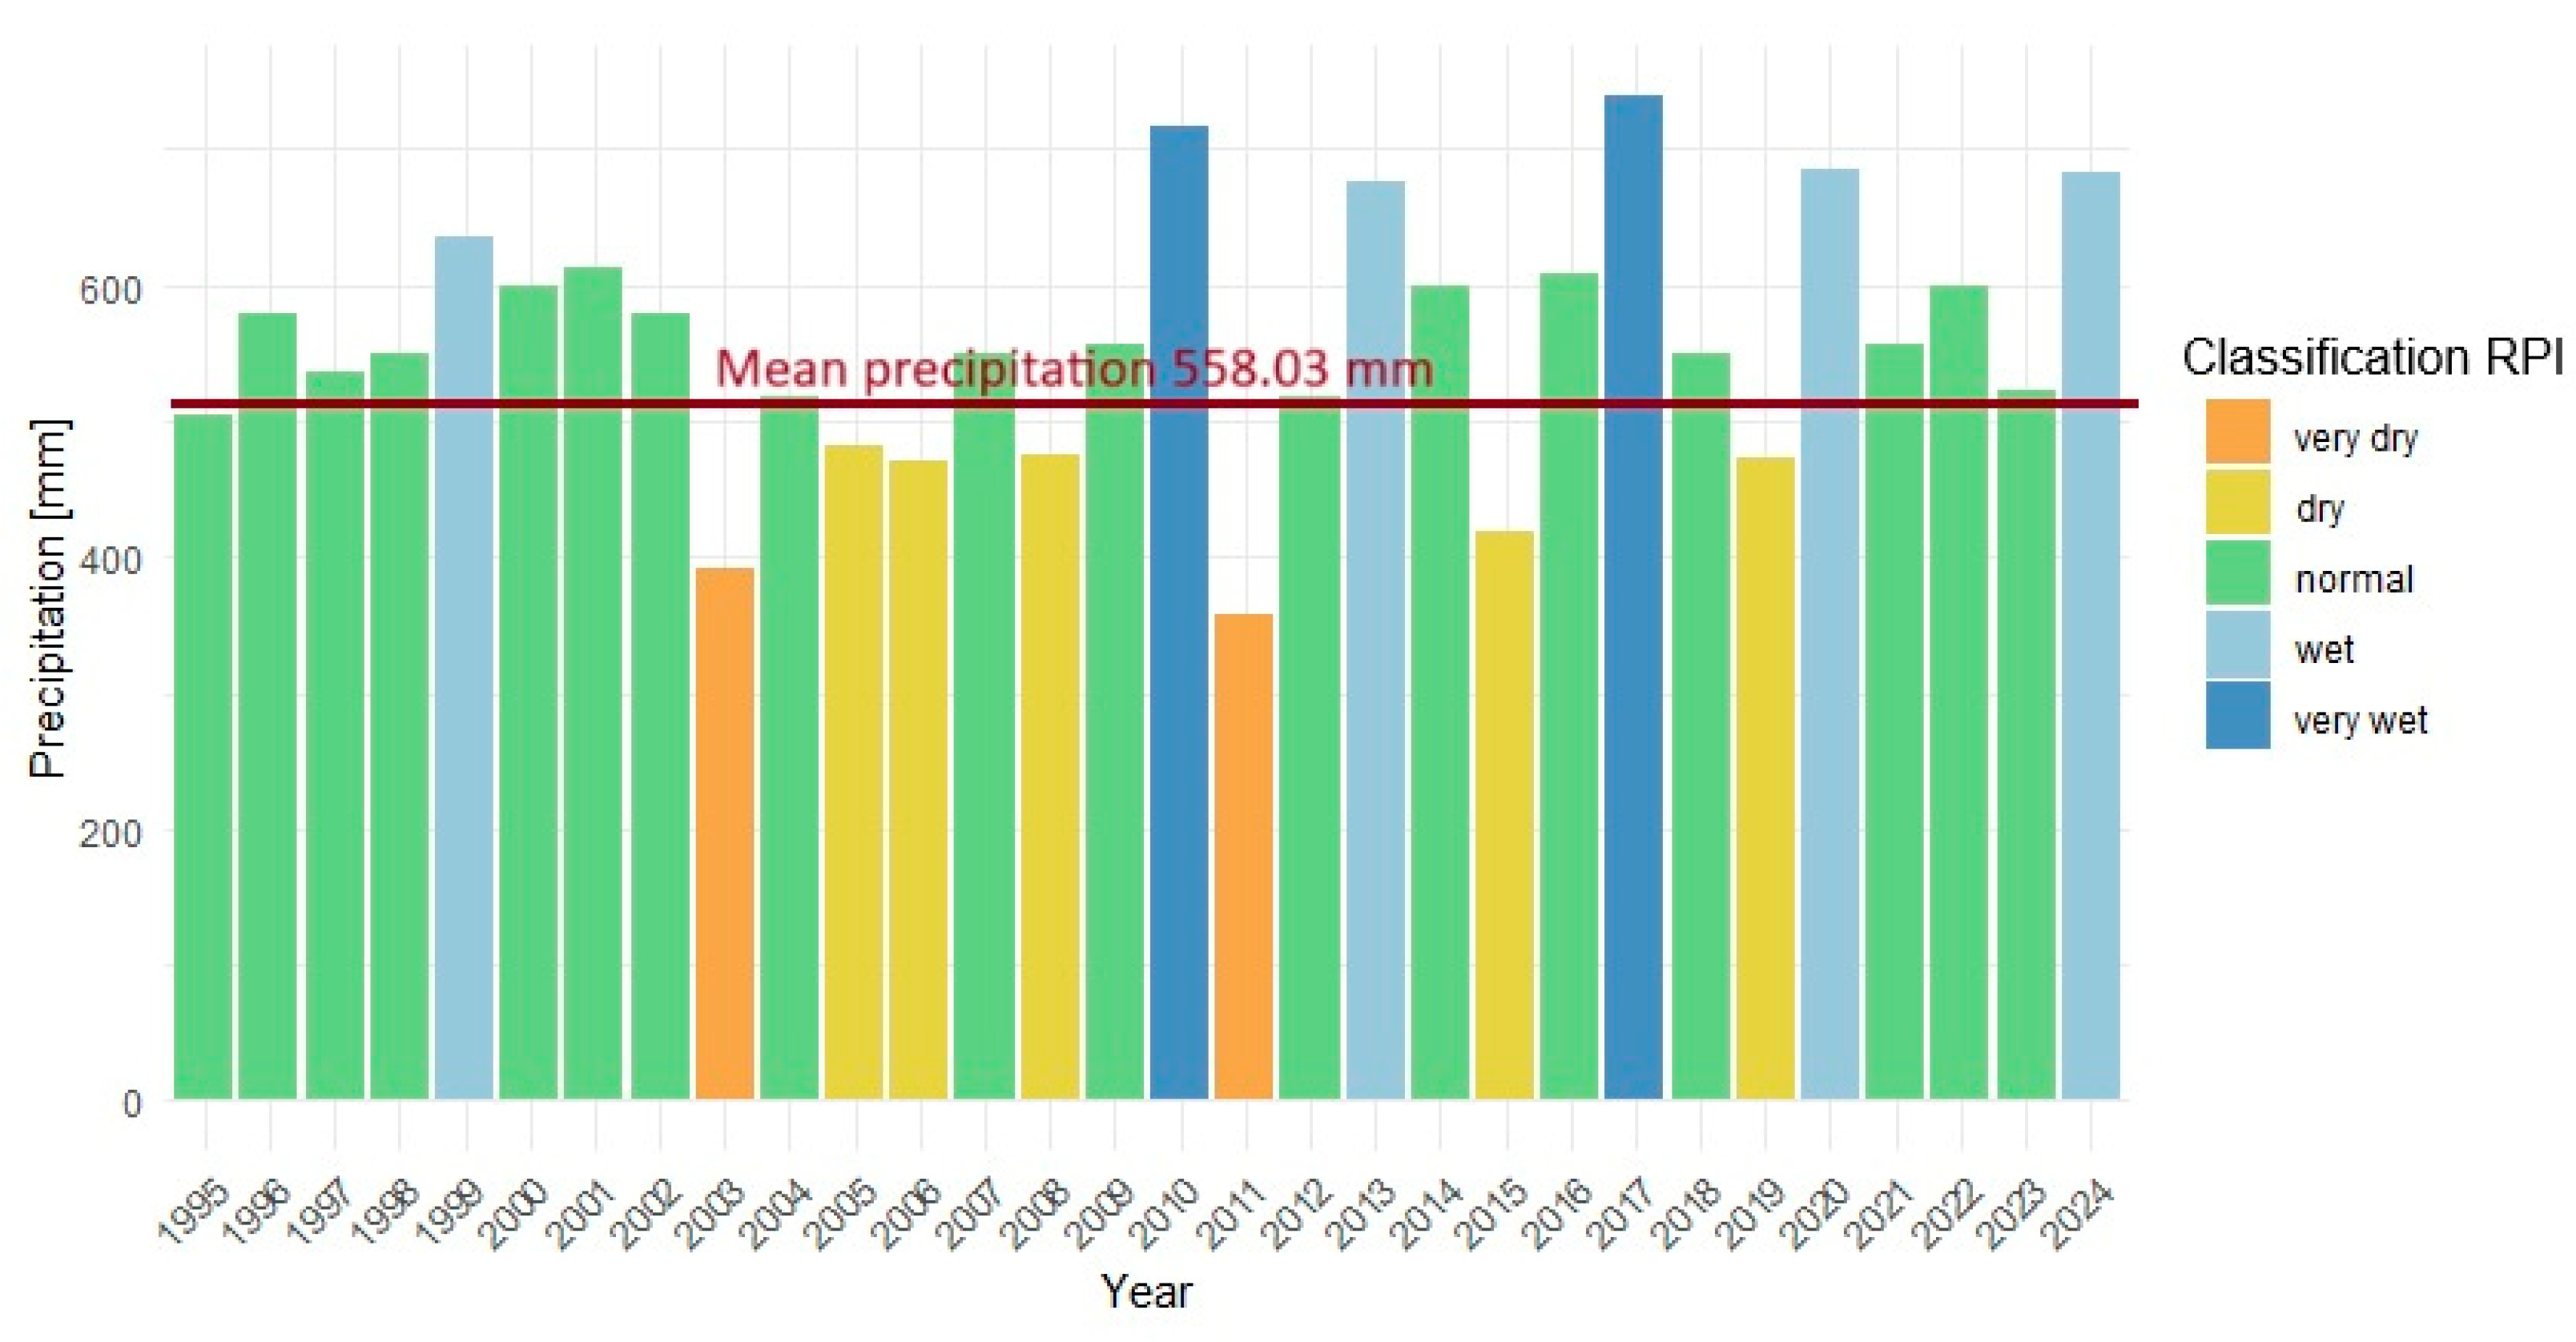
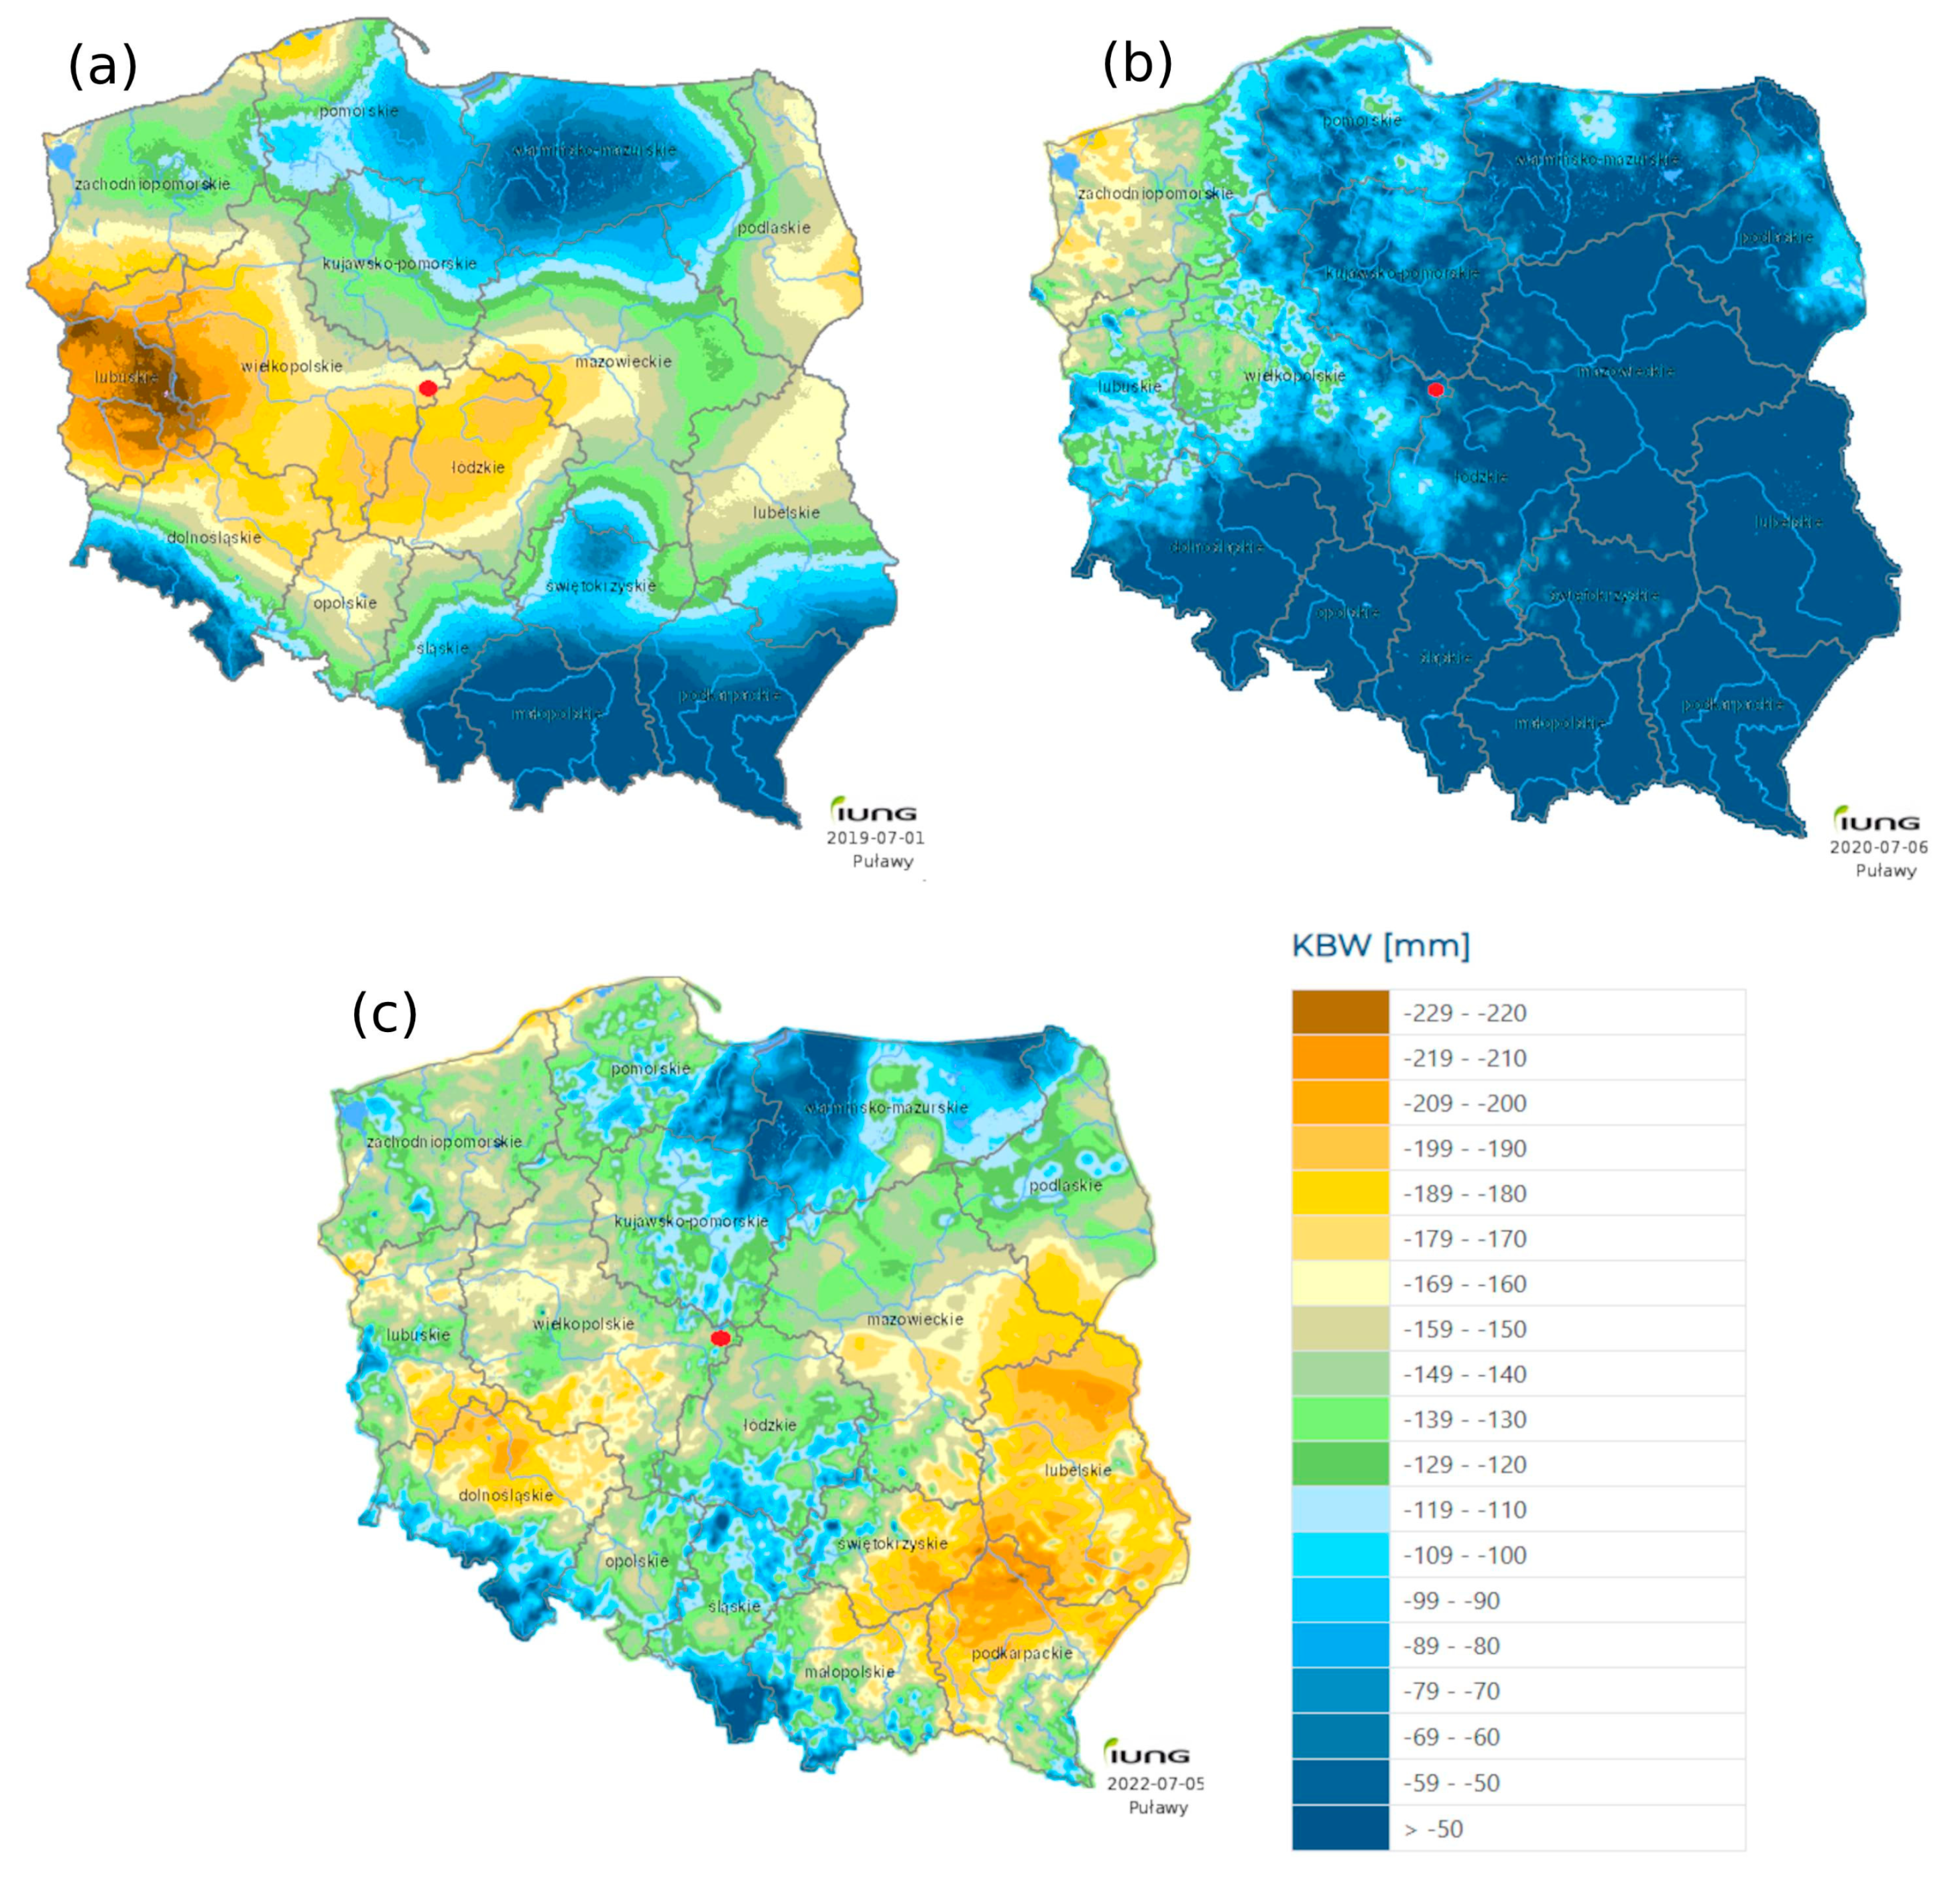
4.1. Water and Climate Pressures in Central Poland

Poland is a country with limited water resources—in 2020, it ranked 24th in Europe in terms of renewable freshwater resources per capita. The average water resources in Poland amount to only 1600 m3 per person per year with a European average of 4011 m3 [38]. According to the UN classification, Poland is below the water security level [39], which means that water availability can be a barrier to economic development and environmental protection. For Poland, the variability in water resources in time and space is particularly important, with the largest precipitation deficits recorded in central Poland, including in the studied catchment area of the Kiełbaska Duża River [40]. These deficits can affect protected areas as well as the ability of the economy to function and grow. This also applies to the power sector. In low-flow and drought conditions (which are increasingly frequent as a result of climate change), power plants are becoming susceptible to operational constraints and even outages [41]. For example, between 2000 and 2015, 42 instances were recorded in the US of power plant operation restrictions due to cooling water shortages [42]. In Poland, such cases concerned such power plants as Kozienice and Połaniec, where power units were shut down due to high water temperatures on the one hand and very low flows on the other [43,44].
Analysis of data from the IMGW precipitation station in Dobra (1995–2024) indicated that the average annual precipitation in the area of the planned project was 558 mm, with strong variability between the years—from a minimum of 357.5 mm (2011) to a maximum of 739.1 mm (2017). Based on the relative precipitation index (RPI), it was found that as many as 7 years in the studied period could be classified as dry (including 2 extremely dry years) (Figure 15) [45].
Similar results were obtained in a study of the long-term variability in precipitation at the neighboring Koło meteorological station (1966–2020), where the highest recorded precipitation was 672.2 mm, the lowest was 436.3 mm, and the average was 555.7 mm [46].
The Climatic Water Balance, which reflects the relationship between precipitation and evaporation, illustrates that the catchment of the Kiełbaska Duża River experiences regular water deficits—from 180 mm in a dry year to 50 mm in a wet year (prepared by IUNG-PIB, 2023) (Figure 16). These deficits lead to the occurrence of agricultural droughts and have a direct impact on both industrial development opportunities and the local water environment.
In the future, changes in precipitation—including not only annual and seasonal totals but also the frequency of heavy rainfall and prolonged dry periods—will significantly affect hydrological conditions and water quality in the analyzed area. In central Poland, climate change scenarios based on Representative Concentration Pathways (RCPs) ranging from RCP 2.6 (assuming reduced emissions growth) to RCP 8.5 (assuming continued high emissions) have been considered. According to Ghazi [47], under RCP 2.6, a slight increase in annual precipitation of about 3% may occur by 2026–2050, rising to over 6% by the end of the century.
However, since this scenario is increasingly considered unrealistic, more attention is given to RCP 4.5 and RCP 8.5. Pińskwar and Choryński [48] analyzed potential changes in precipitation indices for these trajectories. Their results indicate a substantial increase in annual precipitation under both scenarios, particularly under RCP 8.5 in the late 21st century. At the same time, the duration of dry periods—defined as days with precipitation below 1 mm and temperatures above 30 °C—may increase significantly. In central Poland, such periods could extend by more than 10 days in 2071–2100 under RCP 8.5 and already by about 5 days in 2021–2050 under RCP 4.5. O’Keeffe [49] estimated the impact of climate change on the hydrology of Natura 2000 wetland habitats in Poland’s major river basins. Their findings suggest that depending on the baseline hydrological conditions, future changes could result in either drying or excessive water in these environments.
The planned power plant may also be indirectly affected by changes in thermal and wind conditions. This includes increased energy demand, reduced wind power generation, and challenges related to the discharge of heated cooling water into natural receivers. According to Graczyk [50], the number of days with such operational difficulties may rise by 10–15 in central Poland by 2021–2050, regardless of the Shared Socioeconomic Pathway (SSP) considered. For SSP 8.5, by 2071–2100, the number of hot days (≥30 °C) with low wind speeds (≤4 m/s) could increase by 30–40 compared to 1971–2000.

4.2. Water Demand in the Energy Sector

The power sector is one of the most land- and water-intensive sectors of the economy, impacting the environment not only through emissions but also by changing the water balance [51,52]. Flow-cooled power plants draw huge amounts of water from local watercourses, returning it at elevated temperatures, which adversely affects aquatic organisms and their habitats [53]. Alternatively, closed-loop cooling systems reduce water intake by about 95% but increase total water consumption due to evaporation [54]. The increase in demand for energy and the development of cooling technologies are increasing water consumption in the power sector [55,56]. Analyses of the impact of shortages of cooling water on energy costs have shown that under climate change scenarios, annual costs in Great Britain alone have reached as much as GBP 200 million [57]. This means that the pressure on water resources will increase, and conflicts between the power sector and natural conservation will intensify.
In the catchment area of the Kiełbaska Duża River, a system has been developed to utilize surface water resources from neighboring catchments by transferring water from the Warta River catchment area, via the Teleszyna River, to the Kiełbaska Duża River catchment area. Although analyses [58] have shown that, under the assumptions made, the amount of water in the Kiełbaska Duża riverbed is sufficient to cover the demand of the planned gas and steam power plant, the investor (BGP) considered the possibility of the random variability in water resources and provided for the possibility of pumping water from the Jeziorsko Reservoir. This method of power supply was already in use during the operation of the previously operating coal-fired power plant. The hydrotechnical infrastructure in the catchment area of the Kiełbaska Duża and Teleszyna Rivers—including canals, reservoirs, and pumping stations—has already been prepared and is available [58]. The largest volume of water pumped during the 2006–2023 multi-year period was recorded in 2009, namely, about 6.8 hm3 (Figure 17). The annual average value from 2006 to 2017 was about 4 hm3, which corresponds to an average flow of 0.13 m3∙s–1. In comparison, the maximum value specified in the water permit for water transfer is 0.8 m3∙s–1. Water pumping virtually ceased after the closure of the power plant—the only exception was in 2023, when about 300,000 m3 of water was transported to feed the catchment area of the Kiełbaska Duża River and flood the inactive lignite open pits.

4.3. Hydrological and Water Quality Pressures on Protected Areas

Although hydraulic modeling indicates that the impact of water intake from the Jeziorsko Reservoir is minimal, even slight hydrological changes can have cumulative and nonlinear effects on sensitive ecosystems. In areas protected under the Natura 2000 network, such as the Jeziorsko Reservoir (PLB100002) and the Middle Warta Valley (PLB300002), the proper functioning of habitats for protected bird species (e.g., Chlidonias niger, Recurvirostra avosetta) and amphibians depends on maintaining stable water levels and a natural rhythm of seasonal flooding. Minor reductions in water levels or changes in the timing of flows may limit access to foraging and breeding grounds in shallow floodplain zones. Prolonged low-flow periods can intensify eutrophication, raise water temperatures, and lower oxygen concentrations, thus negatively impacting aquatic fauna and wetland vegetation [59,60,61]. These effects are often underestimated if environmental assessments are based only on average flow parameters, without taking into account ecological thresholds and specific habitat requirements [60].
In addition, periodic or long-term alterations in flow regimes can disrupt ecological connectivity and natural succession processes, particularly in semi-natural floodplain areas. A reduced frequency of overbank flooding weakens sediment and nutrient exchange, impairing the regeneration capacity of riparian forests and oxbow lakes [61]. Hydrological stress can also facilitate the spread of invasive species, altering the species composition of riparian plant communities and leading to biodiversity decline [62]. The resistance of Natura 2000 sites to such pressures depends not only on the direct intensity of hydrological changes but also on their interactions with land use, climate variability, and upstream water management. Therefore, integrating ecological flow assessments and habitat monitoring is crucial to fulfill the requirements of the Birds and Habitats Directives and to enable adaptive ecosystem management under changing climate conditions [59,60].
Large water intake by power plants can also translate into threats to protected areas, including Natura 2000. This manifests through lowered groundwater levels, and changes in the hydrographic network [52]. Wetland habitats fed by groundwater and surface water are particularly sensitive. Their future depends on maintaining a stable water regime, and climate change could lead to both drying up and flooding [49,63]. In the case of the operation of the old Adamów Power Plant, the indirect local impact of the plant was due to the need to expand the lignite mine in this area. With the abandonment of this technology and the start of open-pit flooding, the process began to reverse [58]. Nevertheless, owing to the planned construction of the steam and gas unit and potential water transfers, it was important to conduct detailed hydrological analyses of the impact of water intake on environmentally valuable areas, even those not in the immediate vicinity of the project. Another problem is the quality of water discharged into the river, which was previously used for cooling. Kuznetsov and Biedunkova described the quality of water in the Styr River in the RNPP discharge zone as “very good” in terms of its condition and “clean” in terms of its degree of purity [64].

5. Conclusions

Regarding the planned investment in the Adamów Power Plant, the analyses carried out are crucial for assessing its potential impacts on ecosystems protected under the Natura 2000 network, especially the Middle Warta Valley (PLB300002) and the Jeziorsko Reservoir (PLB100002). The results of this study provide critical information on the hydrological situation of the Warta River and the possible impacts of water intake for the purpose of recharging the Kiełbaska Duża River.
This study presented a detailed hydrological analysis of the section of the Warta River from the Jeziorsko Reservoir to Konin, with a focus on the occurrence of low-flow periods in 2018–2022. This study provides a comprehensive picture of the variability in flows and water resources at three key water gauge profiles: Uniejów, Koło, and Sławsk. Analysis of the flow data, including annual averages and extreme flow values, allowed us to identify significant trends and differences in the course of low-flow periods along the analyzed section of the river. The application of the POT method alongside the Q70% threshold allowed for a precise assessment of the frequency, duration, and seasonal variation in low-flow events. The hydrological year 2020 stood out due to pronounced water deficits while simultaneously offering useful insight into flow dynamics under drought stress. We found that in the Uniejów profile, the average duration of low-flow periods was 41 days, in Koło it was 32 days, and in Sławsk it was 35 days, indicating varied but spatially consistent trends in low-flow periods.
Analysis of the volume of water retained in the Jeziorsko Reservoir allowed for quantitative estimation of the impact of additional water intakes on the water table level in the reservoir. It was calculated that a maximum withdrawal of 0.8 m3⋅s–1 would result in a minimal daily water level reduction in the reservoir, estimated at approximately 2 mm. The presented analyses of water intake for the periodic recharging of the Kiełbaska Duża River indicate that it has minimal impact on the water management of the Jeziorsko Reservoir and on the lowering of levels in the Warta below the head dam. The daily lowering of the water table in the reservoir resulting from this intake, on the order of millimeters, does not affect the biota living in the Jeziorsko Reservoir. A theoretical drop of up to 2 cm in the Warta River’s water table may take place directly downstream from the Jeziorsko Reservoir. This impact is largely mitigated by the presence of larger tributaries, notably the Ner and Prosna Rivers. The hypothetical situation shown is highly unlikely due to the functions of the reservoir, which, in low-flow periods, recharges the Warta River with a flow greater than the inviolable flow.
Although the planned energy project appears to have a limited influence on water transfer, the observed hydrological patterns—especially those showing low-flow trends—highlight the necessity for responsible water use and mitigation strategies to protect the environment. This study offers valuable insights into how hydrological patterns influence broader sustainability goals, especially in regions exposed to water stress. These results emphasize the necessity of coordinating energy production with nature conservation while also identifying practical solutions—both technical and managerial—that balance environmental needs with industrial development.

Author Contributions

Conceptualization, T.K., J.K., I.L. and M.H.; methodology, T.K., I.L., J.K., M.H., E.J.-K. and S.Z.; software, T.K., J.K., I.L., M.H., E.J.-K. and S.Z.; validation, T.K., J.K., M.H., E.J.-K. and S.Z.; formal analysis, T.K., J.K. and M.H.; investigation, T.K., J.K., M.H., E.J.-K. and S.Z.; resources, T.K.; writing—original draft preparation, T.K., I.L., J.K., M.H., E.J.-K. and S.Z.; writing—review and editing, T.K., J.K., M.H., E.J.-K. and S.Z.; visualization, T.K., I.L., J.K., M.H., E.J.-K. and S.Z.; supervision, T.K.; project administration, T.K.; funding acquisition, T.K. All authors have read and agreed to the published version of the manuscript.

Funding

This research received no external funding.

Data Availability Statement

The original contributions presented in this study are included in the article. Further inquiries can be directed to the corresponding author.

Conflicts of Interest

The authors declare no conflicts of interest.

List of Abbreviations and Acronyms

Abbreviations and AcronymsExplanation
EUEuropean Union
UNUnited Nations Organization
IUNG-PIBInstitute of Soil Science and Plant Cultivation (in Polish, Instytut Uprawy Nawożenia i Gleboznawstwa)
IMGW PIBInstitute of Meteorology and Water Management, State Research Institute (in Polish, Instytut Meteorologii i Gospodarki Wodnej, Państwowy Instytut Badawczy)
ZE PAK S.A.Pątnów-Adamów-Konin Power Plant Complex (in Polish, Zespół elektrowni Pątnów-Adamów-Konin)
RNPPRivne Nuclear Power Plant
RESRenewable Energy Sources
BGPGas and steam unit (in Polish, Blok Gazowo-Parowy)
CCGTCombined cycle gas turbine
PL (18334)Code of catchment area of river (number of area)
PLB (100002, 300002)Code of special area of bird protection (number of area)
PLH (300009, 100006)Code of special area of habitat protection (number of area)
AMAnnual maximum
Q70%Discharge with a 70% probability of occurrence [m3∙s–1]
NNQLowest flow rate of minimum annual values [m3∙s–1]
SNQAverage flow rate of minimum annual values [m3∙s–1]
WNQHighest flow rate of minimum annual values [m3∙s–1]
NSQLowest flow rate of average annual values [m3∙s–1]
SSQAverage flow rate of average annual values [m3∙s–1]
WSQHighest flow rate of average annual values [m3∙s–1]
NWQLowest flow rate of maximum annual values [m3∙s–1]
SWQAverage flow rate of maximum annual values [m3∙s–1]
WWQHighest flow rate of maximum annual values [m3∙s–1]
QiDischarge inflow to the reservoir [m3∙s–1]
QJDischarge from the reservoir [m3∙s–1]
HNormal damming level in the reservoir was achieved
POTPeak Over Threshold
RCPsRepresentative Concentration Pathways
SSPShared Socioeconomic Pathway

References

  1. Kałuża, T.; Hämmerling, M.; Zawadzki, P.; Czekała, W.; Kasperek, R.; Sojka, M.; Mokwa, M.; Ptak, M.; Szkudlarek, A.; Czechlowski, M.; et al. The Hydropower Sector in Poland: Historical Development and Current Status. Renew. Sustain. Energy Rev. 2022, 158, 112150. [Google Scholar] [CrossRef]
  2. Kałuża, T.; Hämmerling, M.; Zawadzki, P.; Czekała, W.; Kasperek, R.; Sojka, M.; Mokwa, M.; Ptak, M.; Szkudlarek, A.; Czechlowski, M.; et al. The Hydropower Sector in Poland: Barriers and the Outlook for the Future. Renew. Sustain. Energy Rev. 2022, 163, 112500. [Google Scholar] [CrossRef]
  3. Kundzewicz, Z.W.; Piniewski, M.; Mezghani, A.; Okruszko, T.; Pińskwar, I.; Kardel, I.; Hov, Ø.; Szcześniak, M.; Szwed, M.; Benestad, R.E.; et al. Assessment of Climate Change and Associated Impact on Selected Sectors in Poland. Acta Geophys. 2018, 66, 1509–1523. [Google Scholar] [CrossRef]
  4. Bartholomeus, R.P.; Van Der Wiel, K.; Van Loon, A.F.; Van Huijgevoort, M.H.J.; Van Vliet, M.T.H.; Mens, M.; Muurling-van Geffen, S.; Wanders, N.; Pot, W. Managing Water across the Flood-Drought Spectrum—Experiences from and Challenges for the Netherlands. Camb. Prisms Water 2023, 1, e2. [Google Scholar] [CrossRef]
  5. Carrão, H.; Naumann, G.; Barbosa, P. Global Projections of Drought Hazard in a Warming Climate: A Prime for Disaster Risk Management. Clim. Dyn. 2018, 50, 2137–2155. [Google Scholar] [CrossRef]
  6. Da Silva Junior, O.M.; Dos Santos, M.A.; Szlafsztein, C.F.; Gomez, J.M.A.; Pereira, J.P. Protected Areas as Strategies for Preserving Vegetation Cover in the Vicinity of Hydroelectric Projects in the Brazilian Amazon. Energy Sustain. Soc. 2018, 8, 33. [Google Scholar] [CrossRef]
  7. Naumann, G.; Alfieri, L.; Wyser, K.; Mentaschi, L.; Betts, R.A.; Carrao, H.; Spinoni, J.; Vogt, J.; Feyen, L. Global Changes in Drought Conditions Under Different Levels of Warming. Geophys. Res. Lett. 2018, 45, 3285–3296. [Google Scholar] [CrossRef]
  8. Pińskwar, I.; Choryński, A.; Kundzewicz, Z.W. Severe Drought in the Spring of 2020 in Poland—More of the Same? Agronomy 2020, 10, 1646. [Google Scholar] [CrossRef]
  9. Szałkiewicz, E.; Kałuża, T.; Grygoruk, M. Environmental Flows Assessment for Macroinvertebrates at the River Reach Scale in Different Degrees of Hydromorphological Alteration. Front. Environ. Sci. 2022, 10, 866526. [Google Scholar] [CrossRef]
  10. Kuznietsov, P.M.; Biedunkova, O.O.; Yaroschuk, O.V.; Pryshchepa, A.M.; Antonyuk, O.O. Analysis of the Impact of Water Use and Consumption for a Nuclear Power Plant on Alterations in the Hydrological and Temperature Regimes of a River: A Case Study. IOP Conf. Ser. Earth Environ. Sci. 2024, 1415, 012100. [Google Scholar] [CrossRef]
  11. Alamanos, A.; Mylopoulos, N.; Loukas, A.; Gaitanaros, D. An Integrated Multicriteria Analysis Tool for Evaluating Water Resource Management Strategies. Water 2018, 10, 1795. [Google Scholar] [CrossRef]
  12. Hämmerling, M.; Kałuża, T.; Zawadzki, P.; Zaborowski, S.; Sojka, M.; Liberacki, D.; Ptak, M. Application of Multi-Criteria Analytic Methods in the Assessment of the Technical Conditions of Small Hydraulic Structures. Buildings 2022, 12, 115. [Google Scholar] [CrossRef]
  13. Pratiwi, S.; Juerges, N. Review of the Impact of Renewable Energy Development on the Environment and Nature Conservation in Southeast Asia. Energy Ecol. Environ. 2020, 5, 221–239. [Google Scholar] [CrossRef]
  14. Macknick, J.; Sattler, S.; Averyt, K.; Clemmer, S.; Rogers, J. The Water Implications of Generating Electricity: Water Use across the United States Based on Different Electricity Pathways through 2050. Environ. Res. Lett. 2012, 7, 045803. [Google Scholar] [CrossRef]
  15. Ma, Y.; Gopal, S.; Ma, X.; Gallagher, K.; Koch, M.; Kaufman, L. The Deforestation and Biodiversity Risks of Power Plant Projects in Southeast Asia: A Big Data Spatial Analytical Framework. Sustainability 2023, 15, 14461. [Google Scholar] [CrossRef]
  16. Rüland, J. The Long Shadow of the Developmental State: Energy Infrastructure and Environmental Sustainability in Southeast Asia. Third World Q. 2023, 44, 1269–1287. [Google Scholar] [CrossRef]
  17. Ng, C.; White, T.; Katariya, V.; Pollard, E. Geothermal Power Generation and Biodiversity: The Business Case for Managing Risk and Creating Opportunity. In Proceedings of the World Geothermal Congress, Online, 26 April–1 May 2020; p. 1. [Google Scholar]
  18. Dhar, A.; Naeth, M.A.; Jennings, P.D.; Gamal El-Din, M. Geothermal Energy Resources: Potential Environmental Impact and Land Reclamation. Environ. Rev. 2020, 28, 415–427. [Google Scholar] [CrossRef]
  19. Santangeli, A.; Toivonen, T.; Pouzols, F.M.; Pogson, M.; Hastings, A.; Smith, P.; Moilanen, A. Global Change Synergies and Trade-offs between Renewable Energy and Biodiversity. GCB Bioenergy 2016, 8, 941–951. [Google Scholar] [CrossRef]
  20. Kalbarczyk, E.; Kachlicka, B. Możliwości Realizacji Inwestycji z Zakresu Energetyki Odnawialnej Na Obszarach Chronionych w Polsce–Aspekt Prawny i Społeczny. Rozw. Reg. Polityka Reg. 2016, 34, 33–44. [Google Scholar] [CrossRef]
  21. Turney, D.; Fthenakis, V. Environmental Impacts from the Installation and Operation of Large-Scale Solar Power Plants. Renew. Sustain. Energy Rev. 2011, 15, 3261–3270. [Google Scholar] [CrossRef]
  22. Brook, B.W.; Bradshaw, C.J.A. Key Role for Nuclear Energy in Global Biodiversity Conservation: Biodiversity and Sustainable Energy. Conserv. Biol. 2015, 29, 702–712. [Google Scholar] [CrossRef] [PubMed]
  23. Jackson, A.L.R. Renewable Energy vs. Biodiversity: Policy Conflicts and the Future of Nature Conservation. Glob. Environ. Change 2011, 21, 1195–1208. [Google Scholar] [CrossRef]
  24. Winiecki, A.; Mielczarek, S. Awifauna Lęgowa OSO Dolina Środkowej Warty-Stan Współczesny i Zmiany w Latach 1975–2015. Ornis Pol. 2018, 59, 17–55. [Google Scholar]
  25. Kasztelewicz, Z.; Kaczorowski, J.; Mazurek, S.; Orlikowski, D.; Żuk, S. Stan Obecny i Strategia Rozwoju Branży Węgla Brunatnego w I Połowie XXI Wieku w Polsce. Gór. Geoinżynieria 2009, 33, 213–231. [Google Scholar]
  26. Orlikowski, D.; Szwed, L. Zagospodarowanie Terenów Pogórniczych KWB” Adamów” SA w Turku-Krajobraz Przed Rozpoczęciem Działalności Górniczej i Po Jej Zakończeniu. Gór. Geoinżynieria 2011, 35, 225–240. [Google Scholar]
  27. Gawlik, L.; Mokrzycki, E. Fossil Fuels in the National Power Sector-Problems and Challenges. Polityka Energ. Policy J. 2017, 20, 5–25. [Google Scholar]
  28. Kaleta, Ł.; Śluzar, J. Raport o Oddziaływaniu Na Środowisko Przedsięwzięcia Pod Nazwą: „Budowa Bloku CCGT Klasy 600MWe Wraz z Infrastrukturą Towarzyszącą Na Terenie Elektrowni Adamów”.
  29. Nature Protection Act of 16 April 2004, Journal of Laws 2024, Item 1478. Available online: https://dziennikustaw.gov.pl/D2024000147801.pdf (accessed on 10 May 2025).
  30. Regulation of the Minister of the Environment of January 12, 2011 on Special Bird Protection Areas, Issue 25, Item 133. Available online: https://dziennikustaw.gov.pl/DU/2011/s/25/133 (accessed on 10 May 2025).
  31. Vlach, V.; Ledvinka, O.; Matouskova, M. Changing Low Flow and Streamflow Drought Seasonality in Central European Headwaters. Water 2020, 12, 3575. [Google Scholar] [CrossRef]
  32. Yevjevich, V.M. An Objective Approach to Definitions and Investigations of Continental Hydrologic Droughts; Colorado State University: Fort Collins, CO, USA, 1967; Volume 23. [Google Scholar]
  33. Tallaksen, L.M.; Van Lanen, H.A. Hydrological Drought: Processes and Estimation Methods for Streamflow and Groundwater. In Proceedings of the EGU General Assembly 2023, Vienna, Austria, 23–28 April 2023. [Google Scholar]
  34. Bezak, N.; Brilly, M.; Šraj, M. Comparison between the Peaks-over-Threshold Method and the Annual Maximum Method for Flood Frequency Analysis. Hydrol. Sci. J. 2014, 59, 959–977. [Google Scholar] [CrossRef]
  35. Rivera, J.A.; Araneo, D.C.; Penalba, O.C. Threshold Level Approach for Streamflow Drought Analysis in the Central Andes of Argentina: A Climatological Assessment. Hydrol. Sci. J. 2017, 62, 1949–1964. [Google Scholar] [CrossRef]
  36. Laks, I.; Modelling of River Network with Widespread Floodplain Valleys. Puls Inst Geophys Pol-Acad SC E-10 406 2008, 83–89. Available online: https://sh.igf.edu.pl/sh2008/program/prezent/Laks.pdf (accessed on 28 May 2025).
  37. Laks, I.; Kałuża, T.; Sojka, M.; Walczak, Z.; Wróżyński, R. Problems with Modelling Water Distribution in Open Channels with Hydraulic Engineering Structures. Rocz. Ochr. Srodowiska 2013, 15, 245–257. [Google Scholar]
  38. Marcinkowski, P.; Kardel, I.; Płaczkowska, E.; Giełczewski, M.; Osuch, P.; Okruszko, T.; Venegas-Cordero, N.; Ignar, S.; Piniewski, M. High-resolution Simulated Water Balance and Streamflow Data Set for 1951–2020 for the Territory of Poland. Geosci. Data J. 2023, 10, 195–207. [Google Scholar] [CrossRef]
  39. GUS: Rocznik Statystyczny Rzeczypospolitej Polskiej, Statistical Yearbook of the Republic of Poland 2021; Zakład Wydawnictw Statystycznych: Warszawa, Poland, 2021.
  40. Badora, D.; Wawer, R.; Król-Badziak, A.; Nieróbca, A.; Kozyra, J.; Jurga, B. Hydrological Balance in the Vistula Catchment under Future Climates. Water 2023, 15, 4168. [Google Scholar] [CrossRef]
  41. Bussi, G.; Whitehead, P.G. Impacts of Droughts on Low Flows and Water Quality near Power Stations. Hydrol. Sci. J. 2020, 65, 898–913. [Google Scholar] [CrossRef]
  42. McCall, J.; Macknick, J.; Macknick, J. Water-Related Power Plant Curtailments: An Overview of Incidents and Contributing Factors; 2016; p. NREL/TP--6A20-67084, 1338176. 2016. Available online: https://www.osti.gov/biblio/1338176 (accessed on 8 June 2025).
  43. Majchrzak, D.; Michalski, K.; Reginia-Zacharski, J. Readiness of the Polish Crisis Management System to Respond to Long-Term, Large-Scale Power Shortages and Failures (Blackouts). Energies 2021, 14, 8286. [Google Scholar] [CrossRef]
  44. Mikołajczyk, T.; Mikołajczyk, Ł.; Wawręty, R.; Skowronek, D.; Nowak, M. The Impact of Thermal Power Plants on Ichthyofauna; Towarzystwo na rzecz Ziemi; Pracownia na rzecz Wszystkich Istot: Kraków, Poland; Oświęcim: Bystra, Poland, 2020; ISBN 978-83-60106-16-7. [Google Scholar]
  45. Gąsiorek, E.; Musiał, E. Porównanie i Klasyfikacja Warunków Opadowych Na Podstawie Wskaźnika Standaryzowanego Opadu i Wskaźnika Względnego Opadu. Woda-Śr.-Obsz. Wiej. 2011, 11, 107–119. [Google Scholar]
  46. Araźny, A.; Kępińska-Kasprzak, M.; Łaszyca, E.Z.; Chmist-Sikorska, J.; Bartczak, A. Reference Evapotranspiration during the Growing Season in Poland (Central Europe) in Response to Ongoing Climate Changes (1966–2020). Int. J. Climatol. 2023, 43, 6505–6522. [Google Scholar] [CrossRef]
  47. Ghazi, B.; Przybylak, R.; Pospieszyńska, A. Projection of Climate Change Impacts on Extreme Temperature and Precipitation in Central Poland. Sci. Rep. 2023, 13, 18772. [Google Scholar] [CrossRef]
  48. Pińskwar, I.; Choryński, A. Projections of Precipitation Changes in Poland. In Climate Change in Poland; Falarz, M., Ed.; Springer Climate; Springer International Publishing: Cham, Switzerland, 2021; pp. 529–544. ISBN 978-3-030-70327-1. [Google Scholar]
  49. O’Keeffe, J.; Marcinkowski, P.; Utratna, M.; Piniewski, M.; Kardel, I.; Kundzewicz, Z.; Okruszko, T. Modelling Climate Change’s Impact on the Hydrology of Natura 2000 Wetland Habitats in the Vistula and Odra River Basins in Poland. Water 2019, 11, 2191. [Google Scholar] [CrossRef]
  50. Graczyk, D.; Pińskwar, I.; Choryński, A.; Stasik, R. Less Power When More Is Needed. Climate-Related Current and Possible Future Problems of the Wind Energy Sector in Poland. Renew. Energy 2024, 232, 121093. [Google Scholar] [CrossRef]
  51. Rokas, S.; Ktenidis, T.; Kondili, E.; Kaldellis, J.K. RES-Based Power Plants Siting Using Geographical Information Systems. In Proceedings of the 2011 International Conference on Clean Electrical Power (ICCEP), Ischia, Italy, 14–16 June 2011; pp. 283–288. [Google Scholar]
  52. Möckel, S. The European Ecological Network “Natura 2000” and the Appropriate Assessment for Projects and Plans under Article 6(3) of the Habitats Directive. Nat. Conserv. 2017, 23, 1–29. [Google Scholar] [CrossRef]
  53. Idowu, G.A.; Olonimoyo, E.A.; Idowu, A.M.; Aiyesanmi, A.F. Impact of Gas and Oil-Fired Power Plants on Proximal Water and Soil Environments: Case Study of Egbin Power Plant, Ikorodu, Lagos State, Nigeria. SN Appl. Sci. 2020, 2, 1352. [Google Scholar] [CrossRef]
  54. Mielke, E.; Anadon, L.D.; Narayanamurti, V. Water Consumption of Energy Resource Extraction, Processing, and Conversion; Energy Technology Innovation Policy Research Group Discussion Paper 2010–15; Belfer Center for Science and International Affairs, Harvard Kennedy School: Cambridge, MA, USA, 2010. [Google Scholar]
  55. Ando, N.; Yoshikawa, S.; Fujimori, S.; Kanae, S. Long-Term Projections of Global Water Use for Electricity Generation under the Shared Socioeconomic Pathways and Climate Mitigation Scenarios. Preprint 2017.
  56. IEA. World Energy Outlook 2013; IEA: Paris, France, 2013; Available online: https://www.iea.org/reports/world-energy-outlook-2013 (accessed on 28 May 2025).
  57. Byers, E.A.; Coxon, G.; Freer, J.; Hall, J.W. Drought and Climate Change Impacts on Cooling Water Shortages and Electricity Prices in Great Britain. Nat. Commun. 2020, 11, 2239. [Google Scholar] [CrossRef] [PubMed]
  58. Kałuża, T.; Kanclerz, J.; Hämmerling, M.; Janicka-Kubiak, E.; Zaborowski, S. Opportunities for the Transformation and Development of Power Plants Under Water Stress Conditions: Example of Adamów Power Plant. Energies 2024, 17, 6267. [Google Scholar] [CrossRef]
  59. Acreman, M.C.; Dunbar, M.J. Defining Environmental River Flow Requirements—A Review. Hydrol. Earth Syst. Sci. 2004, 8, 861–876. [Google Scholar] [CrossRef]
  60. Poff, N.L.; Richter, B.D.; Arthington, A.H.; Bunn, S.E.; Naiman, R.J.; Kendy, E.; Acreman, M.; Apse, C.; Bledsoe, B.P.; Freeman, M.C.; et al. The Ecological Limits of Hydrologic Alteration (ELOHA): A New Framework for Developing Regional Environmental Flow Standards. Freshw. Biol. 2010, 55, 147–170. [Google Scholar] [CrossRef]
  61. Bunn, S.E.; Arthington, A.H. Basic Principles and Ecological Consequences of Altered Flow Regimes for Aquatic Biodiversity. Environ. Manag. 2002, 30, 492–507. [Google Scholar] [CrossRef]
  62. Dudgeon, D.; Arthington, A.H.; Gessner, M.O.; Kawabata, Z.; Knowler, D.J.; Lévêque, C.; Naiman, R.J.; Prieur-Richard, A.; Soto, D.; Stiassny, M.L.J.; et al. Freshwater Biodiversity: Importance, Threats, Status and Conservation Challenges. Biol. Rev. 2006, 81, 163–182. [Google Scholar] [CrossRef]
  63. Kastridis, A.; Theodosiou, G.; Fotiadis, G. Investigation of Flood Management and Mitigation Measures in Ungauged NATURA Protected Watersheds. Hydrology 2021, 8, 170. [Google Scholar] [CrossRef]
  64. Kuznietsov, P.; Biedunkova, O. Evaluating the Impact of Dispersed Particles in the Water of a Power Plant Recirculating Cooling System on the Discharge of Suspended Solids into a Natural Water Body. East.-Eur. J. Enterp. Technol. 2023, 6, 6–16. [Google Scholar] [CrossRef]
Figure 1. Building site of the new gas and steam unit (BGP) in April 2025.
Energies 18 03079 g001
Figure 2. The location of the investment project on the site of the former power plant: 1—(red line) boundary of the new power plant; 2—main building of the BGPs; 3—water treatment and demineralization station; 4—pipeline supplying water; 5—equalizing reservoir; 6—surface water intake.
Energies 18 03079 g002
Figure 3. View of the upgraded water intake system for the new gas and steam unit (BGP). 4—pipeline supplying water; 5—equalizing reservoir; 6—surface water intake.
Energies 18 03079 g003
Figure 4. Study area.
Energies 18 03079 g004
Figure 5. View of the Miłkowice II pumping station from the side of the reservoir.
Energies 18 03079 g005
Figure 6. Analysis of the low-flow periods of the Warta River in the Uniejów profile—POT method for Q70% cutoff level.
Energies 18 03079 g006
Figure 7. Analysis of the low-flow periods of the Warta River in the Koło profile—POT method for Q70% cutoff level.
Energies 18 03079 g007
Figure 8. Analysis of the low-flow periods of the Warta River in the Sławsk profile—POT method for the Q70% cutoff level.
Energies 18 03079 g008
Figure 9. Seasonal distribution of low-flow periods in the Warta River from the Uniejów, Koło, and Sławsk water gauge profiles for the hydrological years 2018–2022.
Energies 18 03079 g009
Figure 10. Graph of the change in the volume of water needed for an increase of 1 cm in the water level in the Jeziorsko Reservoir.
Energies 18 03079 g010
Figure 11. The daily rate of fall in the water table in the Jeziorsko Reservoir due to intake for the purpose of recharging the Kielbasa Duża River, assuming no change in retention of the Warta River (tributary = outflow).
Energies 18 03079 g011
Figure 12. The course of the filling of the Jeziorsko Reservoir and inflows and outflows in 2019.
Energies 18 03079 g012
Figure 13. Hypothetical outflows from the Jeziorsko Reservoir constituting the upper boundary condition in the numerical model of transient flows.
Energies 18 03079 g013
Figure 14. Calculated hydrographs of water levels in cross-section 445 + 423 for both hypothetical variants of the outflow from the Jeziorsko Reservoir.
Energies 18 03079 g014
Figure 15. Annual precipitation totals for the hydrological years 1995-2024 from the Dobra precipitation station, along with RPI classification (data from the IMGW Dobra precipitation station).
Energies 18 03079 g015
Figure 16. Maps of the Climatic Water Balance of Poland for the period of 5 January–30 June in (a) the dry year of 2019, (b) the wet year of 2020, and (c) the average year of 2022, with the marked location (red dot) of the CCGT investment at the Adamów Power Plant site (source: prepared by IUNG-PIB, 2023).
Energies 18 03079 g016
Figure 17. Quantities of water pumped from the Jeziorsko Reservoir to the Kiełbaska Duża River (source: data of ZE PAK S.A.).
Energies 18 03079 g017
Table 1. Summary of the main flows (m3∙s–1) of stage II of the Warta River in the water level gauge profiles of Uniejów, Koło, and Sławsk.
Characteristic Flows
[m3∙s–1]
Water Gauge Profile
UniejówKołoSławsk
NNQ11.9017.0017.40
SNQ14.6818.4819.92
WNQ17.7020.2023.00
NSQ22.7027.8029.20
SSQ34.0041.7445.90
WSQ41.3050.4057.80
NWQ62.6079.6050.80
SWQ78.2491.1688.38
WWQ95.60111.00142.00
Table 2. Low-flow periods and their duration in the Warta River in the Uniejów profile for the hydrological years 2018–2022.
Uniejów Q70% = 22.60 m3∙s–1
Low-Flow PeriodDuration (Days)Range Q m3∙s–1
13 June 2018–2 September 20188219.20–22.60
18 October 2018–31 October 20181419.50–22.60
14 November 2018–10 December 20182716.40–22.60
14 April 2019–27 April 20191421.70–22.60
14 June 2019–2 July 20191918.90–22.60
21 October 2019–5 November 20191618.90–22.60
8 November 2019–5 March 202011917.40–22.60
24 April 2020–11 August 202011016.80–22.60
22 July 2021–6 August 20211616.90–22.60
25 March 2022–13 April 20222018.60–22.60
14 July 2022–1 August 20221916.30–22.60
Table 3. Low-flow periods and their duration in the Warta River in the Koło profile for the hydrological years 2018–2022.
Koło Q70% = 27.40 m3∙s–1
Low-Flow PeriodDuration (Days)Range Q m3∙s–1
7 June2018–14 July 20183821.80–27.40
6 August 2018–3 September 20182922.60–27.40
24 November 2018–8 December 20181519.90–27.40
16 April 2019–29 April 20191424.40–27.40
8 June 2019–30 July20195317.40–27.40
22 October 2019–11 January 20208219.80–27.40
14 January 2020–30 January 20201826.90–27.40
22 March 2020–12 May 20205218.80–27.40
14 May 2020–21 June 20203921.00–27.40
3 July 2020–30 August 20205921.10–27.40
17 June 2021–16 July 20213019.60–27.40
20 July 2021–7 August 20211919.60–27.40
26 March 2022–14 April 20222022.60–27.40
14 May 2022–26 May 20221324.20–27.40
31 May 2022–9 June 20221021.70–27.40
5 July 2022–1 August 20222818.50–27.40
Table 4. Low-flow periods and their duration in the Warta River in the Sławsk profile for the hydrological years 2018–2022.
Sławsk Q70% = 29.90 m3∙s–1
Low-Flow PeriodDuration (Days)Range Q m3∙s–1
14 June 2018–27 June 20181427.10–29.90
1 July 2018–13 July 20181326.40–29.90
6 August 2018–4 September 20183025.00–29.90
26 November 2018–5 December 20181026.90–29.90
9 June 2019–1 August 20195419.00–29.90
3 August 2019–23 August 20192121.20–29.90
25 August 2019–11 September 20191829.20–29.90
22 October 2019–11 January 20208223.70–29.90
14 January 2020–29 January 20201629.40–29.90
22 March 2020–4 September 202016720.00–29.90
6 September 2020–29 September 20202424.50–29.90
17 June 2021–14 July 20212823.50–29.90
25 July 2021–7 August 20211422.40–29.90
6 July 2022–2 August 20222820.40–29.90
Table 5. Comparison of results at selected control cross-sections for hypothetical reservoir outflow variants.
Cross-Section
of Warta
Water Table Ordinate [m Above Sea Level]
Without Recharging
Water Table [m a.s.l.] with RechargingMaximum Difference in Ordinates
[m]
AverageMinimumAverageMinimum
445 + 42393.1993.1593.1793.130.02
447 + 76994.1694.1394.1494.130.02
451 + 86795.7895.7595.7795.740.01
Disclaimer/Publisher’s Note: The statements, opinions and data contained in all publications are solely those of the individual author(s) and contributor(s) and not of MDPI and/or the editor(s). MDPI and/or the editor(s) disclaim responsibility for any injury to people or property resulting from any ideas, methods, instructions or products referred to in the content.

