


Balancing the Interests of Various Community Groups in Local Government Policy on the Energy Performance of Buildings

 , , , , ,
Abstract
1. Introduction
2. Materials and Methods
- Limited municipal budgets are already stretched thin by mandatory functions such as education, social programs, and other legal obligations. Both new demands—enhancing resilience to security threats and improving building energy efficiency—will inevitably compete for the same financial resources.
- Renovation costs for energy-poor households in apartment buildings (typically around 10% of households) cannot be covered without informing and involving other households. Targeted funding from EU programs and/or from national funds will be used to fight energy poverty, while other households will be pressed to take out long-term bank loans. LGs should offer financial instruments that internalize energy cost savings for loan repayments [2].
- The EU and national financial resources are insufficient to fully eliminate household energy poverty. Redirecting municipal funds toward urgent renovations for the most vulnerable could delay the implementation of other development programs, thus impacting broader socioeconomic progress within the municipality.
- Each renovated building, as well as individuals or local energy communities who seek to optimize their own centralized heat consumption, lessens the load on the district heating (DH) network. However, since network heat losses remain constant, reduced consumption increases the unit cost for other network users.
- Building energy performance is increasingly associated with limiting biomass combustion for heating in favor of emission-free technologies. Renewable woody biomass has been and remains economically beneficial both in individual buildings and in DH systems (woody biomass was the primary resource for 63% of the centrally produced heat in Latvia in 2023), reducing heating costs.
- Linking building energy performance upgrades with the development of electric mobility infrastructure—such as the installation of charging points—poses a challenge for the effective allocation of retrofitting budgets.
3. Results
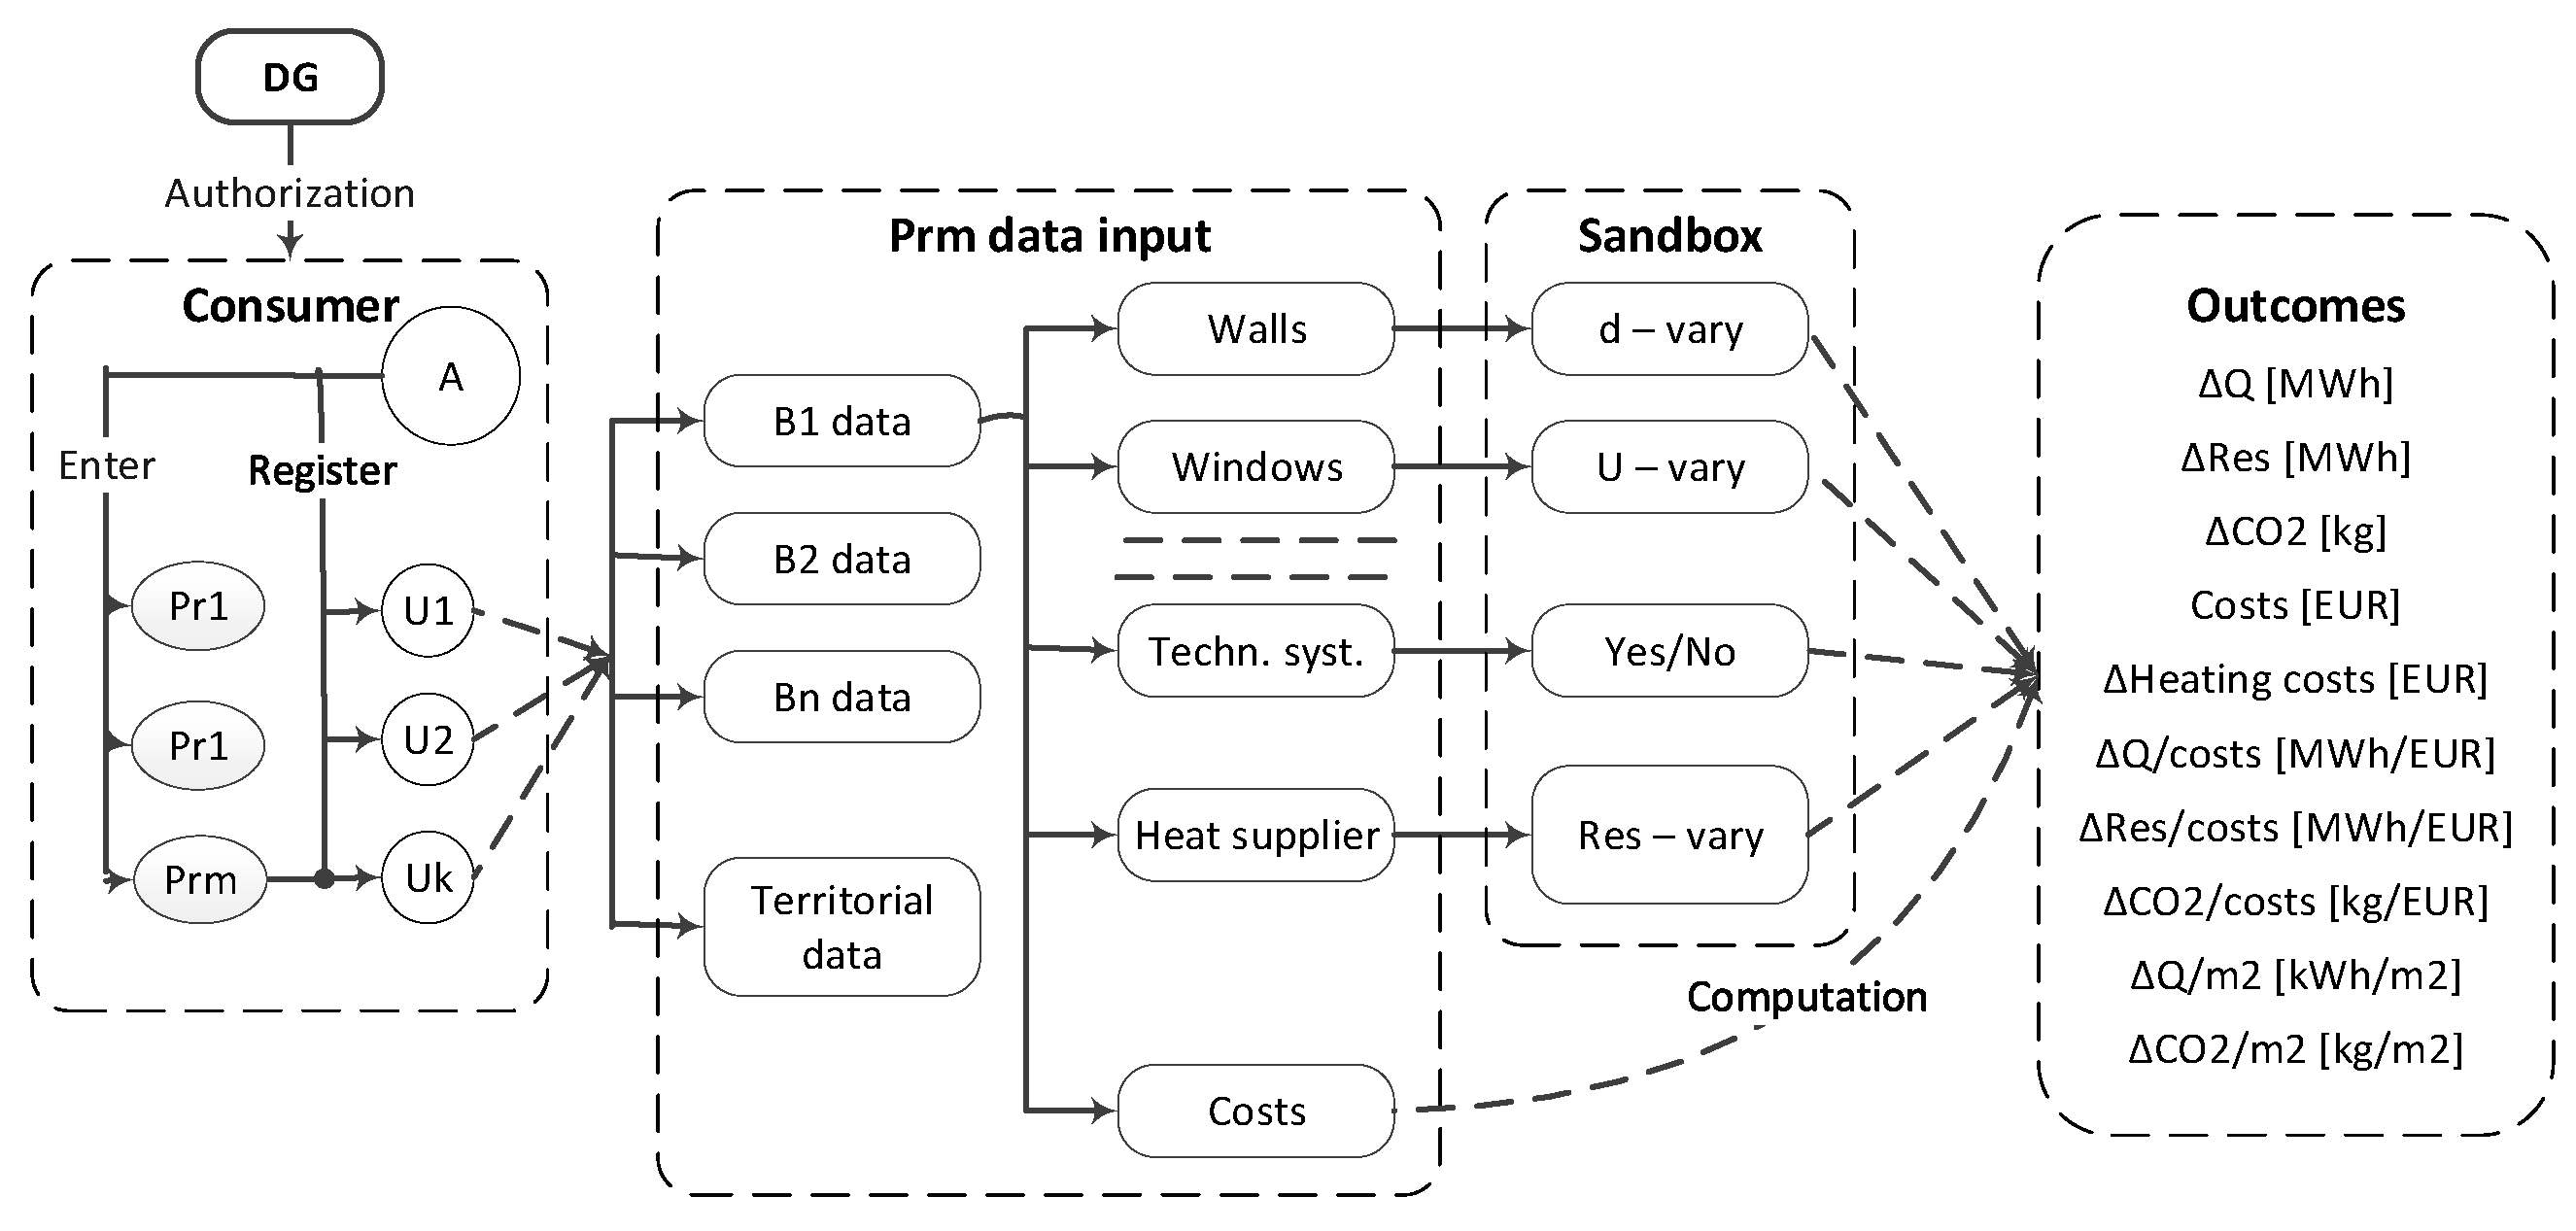
3.1. Methodology
- Achievable savings in heat consumption and primary energy resources;
- The reduction in dominant CO2 emissions;
- Required investments;
- Changes in heating tariffs and costs.
3.2. Defining Key Performance Indicators
- The geographical orientation of the building, i.e., also the solar gains;
- The functionality of the building, i.e., also the internal heat gains (equipment and facilities, building occupants, etc.) and hot water consumption;
- The structural dimensions of the building, i.e., the dimensions of the windows, roof, exterior doors, etc.;
- The internal heating pipe network within the building;
- The topography of the DH pipe network;
- The efficiency of the specific primary energy resource utilization;
- The fixed costs of operating the heat sources.
- When a single measure is implemented, fr = 1;
- When multiple building envelope components are renovated without improvements to the ventilation system, fr = 0.85 (range 0.79–0.92);
- When multiple building envelope components are renovated, including a mechanical ventilation system, fr = 0.75 (range 0.70–0.81).
- The length and internal (nominal) diameter of the pipes of each DH network section;
- Pipelines’ thermal insulation thickness and thermal conductivity;
- Temperatures of the heat carrier in the supply and return pipes and the ambient temperature;
- The heat load and heat energy consumption of all heat energy users connected to the DH network;
- Local and linear hydraulic resistances, optimal flow rate of the heat carrier, and the required pressure drop at the farthest consumer.
3.3. Usability of the Tool
4. Discussion
5. Conclusions
- Ongoing uncertainty in various aspects of the EU green policy due to growing military threats, which gives local interest groups wide opportunities to interpret the situation in their own interests;
- The conflicting opinions of various interest groups, which are short- and medium-term beneficiaries or losers from the implementation of the EU recommendations;
- Diplomacy, needed for the possible rapprochement of these opinions, for balancing decisions to respect all opinions (of course, partially) and avoiding risks arising from an unequal approach and a unilateral choice in the decisions made;
- Prioritizing and concentrating municipal resources, when EU building energy efficiency policy is competing with traditional and local societal challenges in areas such as education, health, and social care, etc., where group interests have become balanced over time;
- A shortage of resources to compensate community groups adversely affected by retrofitting projects for the urban heating system;
- Convincing residents and businesses as building owners to make long-term investments in building energy efficiency projects under conditions of high uncertainty.
- Given that public sentiment is most accurately understood at the municipal level, LGs should not only be consulted but also actively be involved in national-level decision-making.
- LGs should strengthen partnerships with private-sector stakeholders through effective guidance, collaborative planning, and the coordination of decisions aimed at improving building energy performance.
Author Contributions
Funding
Data Availability Statement
Conflicts of Interest
References
- UNFCCC. Paris Agreement. 2015. Available online: https://unfccc.int/sites/default/files/english_paris_agreement.pdf (accessed on 30 April 2025).
- CEMR. Local Green Transition. 2024. Available online: https://ccre-cemr.org/wp-content/uploads/2024/10/CEMR-Local-Green-Transition-2024.pdf (accessed on 30 April 2025).
- EU (2023/1791). Directive of 13 September 2023 on Energy Efficiency and Amending Regulation (EU) 2023/955. Available online: https://eur-lex.europa.eu/eli/dir/2023/1791/oj/eng (accessed on 30 April 2025).
- EU (2024/1275). Directive of 24 April 2024 on the Energy Performance of Buildings. Available online: https://eur-lex.europa.eu/eli/dir/2024/1275/oj/eng (accessed on 30 April 2025).
- EU (2023/2413). Directive of 18 October 2023 Amending Directive (EU) 2018/2001, Regulation (EU) 2018/1999 and Directive 98/70/EC as Regards the Promotion of Energy from Renewable Sources, and Repealing Council Directive (EU) 2015/652. Available online: https://eur-lex.europa.eu/eli/dir/2023/2413/oj/eng (accessed on 30 April 2025).
- Council of Europe. European Charter of Local Self Government, Treaties No.122; Strasbourg, France, 1985. Available online: https://www.coe.int/en/web/impact-convention-human-rights/european-charter-of-local-self-government#/ (accessed on 30 April 2025).
- EC. Local Green Deals; A Blueprint for Action. 2023. Available online: https://www.intelligentcitieschallenge.eu/sites/default/files/2023-03/2023-Local%20Green%20Deals-update-final.pdf (accessed on 30 April 2025).
- Pukis, M.; Bicevskis, J.; Gendelis, S.; Karnitis, E.; Karnitis, G.; Eihmanis, A.; Sarma, U. Role of Local Governments in Green Deal Multilevel Governance: The Energy Context. Energies 2023, 16, 4759. [Google Scholar] [CrossRef]
- EC. A New Era for European Defence and Security, 2024. Available online: https://commission.europa.eu/priorities-2024-2029/security-and-defence_en (accessed on 15 May 2025).
- Bremmer, I. Welcome to a World Defined by Polarization, Instability, and Disruption. Carnegie Corporation of New York. 2025. Available online: https://www.carnegie.org/our-work/article/welcome-to-a-world-defined-by-polarization-instability-and-disruption/ (accessed on 30 April 2025).
- Brotz, H.M. Social Stratification and the Political Order. Am. J. Sociol. 1959, 64, 571–578. [Google Scholar] [CrossRef]
- Eurostat. Inability to Keep Home Adequately Warm. 2025. Available online: https://ec.europa.eu/eurostat/databrowser/view/ilc_mdes01/default/table?lang=en (accessed on 30 April 2025).
- Truijens, D.; Hanegraaff, M. It ain’t over ‘til it’s over: Interest-group influence in policy implementation. Political Stud. Rev. 2024, 22, 387–401. [Google Scholar] [CrossRef]
- Hagen, A.; Altamirano-Cabrera, J.C.; Weikard, H.P. National political pressure groups and the stability of international environmental agreements. Int. Env. Agreem. 2021, 21, 405–425. [Google Scholar] [CrossRef]
- Anger, N.; Asane-Otoo, E.; Böhringer, C.; Oberndorfer, U. Public interest versus interest groups: A political economy analysis of allowance allocation under the EU emissions trading scheme. Int. Environ. Agreem. Politics Law Econ. 2016, 16, 621–638. [Google Scholar] [CrossRef]
- Marchiori, C.; Dietz, S.; Tavoni, A. Domestic politics and the formation of international environmental agreements. J. Environ. Econ. Manag. 2017, 81, 115–131. [Google Scholar] [CrossRef]
- Marris, E. Why young climate activists have captured the world’s attention. Nature 2019, 573, 471–472. [Google Scholar] [CrossRef]
- Rahmad, Y.; Hedenus, F.; Jewell, J.; Vinichenko, V. Spatial heterogeneity in deployment and upscaling of wind power in Swedish municipalities. Renew. Sustain. Energy Transit. 2025, 7, 100104. [Google Scholar] [CrossRef]
- Scheifele, F.; Popp, D. Not in my backyard? The local impact of wind and solar parks in Brazil. Energy Econ. 2025, 29, 108481. [Google Scholar] [CrossRef]
- Bally, F.; Sebi, C. Shifting public perception: A longitudinal analysis of national and local media narratives on nuclear and wind energy in France. Technol. Forecast. Soc. Change 2025, 215, 124111. [Google Scholar] [CrossRef]
- Lindvall, D.; Sörqvist, P.; Lindeberg, S.; Barthel, S. The polarization of energy preferences—A study on social acceptance of wind and nuclear power in Sweden. Energy Policy 2025, 198, 114492. [Google Scholar] [CrossRef]
- Carattini, S.; Figge, B.; Gordan, A.; Löschel, A. Municipal building codes and the adoption of solar photovoltaics. J. Environ. Econ. Manag. 2024, 124, 102937. [Google Scholar] [CrossRef]
- Nunes, A.M.M.; Júnior, E.P.S.; de Araújo, J.M.; Melo, A.K.A.; Rolim, M.J.C.P.; Simioni, F.J.; Carvalho, M.; Junior, L.M.C. Impact assessment of public policies in the municipalities covered by the Brazilian Incentive program for alternative electricity sources (PROINFA). Renew. Energy 2024, 235, 121342. [Google Scholar] [CrossRef]
- Wagner, P.M.; Ocelík, P.; Gronow, A.; Ylä-Anttila, T.; Schmidt, L.; Delicado, A. Network ties, institutional roles and advocacy tactics: Exploring explanations for perceptions of influence in climate change policy networks. Soc. Netw. 2023, 75, 78–87. [Google Scholar] [CrossRef]
- Cattino, M.; Reckien, D. Does public participation lead to more ambitious and transformative local climate change planning? Curr. Opin. Environ. Sustain. 2021, 52, 100–110. [Google Scholar] [CrossRef]
- Bick, N. Citizen involvement in local sustainability policymaking: An in-depth analysis of staff activities and motivations. Sustain. Sci. 2024, 19, 1865–1880. [Google Scholar] [CrossRef]
- Pennacchioni, G. Harnessing Collective Intentionality for Climate Action: An Institutional Perspective on Sustainability. Topoi 2024, 44, 197–208. [Google Scholar] [CrossRef]
- Cass, E.; Harris, C.N.; Shao, W.; Yeates, E.; Moradkhani, H.; Lyons, J. Stakeholder compound flood hazard communication and decision making in Mobile, AL. Int. J. Disaster Risk Reduct. 2025, 122, 105469. [Google Scholar] [CrossRef]
- Takahashi, T.; Hori, Y.; Otsuka, I.; Shibata, S.; Tsuge, T. Innovativeness of Japanese forest owners and municipalities regarding the valori-sation of forest ecosystem services: Quantitative evaluation of mutual influences. For. Policy Econ. 2024, 166, 103269. [Google Scholar] [CrossRef]
- Tilman, A.R.; Haight, R.G. Public policy for management of forest pests within an ownership mosaic. Ecol. Econ. 2025, 234, 108602. [Google Scholar] [CrossRef]
- Moberg, K.R. Limits to local democracy in practice? The case of governing sustainable land use in Norwegian municipalities. Land Use Policy 2025, 152, 107505. [Google Scholar] [CrossRef]
- Fredriksson, A.; Soes, M.S.M. Quantifying political effects in the spatial allocation of public services. Socio Econ. Plan. Sci. 2025, 99, 102180. [Google Scholar] [CrossRef]
- Sebo, M.; Gradus, R.; Budding, T. The impact of independent local parties on spending: Evidence from Dutch municipalities. Eur. J. Political Econ. 2024, 13, 102603. [Google Scholar] [CrossRef]
- Laliotis, I.; Mourelatos, E.; Lohtander, J. Religiosity, attitudes toward science, and public health: Evidence from Finland. Econ. Hum. Biol. 2025, 56, 101460. [Google Scholar] [CrossRef]
- Peteri, G. Local Finances and the Green Transition Managing Emergencies and Boosting Local Investments for a Sustainable Recovery in CEMR Member Countries. 2022, CEMR. Available online: https://www.kdz.eu/system/files/downloads/2023-04/CCRE-Local%20finance%20UK%20v2-1.pdf (accessed on 30 April 2025).
- State Chancellery. Draft Legislation. The Draft of Climate Law, 21-TA-62 2024. Available online: https://tapportals.mk.gov.lv/legal_acts/7987de45-93fd-45e3-ac4c-948251c622d9 (accessed on 30 April 2025). (In Latvian)
- State Chancellery. Draft Legislation. The Draft of Transport Energy Law 23-TA-1451 2024. Available online: https://tapportals.mk.gov.lv/legal_acts/042cde65-37a0-4e35-a005-109648ea5037 (accessed on 30 April 2025). (In Latvian)
- Boudon, R. Beyond Rational Choice Theory. Annu. Rev. Sociol. 2003, 29, 1–21. [Google Scholar] [CrossRef]
- Herfeld, C. Revisiting the criticisms of rational choice theories. Philos. Compass 2021, 17, e12774. [Google Scholar] [CrossRef]
- Huang, J.; Wang, S.; Teng, F.; Feng, W. Thermal performance optimization of envelope in the energy-saving renovation of existing residential buildings. Energy Build. 2021, 247, 111103. [Google Scholar] [CrossRef]
- Pombo, O.; Rivela, B.; Neila, J. The challenge of sustainable building renovation: Assessment of current criteria and future outlook. J. Clean. Prod. 2016, 123, 88–100. [Google Scholar] [CrossRef]
- Jiang, S.; Wang, M.; Ma, L. Gaps and requirements for applying automatic architectural design to building renovation. Autom. Constr. 2023, 147, 104742. [Google Scholar] [CrossRef]
- Huedo, P.; Lopez-Mesa, B.; Mulet, E. Development of an Assessment Tool for Building Envelope Retrofit Based on Environmental Indicator. In The Sustainable Renovation of Buildings and Neighbourhoods; Mercader-Moyano, P., Ed.; Bentham Books: Sharjah, United Arab Emirates, 2018; pp. 81–102. [Google Scholar] [CrossRef]
- Liu, T.; Ma, G.; Wang, D.; Pan, X. Intelligent green retrofitting of existing buildings based on case-based reasoning and random forest. Autom. Constr. 2024, 162, 105377. [Google Scholar] [CrossRef]
- Husiev, O.; Campos-Celador, A.; Alvarez-Sanz, M.; Teres-Zubiaga, J. Why district renovation is not leading the race? Critical assessment of building renovation potential under different intervention levels. Energy Build. 2023, 295, 113288. [Google Scholar] [CrossRef]
- Terés-Zubiaga, J.; Bolliger, R.; Almeida, M.G.; Barbosa, R.; Rose, J.; Thomsen, K.E.; Montero, E.; Briones-Llorente, R. Cost-effective building renovation at district level combining energy efficiency & renewables—Methodology assessment proposed in IEA EBC Annex 75 and a demonstration case study. Energy Build. 2020, 224, 110280. [Google Scholar] [CrossRef]
- Weinberger, G.; Amiri, S.; Moshfegh, B. Investigating techno-economic effects and environmental impacts of energy renovation of residential building clusters on a district heating system. Energy Build. 2021, 251, 111327. [Google Scholar] [CrossRef]
- Kingspan Group. LOGSTOR Calculator. 2022. Available online: https://www.logstor.com/en/services/digital-tools/logstor-calculator/ (accessed on 30 April 2025).
- Wahi, P.; Konstantinou, T.; Tenpierik, M.J.; Visscher, H.J. Lower-Temperature-Ready Renovation: An Approach to Identify the Extent of Renovation Interventions for Lower-Temperature District Heating in Existing Dutch Homes. Buildings 2023, 13, 2524. [Google Scholar] [CrossRef]
- Ziemele, J.; Gendelis, S.; Dace, E. Impact of global warming and building renovation on the heat demand and district heating capacity: Case of the city of Riga. Energy 2023, 276, 127567. [Google Scholar] [CrossRef]
- Bruck, A.; Ruano, S.D.; Auer, H. Values and implications of building envelope retrofitting for residential Positive Energy Districts. Energy Build. 2022, 275, 112493. [Google Scholar] [CrossRef]
- Karnitis, G.; Gendelis, S.; Pukis, M.; Sarma, U.; Diebelis, E.; Karnitis, E.; Bicevskis, J. Retrofitting urban heating systems under the EU Fit for 55 package: Methodology for feasibility studies of projects. Latv. J. Phys. Tech. Sci. 2024, 61, 25–40. [Google Scholar] [CrossRef]
- Gendelis, S. Applications of the Temperature Step Method for Determining the Specific Heat Capacity of Building Materials. In Nano, Bio, Green and Space: Technologies for a Sustainable Future, Proceedings of the 23rd International Multidisciplinary Scientific GeoConference SGEM 2023, Albena, Bulgaria, 3–9 July 2023; Trofymchuk, O., Rivza, B., Eds.; STEF92 Technology: Stolichna, Bulgaria, 2023; Volume 23. [Google Scholar] [CrossRef]
- ISO 10456:2007; Building Materials and Products—Hygrothermal Properties—Tabulated Design Values and Procedures for Determining Declared and Design Thermal Values. ISO: Geneva, Switzerland, 2007.
- Sooriyalakshmi, N.; Helena, H.J. A brief overview on thermal conductivity of insulating materials. Technol. Innov. Eng. Res. 2022, 6, 78–90. [Google Scholar] [CrossRef]
- Ali, A.; Issa, A.; Elshaer, A. A Comprehensive Review and Recent Trends in Thermal Insulation Materials for Energy Conservation in Buildings. Sustainability 2024, 16, 8782. [Google Scholar] [CrossRef]
- Le, D.H.A.; Pásztory, Z. An overview of factors influencing thermal conductivity of building insulation materials. J. Build. Eng. 2021, 44, 102604. [Google Scholar] [CrossRef]
- Šadauskienė, J.; Ramanauskas, J.; Krawczyk, D.A.; Klumbytė, E.; Fokaides, P.A. Investigation of Thermal Bridges of a New High-Performance Window Installation Using 2-D and 3-D Methodology. Buildings 2022, 12, 572. [Google Scholar] [CrossRef]
- ISO 10077-1:2017; Thermal Performance of Windows, Doors and Shutters—Calculation of Thermal Transmittance—Part 1: General. ISO: Geneva, Switzerland, 2017.
- Rana, A.; Alam, M.S.; Charles, K.; Perera, P.; Hewage, K.; Sadiq, R. Thermal Performance of Double and Triple Glazed Windows; Experimental Results from Lab and In-Situ Measurements. In Proceedings of the 1st International Conference on New Horizons in Green Civil Engineering (NHICE-01), Victoria, BC, Canada, 25–27 April 2018; Available online: https://www.researchgate.net/publication/326316386_Thermal_performance_of_double_and_triple_glazed_windows_Experimental_results_from_lab_and_in-situ_measurements (accessed on 30 April 2025).
- Huang, Y.; El Mankibi, M.; Cantin, R. Thermal performance characterization of supply-air double windows: A new guarded hot box protocol and numerical modelization. Energy Build. 2023, 287, 112993. [Google Scholar] [CrossRef]
- Kalamees, T. Air tightness and air leakages of new lightweight single-family detached houses in Estonia. Build. Environ. 2007, 42, 2369–2377. [Google Scholar] [CrossRef]
- Chan, W.R.; Nazaroff, W.W.; Price, P.N.; Sohn, M.D.; Gadgil, A.J. Analyzing a database of residential air leakage in the United States. Atmos. Environ. 2005, 39, 3445–3455. [Google Scholar] [CrossRef]
- Alfano, F.; Dell’Isola, M.; Ficco, G.; Tassini, F. Experimental analysis of air tightness in Mediterranean buildings using the fan pressurization method. Build. Environ. 2012, 53, 16–25. [Google Scholar] [CrossRef]
- ISO 9972-2015; Thermal Performance of Buildings—Determination of Air Permeability of Buildings—Fan Pressurization Method. 3rd ed. ISO: Geneva, Switzerland, 2015.
- Michalak, P. Annual Energy Performance of an Air Handling Unit with a Cross-Flow Heat Exchanger. Energies 2021, 14, 1519. [Google Scholar] [CrossRef]
- Zender–Świercz, E.A. Review of Heat Recovery in Ventilation. Energies 2021, 14, 1759. [Google Scholar] [CrossRef]
- Pekdogan, T.; Tokuç, A.; Ezan, M.A.; Başaran, T. Experimental investigation of a decentralized heat recovery ventilation system. J. Build. Eng. 2021, 35, 102009. [Google Scholar] [CrossRef]
- Shan, R.; Lai, W.; Tang, H.; Leng, X.; Gu, W. Residential Building Renovation Considering Energy, Carbon Emissions, and Cost: An Approach Integrating Machine Learning and Evolutionary Generation. Appl. Sci. 2025, 15, 1830. [Google Scholar] [CrossRef]
- Vandenbogaerde, L.; Verbeke, S.; Audenaert, A. Optimizing building energy consumption in office buildings: A review of building automation and control systems and factors influencing energy savings. J. Build. Eng. 2023, 76, 107233. [Google Scholar] [CrossRef]
- del Hoyo Arce, I.; López, S.H.; López Perez, S.; Rämä, M.; Klobut, K.; Febres, J.A. Models for fast modelling of district heating and cooling networks. Renew. Sustain. Energy Rev. 2018, 82, 1863–1873. [Google Scholar] [CrossRef]
- Guelpa, E.; Capone, M.; Sciacovelli, A.; Vasset, N.; Baviere, R.; Verda, V. Reduction of supply temperature in existing district heating: A review of strategies and implementations. Energy 2023, 262, 125363. [Google Scholar] [CrossRef]
- Wieland, A.; Dollhopf, S.; Weidlich, I.; Pourbozorgi Langroudi, P. Heat Loss Determination of District Heating Pipelines. A Comparison of Numerical and Analytical Methods. Environ. Clim. Technol. 2024, 28, 927–939. [Google Scholar] [CrossRef]
- Kingspan Group. LOGSTOR. District heating products. Available online: https://www.logstor.com/en/products/ (accessed on 30 April 2025).
- EN 13941; Design and Installation of Thermal Insulated Bonded Single and Twin Pipe Systems for Directly Buried Hot Water Networks. iTeh, Inc.: Newark, DE, USA, 2009. Available online: https://standards.iteh.ai/catalog/standards/cen/157e2da8-8a70-489e-983f-ea77a0b4f967/en-13941-1-2019?srsltid=AfmBOorJziL4GhI2SYHdjf0TFPNL5PChkG1zJILiHq5Iwbh_Wc5YQEfm (accessed on 30 April 2025).
- Krawczyk, D.A.; Teleszewski, T.J. Reduction of Heat Losses in a Pre-Insulated Network Located in Central Poland by Lowering the Operating Temperature of the Water and the Use of Egg-shaped Thermal Insulation: A Case Study. Energies 2019, 12, 2104. [Google Scholar] [CrossRef]
- Averfalk, H.; Werner, S. Economic benefits of fourth generation district heating. Energy 2020, 193, 116727. [Google Scholar] [CrossRef]
- Tilburg University. Wind Turbines: Not in Your Backyard? Tilburg University Magazine, 13 January 2025. Available online: https://www.tilburguniversity.edu/magazine/overview/wind-turbines-not-your-backyard (accessed on 30 April 2025).
- UNFCC. Kyoto Protocol to the United Nations Framework Convention on Climate Change. 1998. Available online: https://unfccc.int/resource/docs/convkp/kpeng.pdf (accessed on 30 April 2025).
- Mukoyama, T. In defence of the Kaldor-Hicks criterion. Econ. Lett. 2023, 224, 111031. [Google Scholar] [CrossRef]
- Wight, J.B. The Ethics behind Efficiency. J. Econ. Educ. 2017, 48, 15–26. [Google Scholar] [CrossRef]
- Bostani, M.; Malekpoor, A. Critical Analysis of Kaldor-Hicks Efficiency Criterion, with Respect to Moral Values, Social Policy Making and Incoherence. Adv. Environ. Biol. 2012, 6, 2032–2038. [Google Scholar]

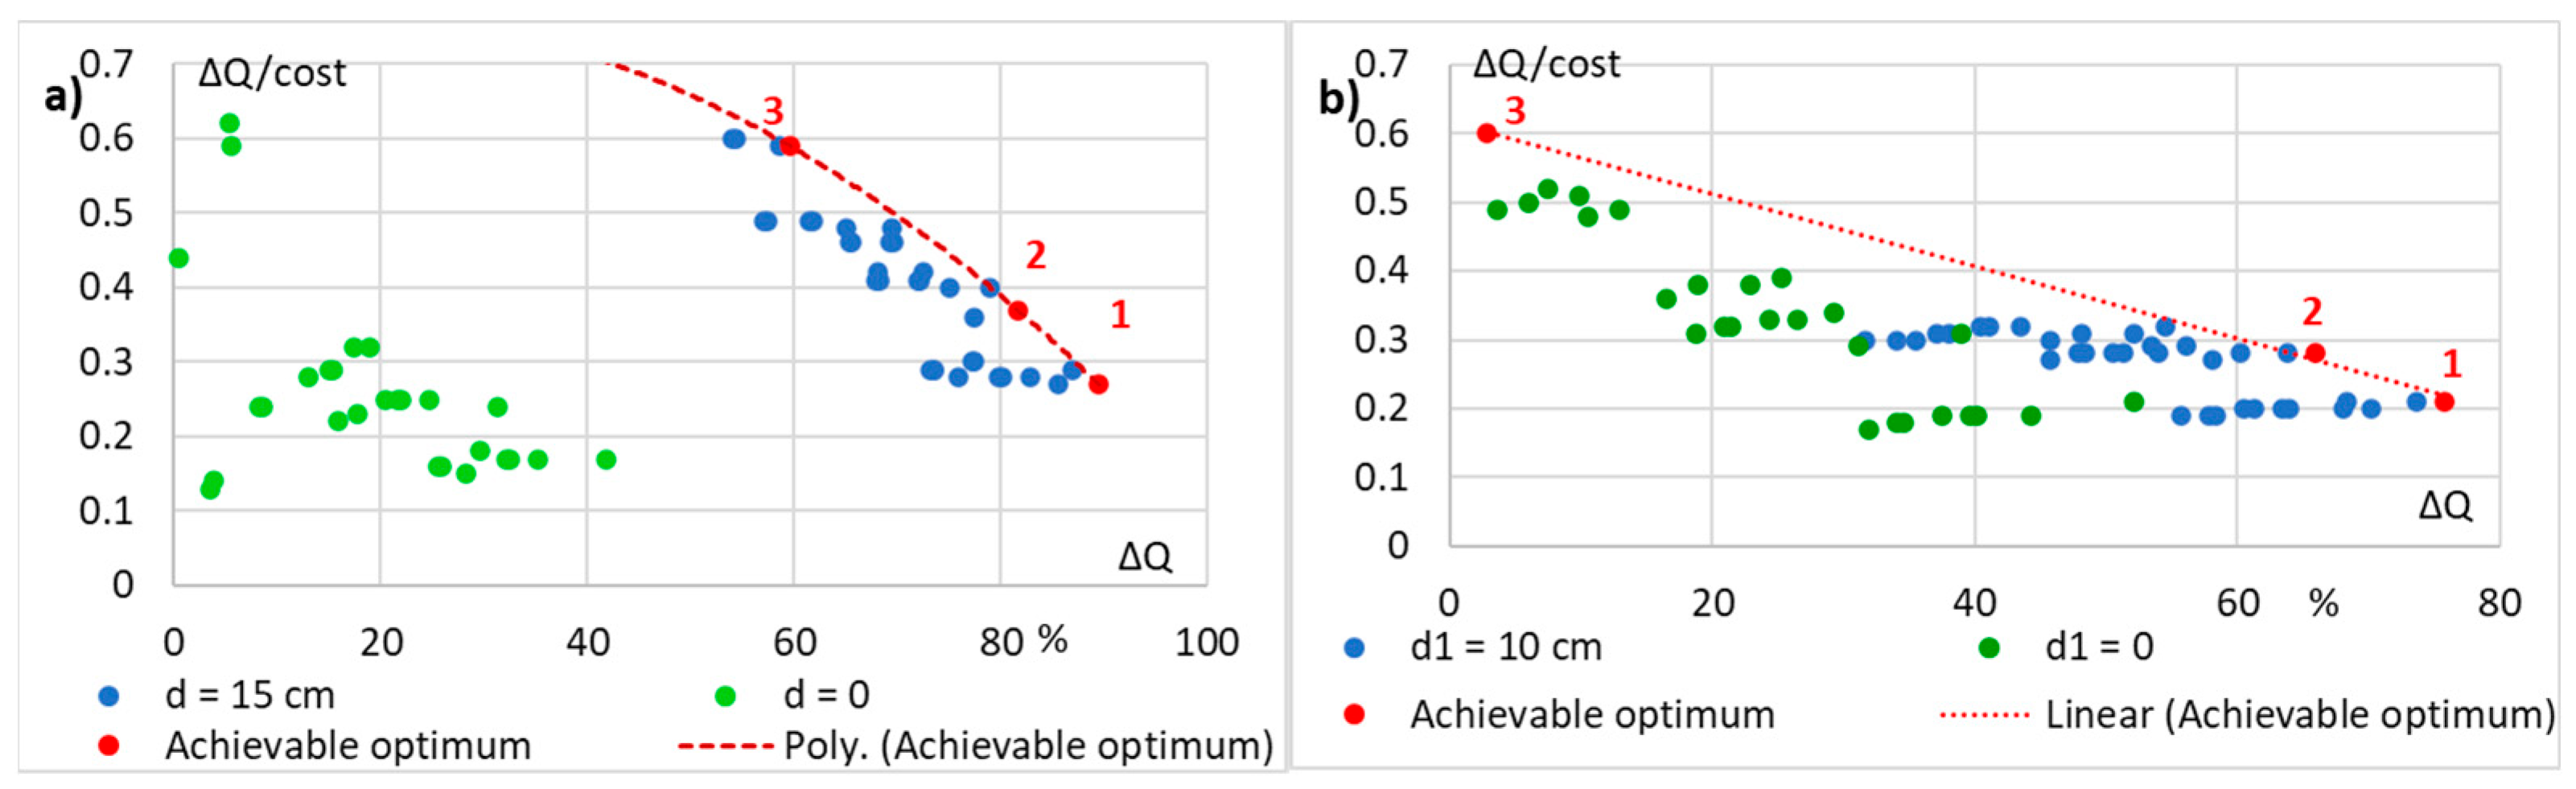
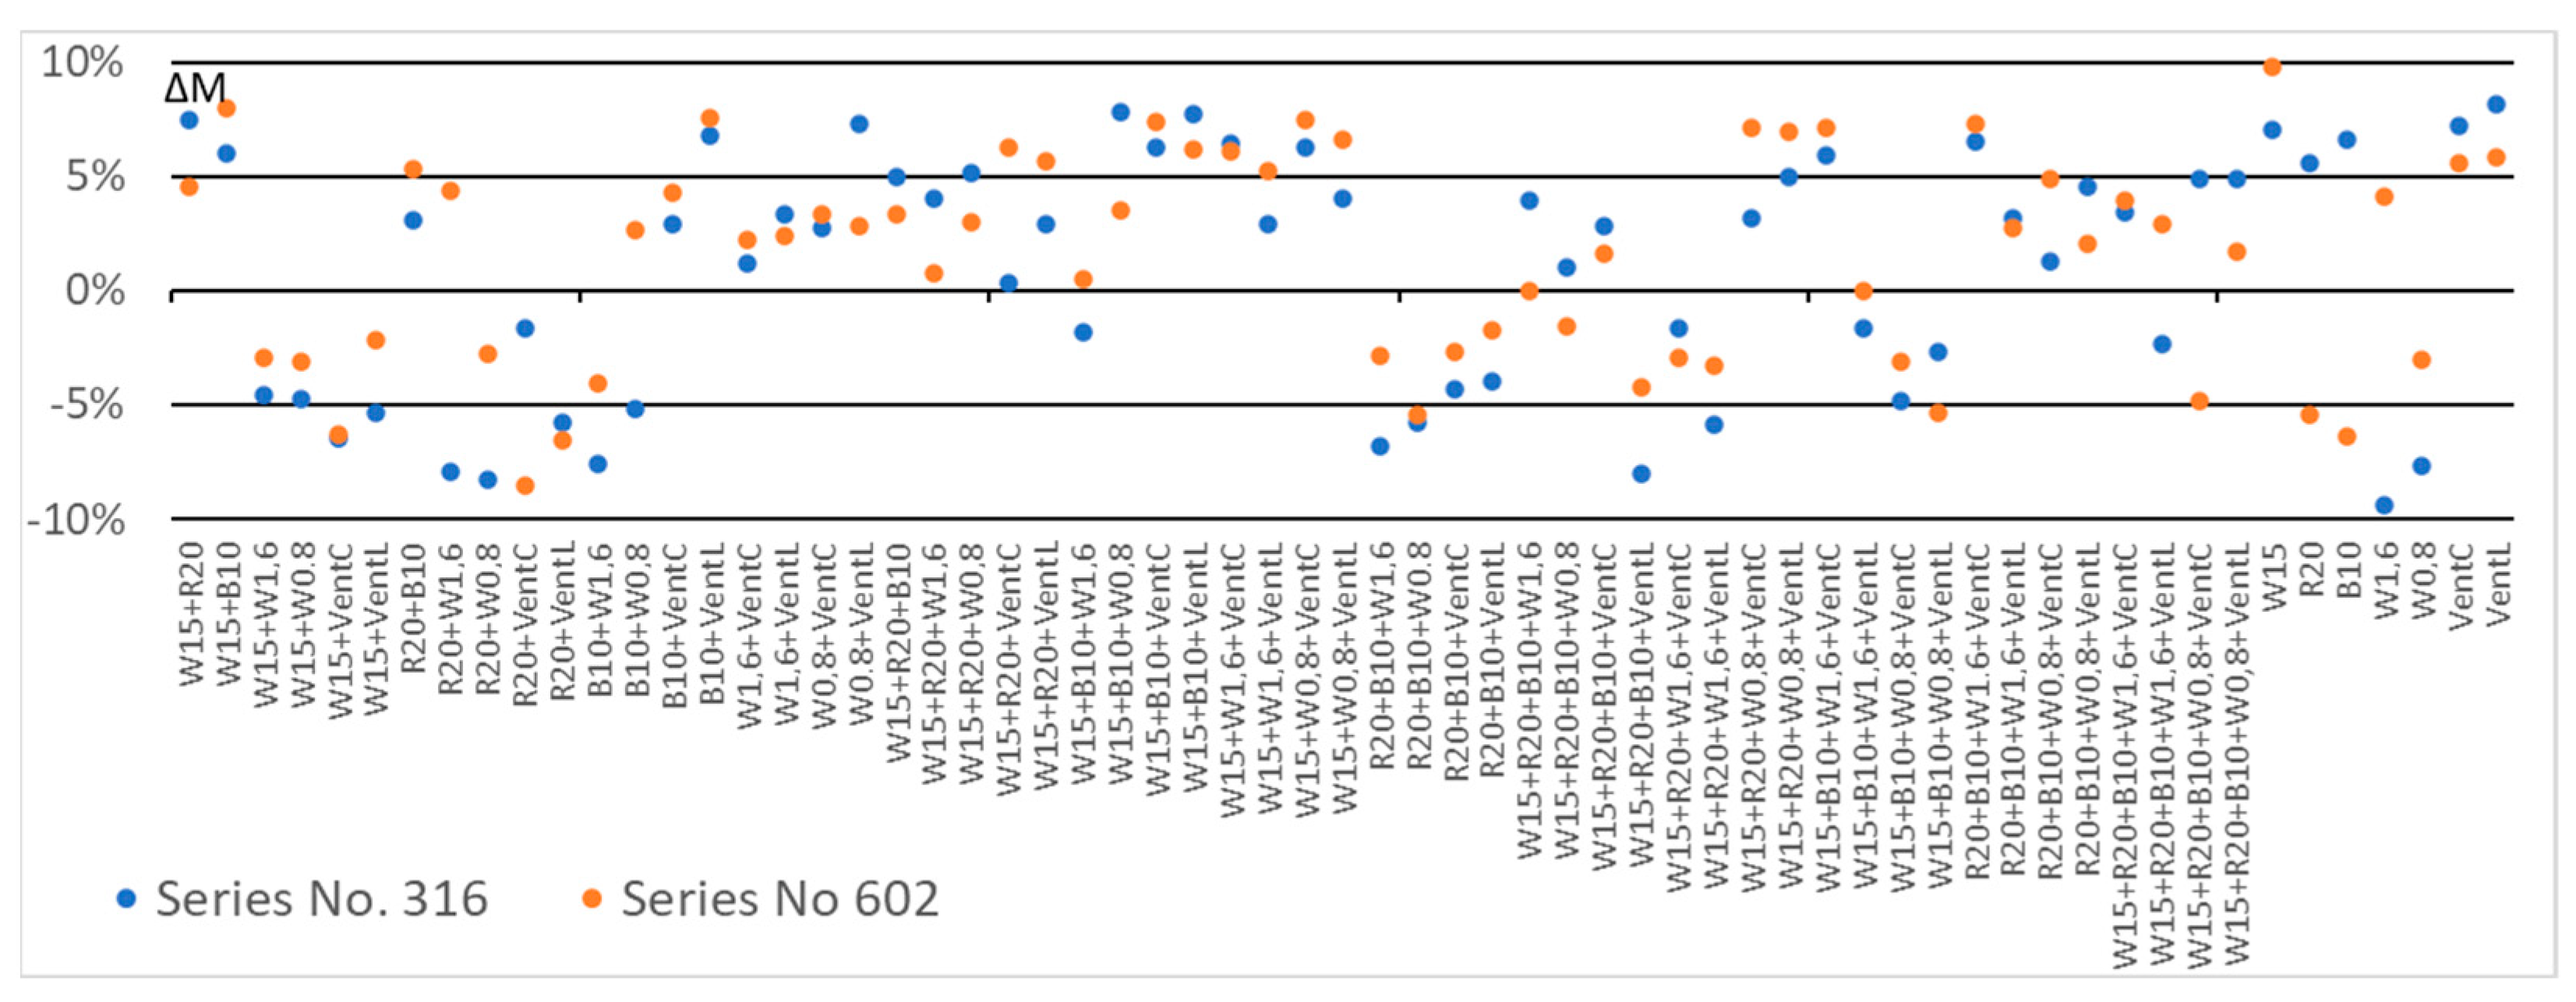
| Point (Figure 6) | Series No. 316 | Series No. 602 | ||
|---|---|---|---|---|
| Project Task | Composition | Project Task | Composition | |
| 1 | ΔQ → max | W15 + B10 + R20 + + W0.8 + VentC | ΔQ → max | W15 + B10 + R20 + W0.8 + VentC |
| 2 | ΔQ > 80% | W15 + B10 + R20 + + W0.8 + VentL | ΔQ > 60% | W15 + B10 + R20 + W0.8 + VentL |
| 3 | ΔQ/cost → max | W15 + B10 + W1.6 | ΔQ/cost → max | B10 |
Disclaimer/Publisher’s Note: The statements, opinions and data contained in all publications are solely those of the individual author(s) and contributor(s) and not of MDPI and/or the editor(s). MDPI and/or the editor(s) disclaim responsibility for any injury to people or property resulting from any ideas, methods, instructions or products referred to in the content. |
© 2025 by the authors. Licensee MDPI, Basel, Switzerland. This article is an open access article distributed under the terms and conditions of the Creative Commons Attribution (CC BY) license (https://creativecommons.org/licenses/by/4.0/).
Share and Cite
Karnitis, G.; Pukis, M.; Bicevskis, J.; Diebelis, E.; Gendelis, S.; Karnitis, E.; Sarma, U. Balancing the Interests of Various Community Groups in Local Government Policy on the Energy Performance of Buildings. Energies 2025, 18, 2812. https://doi.org/10.3390/en18112812
Karnitis G, Pukis M, Bicevskis J, Diebelis E, Gendelis S, Karnitis E, Sarma U. Balancing the Interests of Various Community Groups in Local Government Policy on the Energy Performance of Buildings. Energies. 2025; 18(11):2812. https://doi.org/10.3390/en18112812
Chicago/Turabian StyleKarnitis, Girts, Maris Pukis, Janis Bicevskis, Edgars Diebelis, Stanislavs Gendelis, Edvins Karnitis, and Ugis Sarma. 2025. "Balancing the Interests of Various Community Groups in Local Government Policy on the Energy Performance of Buildings" Energies 18, no. 11: 2812. https://doi.org/10.3390/en18112812
APA StyleKarnitis, G., Pukis, M., Bicevskis, J., Diebelis, E., Gendelis, S., Karnitis, E., & Sarma, U. (2025). Balancing the Interests of Various Community Groups in Local Government Policy on the Energy Performance of Buildings. Energies, 18(11), 2812. https://doi.org/10.3390/en18112812