

Exergy Analysis of 500 MW Power Unit Based on Direct Measurement Data

 ,
,  , ,
, ,  and
and
Abstract
1. Introduction
- Exergetic efficiency is always a measure of true excellence and provides more meaningful information when assessing the performance of energy systems. In addition, exergetic losses clearly identify the locations, causes, and sources of deviations from ideal processes in a system that are directly related to a unit’s CO2 emissions.
- Exergy methods can help to assess the thermodynamic values of product energy forms in complex systems with multiple products (e.g., cogeneration and trigeneration plants).
- Exergy-based methods can be used to improve economic and environmental assessments, thereby influencing sustainability issues in the energy sector and economy.
- Exergy can improve understanding of terms such as energy conservation and the energy crisis.
- Exergetic methods can assist in optimisation efforts.
2. Materials and Methods
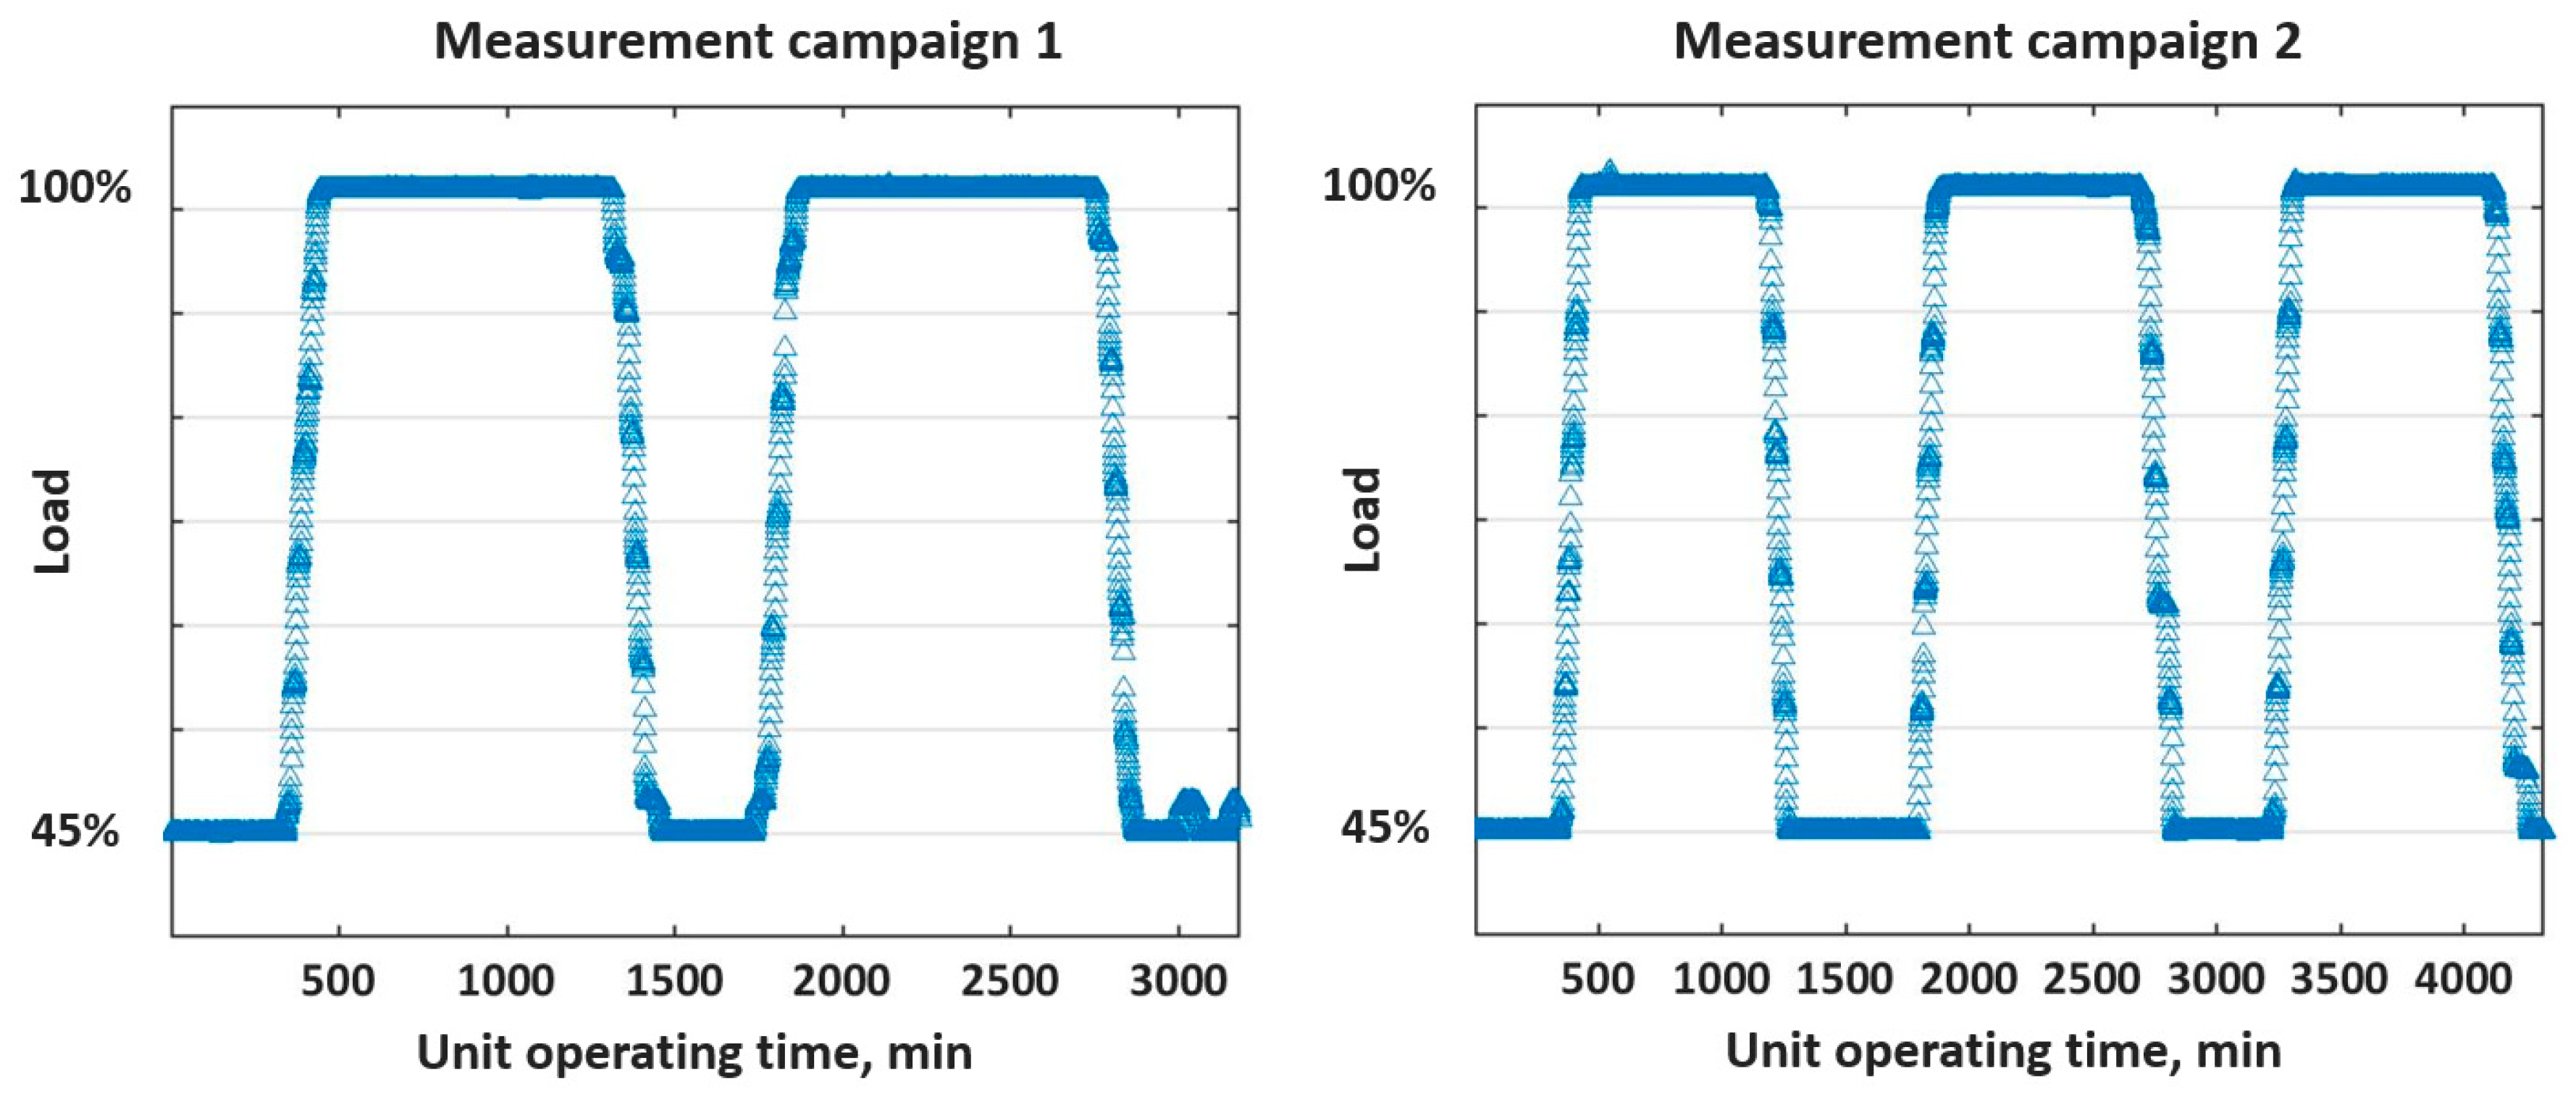
2.1. Data Preparation from Direct Measurements
- Operation at nominal (maximum) power conditions—100% load.
- Operation at minimal power conditions—45% load.
- The minimum and maximum values of the measured parameter were determined ().
- The analysed data range was determined as .
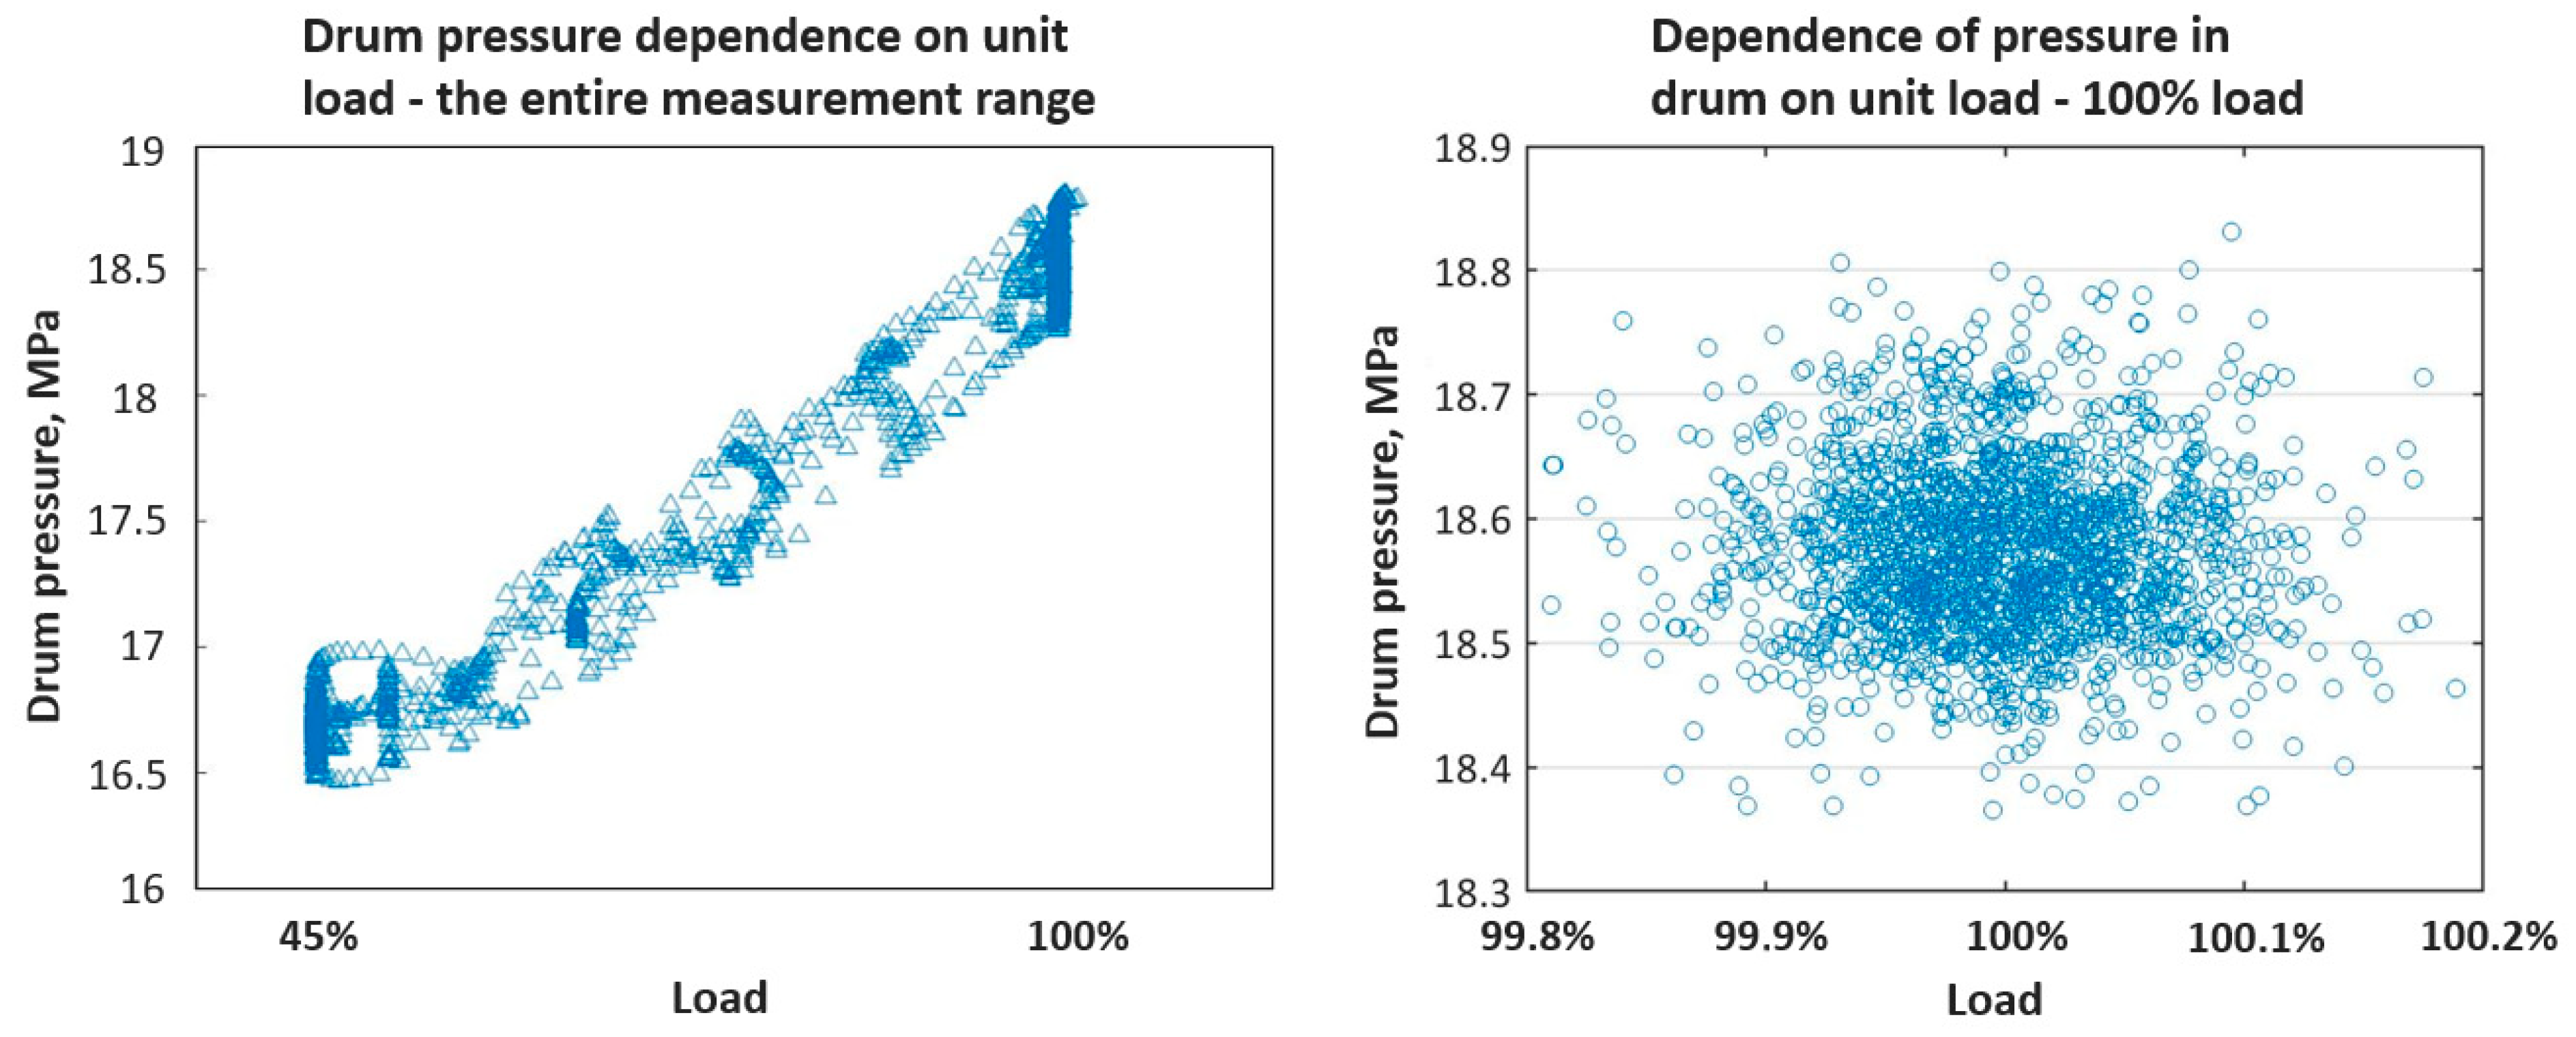
- The histogram interval length was determined as , where is the number of histogram intervals. The number of intervals equalled 12, and it was determined using Sturges’ rule: the number of intervals was calculated as , where is the number of observations.
- The histogram intervals were determined using Formula (1), where
- The number of records per histogram interval was calculated.
- The interval with the highest record number was determined as .
- The average value of the analysed parameter was determined (Equation (2))
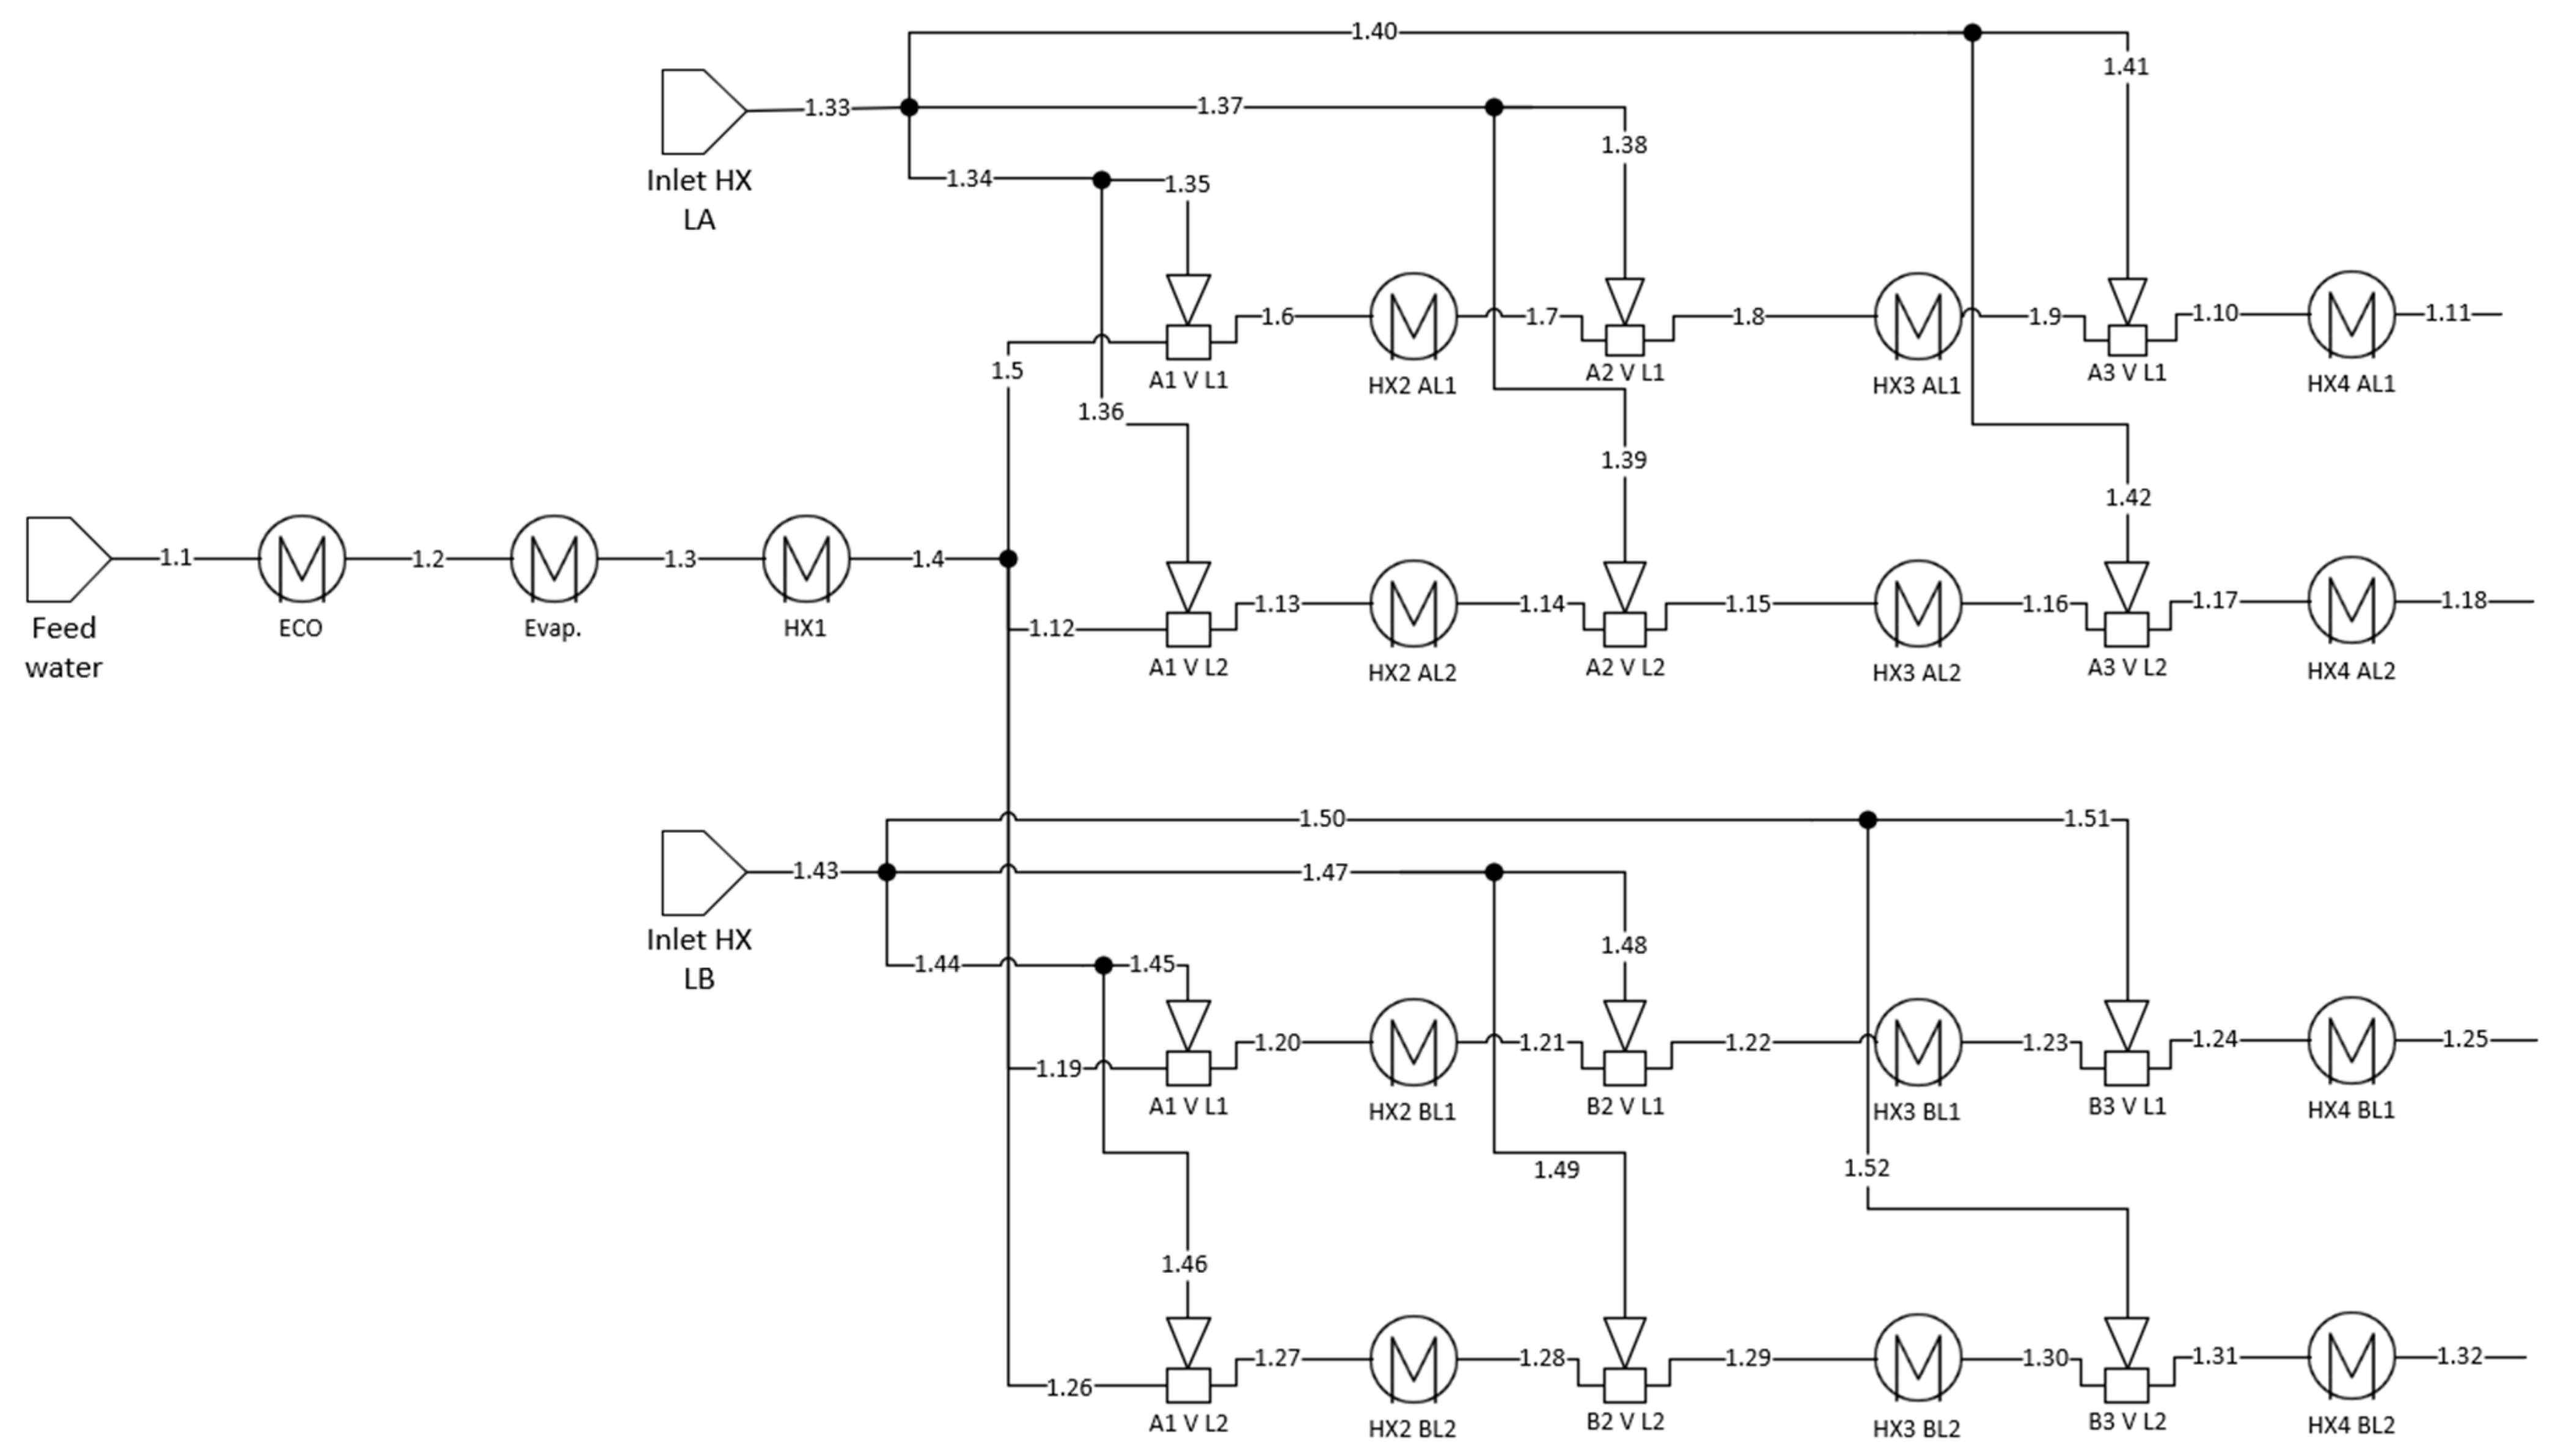
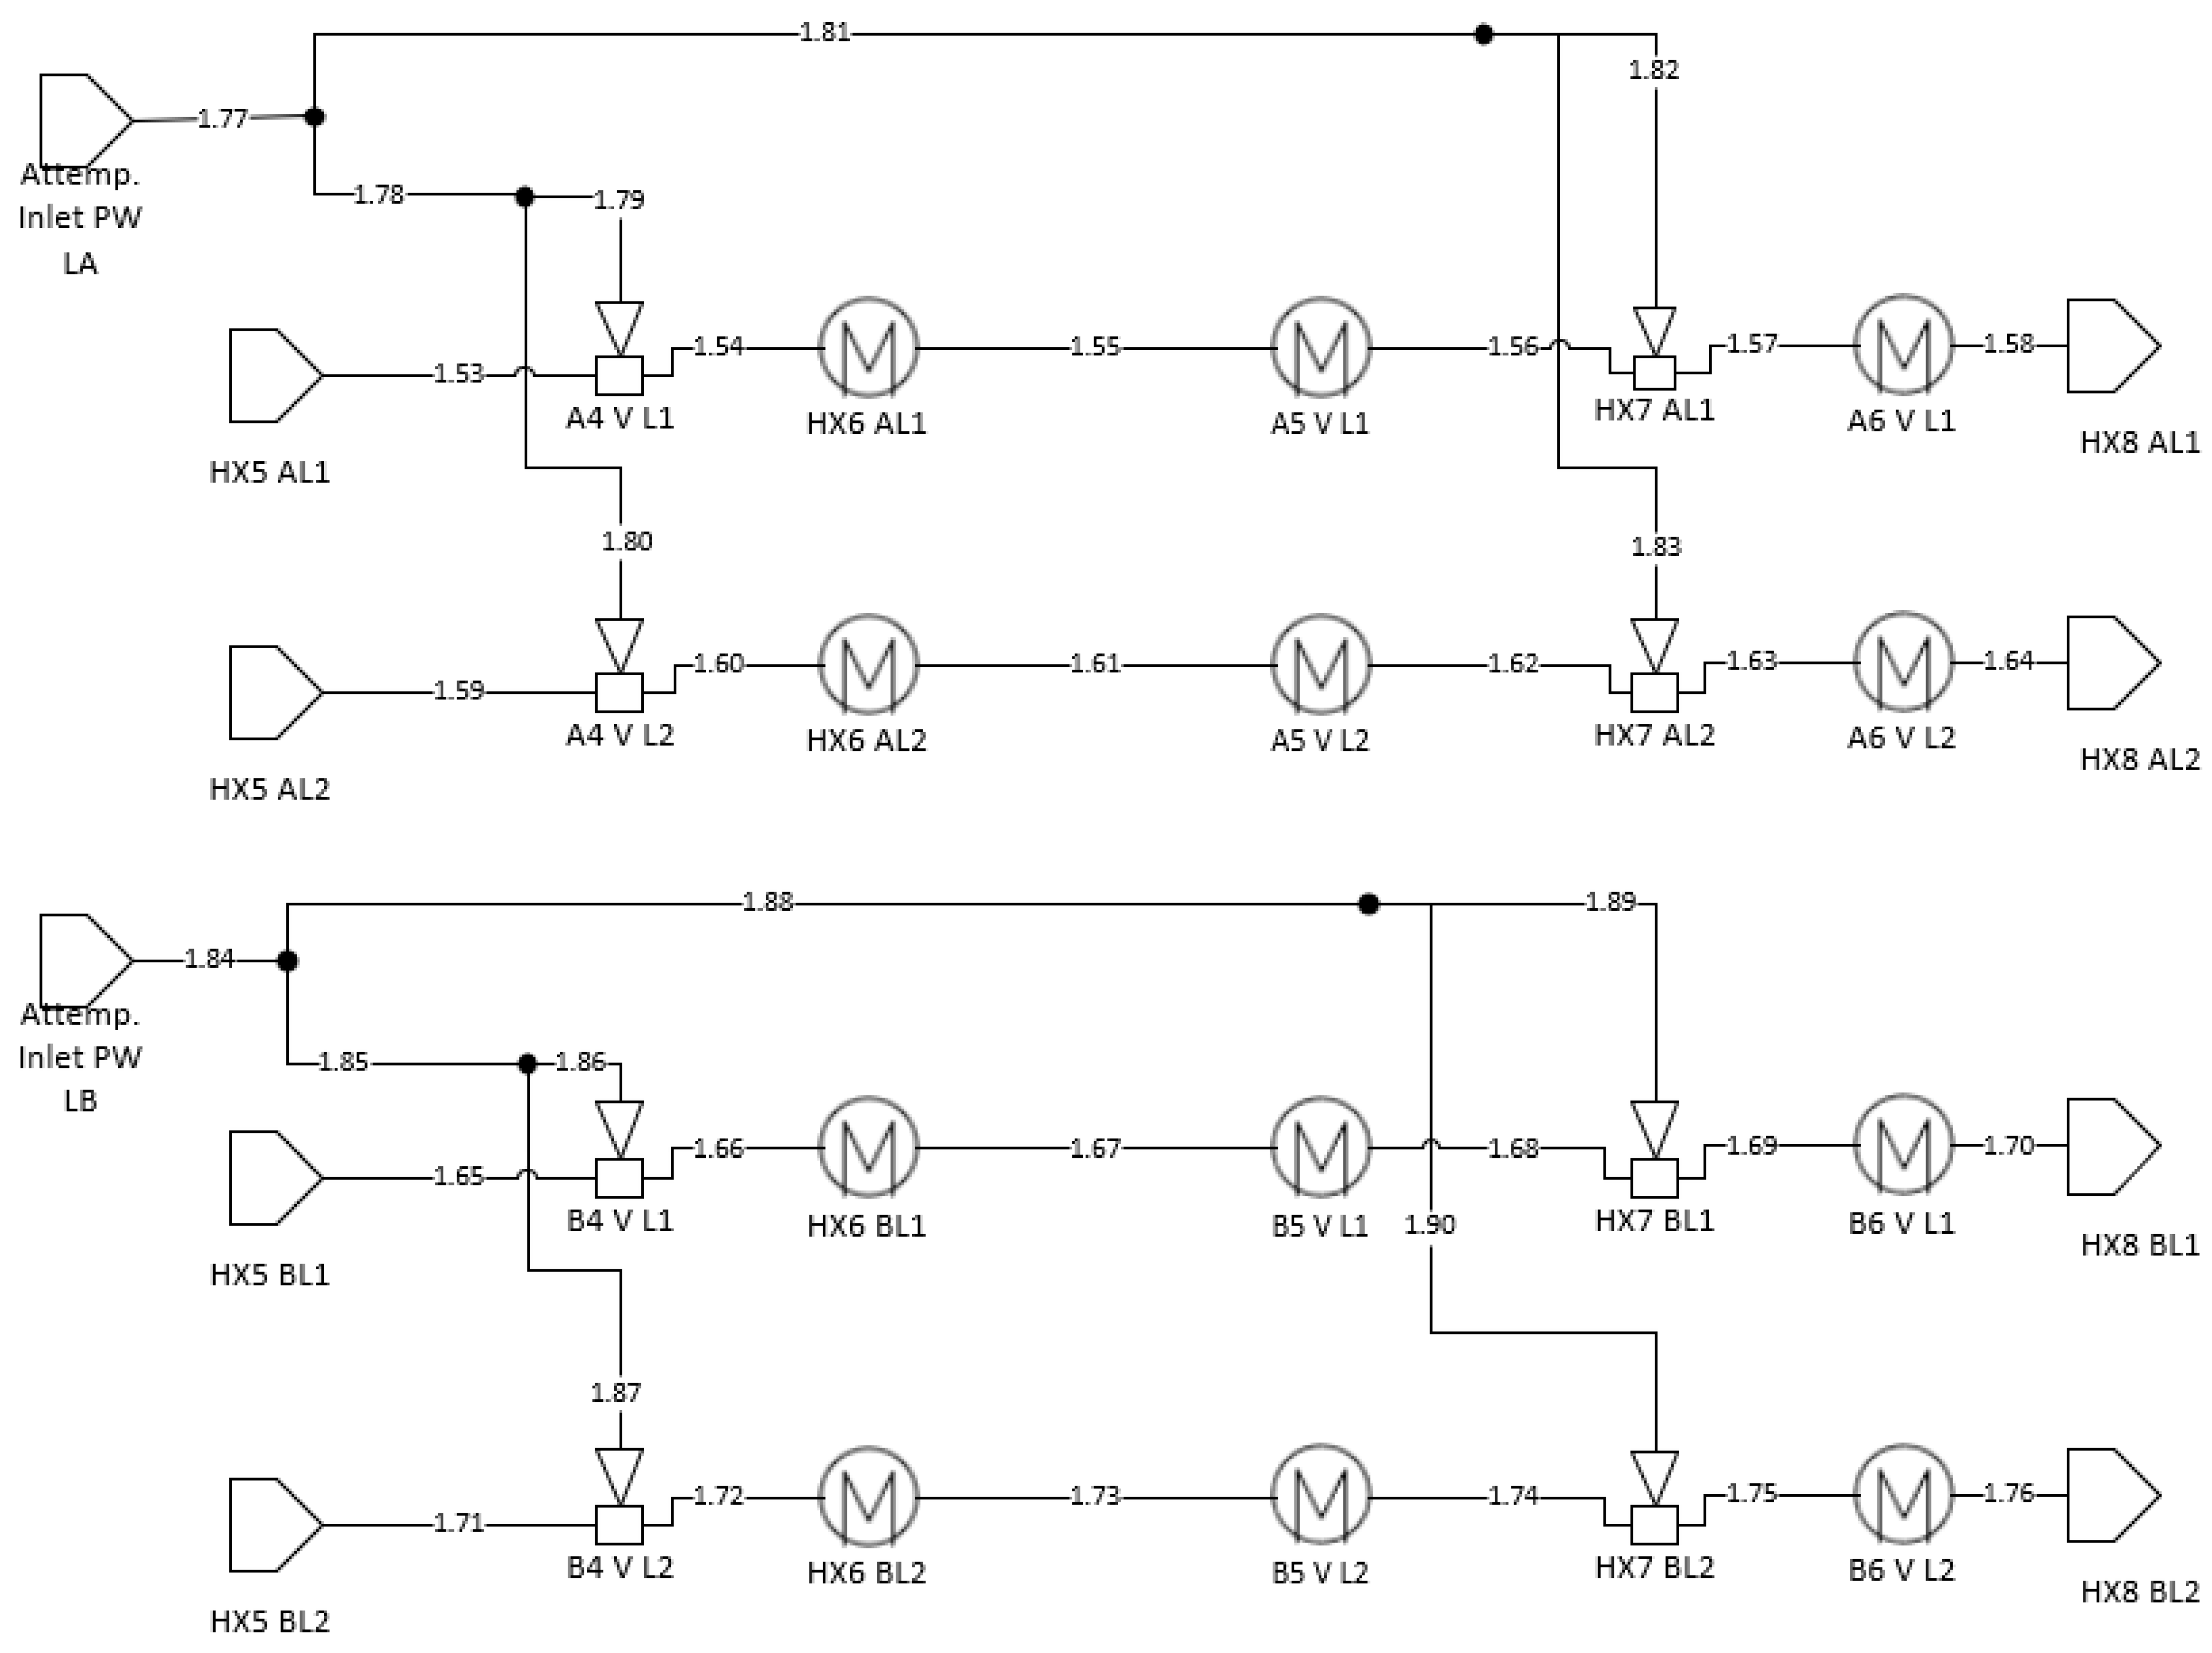
2.2. Mathematical Model and Energy Analysis
2.3. Exergy Analysis
3. Results
4. Discussion
- Modification of the rotary air heater.
- Installation of inverters for air fan systems, which shows a significant decrease in both energy and exergy efficiency at lower block load.
- Replacing the CO1 and CO2 condenser tubes with titanium ones;
- Replacing the auxiliary turbine seals;
- Providing an additional pump for the auxiliary turbine condenser cooling water in order to avoid unnecessary pressure increases in the entire cooling system and thus reduce the power of the main cooling water pumps.
- Modification of the rotary air heater—10,500 tCO2/year;
- Installation of inverters for air fan systems—500 tCO2/year;
- Replacing the CO1 and CO2 condenser tubes with titanium ones—7326.9 tCO2/year;
- Replacing the auxiliary turbine seals—161.0 tCO2/year;
- Providing an additional pump for the auxiliary turbine condenser cooling water—2077.2 tCO2/year.
Author Contributions
Funding
Data Availability Statement
Conflicts of Interest
Nomenclature
| inlet exergy | |
| inlet exergy on the heat exchanger hot side | |
| inlet exergy on the heat exchanger cold side | |
| outlet exergy | |
| outlet exergy on the heat exchanger hot side | |
| outlet exergy on the heat exchanger cold side | |
| internal exergy destruction | |
| exergy feeding the boiler (fuel exergy) | |
| chemical fuel exergy | |
| external exergy losses | |
| exergy of the boiler utility product | |
| chemical exergy of ash | |
| chemical exergy of sulfur | |
| chemical exergy of moisture | |
| empirical constant | |
| mechanical energy consumed by the compressor/fan | |
| mechanical energy of the turbines/turbine stages | |
| mass fraction of moisture in fuel | |
| mass fraction of sulfur in fuel | |
| mass fraction of ash in fuel | |
| enthalpy at system inlet | |
| enthalpy at system outlet | |
| number of observations | |
| histogram interval | |
| histogram interval with the highest record number | |
| histogram interval with the highest record number average | |
| histogram interval length | |
| fuel mass flow | |
| mass flow rate of the medium | |
| number of histogram intervals | |
| pressure | |
| critical pressure | |
| gas-law constant | |
| water evaporation enthalpy | |
| entropy | |
| real gas entropy | |
| perfect gas entropy | |
| entropy at system inlet | |
| entropy at system outlet | |
| temperature | |
| ambient temperature in Kelvin | |
| critical temperature | |
| volume | |
| fuel calorific value | |
| calorific value of elemental sulfur | |
| analysed data range | |
| measured parameter maximum value | |
| measured parameter minimum value | |
| Greek symbols | |
| acentric coefficient | |
| Diagram and schematic designations | |
| A | attemperator—side A |
| AL | pipeline A—side |
| B | attemperator—side B |
| BL | pipeline B—side |
| CC | steam turbine for feedwater pump condenser |
| CO | main condensers |
| ECO | economiser |
| HX | heat exchanger |
| HXw | low-pressure heat exchanger |
| KT | low pressure condensate cooler |
| L | pipline |
| LA | pipeline A—side |
| LB | pipeline B—side |
| LP | low pressure turbine |
| LUVO | air heater |
| MP | intermediate pressure turbine |
| RH | low-pressure heat exchanger |
| TP | steam turbine for feedwater pump |
| V | steam |
| VLZ | regulation valves |
| XH | high pressure regeneration heat exchangers |
| XL | low pressure regeneration heat exchangers |
| ZP | air fan or high pressure turbine |
| ZS | flue gas fan |
Appendix A

| Point No. | Mass Flow, t/h | Mass Flow, kg/s | Enthalpy, kJ/kg | Entropy, kJ/(kg × K) | Temperature, °C | Pressure, MPa |
|---|---|---|---|---|---|---|
| 1.1 | 674.45 | 187.35 | 903 | 2.3996 | 209.92 | 17.21 |
| 1.2 | 674.45 | 187.35 | 1064 | 2.7224 | 245.3 | 16.94 |
| 1.3 | 674.45 | 187.35 | 2563 | 5.2083 | 350.9 | 16.71 |
| 1.4 | 674.45 | 187.35 | 2822 | 5.6191 | 378.83 | 16.56 |
| 1.5 | 174.87 | 48.58 | 2822 | 5.6191 | 378.83 | 16.56 |
| 1.6 | 181.67 | 50.46 | 2750 | 5.5071 | 368.17 | 16.56 |
| 1.7 | 181.67 | 50.46 | 3133 | 6.0739 | 450.15 | 16.53 |
| 1.8 | 184.37 | 51.21 | 3100 | 6.0281 | 440.71 | 16.53 |
| 1.9 | 184.37 | 51.21 | 3296 | 6.2959 | 501.5 | 16.4 |
| 1.10 | 187.74 | 52.15 | 3253 | 6.2396 | 487.05 | 16.4 |
| 1.11 | 187.74 | 52.15 | 3406 | 6.4374 | 539.32 | 16.26 |
| 1.12 | 169.46 | 47.07 | 2822 | 5.6191 | 378.83 | 16.56 |
| 1.13 | 177.99 | 49.44 | 2729 | 5.4754 | 365.54 | 16.56 |
| 1.14 | 177.99 | 49.44 | 3132 | 6.0731 | 449.98 | 16.53 |
| 1.15 | 178.15 | 49.49 | 3130 | 6.0703 | 449.41 | 16.53 |
| 1.16 | 178.15 | 49.49 | 3288 | 6.2854 | 498.85 | 16.41 |
| 1.17 | 179.06 | 49.74 | 3276 | 6.2696 | 494.76 | 16.41 |
| 1.18 | 179.06 | 49.74 | 3408 | 6.4397 | 540.01 | 16.26 |
| 1.19 | 163.46 | 45.41 | 2822 | 5.6191 | 378.83 | 16.56 |
| 1.20 | 171.70 | 47.69 | 2729 | 5.4747 | 365.49 | 16.56 |
| 1.21 | 171.70 | 47.69 | 3145 | 6.0923 | 453.38 | 16.46 |
| 1.22 | 176.29 | 48.97 | 3086 | 6.0102 | 436.46 | 16.46 |
| 1.23 | 176.29 | 48.97 | 3293 | 6.2907 | 500.24 | 16.41 |
| 1.24 | 176.84 | 49.12 | 3285 | 6.2811 | 497.73 | 16.41 |
| 1.25 | 176.84 | 49.12 | 3406 | 6.4353 | 539.64 | 16.34 |
| 1.26 | 166.66 | 46.29 | 2822 | 5.6191 | 378.83 | 16.56 |
| 1.27 | 179.24 | 49.79 | 2686 | 5.407 | 360.41 | 16.56 |
| 1.28 | 179.24 | 49.79 | 3134 | 6.0771 | 450.12 | 16.46 |
| 1.29 | 181.37 | 50.38 | 3107 | 6.0403 | 442.47 | 16.46 |
| 1.30 | 181.37 | 50.38 | 3287 | 6.2836 | 498.4 | 16.41 |
| 1.31 | 183.47 | 50.96 | 3260 | 6.2478 | 489.22 | 16.41 |
| 1.32 | 183.47 | 50.96 | 3403 | 6.4315 | 538.52 | 16.34 |
| 1.33 | 22.47 | 6.24 | 888 | 2.37 | 206.71 | 17.17 |
| 1.34 | 15.34 | 4.26 | 888 | 2.37 | 206.71 | 17.17 |
| 1.35 | 6.80 | 1.89 | 888 | 2.37 | 206.71 | 17.17 |
| 1.36 | 8.53 | 2.37 | 888 | 2.37 | 206.71 | 17.17 |
| 1.37 | 2.86 | 0.79 | 888 | 2.37 | 206.71 | 17.17 |
| 1.38 | 2.70 | 0.75 | 888 | 2.37 | 206.71 | 17.17 |
| 1.39 | 0.16 | 0.04 | 888 | 2.37 | 206.71 | 17.17 |
| 1.40 | 4.28 | 1.19 | 888 | 2.37 | 206.71 | 17.17 |
| 1.41 | 3.37 | 0.94 | 888 | 2.37 | 206.71 | 17.17 |
| 1.42 | 0.91 | 0.25 | 888 | 2.37 | 206.71 | 17.17 |
| 1.43 | 30.19 | 8.38 | 881 | 2.3551 | 205.12 | 17.27 |
| 1.44 | 20.82 | 5.78 | 881 | 2.3551 | 205.12 | 17.27 |
| 1.45 | 8.24 | 2.29 | 881 | 2.3551 | 205.12 | 17.27 |
| 1.46 | 12.58 | 3.49 | 881 | 2.3551 | 205.12 | 17.27 |
| 1.47 | 6.73 | 1.87 | 881 | 2.3551 | 205.12 | 17.27 |
| 1.48 | 4.59 | 1.28 | 881 | 2.3551 | 205.12 | 17.27 |
| 1.49 | 2.13 | 0.59 | 881 | 2.3551 | 205.12 | 17.27 |
| 1.50 | 2.64 | 0.73 | 881 | 2.3551 | 205.12 | 17.27 |
| 1.51 | 0.55 | 0.15 | 881 | 2.3551 | 205.12 | 17.27 |
| 1.52 | 2.10 | 0.58 | 881 | 2.3551 | 205.12 | 17.27 |
| 1.53 | 145.37 | 40.38 | 3058 | 6.8819 | 311.58 | 1.77 |
| 1.54 | 147.34 | 40.93 | 3025 | 6.8246 | 297.06 | 1.77 |
| 1.55 | 147.34 | 40.93 | 3292 | 7.2626 | 417.84 | 1.72 |
| 1.56 | 147.34 | 40.93 | 3427 | 7.4547 | 479.8 | 1.7 |
| 1.57 | 150.23 | 41.73 | 3372 | 7.381 | 454.72 | 1.7 |
| 1.58 | 150.23 | 41.73 | 3559 | 7.6424 | 539.65 | 1.63 |
| 1.59 | 142.11 | 39.48 | 3063 | 6.89 | 313.68 | 1.77 |
| 1.60 | 147.11 | 40.86 | 2979 | 6.7421 | 277.24 | 1.77 |
| 1.61 | 147.11 | 40.86 | 3228 | 7.168 | 388.32 | 1.72 |
| 1.62 | 147.11 | 40.86 | 3454 | 7.4909 | 492.39 | 1.7 |
| 1.63 | 150.26 | 41.74 | 3394 | 7.4111 | 464.85 | 1.7 |
| 1.64 | 150.26 | 41.74 | 3560 | 7.6436 | 540.09 | 1.63 |
| 1.65 | 141.30 | 39.25 | 3056 | 6.879 | 310.85 | 1.77 |
| 1.66 | 145.99 | 40.55 | 2977 | 6.739 | 276.52 | 1.77 |
| 1.67 | 145.99 | 40.55 | 3265 | 7.2235 | 405.48 | 1.72 |
| 1.68 | 145.99 | 40.55 | 3466 | 7.5066 | 497.91 | 1.7 |
| 1.69 | 150.25 | 41.74 | 3385 | 7.398 | 460.44 | 1.7 |
| 1.70 | 150.25 | 41.74 | 3560 | 7.6442 | 540.33 | 1.63 |
| 1.71 | 144.64 | 40.18 | 3063 | 6.8905 | 313.81 | 1.77 |
| 1.72 | 146.02 | 40.56 | 3040 | 6.8503 | 303.5 | 1.77 |
| 1.73 | 146.02 | 40.56 | 3300 | 7.2746 | 421.67 | 1.72 |
| 1.74 | 146.02 | 40.56 | 3433 | 7.4632 | 482.73 | 1.7 |
| 1.75 | 150.22 | 41.73 | 3354 | 7.3553 | 446.12 | 1.7 |
| 1.76 | 150.22 | 41.73 | 3560 | 7.6436 | 540.11 | 1.63 |
| 1.77 | 13.01 | 3.61 | 591 | 1.7375 | 140.07 | 2.97 |
| 1.78 | 6.97 | 1.94 | 591 | 1.7375 | 140.07 | 2.97 |
| 1.79 | 1.98 | 0.55 | 591 | 1.7375 | 140.07 | 2.97 |
| 1.80 | 5.00 | 1.39 | 591 | 1.7375 | 140.07 | 2.97 |
| 1.81 | 6.04 | 1.68 | 591 | 1.7375 | 140.07 | 2.97 |
| 1.82 | 2.89 | 0.80 | 591 | 1.7375 | 140.07 | 2.97 |
| 1.83 | 3.15 | 0.87 | 591 | 1.7375 | 140.07 | 2.97 |
| 1.84 | 14.53 | 4.04 | 588 | 1.7267 | 139.19 | 4.63 |
| 1.85 | 6.07 | 1.69 | 588 | 1.7267 | 139.19 | 4.63 |
| 1.86 | 4.69 | 1.30 | 588 | 1.7267 | 139.19 | 4.63 |
| 1.87 | 1.38 | 0.38 | 588 | 1.7267 | 139.19 | 4.63 |
| 1.88 | 8.46 | 2.35 | 588 | 1.7267 | 139.19 | 4.63 |
| 1.89 | 4.26 | 1.18 | 588 | 1.7267 | 139.19 | 4.63 |
| 1.90 | 4.20 | 1.17 | 588 | 1.7267 | 139.19 | 4.63 |
| Point No. | Mass Flow, t/h | Mass Flow, kg/s | Enthalpy, kJ/kg | Entropy, kJ/(kg × K) | Temperature, °C | Pressure, MPa |
|---|---|---|---|---|---|---|
| 1.1 | 1530.00 | 425.00 | 1089 | 2.7645 | 250.52 | 19.17 |
| 1.2 | 1530.00 | 425.00 | 1193 | 2.9602 | 272.19 | 18.69 |
| 1.3 | 1530.00 | 425.00 | 2493 | 5.0748 | 359.4 | 18.53 |
| 1.4 | 1530.00 | 425.00 | 2722 | 5.4393 | 374.71 | 18.07 |
| 1.5 | 390.02 | 108.34 | 2722 | 5.4393 | 374.71 | 18.07 |
| 1.6 | 390.02 | 108.34 | 2722 | 5.4393 | 374.71 | 18.07 |
| 1.7 | 390.02 | 108.34 | 3043 | 5.9197 | 433.09 | 17.88 |
| 1.8 | 390.02 | 108.34 | 3043 | 5.9197 | 433.09 | 17.88 |
| 1.9 | 390.02 | 108.34 | 3279 | 6.2502 | 500 | 17.37 |
| 1.10 | 400.86 | 111.35 | 3219 | 6.1715 | 480.61 | 17.37 |
| 1.11 | 400.86 | 111.35 | 3403 | 6.4212 | 540.26 | 16.76 |
| 1.12 | 386.14 | 107.26 | 2722 | 5.4393 | 374.71 | 18.07 |
| 1.13 | 386.14 | 107.26 | 2722 | 5.4393 | 374.71 | 18.07 |
| 1.14 | 386.14 | 107.26 | 3034 | 5.9072 | 430.86 | 17.88 |
| 1.15 | 388.42 | 107.89 | 3022 | 5.8907 | 427.98 | 17.88 |
| 1.16 | 388.42 | 107.89 | 3276 | 6.2458 | 499.08 | 17.39 |
| 1.17 | 390.92 | 108.59 | 3261 | 6.2273 | 494.43 | 17.39 |
| 1.18 | 390.92 | 108.59 | 3402 | 6.4206 | 540.07 | 16.76 |
| 1.19 | 377.11 | 104.75 | 2722 | 5.4393 | 374.71 | 18.07 |
| 1.20 | 378.31 | 105.09 | 2716 | 5.4311 | 374.08 | 18.07 |
| 1.21 | 378.31 | 105.09 | 3059 | 5.9431 | 437.34 | 17.88 |
| 1.22 | 385.71 | 107.14 | 3021 | 5.8884 | 427.59 | 17.88 |
| 1.23 | 385.71 | 107.14 | 3274 | 6.244 | 498.52 | 17.38 |
| 1.24 | 386.71 | 107.42 | 3268 | 6.2365 | 496.63 | 17.38 |
| 1.25 | 386.71 | 107.42 | 3402 | 6.4213 | 540.05 | 16.74 |
| 1.26 | 376.76 | 104.66 | 2722 | 5.4393 | 374.71 | 18.07 |
| 1.27 | 382.81 | 106.34 | 2695 | 5.8276 | 371.66 | 18.07 |
| 1.28 | 382.81 | 106.34 | 3076 | 5.9658 | 441.59 | 17.88 |
| 1.29 | 382.81 | 106.34 | 3076 | 5.9658 | 441.59 | 17.88 |
| 1.30 | 382.81 | 106.34 | 3274 | 6.2441 | 498.24 | 17.35 |
| 1.31 | 392.99 | 109.16 | 3216 | 6.1684 | 479.69 | 17.35 |
| 1.32 | 392.99 | 109.16 | 3402 | 6.4204 | 539.8 | 16.74 |
| 1.33 | 15.615 | 4.34 | 1056 | 2.7014 | 243.48 | 19.16 |
| 1.34 | 0 | 0.00 | 1056 | 2.7014 | 243.48 | 19.16 |
| 1.35 | 0 | 0.00 | 1056 | 2.7014 | 243.48 | 19.16 |
| 1.36 | 0 | 0.00 | 1056 | 2.7014 | 243.48 | 19.16 |
| 1.37 | 2.2804 | 0.63 | 1056 | 2.7014 | 243.48 | 19.16 |
| 1.38 | 0 | 0.00 | 1056 | 2.7014 | 243.48 | 19.16 |
| 1.39 | 2.2804 | 0.63 | 1056 | 2.7014 | 243.48 | 19.16 |
| 1.40 | 13.335 | 3.70 | 1056 | 2.7014 | 243.48 | 19.16 |
| 1.41 | 10.836 | 3.01 | 1056 | 2.7014 | 243.48 | 19.16 |
| 1.42 | 2.4986 | 0.69 | 1056 | 2.7014 | 243.48 | 19.16 |
| 1.43 | 25.826 | 7.17 | 1048 | 2.6863 | 241.8 | 19.15 |
| 1.44 | 7.2466 | 2.01 | 1048 | 2.6863 | 241.8 | 19.15 |
| 1.45 | 1.1975 | 0.33 | 1048 | 2.6863 | 241.8 | 19.15 |
| 1.46 | 6.0491 | 1.68 | 1048 | 2.6863 | 241.8 | 19.15 |
| 1.47 | 7.4007 | 2.06 | 1048 | 2.6863 | 241.8 | 19.15 |
| 1.48 | 7.4007 | 2.06 | 1048 | 2.6863 | 241.8 | 19.15 |
| 1.49 | 0 | 0.00 | 1048 | 2.6863 | 241.8 | 19.15 |
| 1.50 | 11.179 | 3.11 | 1048 | 2.6863 | 241.8 | 19.15 |
| 1.51 | 0.99965 | 0.28 | 1048 | 2.6863 | 241.8 | 19.15 |
| 1.52 | 10.179 | 2.83 | 1048 | 2.6863 | 241.8 | 19.15 |
| 1.53 | 350.88 | 97.47 | 3058 | 6.5244 | 335.81 | 4.04 |
| 1.54 | 353.09 | 98.08 | 3043 | 6.4995 | 330.02 | 4.04 |
| 1.55 | 353.09 | 98.08 | 3255 | 6.8433 | 415.99 | 3.9 |
| 1.56 | 353.09 | 98.08 | 3406 | 7.0591 | 481.67 | 3.84 |
| 1.57 | 358.34 | 99.54 | 3365 | 7.0052 | 463.94 | 3.84 |
| 1.58 | 358.34 | 99.54 | 3539 | 7.2512 | 539.88 | 3.66 |
| 1.59 | 343.52 | 95.42 | 3062 | 6.5311 | 337.39 | 4.04 |
| 1.60 | 349.19 | 97.00 | 3023 | 6.4663 | 322.51 | 4.04 |
| 1.61 | 349.19 | 97.00 | 3227 | 6.8018 | 404.18 | 3.91 |
| 1.62 | 349.19 | 97.00 | 3424 | 7.0827 | 490.03 | 3.85 |
| 1.63 | 358.33 | 99.54 | 3354 | 6.9883 | 458.9 | 3.85 |
| 1.64 | 358.33 | 99.54 | 3539 | 7.2508 | 539.74 | 3.66 |
| 1.65 | 341.31 | 94.81 | 3063 | 6.5315 | 337.48 | 4.04 |
| 1.66 | 347.21 | 96.45 | 3022 | 6.4637 | 321.93 | 4.04 |
| 1.67 | 347.21 | 96.45 | 3247 | 6.8307 | 412.67 | 3.91 |
| 1.68 | 347.21 | 96.45 | 3440 | 7.1034 | 497.02 | 3.85 |
| 1.69 | 358.31 | 99.53 | 3354 | 6.9886 | 459.01 | 3.85 |
| 1.70 | 358.31 | 99.53 | 3540 | 7.252 | 540.17 | 3.66 |
| 1.71 | 341.61 | 94.89 | 3069 | 6.5426 | 340.14 | 4.04 |
| 1.72 | 351.14 | 97.54 | 3004 | 6.4337 | 315.38 | 4.04 |
| 1.73 | 351.14 | 97.54 | 3257 | 6.847 | 417.11 | 3.9 |
| 1.74 | 351.14 | 97.54 | 3416 | 7.073 | 486.31 | 3.84 |
| 1.75 | 358.39 | 99.55 | 3360 | 6.9983 | 461.7 | 3.84 |
| 1.76 | 358.39 | 99.55 | 3540 | 7.2517 | 540.05 | 3.66 |
| 1.77 | 22.265 | 6.18 | 656 | 1.8893 | 155.08 | 4.28 |
| 1.78 | 7.8837 | 2.19 | 656 | 1.8893 | 155.08 | 4.28 |
| 1.79 | 2.2164 | 0.62 | 656 | 1.8893 | 155.08 | 4.28 |
| 1.80 | 5.6674 | 1.57 | 656 | 1.8893 | 155.08 | 4.28 |
| 1.81 | 14.381 | 3.99 | 656 | 1.8893 | 155.08 | 4.28 |
| 1.82 | 5.2407 | 1.46 | 656 | 1.8893 | 155.08 | 4.28 |
| 1.83 | 9.1403 | 2.54 | 656 | 1.8893 | 155.08 | 4.28 |
| 1.84 | 33.779 | 9.38 | 658 | 1.8885 | 155.27 | 6.68 |
| 1.85 | 15.423 | 4.28 | 658 | 1.8885 | 155.27 | 6.68 |
| 1.86 | 5.8979 | 1.64 | 658 | 1.8885 | 155.27 | 6.68 |
| 1.87 | 9.5254 | 2.65 | 658 | 1.8885 | 155.27 | 6.68 |
| 1.88 | 18.356 | 5.10 | 658 | 1.8885 | 155.27 | 6.68 |
| 1.89 | 11.102 | 3.08 | 658 | 1.8885 | 155.27 | 6.68 |
| 1.90 | 7.2532 | 2.01 | 658 | 1.8885 | 155.27 | 6.68 |
| Point No. | Mass Flow, t/h | Mass Flow, kg/s | Enthalpy, kJ/kg | Entropy, kJ/(kg × K) | Temperature, °C | Pressure, kPa |
|---|---|---|---|---|---|---|
| 1.91 | 2271.8 | 631.06 | 2308.15 | 7.7574 | 1847.5 | 101.42 |
| 1.92 | 2271.8 | 631.06 | 1441.77 | 7.2683 | 1211.5 | 101.32 |
| 1.93 | 2271.8 | 631.06 | 1302.74 | 7.172 | 1105.8 | 101.32 |
| 1.94 | 2271.8 | 631.06 | 1071.69 | 6.9939 | 926.72 | 101.32 |
| 1.95 | 2271.8 | 631.06 | 963.25 | 6.9007 | 840.95 | 101.32 |
| 1.96 | 2271.8 | 631.06 | 848.49 | 6.7936 | 748.78 | 101.32 |
| 1.97 | 2271.8 | 631.06 | 736.41 | 6.679 | 657.21 | 101.32 |
| 1.98 | 2271.8 | 631.06 | 576.20 | 6.4933 | 523.28 | 101.32 |
| 1.99 | 2271.8 | 631.06 | 422.30 | 6.2835 | 390.7 | 101.32 |
| 1.100 | 2271.8 | 631.06 | 378.83 | 6.2158 | 352.46 | 101.32 |
| 1.101 | 758.04 | 210.57 | 378.83 | 6.2158 | 352.46 | 100.70 |
| 1.102 | 758.04 | 210.57 | 148.75 | 5.7736 | 143.15 | 98.18 |
| 1.103 | 758.04 | 210.57 | 157.60 | 5.7808 | 151.44 | 103.24 |
| 1.104 | 668.56 | 185.71 | 26.44 | 5.4292 | 26.68 | 100.25 |
| 1.105 | 579.08 | 160.86 | 30.58 | 5.4354 | 30.86 | 103.04 |
| 1.106 | 579.08 | 160.86 | 327.26 | 6.135 | 320.49 | 102.24 |
| 1.107 | 752.13 | 208.93 | 378.83 | 6.2158 | 352.46 | 100.70 |
| 1.108 | 752.13 | 208.93 | 154.73 | 5.7876 | 148.76 | 98.33 |
| 1.109 | 752.13 | 208.93 | 163.23 | 5.7939 | 156.71 | 103.30 |
| 1.110 | 669.49 | 185.97 | 28.85 | 5.4375 | 29.11 | 100.25 |
| 1.111 | 586.84 | 163.01 | 33.24 | 5.4442 | 33.55 | 103.07 |
| 1.112 | 586.84 | 163.01 | 316.12 | 6.1158 | 309.94 | 102.22 |
| 1.113 | 776.23 | 215.62 | 378.83 | 6.2158 | 352.46 | 100.70 |
| 1.114 | 776.23 | 215.62 | 155.11 | 5.7895 | 149.11 | 97.97 |
| 1.115 | 776.23 | 215.62 | 162.08 | 5.7916 | 155.63 | 103.16 |
| 1.116 | 692.95 | 192.49 | 26.59 | 5.4297 | 26.83 | 100.25 |
| 1.117 | 609.67 | 169.35 | 30.64 | 5.4356 | 30.92 | 103.02 |
| 1.118 | 609.67 | 169.35 | 311.15 | 6.1073 | 305.23 | 102.14 |
| Point No. | Mass Flow, kg/s | Enthalpy, kJ/kg | Entropy, kJ/(kg × K) | Temperature, °C | Pressure, MPa |
|---|---|---|---|---|---|
| 2.1 | 100.31 | 3403.46 | 6.44 | 537.83 | 16.11 |
| 2.2 | 100.52 | 3405.58 | 6.44 | 538.76 | 16.15 |
| 2.3 | 200.83 | 3404.52 | 6.44 | 538.21 | 16.11 |
| 2.4 | 100.30 | 3404.52 | 6.44 | 538.21 | 16.11 |
| 2.5 | 100.53 | 3404.52 | 6.44 | 538.21 | 16.11 |
| 2.6 | 0.00 | 3404.52 | 6.44 | 538.21 | 16.11 |
| 2.7 | 100.53 | 3404.52 | 6.44 | 538.21 | 16.11 |
| 2.8 | 100.30 | 3404.52 | 6.44 | 538.21 | 16.11 |
| 2.9 | 1.00 | 3404.52 | 6.44 | 538.21 | 16.11 |
| 2.10 | 99.53 | 3404.52 | 6.44 | 538.21 | 16.11 |
| 2.11 | 1.00 | 3404.52 | 6.44 | 538.21 | 16.11 |
| 2.12 | 99.30 | 3404.52 | 6.44 | 538.21 | 16.11 |
| 2.13 | 1.00 | 3404.52 | 6.87 | 491.54 | 5.84 |
| 2.14 | 99.53 | 3404.52 | 6.75 | 500.57 | 7.66 |
| 2.15 | 1.00 | 3404.52 | 6.87 | 491.39 | 5.81 |
| 2.16 | 99.30 | 3404.52 | 6.76 | 499.65 | 7.47 |
| 2.17 | 1.00 | 3406.11 | 6.87 | 492.38 | 5.872 |
| 2.18 | 99.53 | 3328.88 | 6.77 | 459.74 | 5.872 |
| 2.19 | 1.00 | 3407.62 | 6.87 | 493.02 | 5.872 |
| 2.20 | 99.30 | 3335.82 | 6.78 | 462.66 | 5.872 |
| 2.21 | 200.83 | 3333.09 | 6.77 | 461.51 | 5.872 |
| 2.22 | 200.83 | 3053.59 | 6.84 | 311.20 | 1.91 |
| 2.23 | 185.83 | 3053.59 | 6.84 | 311.20 | 1.91 |
| 2.24 | 6.20 | 3053.59 | 6.84 | 311.20 | 1.91 |
| 2.25 | 6.20 | 3053.59 | 6.84 | 311.20 | 1.91 |
| 2.26 | 169.44 | 3551.09 | 7.63 | 536.29 | 1.65 |
| 2.27 | 84.72 | 3551.09 | 7.63 | 536.29 | 1.65 |
| 2.28 | 84.72 | 3551.09 | 7.63 | 536.29 | 1.65 |
| 2.29 | 84.72 | 3551.09 | 7.63 | 536.29 | 1.65 |
| 2.30 | 84.72 | 3551.09 | 7.63 | 536.29 | 1.65 |
| 2.31 | 42.36 | 3551.09 | 7.63 | 536.29 | 1.65 |
| 2.32 | 42.36 | 3551.09 | 7.63 | 536.29 | 1.65 |
| 2.33 | 42.36 | 3551.09 | 7.63 | 536.29 | 1.65 |
| 2.34 | 42.36 | 3551.09 | 7.63 | 536.29 | 1.65 |
| 2.35 | 42.36 | 3551.09 | 7.63 | 536.29 | 1.65 |
| 2.36 | 42.36 | 3551.09 | 7.63 | 536.29 | 1.65 |
| 2.37 | 42.36 | 3551.09 | 7.63 | 536.29 | 1.65 |
| 2.38 | 42.36 | 3551.09 | 7.63 | 536.29 | 1.65 |
| 2.39 | 169.44 | 3551.09 | 7.63 | 536.29 | 1.65 |
| 2.40 | 169.44 | 3386.99 | 7.66 | 457.24 | 0.97 |
| 2.41 | 165.44 | 3386.99 | 7.66 | 457.24 | 0.97 |
| 2.42 | 2.00 | 3386.99 | 7.66 | 457.24 | 0.97 |
| 2.43 | 2.00 | 3386.99 | 7.66 | 457.24 | 0.97 |
| 2.44 | 165.44 | 3264.97 | 7.68 | 397.40 | 0.629 |
| 2.45 | 150.05 | 3264.97 | 7.68 | 397.40 | 0.629 |
| 2.46 | 4.53 | 3264.97 | 7.68 | 397.40 | 0.629 |
| 2.47 | 4.50 | 3264.97 | 7.68 | 397.40 | 0.629 |
| 2.48 | 6.37 | 3264.97 | 7.68 | 397.40 | 0.629 |
| 2.49 | 6.37 | 3264.97 | 7.91 | 395.57 | 0.384 |
| 2.50 | 6.24 | 3264.97 | 7.91 | 395.57 | 0.384 |
| 2.51 | 25.43 | 660.22 | 1.91 | 156.58 | 0.61 |
| 2.52 | 150.05 | 3070.23 | 7.73 | 300.02 | 0.288 |
| 2.53 | 146.39 | 3070.23 | 7.73 | 300.02 | 0.288 |
| 2.54 | 3.66 | 3070.23 | 7.73 | 300.02 | 0.288 |
| 2.55 | 3.66 | 3070.23 | 7.77 | 300.00 | 0.26 |
| 2.56 | 3.66 | 3071.59 | 7.83 | 300.00 | 0.23 |
| 2.57 | 183.25 | 524.45 | 1.58 | 124.70 | 0.23 |
| 2.58 | 154.16 | 438.04 | 1.36 | 104.59 | 0.23 |
| 2.59 | 146.39 | 2909.23 | 7.77 | 217.75 | 0.135 |
| 2.60 | 69.83 | 2909.23 | 7.77 | 217.75 | 0.135 |
| 2.61 | 69.34 | 2909.23 | 7.77 | 217.75 | 0.135 |
| 2.62 | 7.22 | 2909.23 | 7.77 | 217.75 | 0.135 |
| 2.63 | 69.83 | 2719.99 | 7.82 | 118.93 | 0.047 |
| 2.64 | 69.34 | 2719.99 | 7.82 | 118.93 | 0.047 |
| 2.65 | 65.43 | 2719.99 | 7.82 | 118.93 | 0.047 |
| 2.66 | 4.40 | 2719.99 | 7.82 | 118.93 | 0.047 |
| 2.67 | 4.40 | 2719.99 | 7.82 | 118.93 | 0.047 |
| 2.68 | 64.94 | 2719.99 | 7.82 | 118.93 | 0.047 |
| 2.69 | 8.80 | 2719.99 | 7.82 | 118.93 | 0.047 |
| 2.70 | 65.43 | 2498.76 | 7.90 | 45.04 | 0.01 |
| 2.71 | 64.94 | 2498.76 | 7.90 | 45.04 | 0.01 |
| 2.72 | 64.24 | 2498.76 | 7.90 | 45.04 | 0.01 |
| 2.73 | 1.19 | 2498.76 | 7.90 | 45.04 | 0.01 |
| 2.74 | 63.75 | 2498.76 | 7.90 | 45.04 | 0.01 |
| 2.75 | 1.19 | 2498.76 | 7.90 | 45.04 | 0.01 |
| 2.76 | 2.38 | 2498.76 | 7.90 | 45.04 | 0.01 |
| 2.77 | 64.24 | 2350.08 | 7.96 | 22.72 | 0.003 |
| 2.78 | 63.75 | 2350.08 | 7.96 | 22.72 | 0.003 |
| 2.79 | 64.24 | 90.47 | 0.32 | 21.72 | 0.003 |
| 2.80 | 63.75 | 90.47 | 0.32 | 21.72 | 0.003 |
| 2.81 | 6024.85 | 64.24 | 0.23 | 15.41 | 0.17 |
| 2.82 | 6024.85 | 88.34 | 0.31 | 21.18 | 0.12 |
| 2.83 | 6024.85 | 88.34 | 0.31 | 21.18 | 0.1 |
| 2.84 | 7898.29 | 62.95 | 0.23 | 15.10 | 0.17 |
| 2.85 | 7898.29 | 81.18 | 0.29 | 19.47 | 0.12 |
| 2.86 | 7898.29 | 81.18 | 0.29 | 19.47 | 0.1 |
| 2.87 | 2.49 | 177.36 | 0.61 | 42.50 | 0.01 |
| 2.88 | 11.59 | 62.46 | 0.22 | 15.00 | 0.1 |
| 2.89 | 139.57 | 88.15 | 0.31 | 21.16 | 0.003 |
| 2.90 | 139.57 | 90.25 | 0.31 | 21.31 | 1.58 |
| 2.91 | 2830.40 | 64.24 | 0.23 | 15.41 | 0.17 |
| 2.92 | 3194.44 | 64.24 | 0.23 | 15.41 | 0.17 |
| 2.93 | 4334.40 | 62.95 | 0.23 | 15.10 | 0.17 |
| 2.94 | 3563.89 | 62.95 | 0.23 | 15.10 | 0.17 |
| 2.95 | 6024.85 | 64.24 | 0.23 | 15.41 | 0.17 |
| 2.96 | 7898.29 | 62.95 | 0.23 | 15.10 | 0.17 |
| 2.97 | 315.84 | 64.24 | 0.23 | 15.41 | 0.17 |
| 2.98 | 315.84 | 64.24 | 0.23 | 15.41 | 0.17 |
| 2.99 | 516.38 | 62.95 | 0.23 | 15.10 | 0.17 |
| 2.100 | 516.38 | 62.95 | 0.23 | 15.10 | 0.17 |
| 2.101 | 6340.69 | 64.24 | 0.23 | 15.41 | 0.17 |
| 2.102 | 6340.69 | 64.24 | 0.23 | 15.41 | 0.17 |
| 2.103 | 6340.69 | 64.07 | 0.23 | 15.38 | 0.1 |
| 2.104 | 8414.67 | 62.95 | 0.23 | 15.10 | 0.17 |
| 2.105 | 8414.67 | 62.95 | 0.23 | 15.10 | 0.17 |
| 2.106 | 8414.67 | 62.79 | 0.23 | 15.08 | 0.1 |
| 2.107 | 832.22 | 63.44 | 0.23 | 15.22 | 0.17 |
| 2.108 | 416.11 | 63.44 | 0.23 | 15.22 | 0.17 |
| 2.109 | 416.11 | 63.44 | 0.23 | 15.22 | 0.17 |
| 2.110 | 416.11 | 63.44 | 0.23 | 15.22 | 0.17 |
| 2.111 | 416.11 | 63.44 | 0.23 | 15.22 | 0.17 |
| 2.112 | 832.22 | 63.44 | 0.23 | 15.22 | 0.17 |
| 2.113 | 832.22 | 82.22 | 0.29 | 19.72 | 0.1 |
| 2.114 | 6.24 | 2605.17 | 8.76 | 55.82 | 0.003 |
| 2.115 | 6.24 | 97.64 | 0.35 | 23.43 | 0.003 |
| 2.116 | 139.57 | 90.25 | 0.31 | 21.31 | 1.579 |
| 2.117 | 1.96 | 2747.86 | 7.55 | 135.62 | 0.1 |
| 2.118 | 1.96 | 286.40 | 0.94 | 68.54 | 0.1 |
| 2.119 | 139.57 | 124.86 | 0.43 | 29.62 | 1.479 |
| 2.120 | 2.49 | 2551.60 | 8.07 | 44.83 | 0.01 |
| 2.121 | 139.57 | 167.19 | 0.57 | 39.84 | 1.079 |
| 2.122 | 139.57 | 167.19 | 0.57 | 39.84 | 1.079 |
| 2.123 | 0.00 | 167.19 | 0.57 | 39.84 | 1.079 |
| 2.124 | 8.82 | 2716.99 | 7.83 | 117.29 | 0.045 |
| 2.125 | 139.57 | 318.43 | 1.03 | 76.07 | 0.679 |
| 2.126 | 155.62 | 320.43 | 1.03 | 76.55 | 0.679 |
| 2.127 | 16.04 | 332.64 | 1.07 | 78.80 | 0.045 |
| 2.128 | 7.22 | 2853.76 | 7.65 | 189.92 | 0.135 |
| 2.129 | 7.22 | 344.06 | 1.10 | 82.28 | 0.135 |
| 2.130 | 154.16 | 438.04 | 1.36 | 104.58 | 0.269 |
| 2.131 | 0.10 | 3053.59 | 6.84 | 311.20 | 1.91 |
| 2.132 | 183.25 | 527.53 | 1.59 | 125.45 | 1.79 |
| 2.133 | 183.25 | 531.13 | 1.59 | 125.84 | 4.63 |
| 2.134 | 0.29 | 531.13 | 1.59 | 125.84 | 4.63 |
| 2.135 | 182.96 | 547.55 | 1.59 | 127.59 | 17.6 |
| 2.136 | 0.13 | 3264.97 | 7.91 | 395.57 | 0.384 |
| 2.137 | 0.00 | 547.55 | 1.59 | 127.59 | 17.6 |
| 2.138 | 0.00 | 547.55 | 1.59 | 127.59 | 17.6 |
| 2.139 | 91.48 | 547.55 | 1.59 | 127.59 | 17.6 |
| 2.140 | 12.73 | 660.97 | 1.91 | 156.75 | 0.61 |
| 2.141 | 91.48 | 679.04 | 1.91 | 158.56 | 17.6 |
| 2.142 | 4.53 | 3264.97 | 7.69 | 397.26 | 0.61 |
| 2.143 | 0.20 | 896.19 | 2.39 | 208.40 | 17.6 |
| 2.144 | 0.20 | 1030.94 | 2.66 | 238.16 | 17.6 |
| 2.145 | 91.48 | 744.27 | 2.06 | 173.73 | 17.6 |
| 2.146 | 2.00 | 3386.99 | 7.71 | 456.65 | 0.87 |
| 2.147 | 8.20 | 692.59 | 1.98 | 164.00 | 0.87 |
| 2.148 | 0.20 | 896.19 | 2.39 | 208.39 | 17.6 |
| 2.149 | 0.20 | 1095.56 | 2.78 | 252.00 | 17.6 |
| 2.150 | 6.20 | 792.32 | 2.20 | 186.60 | 1.84 |
| 2.151 | 6.20 | 3053.59 | 6.86 | 310.40 | 1.84 |
| 2.152 | 91.48 | 897.53 | 2.39 | 208.70 | 17.6 |
| 2.153 | 0.40 | 896.19 | 2.39 | 208.70 | 17.6 |
| 2.154 | 91.08 | 897.53 | 2.39 | 208.70 | 17.6 |
| 2.155 | 0.40 | 1063.25 | 2.72 | 245.12 | 17.6 |
| 2.156 | 91.48 | 898.26 | 2.39 | 208.87 | 17.6 |
| 2.157 | 91.48 | 547.55 | 1.59 | 127.59 | 17.6 |
| 2.158 | 12.70 | 659.46 | 1.91 | 156.40 | 0.61 |
| 2.159 | 91.48 | 678.63 | 1.91 | 158.46 | 17.6 |
| 2.160 | 4.50 | 3264.97 | 7.69 | 397.26 | 0.61 |
| 2.161 | 0.20 | 896.19 | 2.39 | 208.40 | 17.6 |
| 2.162 | 0.20 | 1104.79 | 2.80 | 253.95 | 17.6 |
| 2.163 | 91.48 | 742.93 | 2.05 | 173.42 | 17.6 |
| 2.164 | 2.00 | 3387.00 | 7.71 | 456.65 | 0.87 |
| 2.165 | 0.20 | 896.19 | 2.39 | 208.40 | 17.6 |
| 2.166 | 0.20 | 1042.50 | 2.68 | 240.66 | 17.6 |
| 2.167 | 6.20 | 782.75 | 2.18 | 184.44 | 1.84 |
| 2.168 | 6.20 | 3053.60 | 6.86 | 310.40 | 1.84 |
| 2.169 | 91.48 | 896.83 | 2.39 | 208.55 | 17.6 |
| 2.170 | 0.40 | 896.19 | 2.39 | 208.40 | 17.6 |
| 2.171 | 91.08 | 896.83 | 2.39 | 208.55 | 17.6 |
| 2.172 | 0.40 | 1073.65 | 2.74 | 247.34 | 17.6 |
| 2.173 | 91.48 | 897.62 | 2.39 | 208.72 | 17.6 |
| 2.174 | 182.96 | 897.94 | 2.39 | 208.79 | 17.6 |
| 2.175 | 165.03 | 897.94 | 2.39 | 208.79 | 17.6 |
| 2.176 | 17.93 | 897.94 | 2.39 | 208.79 | 17.6 |
| 2.177 | 16.04 | 337.78 | 1.08 | 80.68 | 0.679 |
| 2.178 | 8.20 | 697.03 | 1.99 | 165.02 | 0.87 |
References
- Szargut, J.; Petela, R. Egzergia; Wydawnictwa Naukowo-Techniczne: Warszawa, Poland, 1965. [Google Scholar]
- Terzi, R. Application of Exergy Analysis to Energy Systems. In Application of Exergy; Tolga, T., Ed.; IntechOpen: London, UK, 2018. [Google Scholar]
- Lozano, M.; Valero, A. Application of the Exergetic Costs Theory to a Steam Boiler in a Thermal Generating Station. In ASME Book No. G0377B; The American Society of Mechanical Engineers: New York, NY, USA, 1987. [Google Scholar]
- Mitrović, D.M.; Stojanović, B.V.; Janevski, J.N.; Ignjatović, M.G.; Vučković, G.D. Exergy and Exergoeconomic Analysis of a Steam Boiler. Therm. Sci. 2018, 22, S1601–S1612. [Google Scholar] [CrossRef]
- Jamali, J.A.; Memon, A.G.; Harijan, K.; Abbas, Z.; Khuwaja, A. Energy and Exergy Analyses of Boiler and Its Parts of Lakhra Coal Power Plant (FBC) Jamshoro. Noble Int. J. Sci. Res. 2017, 1, 104–111. [Google Scholar]
- Adibhatla, S.; Kaushik, S.C. Energy and Exergy Analysis of a Super Critical Thermal Power Plant at Various Load Conditions under Constant and Pure Sliding Pressure Operation. Appl. Therm. Eng. 2014, 73, 51–65. [Google Scholar] [CrossRef]
- Yang, Y.; Wang, L.; Dong, C.; Xu, G.; Morosuk, T.; Tsatsaronis, G. Comprehensive Exergy-Based Evaluation and Parametric Study of a Coal-Fired Ultra-Supercritical Power Plant. Appl. Energy 2013, 112, 1087–1099. [Google Scholar] [CrossRef]
- Mehmood, S.; Reddy, B.V.; Rosen, M.A. Exergy Analysis of a Biomass Co-Firing Based Pulverized Coal Power Generation System. Int. J. Green Energy 2015, 12, 461–478. [Google Scholar] [CrossRef]
- Hou, D.; Shao, S.; Zhang, Y.; Liu, S.L.; Chen, Y.; Zhang, S.S. Exergy Analysis of a Thermal Power Plant Using a Modeling Approach. Clean Technol. Environ. Policy 2012, 14, 805–813. [Google Scholar] [CrossRef]
- Stanek, W. Analiza Egzergetyczna w Teorii i Praktyce; Wydawnictwo Politechniki Śląskiej: Gliwice, Poland, 2016. [Google Scholar]
- Huang, G.; Huang, C.; Liu, H.; Huang, H.; Shang, W.; Wang, W. Exergy Analysis of Off-Design Performance in Solar-Aided Power Generation Systems: Evaluating the Rationality of Using Part-Load Operation Solution of Coal-Fired Plants. Energy 2024, 302, 131749. [Google Scholar] [CrossRef]
- Chen, Y.; Wu, Y.; Liu, X.; Ma, J.; Liu, D.; Chen, X.; Liu, D. Energy, Exergy and Economic (3E) Analysis of a Novel Integration Process Based on Coal-Fired Power Plant with CO2 Capture & Storage, CO2 Refrigeration, and Waste Heat Recovery. Energy 2024, 299, 131443. [Google Scholar] [CrossRef]
- Guo, J.-Q.; Li, M.-J.; Xu, J.-L.; Yan, J.-J.; Ma, T. Energy, Exergy and Economic (3E) Evaluation and Conceptual Design of the 1000 MW Coal-Fired Power Plants Integrated with S-CO2 Brayton Cycles. Energy Convers. Manag. 2020, 211, 112713. [Google Scholar] [CrossRef]
- Miao, L.; Liu, M.; Zhang, K.; Zhao, Y.; Yan, J. Energy, Exergy, and Economic Analyses on Coal-Fired Power Plants Integrated with the Power-to-Heat Thermal Energy Storage System. Energy 2023, 284, 129236. [Google Scholar] [CrossRef]
- da Silva Neves, M.V.; Szklo, A.; Schaeffer, R. Fossil Fuel Facilities Exergy Return for a Frontier of Analysis Incorporating CO2 Capture: The Case of a Coal Power Plant. Energy 2023, 284, 128541. [Google Scholar] [CrossRef]
- Khosravi, S.; Hossainpour, S.; Farajollahi, H.; Abolzadeh, N. Integration of a Coal Fired Power Plant with Calcium Looping CO2 Capture and Concentrated Solar Power Generation: Energy, Exergy and Economic Analysis. Energy 2022, 240, 122466. [Google Scholar] [CrossRef]
- Zhao, Y.-J.; Zhang, Y.; Cui, Y.; Duan, Y.Y.; Huang, Y.; Wei, G.Q.; Mohamed, U.; Shi, L.J.; Yi, Q.; Nimmo, W. Pinch Combined with Exergy Analysis for Heat Exchange Network and Techno-Economic Evaluation of Coal Chemical Looping Combustion Power Plant with CO2 Capture. Energy 2022, 238, 121720. [Google Scholar] [CrossRef]
- Yan, H.; Liu, M.; Chong, D.; Wang, C.; Yan, J. Dynamic Performance and Control Strategy Comparison of a Solar-Aided Coal-Fired Power Plant Based on Energy and Exergy Analyses. Energy 2021, 236, 121515. [Google Scholar] [CrossRef]
- Fu, Y.; Huang, Y.; Xin, H.; Liu, M.; Wang, L.; Yan, J. The Pressure Sliding Operation Strategy of the Carbon Capture System Integrated within a Coal-Fired Power Plant: Influence Factors and Energy Saving Potentials. Energy 2024, 307, 132737. [Google Scholar] [CrossRef]
- Kumar, V.; Pandya, B.; Matawala, V. Thermodynamic Studies and Parametric Effects on Exergetic Performance of a Steam Power Plant. Int. J. Ambient. Energy 2019, 40, 1–11. [Google Scholar] [CrossRef]
- Aliyu, M.; AlQudaihi, A.B.; Said, S.A.M.; Habib, M.A. Energy, Exergy and Parametric Analysis of a Combined Cycle Power Plant. Therm. Sci. Eng. Prog. 2020, 15, 100450. [Google Scholar] [CrossRef]
- Elhelw, M.; Al Dahma, K.S.; Attia, A.e.H. Utilizing Exergy Analysis in Studying the Performance of Steam Power Plant at Two Different Operation Mode. Appl. Therm. Eng. 2019, 150, 285–293. [Google Scholar] [CrossRef]
- Braimakis, K.; Magiri-Skouloudi, D.; Grimekis, D.; Karellas, S. Εnergy-Exergy Analysis of Ultra-Supercritical Biomass-Fuelled Steam Power Plants for Industrial CHP, District Heating and Cooling. Renew. Energy 2020, 154, 252–269. [Google Scholar] [CrossRef]
- Zhou, J.; Ling, P.; Su, S.; Xu, J.; Xu, K.; Wang, Y.; Hu, S.; Zhu, M.; Xiang, J. Exergy Analysis of a 1000 MW Single Reheat Advanced Supercritical Carbon Dioxide Coal-Fired Partial Flow Power Plant. Fuel 2019, 255, 115777. [Google Scholar] [CrossRef]
- Zueco, J.; López-Asensio, D.; Fernández, F.J.; López-González, L.M. Exergy Analysis of a Steam-Turbine Power Plant Using Thermocombustion. Appl. Therm. Eng. 2020, 180, 115812. [Google Scholar] [CrossRef]
- Akrami, E.; Ameri, M.; Rocco, M.V. Developing an Innovative Biomass-Based Power Plant for Low-Carbon Power Production: Exergy and Exergoeconomic Analyses. Therm. Sci. Eng. Prog. 2020, 19, 100662. [Google Scholar] [CrossRef]
- Lin, L.; Liu, J.; Huang, N.; Li, S.; Zhang, Y. Multiscale Spatio-Temporal Feature Fusion Based Non-Intrusive Appliance Load Monitoring for Multiple Industrial Industries. Appl. Soft Comput. 2024, 167, 112445. [Google Scholar] [CrossRef]
- Zhang, X.; Zhu, Q.; Wang, S.; Ma, T.; Gao, S.; Kong, Y.; Han, Q.; Chu, F. Hybrid Triboelectric-Variable Reluctance Generator Assisted Wireless Intelligent Condition Monitoring of Aero-Engine Main Bearings. Nano Energy 2025, 136, 110721. [Google Scholar] [CrossRef]
- Krawczyk, P.; Szabłowski, Ł.; Karellas, S.; Kakaras, E.; Badyda, K. Comparative Thermodynamic Analysis of Compressed Air and Liquid Air Energy Storage Systems. Energy 2018, 142, 46–54. [Google Scholar] [CrossRef]
- Szablowski, L.; Krawczyk, P.; Badyda, K.; Karellas, S.; Kakaras, E.; Bujalski, W. Energy and Exergy Analysis of Adiabatic Compressed Air Energy Storage System. Energy 2017, 138, 12–18. [Google Scholar] [CrossRef]
- Szablowski, L.; Krawczyk, P.; Wolowicz, M. Exergy Analysis of Adiabatic Liquid Air Energy Storage (A-LAES) System Based on Linde–Hampson Cycle. Energies 2021, 14, 945. [Google Scholar] [CrossRef]
- Szablowski, L.; Morosuk, T. Advanced Exergy Analysis of Adiabatic Underwater Compressed Air Energy Storage System. Entropy 2023, 25, 77. [Google Scholar] [CrossRef]
- Szargut, J. Analiza Egzergetyczna Procesów Cieplnych. Biul. Inst. Tech. Ciepl. 1996, 84, 43–52. [Google Scholar]
- Gray, C.G.; Gubbins, K.E.; Joslin, C.G. Thermodynamic Properties of Pure Fluids. In Theory of Molecular Fluids: Volume 2: Applications; Oxford University Press: Oxford, UK, 2011. [Google Scholar]
- Guerra, M.J. Aspen HYSYS Property Packages. Overview and Best Practices for Optimum Simulations. 2006. Available online: http://sites.poli.usp.br/d/pqi2408/bestpracticesoptimumsimulationshysyspropertypackages.pdf (accessed on 1 January 2025).


| Parameter | Measurement Campaign 1 | Measurement Campaign 2 |
|---|---|---|
| Measurement duration | 53 h | 72 h |
| No. of records | 3180 | 4320 |
| Number of records corresponding to minimum power (45% load) | 820 | 1312 |
| Number of records corresponding to maximum power (100% load) | 1757 | 2365 |
| Number of records rejected in the filtering process | 603 | 643 |
| Number of parameters analysed | 99 | 99 |
Disclaimer/Publisher’s Note: The statements, opinions and data contained in all publications are solely those of the individual author(s) and contributor(s) and not of MDPI and/or the editor(s). MDPI and/or the editor(s) disclaim responsibility for any injury to people or property resulting from any ideas, methods, instructions or products referred to in the content. |
© 2025 by the authors. Licensee MDPI, Basel, Switzerland. This article is an open access article distributed under the terms and conditions of the Creative Commons Attribution (CC BY) license (https://creativecommons.org/licenses/by/4.0/).
Share and Cite
Kurkus-Gruszecka, M.; Szabłowski, Ł.; Dybiński, O.; Krawczyk, P.; Badyda, K.; Kotte, G. Exergy Analysis of 500 MW Power Unit Based on Direct Measurement Data. Energies 2025, 18, 2762. https://doi.org/10.3390/en18112762
Kurkus-Gruszecka M, Szabłowski Ł, Dybiński O, Krawczyk P, Badyda K, Kotte G. Exergy Analysis of 500 MW Power Unit Based on Direct Measurement Data. Energies. 2025; 18(11):2762. https://doi.org/10.3390/en18112762
Chicago/Turabian StyleKurkus-Gruszecka, Michalina, Łukasz Szabłowski, Olaf Dybiński, Piotr Krawczyk, Krzysztof Badyda, and Grzegorz Kotte. 2025. "Exergy Analysis of 500 MW Power Unit Based on Direct Measurement Data" Energies 18, no. 11: 2762. https://doi.org/10.3390/en18112762
APA StyleKurkus-Gruszecka, M., Szabłowski, Ł., Dybiński, O., Krawczyk, P., Badyda, K., & Kotte, G. (2025). Exergy Analysis of 500 MW Power Unit Based on Direct Measurement Data. Energies, 18(11), 2762. https://doi.org/10.3390/en18112762