Abstract
Four types of undulated cylinders with streamwise undulation, transverse undulation, in-phase undulation and antiphase undulation are employed to investigate the undulation-axis effect on the structure of heat transfer around wavy cylinders. The flows around these undulated cylinders are numerically simulated by large eddy simulation at Re = 3000. The force coefficients and Nusselt numbers of the cylinders with transverse undulation and in-phase undulation are significantly influenced by wavelength and wave amplitude. On the other hand, the cylinders with streamwise undulation and antiphase undulation show a very weak dependence of the force coefficients and Nusselt numbers on the combinations of wavelength and wave amplitude. It is noted that the cylinder with antiphase undulation, under certain wavy conditions, provides about the same Nusselt number as the smooth cylinder, even though the force coefficients are considerably decreased. The thermal characteristics, according to the combination of wavy geometric parameters, are supported by the surface distribution of the Nusselt numbers. In addition, the isothermal distribution, which depends on the wake flow, explains the variation in the Nusselt numbers. The present results suggest that a proper modification of geometry can improve both heat transfer and aerodynamic performances.
1. Introduction
The flow around bluff bodies is observed daily in natural phenomena and industrial applications. For this reason, in order to identify the flow characteristics, many researchers have studied different geometrical cross-sections in various applications, for instance, electric and heat transfer equipment, and aerodynamics and hydrodynamics of land or offshore architectural structures. Among them, several studies on wavy cylinders have been recently implemented and published to closely investigate the effect of rectified cylinder geometry on thermal characteristics. From a global perspective, two types of cylinder geometries are mainly taken into account for a detailed description and grouping hereafter, one for wavy cylinders and the other for wavy elliptic cylinders.
For wavy cylinders, Ahn et al. [1] investigated the effect of undulation on fluid flow and forced convection heat transfer around wavy cylinders with different wavelengths, such as π/2, π/3 and π/4, with a fixed amplitude of 0.1 at a Reynolds number and a Prandtl number of 300 and 0.71, respectively. The fluid dynamics and heat transfer around these undulating cylinders are influenced by both the position along the spanwise direction and the wavelength. For a wavy cylinder with a half wavelength (λ/2), the averaged Nusselt number over time and the entire surface are greater than those of a smooth cylinder. Conversely, for cylinders with wavelengths of λ/4 and λ/3, the averaged Nusselt number is smaller compared to that of a smooth cylinder. While Ahn et al. [1] performed their study at a Reynolds number of 300, Kim and Yoon [2] extended the investigation at a higher Reynolds number of 3000 in the subcritical regime. Kim and Yoon [2] also investigated the effect of wavelength (λ/Dm) on the flow and thermal field. They considered a wide range of wavelengths from 1.136 to 6.06 at a Reynolds number of 3000 in the subcritical regime and a Prandtl number of 0.7. They showed that the changes in the mean Nusselt number are correlated with the force coefficients. They found that the critical wavelength occurs at the transition of the point where the maximum Nusselt number is located, shifting from the node to the saddle.
Moon et al. [3] studied the effect of asymmetric wavy (ASW) perturbation on forced convection heat transfer as a passive technique to control the force coefficients by means of a large eddy simulation at a Reynolds number of 3000. The ASW cylinder exhibits the lowest mean and fluctuation in the time- and total surface-averaged Nusselt number compared to the smooth (CY) and symmetric wavy (SW) cylinders. The Nusselt number, averaged over time and locally in the spanwise direction for the SW cylinder, exhibits region-dependent characteristics, with one region remaining invariant and another region showing an increase. The ASW cylinder shows increasing and decreasing performance at the short and long wavelengths, respectively.
Yoon et al. [4] adopted the shape of a double-wavy (DW) cylinder as a geometrical perturbation to control the fluid flow and heat transfer at a Reynolds number and a Prandtl number of 3000 and 0.7, respectively. Among the different geometrical perturbations such as CY and SW, the ASW of a DW cylinder achieves the smallest mean drag and lift fluctuation in terms of not only the force coefficient but also the Nusselt number. The DW cylinder yields a reduced spanwise local Nusselt number across the span when compared to the SW and ASW cylinders. The wake alteration exhibited by the DW cylinder allows the attenuation in heat transfer.
Yoon et al. [5] performed an initial research study on the forced convection heat transfer around a helically twisted elliptic (HTE) cylinder influenced by the structure and design of a daffodil stem. They also investigated the influence of Reynolds number on the system of the laminar flow by means of a numerical simulation at the range of Reynolds numbers of 60 ≤ Re ≤ 150 and a Prandtl number (Pr) of 0.7. The HTE cylinder has much lower drag and lift fluctuation than a smooth cylinder. The variation in Nusselt number along the spanwise direction was discerned through an examination of the flow structures and the distribution of isotherms.
Yoon and Moon [6] conducted a numerical evaluation of the performance of a variable-pitch helically twisted elliptic (VPHTE) cylinder at a Reynolds number of 3000. A comprehensive investigation, including a parametric study on the variable pitch ratio and simulations of both smooth and HTE cylinders for a comparative analysis, was conducted. The obtained results affirm the efficacy of the VPHTE disturbance as a passive flow control strategy for achieving drag reduction and suppressing lift fluctuations, which is in line with previous research findings. The VPHTE cylinder presents a relatively smaller value of total surface-averaged Nusselt number than the smooth and HTE cylinders, with a stabilized time series.
There have been more published studies on wavy elliptic cylinders than wavy cylinders. Kim and Yoon [7] studied the forced convection heat transfer around a biomimetic elliptic cylinder inspired by a harbor seal vibrissa (HSV) by utilizing the technique of large eddy simulation at a Reynolds number and a Prandtl number of 500 and 0.7, respectively. The temporal trends of the surface-averaged Nusselt number demonstrated that the HSV contributed to the stable heat transfer behavior by significantly suppressing its fluctuation, whose characteristics aligned with the HSV’s distinctive ability to suppress lift fluctuation.
Kim and Yoon [8] employed numerical methods to explore the influence of Reynolds number (Re) on the fluid flow and heat transfer characteristics of a biomimetic elliptical cylinder inspired by an HSV at Reynolds numbers ranging from 50 to 500 and a Prandtl number of 0.7. The findings confirm the effect of the distinctive geometry of the HSV in the low Reynolds number regime, demonstrating a reduction in drag and a suppression of lift fluctuation. The root-mean-square (RMS) amplitude of the fluctuating lift is exceedingly small due to the unsteady behavior of the HSV within this Reynolds number range.
Yoon et al. [9] numerically investigated the influence of geometrical characteristics of an HSV on forced convection heat transfer at a Reynolds number of 500. Seven types of HSV geometries were defined to utilize and combine the minor-axis undulation, the major-axis undulation, the both-axis undulation and the offset angle. The inclusion of HSV features in all modified geometries results in a reduction in the time-averaged drag coefficient when compared to the mean drag coefficient of an elliptic cylinder. The authors concluded that it can be cautiously inferred that among the geometrical features of the HSV, the undulation along the major axis is a crucial factor influencing the forced convection heat transfer.
Yoon et al. [10] studied the effect of wavelengths of a wavy elliptic cylinder with different aspect ratios on forced convection heat transfer. They defined four types of wake thermal structures, such as quasi-2D unsteady and steady structures, which are formed by short wavelengths, and complex 3D unsteady and steady structures, which are originated from long wavelengths. The surface distribution of the mean Nusselt number varied based on the characteristics of the thermal structures. In summary, the authors suggested that a streamlined shape plays a dominant role in stabilizing the forced convection as the aspect ratio (AR) decreases, irrespective of the wavelength.
From a review of previous studies, it is found that there is no dedicated study that takes into account the specific types of undulated geometry disturbance to find the effect of heat transfer characteristics and the correlation between undulation geometries. Thus, four types of undulated cylinders with streamwise undulation (SU), transverse undulation (TU), in-phase undulation (IPU) and antiphase undulation (APU) are considered in this study to classify the undulation-axis effect on the wake of flow and the reduction in force coefficients.
The main objective of this study is to confirm whether a geometrical modification of wavy cylinders can well explained the structure of heat transfer around these wavy cylinders. Particularly, it is noted that the motivation for conducting this study is to clarify the thermal and heat transfer characteristics of the proposed undulated cylinders and to identify the correlation among the undulated cylinders with SU, TU, IPU and APU, even though the wavelength (λ) and amplitude (a) of each type are randomly selected and applied, with the combination of λ/Dm = 2.273 and a/Dm = 0.091 being considered as Case 1, while the combination of λ/Dm = 6.06 and a/Dm = 0.152 is considered as Case 2.
2. Numerical Details
2.1. Geometry Definitions
The shapes of smooth cylinders (CY) with in-phase undulation (IPU), transverse undulation (TU), streamwise undulation (SU) and antiphase undulation (APU) are depicted in Figure 1. The local diameter () of a cylinder with IPU is defined as follows:
where a and λ are the amplitude and wavelength of the waviness, respectively; is the mean diameter of the wavy cylinder, which is the mean value of the maximum and minimum local diameters ( and ); and is the same as the diameter of a smooth cylinder.
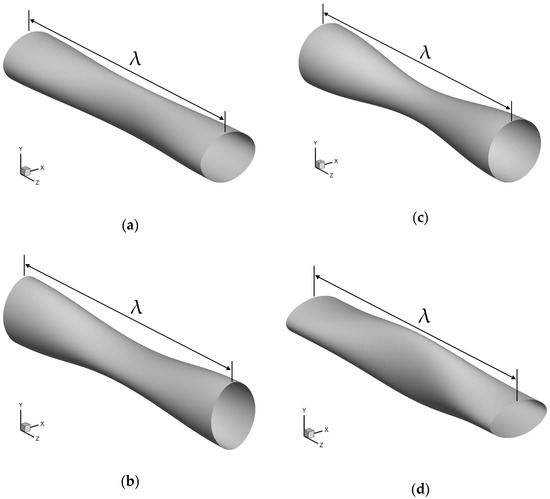
Figure 1.
The geometries of cylinders with (a) SU, (b) TU, (c) IPU and (d) APU.
The locations of , and are at the node, the middle and the saddle, respectively, as shown in Figure 2. As mentioned above, the combination of λ/Dm = 2.273 and a/Dm = 0.091 is considered Case 1, while the combination of λ/Dm = 6.06 and a/Dm = 0.152 is considered Case 2.
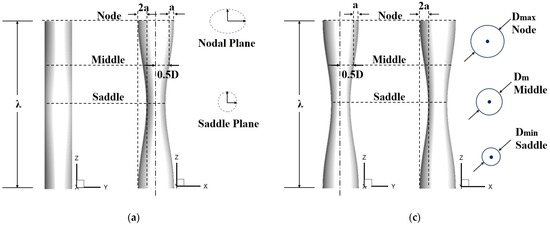
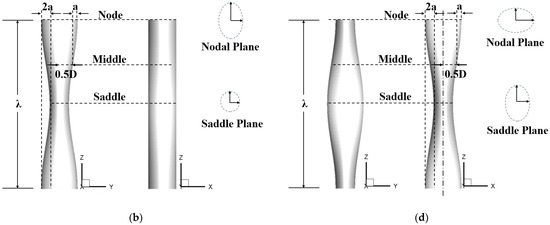
Figure 2.
Definition of geometries for cylinders with (a) SU, (b) TU, (c) IPU and (d) APU.
Unlike the IPU cylinder, the TU, SU and APU cylinders have local axis lengths in the streamwise and transverse directions. The geometry definitions of the TU, SU and APU cylinders are shown in Figure 2b–d, respectively. The local lengths in the streamwise direction () and transverse direction () of the TU, SU and APU cylinders are defined in Equations (2)–(4), respectively, as follows:
The TU cylinder has an undulation in the transverse direction along the center of the cylinder. This wavy shape is similar to the MI cylinder among the HSV-shaped cylinders presented in Yoon et al. [9,10]. The SU cylinder has an undulation in the streamwise direction along the center of the cylinder. This wavy shape is similar to the MA cylinder among the HSV-shaped cylinders presented in Yoon et al. [9,10]. The APU cylinder has undulations in both the streamwise and transverse directions like the IPU cylinder. However, it has an antiphase undulation in the streamwise and transverse directions. This wavy shape is similar to the BA cylinder among the HSV-shaped cylinders presented in Yoon et al. [9,10]. All undulation cases have the same mean diameter of , though these three cylinders have different lengths in the streamwise and transverse directions according to the spanwise direction.
2.2. Governing Equations and Numerical Methods
The Navier–Stokes, continuity and energy equations were considered to simulate the unsteady three-dimensional incompressible turbulent flow and thermal fields around the wavy cylinders. The filtered governing equations were used in the large eddy simulation (LES), and their expressions are as follows:
where is the corresponding velocity component; p is the pressure; Re is the Reynolds number; and is the subgrid-scale stress tensor (=, resulting in an effect of the subgrid scales on the resolved scales. T is the temperature, Pr is the Prandtl number, and is the subgrid flux (=). An overbar denotes a large-scale (or resolved) flow obtained from grid filtering.
The dynamic Smagorinsky subgrid-scale (SGS) model by Germano et al. [11] was used to represent the effects of unresolved small-scale fluid motions. Further details of the SGS model are available from Yoon et al. [12], Jung and Yoon [13], Yoon et al. [14], Bohgi et al. [15], Ouro et al. [16], Silva et al. [17], Hubbard et al. [18] and Shi et al. [19]. Jung and Yoon [13] successfully used this model to simulate the flow around a helical twisted elliptic cylinder at the same sub-critical Reynolds number of 3000. This study uses the same LES method as Yoon et al. [12].
All variables were non-dimensionalized according to the free-stream velocity , the cylinder surface temperature , and the mean diameter =, where and represent the maximum and minimum local diameters of the wavy cylinder. The non-dimensionalization results in two dimensionless parameters: and , where is the specific heat, and and k are the dynamic viscosity and thermal conductivity, respectively. The Prandtl number is Pr = 0.7, which corresponds to air, and the Reynolds number is Re = 3000.
For spatial discretization, a second-order central difference scheme based on the finite volume method (FVM) was applied to the structured grids under consideration. A second-order implicit scheme was employed for temporal discretization of the governing equations. The second-order Adams–Bashforth scheme and the Crank–Nicolson scheme were used for the convection and diffusion terms, respectively. We derived the governing equations using a generalized curvilinear coordinate system. Detailed information on the implementation can be found in the STAR CCM+ manuals [20].
2.3. Computational Domain and Boundary Conditions
Figure 3 presents the domain sizes and boundary conditions imposed in each direction. The outflow boundary is at a distance of 16 from the cylinder. The spanwise domain size varies according to the wavelength. We determined the spanwise domain size based on Yoon et al. [21], Lam and Lin [22] and Lin et al. [23] for smaller and larger wavelengths of λ/≤ 2.818 and λ/ ≥ 3.79, respectively. Lam and Lin [22] and Lin et al. [23] explained the determination of the spanwise domain size corresponding to the wavelength.
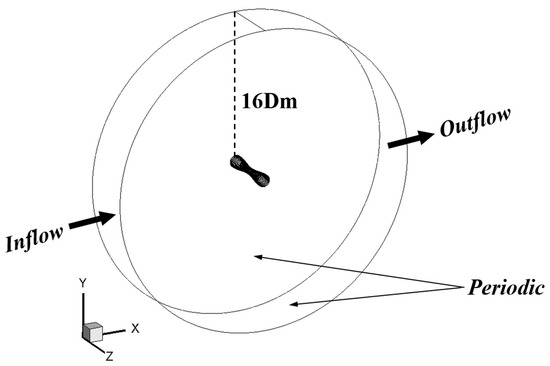
Figure 3.
Schematic of the computational domain and boundary conditions.
A fluid flow was uniformly imposed on the outflow [inflow] region along the x-axis at the inlet boundary, with a constant temperature of and a convective boundary condition. A no-slip condition was applied at the wall boundary with a constant surface temperature of , and a Neumann-type boundary condition was used for pressure. A periodic boundary condition was imposed in the spanwise direction.
2.4. Grid Dependence Test and Validation
To verify the presented numerical method and grid system, a validation test of our results and a grid dependence test were carried out. Comparisons of the time-averaged drag coefficient (), the root mean square (RMS) of lift fluctuation (), the Strouhal number (St) and the time- and total surface-averaged Nusselt number () with previous data were performed for the smooth cylinder, as shown in Table 1.

Table 1.
Validation of the present numerical methods.
The drag and lift coefficients and the Strouhal number are defined as follows:
where and are the total drag and lift forces, respectively; ρ is the fluid density; is the free-stream velocity; A is the projected area of the cylinder facing the flow direction; and is the frequency of vortex shedding. The Nusselt number is the ratio of convective heat transfer to conductive heat transfer:
where h is the convective heat transfer coefficient, and k is the thermal conductivity. Once the velocity and temperature fields are obtained, the local Nusselt number, the spanwise local surface-averaged Nusselt number, the total surface-averaged Nusselt number, the time-averaged local Nusselt number, the time- and spanwise local surface-averaged Nusselt number, and the time- and total surface-averaged Nusselt number are defined as follows:
where n is the normal direction to the walls, is the spanwise local surface area, L is the spanwise arc length, and is the period of time integration. The results agree well with those of previous research. The force coefficients and flow structures of the wavy cylinders at different wavelengths were also compared with previous results for validation. Three different grid systems were considered for the grid dependence test: coarse (5.5 million grids), medium (7.5 million grids) and fine (9.5 million grids). The values of the force coefficients and the Nusselt numbers for the three different grid systems show small variations that are not significant, so the medium grid system is used to discuss the results.
Figure 4 shows a typical grid system. The grid distribution is non-uniform in the x–y plane and uniform along the z direction. The distance between the cylinder surface and the nearest grid points is confined to 1, where is the friction velocity and is the wall shear stress. Grid stretching was used to increase the grid resolutions near the surface and in the wake region. There are 250 grids around the cylinder circumference, which corresponds to 61,752 cells in the x–y plane. The number of uniform grid layers along the z direction ranges from 65 to 121, depending on the wavelength of the sinusoidal cylinder.
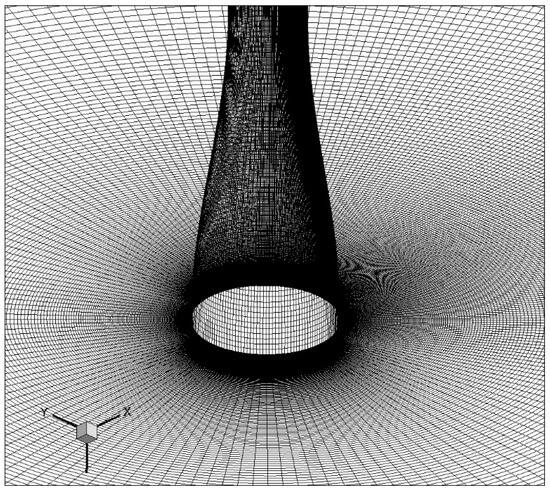
Figure 4.
The grid distribution of a wavy cylinder.
3. Results and Discussion
Figure 5a,b show the time histories of and f that correspond to Case 1 and Case 2, respectively. For both cases, a smooth cylinder was included to investigate (a) and for Case 1 and (b) and for Case 2 as an objective of the comparison basis. In addition, for a quantitative comparison of the force coefficients, the reduction rates of and of the undulated cylinders compared to those of a smooth cylinder are described in Figure 5c. The reduction rates of and are defined as and /, respectively, where = − , = − and the subscript of CY stands for a smooth cylinder.
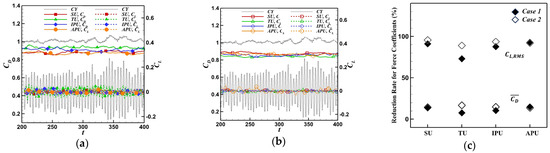
Figure 5.
Time histories of (a) and for Case 1 and (b) and for Case 2, and (c) reduction rates of the drag and lift coefficients for Case 1 and Case 2.
For in Case 1, the APU cylinder provides the smallest value among the different undulated cylinders, as shown in Figure 5a. The APU cylinder presents the largest reduction rate of at 14.8%, as shown in Figure 5c. Otherwise, the TU cylinder achieves the largest value of , resulting in the smallest reduction rate of 7.6% for . The values of for the SU and IPU cylinders are in between those of the APU and TU cylinders, as shown in Figure 5a. The SU cylinder shows the second lowest value of , leading to a 13.5% reduction rate of as shown in Figure 5c.
For in Case 1, the APU cylinder also provides the smallest value among the various types of undulated cylinders, as described in Figure 5a. Therefore, the APU cylinder presents the largest reduction rate of at 92.9%, as shown in Figure 5c. On the other hand, the TU cylinder also represents the largest value of , resulting in the smallest reduction rate of 72.9% for . The values of for the SU and IPU cylinders are in between those of the APU and TU cylinders, as shown in Figure 5a. The SU cylinder’s is ranked as the second lowest value, resulting in a 91% reduction rate of as shown in Figure 5c.
For in Case 2, the TU cylinder exhibits the smallest value among the different undulated cylinders, as illustrated in Figure 5b, leading to the largest reduction rate of at 16.8%, as shown in Figure 5c, whereas the APU cylinder shows the largest value of , resulting in the smallest reduction rate of 13.9% for . The values of for the SU and TU cylinders are in the middle of those of the TU and APU cylinders, as shown in Figure 5b. The IPU cylinder shows the second lowest value of , leading to a 14.9% reduction rate of as shown in Figure 5c.
For in Case 2, the SU cylinder provides the smallest value among the different undulated cylinders, as described in Figure 5b. Thus, the SU cylinder shows the largest reduction rate of at 95.6%, as shown in Figure 5c. By contrast, the TU cylinder presents the largest value of , resulting in the smallest reduction rate of 89.1% for . The values of for the IPU and APU cylinders are in the middle of those of the SU and TU cylinders, as shown in Figure 5b. The APU cylinder’s is ranked as the second lowest value, leading to a 92% reduction rate of , as shown in Figure 5c.
The TU and IPU cylinders are significantly influenced by the wavelength and wave amplitude, with the reduction rates of force coefficients being the smallest in Case 1 and the drag reduction being the largest in Case 2. On the other hand, the SU and APU cylinders in this study are not strongly affected by the considered combinations of wavelength and wave amplitude.
Figure 6 shows the 3D vortical structures as visualized through the utilization of the methodology proposed by Zhou et al. [31]. Apart from the types of undulation, a smooth cylinder is also included as (a) CY in Figure 6 for comparison. The vortical structures are identified by the negative of , which is the second largest eigenvalue of , where and are the strain-rate and rotation-rate tensors, respectively. To analyze the impact of flow structures on the thermal field, temperature contours were overlaid onto the vortical structures.
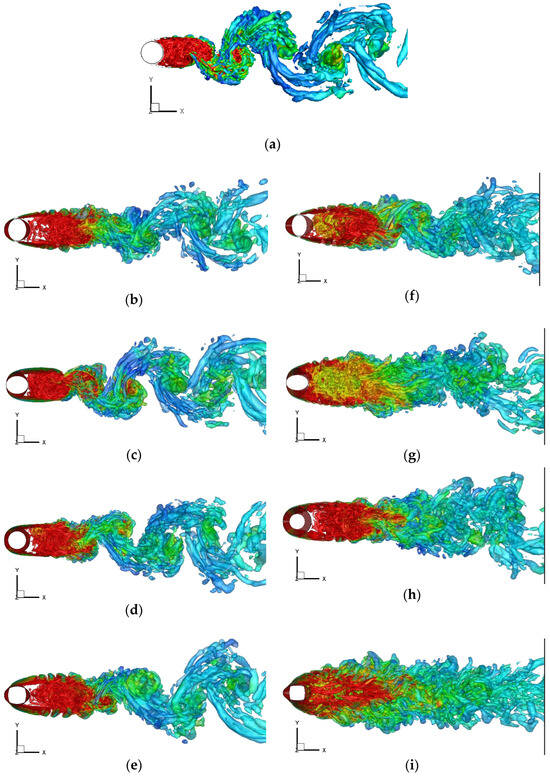
Figure 6.
Side views of temperature contours on the vortical structures for Case 1 (1st column) and Case 2 (2nd column): (a) CY, (b,f) SU, (c,g) TU, (d,h) IPU and (e,i) APU.
It is clearly depicted in Figure 6a–e that the CY, SU, TU, IPU and APU cylinders in Case 1 show a clear visualization of Kármán vortices in the wake region. On the other hand, the corresponding undulated cylinders in Case 2 cause a further delay in the vortex roll-up and a greater suppression of vortex shedding than those in Case 1, as shown in Figure 6a–e. Therefore, in general, the SU, TU, IPU cylinders in Case 2 contribute to a greater reduction in and fluctuations than those in Case 1.
More specifically, for Case 1, the vortical structure of the TU cylinder in Figure 6c shows that vortex shedding occurs relatively early in the near-wake region, which is strongly associated with and is supported by the highest values of and as shown in Figure 5a, corresponding to the lowest values for the reduction rates of and shown in Figure 5c.
The vortical structure of the APU cylinder in Figure 6e shows that the shear layer is further elongated and vortex shedding is more delayed, compared to the other undulated cylinders. These features of the wake structure are associated with the smallest values of force coefficients, which result in the largest reduction rates of and , as already observed in Figure 5a,c, respectively.
In addition, the TU cylinder has the smallest zero-vorticity area, but the APU cylinder presents the largest area of zero vorticity, as shown in Figure 6c,e, respectively, which also support the smallest and largest reduction rates of force coefficients of the TU and APU cylinders seen in Figure 5a,c.
For Case 2, the SU cylinder forms the earliest rolling-up and vortex shedding among the undulated cylinders, as shown in Figure 6f, which supports the largest value of seen in Figure 5b. The TU cylinder in Figure 6g shows a weaker shear-layer elongation among the undulated cylinders in Case 2, which supports the largest value of seen in Figure 5b.
The APU cylinder in Figure 6i presents the bluffiest near wake and an almost disappearance of vortex shedding, which support the lowest values of and seen in Figure 5b. From the perspective of vorticity near each cylinder, the SU cylinder presents a wide area of zero vorticity, as shown in Figure 6f, which supports the reduction rates of and seen in Figure 5b,c.
Figure 7 presents the Cp contours in the x-z plane for all the undulated cylinders. A wide and close Cp distribution along a cylinder represents high values of , for instance, (c) the TU cylinder in Case 1 and the (f) SU and (i) APU cylinders in Case 2 in Figure 7, which is confirmed by (a) the values for Case 1 and (b) the values for Case 2 seen in Figure 5. A narrow and far Cp distribution along a cylinder shows low values of , for example, (e) the APU cylinder in Case 1 and (g) the TU cylinder in Case 2 in Figure 7, which is also well matched with (a) the values for Case 1 and (b) the values for Case 2 seen in Figure 5.
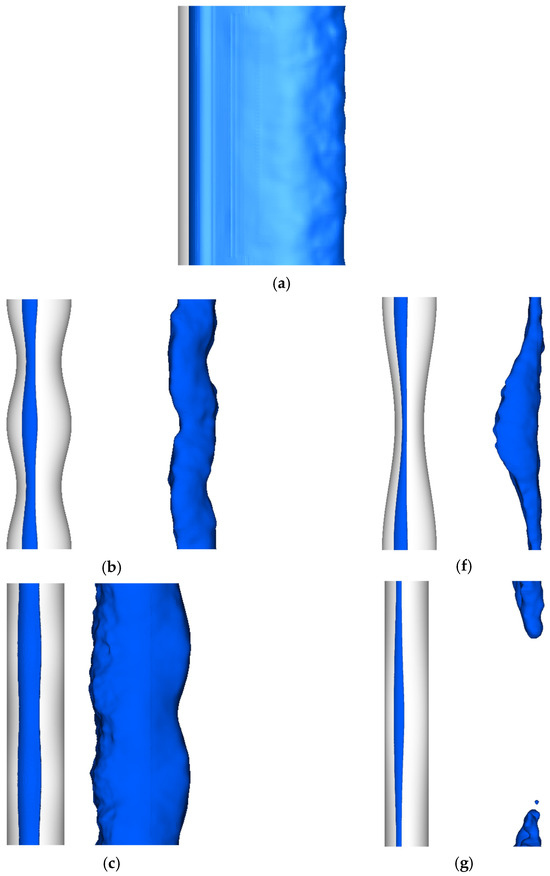
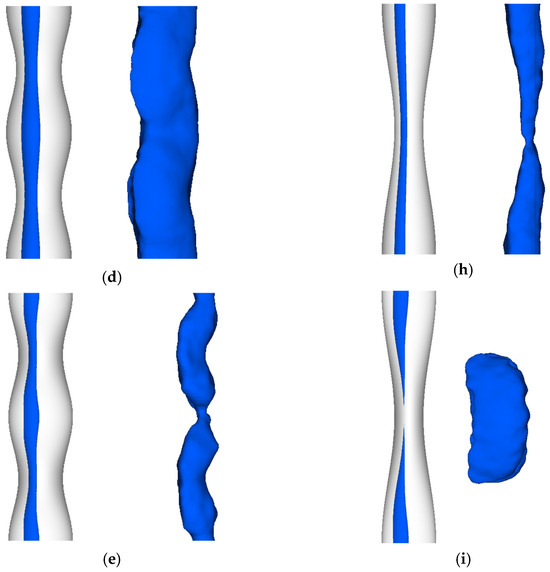
Figure 7.
Cp contours in the x-z plane: (a) CY, (b) SU, (c) TU, (d) IPU and (e) APU for Case 1, and (f) SU, (g) TU, (h) IPU and (i) APU for Case 2.
Figure 8 shows the time histories of the total surface-averaged Nusselt number for Case 1 and Case 2, respectively. It is evident in Figure 8a,b that for Case 1 and Case 2, the values of for the undulated cylinders are smaller than those for the smooth cylinder.
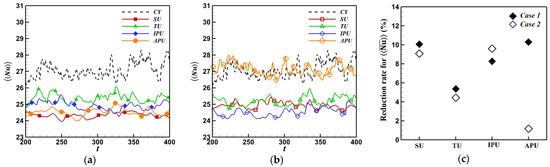
Figure 8.
Time histories of surface-averaged Nusselt number for (a) Case 1 and (b) Case 2, and (c) reduction rate of time- and surface-averaged Nusselt number.
Among the undulated cylinders in Case 1, the TU cylinder has the largest value and the IPU cylinder has the next highest value of . The SU and APU cylinders reveal almost the same values of that are in between those of the TU and IPU cylinders.
For Case 2 in Figure 8b, the APU cylinder presents a plot of with the highest values over the entire time. The s of the TU, SU and IPU cylinders are ranked next in order, but there is a big discrepancy between the APU cylinder and the other undulated cylinders.
The reduction rates of the time- and total surface-averaged Nusselt number () for the undulated cylinders in Case 1 and Case 2 are presented in Figure 8c. The reduction rate of is defined as , where = − , and the subscript of CY stands for a smooth cylinder. For Case 1, the APU and SU cylinders accomplish a considerable reduction in in comparison with the smooth cylinder, as described in Figure 8c, leading to approximately 10.3% and 10.1% attenuation in compared to the smooth cylinder, respectively. The IPU cylinder is ranked next, with an 8.3% reduction rate for . The TU cylinder shows the lowest value of 5.4% in the reduction rate among the cylinders in Case 1.
For Case 2, the TU cylinder still gives a low reduction rate of 4.4%. The s of the IPU and SU cylinders show the highest reduction rate of 9.6% and the second highest rate of 9.1%, respectively, which are comparable to the reductions rates for Case 1. Otherwise, the APU cylinder in Case 2 presents a considerably different to that in Case 1, resulting in the lowest reduction rate of 1.2 for . It is noted that the APU cylinder in Case 2 provides about the same compared to the smooth cylinder. Specifically, there is almost no attenuation in the heat transfer performance in comparison with the smooth cylinder.
In general, a disturbance of geometry in forced convection establishes a connection between the Nusselt number and force coefficients. This correlation prompts a reduction in and , which occurs concurrently with a decrease in . In recent studies, geometric disturbances, such as through the use of a helically twisted elliptic cylinder [5], a wavy cylinder [2], an asymmetric wavy cylinder [3], or a double-wavy cylinder [4], have been examined for their impact on forced convection. These studies have indicated that a stable near wake is distinguished by a prolonged vortex formation length, a low vorticity, and a regime of zero vorticity. Consequently, an altered wake pattern caused by geometric disturbances plays a role in diminishing the mixing in the near wake, ultimately leading to a reduction in heat transfer.
However, the APU cylinder under the condition of Case 2 gives an inconsistent pattern with regard to the force coefficients and Nusselt number. Regardless of whether it is Case 1 or Case 2, the APU cylinder presents a significant reduction in and . But the APU cylinder reveals almost no reduction in . It means that a proper modification of geometry can achieve a reduction in force coefficients by maintaining the heat transfer performance.
Figure 9a,b present the time- and spanwise local surface-averaged Nusselt number (along the spanwise direction for the undulated cylinders in Case 1 and Case 2, respectively. In addition, the ratios of the amplitude of to ) for the undulated cylinders are shown in Figure 9c, where the amplitude of is defined as . The for the smooth cylinder remains consistent along the spanwise direction due to the statistically homogeneous condition imposed by its two-dimensional geometry.
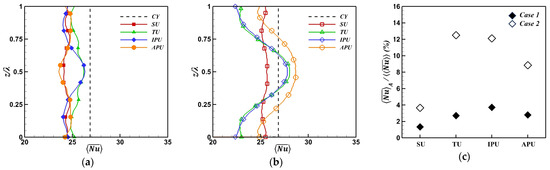
Figure 9.
The time- and spanwise local surface-averaged Nusselt number () for (a) Case 1 and (b) Case 2 along the spanwise direction for undulated cylinders, and (c) the amplitude ratio of the time- and spanwise local surface-averaged Nusselt number to the time- and total surface-averaged Nusselt number.
For Case 1, the values of along the spanwise direction are smaller than those of the smooth cylinder, as shown in Figure 9a, which supports that the values of for all undulated cylinders in Case 1 are smaller than those of the smooth cylinder, as already shown in Figure 8a,c. In addition, the undulated cylinders in Case 1 reveal a much weaker spanwise dependence of on the spanwise direction than those in Case 2. Thus, the values of for all undulated cylinders in Case 1 are smaller than those of the corresponding cylinders in Case 2, as shown in Figure 9c.
For Case 2, the undulated cylinders provide about the same spanwise variation in . Specifically, as the cross-sectional area’s spanwise location shifts from z/λ = 0 to 0.5, experiences an increase, reaching its peak near z/λ = 0.5. As the position of the cross-sectional area progresses from z/λ = 0.5 to 1, there is a subsequent decrease in .
In contrast to Case 1, the undulated cylinders with TU, IPU and APU in Case 2 give locally larger values of than the smooth cylinder, as shown in Figure 9b. Particularly, the APU cylinder forms a wider spanwise range that exhibits larger values of than the smooth cylinder, as shown in Figure 9b, and the ratio of the amplitude is also the smallest, as shown in Figure 9c. As a result, the APU cylinder in Case 2 has the smallest reduction rate of among the undulated cylinders considered in this study, as already observed in Figure 8c.
Figure 10 illustrates the distribution of the time-averaged local Nusselt number () across the surface from various perspectives for the different undulated cylinders in Case 1 and Case 2. In addition to the various undulation types, a smooth cylinder is also presented in Figure 10a as CY for the purpose of comparison. This visualization aligns with the spanwise variation in depicted in Figure 9a,b. For more information, it is noted that the distribution of the time-averaged local Nusselt number is denoted as 2λ in Figure 10, whereas the spanwise local Nusselt number is depicted as λ in Figure 9.
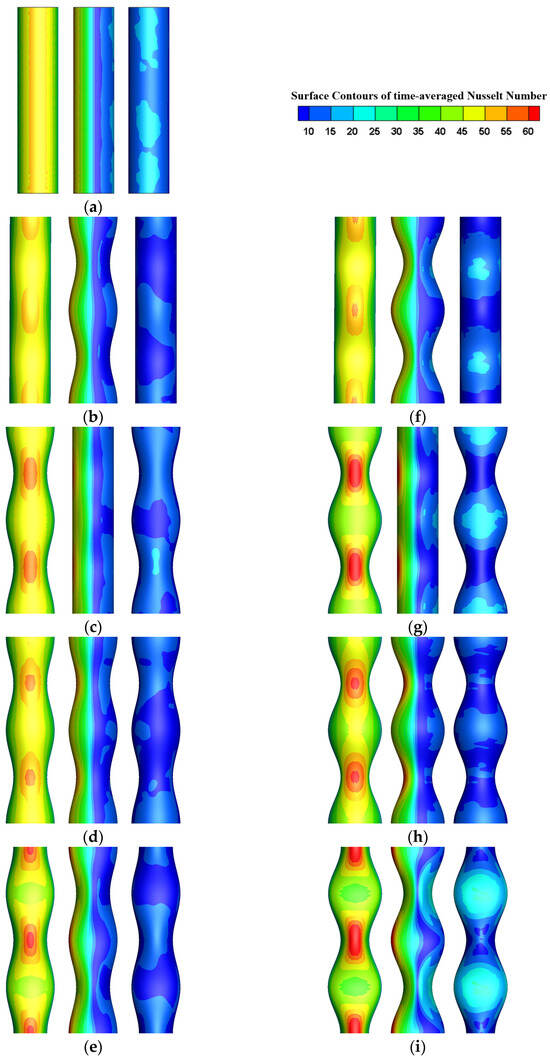
Figure 10.
Front (left column), top (middle column) and rear (right column) views of the surface contours of time-averaged Nusselt number: (a) CY, (b,f) SU, (c,g) TU, (d,h) IPU and (e,i) APU.
For Case 1, Figure 10a–e show the front, top and rear views of the 3D contours of for the CY, SU, TU, IPU and APU cylinders.
From the front view, the SU and APU cylinders form a local maximum of near the nodal position along the streamwise direction, as shown in Figure 10b,e, respectively. In contrast, the TU and IPU cylinders form a local maximum of near the saddle along the transverse direction, as shown in Figure 9c,d for Case 1, respectively. Particularly, the front view of the SU cylinder exposes a diminished three-dimensional reliance of on both the spanwise and transverse directions in comparison to other undulated cylinders, which contributes to the weakest variation in seen in Figure 9a,c.
From the top view, the SU cylinder shows that the sinusoidal profiles exhibit maximum and minimum deflection points at the nodes and saddles, respectively, as shown in the upstream side in the left half of the top view. Alternatively, for the downstream side, the local maximum and minimum of emerge near the nodes and saddles, respectively, as shown in Figure 10b. The TU cylinder shows a nearly 2D distribution of except for the region near the rear stagnation point, as shown in the middle column of Figure 10c.
The top view of the upstream side for the IPU cylinder depicts that the surface distribution of showcases a 3D wavy formation, as illustrated in Figure 10d. As the spanwise location of the cross-sectional area shifts from z/Dm = 0 to 0.5, the Nu of the IPU cylinder is larger and forms a denser distribution, which clearly explains the larger value of near the saddle around z/Dm = 0.5, as depicted in Figure 9a. The APU cylinder forms a more apparent wavy pattern of compared to the IPU cylinder, not only in the upstream side but also in the downstream side, as illustrated in Figure 10e.
For Case 2 in Figure 10f–i, the configurations of contours for the undulated cylinders are very similar with those for the corresponding undulated cylinders in Case 1. However, the distributions of in Case 2 are more 3D-dependent than those in Case 1, regardless of the undulation type. In addition, the ranges of in Case 2 are wider than those of in Case 1. In particular, the distributions of on the top and rear surfaces are more locally dependent, leading to the clear identification of the local maximum and minimum positions, as shown in Figure 10f–i. Therefore, these strong 3D distributions of in Case 2 cause a larger spanwise variation in as seen in Figure 9b,c.
To identify the downstream and rear distributions of observed in Figure 10, the mean isotherms in the x-z plane at y = 0.0 and in the x-y plane at the nodes and saddles for the four different undulated cylinders are presented in Figure 11. In addition to the various undulated cylinders, a smooth cylinder is also featured as (a) CY in Figure 9 to serve as a basis for comparison. In general, the undulated cylinders in Case 1, as shown in Figure 11b–e, form a weaker spanwise-dependent thermal boundary layer than those in Case 2, as shown in Figure 11f–i.
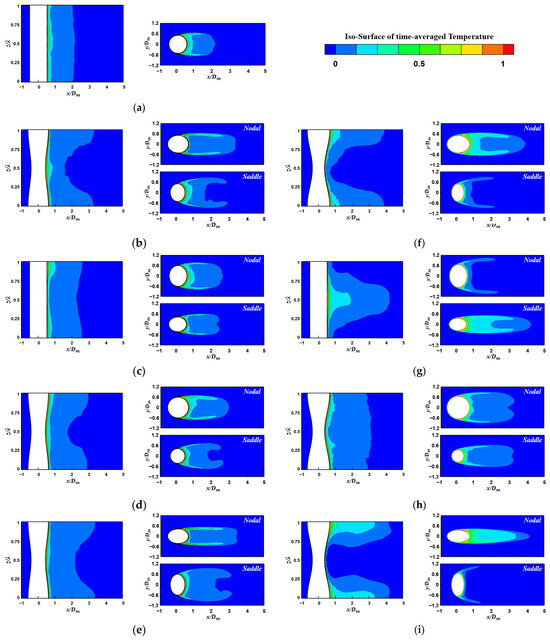
Figure 11.
Time-averaged isotherms in the x-z plane at y = 0.0 (left column) and in the x-y plane at the nodal plane (right column, upper) and saddle plane (right column, lower): (a) CY, (b) SU, (c) TU, (d) IPU and (e) APU for Case 1, and (f) SU, (g) TU, (h) IPU and (i) APU for Case 2.
In Case 1, the SU, IPU and APU cylinders form denser and coarser isotherms near the nodes and saddles, respectively, as shown in Figure 11b,d,e, respectively. Therefore, thinner and thicker thermal boundaries appear near the nodes and saddles on the rear surface in the x-z plan. These local distributions of the isotherms in the x-z plane are consistent with the isothermal distributions in the x-y plane. The isotherms near the rear surface in the nodal plane for these undulated cylinders are much denser than those in the saddle plane, as shown in Figure 11b,d,e, which explains the alternate appearance of locally large and small values of near the nodes and saddles, as already depicted in Figure 10b,d,e.
By contrast, the TU cylinder in Case 1 forms an opposite pattern of isothermal distribution when compared to the SU, IPU and APU cylinders. Specifically, the TU cylinder forms coarser and denser isotherms near the nodes and saddles, respectively, as shown in Figure 11c, which explains the alternate appearance of locally small and large values of near the nodes and saddles, as already shown in Figure 10c.
In Case 2, the undulated cylinders form isotherm patterns opposite to those of the corresponding undulated cylinders in Case 1. Thus, the SU, IPU and APU cylinders form denser and coarser isotherms near the saddles and nodes in the x-z and x-y planes, as shown in Figure 11f,h,i, respectively. Successively, the TU cylinder forms denser and coarser isotherms near the nodes and saddles, respectively, as shown in Figure 11g.
Particularly, the APU cylinder in Case 2 causes a much wider region with a very thin isothermal boundary layer compared to the other undulated cylinders, which results in a wider region containing locally large values of on the real surface, as shown in Figure 10i. As a result, the values of the APU cylinder become much larger through the wide region surrounding the saddle than those of the smooth cylinder, as already depicted in Figure 9b showing the spanwise variation in the local surface-averaged Nusselt number.
These strong 3D isothermal distributions for the APU cylinder in Case 2 can be associated with the wake flow structures. Thus, the distributions of the spanwise vorticity in the x-y plane at the nodes and the saddles are presented in Figure 12. The spanwise vorticities in the nodal plane are constrained to a very narrow width, as shown in Figure 12a. The upper and lower shear layers are very close to each other and are further elongated downstream. The corresponding streamlines within the upper and lower shear layers reveal almost no reverse flow in the nodal plane, as shown in Figure 12b. Therefore, the isotherms near the nodes are very coarse due to the weak mixing effect, as already observed in Figure 11i.
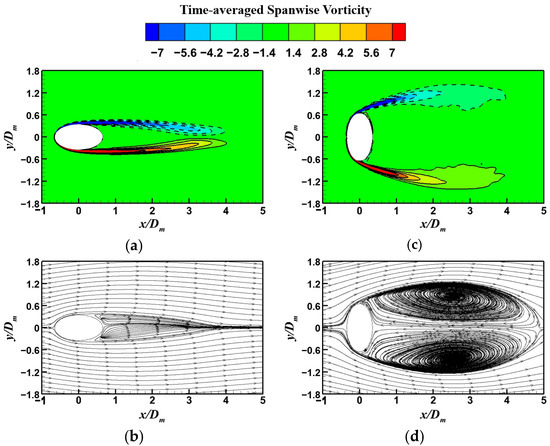
Figure 12.
Time-averaged spanwise vorticity and streamlines for the APU cylinder in Case 2 in the x-y plane: (a,b) at the nodes and (c,d) at the saddles.
Otherwise, a large spanwise vortex pair occurs in the saddle plane, as shown in Figure 12c,d. Thus, short and wide spanwise vorticities are formed in the wake. These strong revere flows contribute to the mixing effect, which causes the very dense isothermal distribution and corresponding thin thermal boundary layer near the saddle that are previously seen Figure 11i. As a result, the APU cylinder presents larger values near the saddle than the smooth cylinder, as already shown in Figure 9b. Consequently, the APU cylinder in Case 2 provides about the same values as those of the smooth cylinder, as depicted in Figure 8 showing the time- and total surface-averaged Nusselt number.
4. Conclusions
The present study focused on an assessment of the influence of undulation on the heat transfer characteristics around wavy cylinders at a Reynolds number of 3000 by using LES. The presented numerical methods were well validated by comparing previous results and a grid dependence test was successively conducted. Four types of wavy cylinders with SU, TU, IPU and APU were taken into account to confirm the heat transfer characteristics, together with two different cases of wavelength and amplitude combinations. In addition, for the purpose of comparison, a smooth cylinder was considered.
From the different aspects of wavelength and amplitude, for the TU and IPU cylinders, there is an obvious discrepancy between Cases 1 and 2 in the values of and . For the SU and APU cylinders, however, there is little discrepancy between Case 1 and Case 2. Therefore, it is concluded that the TU and IPU cylinders are significantly influenced by wavelength and wave amplitude, with the reduction rate of force coefficients being the smallest in Case 1 and the drag reduction being the largest in Case 2. On the other hand, the SU and APU cylinders in this study are not strongly affected by the considered combinations of wavelength and wave amplitude.
For the Nusselt number, it is observed that the largest and smallest reduction rates occur for the APU and TU cylinders in Case 1, respectively. But, in Case 2, the IPU and APU cylinders provide the largest and smallest reduction rates. The spanwise local surface-averaged Nusselt numbers for the undulated cylinders in Case 1 are smaller than those of the smooth cylinder along the spanwise direction. However, the undulated cylinders with TU, IPU and APU in Case 2 present locally larger values of than the smooth cylinder. In general, Case 2 causes a stronger spanwise dependence of than Case 1. These characteristics, according to the combination of the parameters of the wavy geometry, are supported by the surface distribution of the Nusselt numbers. In addition, the isothermal distribution, which depends on the wake flow, explains the variation in the Nusselt numbers.
It is noted that the APU cylinder in Case 2 provides about the same values as those of the smooth cylinder. Specifically, there is almost no attenuation in the heat transfer performance in comparison with the smooth cylinder. However, the APU cylinder under the condition of Case 2 gives an inconsistent pattern of force coefficients and Nusselt number. Regardless of whether it is Case 1 or Case 2, the APU cylinder presents a significant reduction in and . But the APU cylinder reveals almost no reduction in . It means that a proper modification of geometry can achieve a reduction in force coefficients by maintaining the heat transfer performance.
Based on the forementioned geometrical characteristics of undulated cylinders and the correlation of heat transfer performance of each wavy cylinder, it is feasible to predict the structure of heat transfer from the modification of wavy cylinder geometry. It is recognized that how we modify the geometry of a wavy cylinder to obtain what we desire affects the structure characteristics of heat transfer accordingly. Furthermore, it enables us to predict the expected thermal performance of heat transfer structure through the generalization of the geometry of wavy cylinders without any time-consuming and costly simulation.
It is expected that an extended investigation based on this study is to be carried out in the near future in order to clarify the relationship between undulated cylinders that results from the superposition and combination of these undulated cylinders from the flow structure and heat transfer point of view. Specifically, a wide range of wavelength and wave amplitude will be considered to find the more general dependence of heat transfer characteristics on wavy geometric parameters.
Author Contributions
Conceptualization, C.-H.C.; writing—original draft preparation, M.-K.K.; writing—review and editing, H.-S.Y.; supervision, H.-S.Y.; software, H.-S.Y.; validation, S.-H.N. All authors have read and agreed to the published version of the manuscript.
Funding
This work was supported by the National Research Foundation of Korea (NRF) funded by the Korea government (MSIT) through grant no. NRF-2019R1A2C1009081.
Institutional Review Board Statement
Not applicable.
Informed Consent Statement
Not applicable.
Data Availability Statement
The data presented in this study are available on request from the corresponding author.
Conflicts of Interest
The authors declare no conflicts of interest.
Nomenclature
| Reynolds number | |
| λ | Wavelength |
| Dm | Mean diameter of a cylinder |
| Pr | Prandtl number |
| a | Wave amplitude |
| Dz | Local diameter |
| Maximum local diameter | |
| Minimum local diameter | |
| Local length in the streamwise direction | |
| Local length in the transverse direction | |
| Time | |
| Cartesian coordinates | |
| , | Velocity components |
| Pressure | |
| Temperature | |
| Subgrid-scale stress tensor | |
| Subgrid flux | |
| Cylinder surface temperature | |
| Temperature | |
| Specific heat capacity | |
| Thermal conductivity | |
| Drag coefficient | |
| Lift coefficient | |
| St | Strouhal number |
| Total drag force | |
| Total lift force | |
| Free-stream velocity | |
| A | Projected area of a cylinder |
| Frequency of vortex shedding | |
| Nu | Nusselt number |
| Spanwise local surface-averaged Nusselt number | |
| Total surface-averaged Nusselt number | |
| Time-averaged local Nusselt number | |
| Time- and spanwise local surface-averaged Nusselt number | |
| Time- and total surface-averaged Nusselt number | |
| n | Normal direction to the walls |
| Spanwise local surface area | |
| L | Spanwise arc length |
| Period of time integration | |
| Wall scale | |
| Friction velocity | |
| Wall shear stress | |
| Second largest eigenvalue | |
| Strain-rate tensor | |
| Rotation-rate tensor | |
| Greek symbols | |
| Density | |
| Dynamic viscosity | |
| Kinematic viscosity | |
| Superscripts | |
| Time-averaged quantity | |
| Grid filtering | |
| Abbreviations | |
| ASW | Asymmetric wavy |
| CY | Smooth |
| SW | Symmetric wavy |
| DW | Double wavy |
| HTE | Helically twisted elliptic |
| VPHTE | Variable-pitch helically twisted elliptic |
| HSV | Harbor seal vibrissa |
| RMS | Root mean square |
| SU | Streamwise undulation |
| TU | Transverse undulation |
| IPU | In-phase undulation |
| APU | Antiphase undulation |
| SGS | Smagorinsky subgrid scale |
| FVM | Finite volume method |
References
- Ahn, C.T.; Yoon, H.S.; Ha, M.Y.; Lee, H.G. Waviness effect of a wavy circular cylinder on the heat transfer at a Reynolds number of 300. Int. J. Heat Mass Transf. 2009, 52, 345–354. [Google Scholar] [CrossRef]
- Kim, M.I.; Yoon, H.S. Large eddy simulation of forced convection heat transfer from wavy cylinders with different wavelengths. Int. J. Heat Mass Transf. 2018, 127, 683–700. [Google Scholar] [CrossRef]
- Moon, J.; Yoon, H.S.; Kim, H.J.; Kim, M.I. Forced convection heat transfer from an asymmetric wavy cylinder at a subcritical Reynolds number. Int. J. Heat Mass Transf. 2019, 129, 707–720. [Google Scholar] [CrossRef]
- Yoon, H.S.; Moon, J.; Kim, M.I. Effect of a double wavy geometric disturbance on forced convection heat transfer at a subcritical Reynolds number. Int. J. Heat Mass Transf. 2019, 141, 861–875. [Google Scholar] [CrossRef]
- Yoon, H.S.; Kim, H.J.; Wei, D.J. Forced convection heat transfer from the helically twisted elliptic cylinder inspired by a daffodil stem. Int. J. Heat Mass Transf. 2018, 119, 105–116. [Google Scholar] [CrossRef]
- Yoon, H.S.; Moon, J. Effect of variable pitch on forced convection heat transfer around a helically twisted elliptic cylinder. Int. J. Heat Mass Transf. 2021, 173, 121205. [Google Scholar] [CrossRef]
- Kim, H.J.; Yoon, H.S. Forced convection heat transfer from the biomimetic cylinder inspired by a harbor seal vibrissa. Int. J. Heat Mass Transf. 2018, 117, 548–558. [Google Scholar] [CrossRef]
- Kim, H.J.; Yoon, H.S. Reynolds number effect on the fluid flow and heat transfer around a harbor seal vibrissa shaped cylinder. Int. J. Heat Mass Transf. 2018, 126, 618–638. [Google Scholar] [CrossRef]
- Yoon, H.S.; Nam, S.H.; Kim, M.I. Effect of the geometric features of the harbor seal vibrissa based biomimetic cylinder on the forced convection heat transfer. Int. J. Heat Mass Transf. 2020, 159, 120086. [Google Scholar] [CrossRef]
- Yoon, H.S.; Nam, S.H.; Kim, M.I. Laminar forced convection heat transfer around wavy elliptic cylinders with different aspect ratios. Int. J. Heat Mass Transf. 2022, 194, 123038. [Google Scholar] [CrossRef]
- Germano, M.; Piomelli, U.; Moin, P.; Cabot, W.H. A dynamic subgrid-scale eddy viscosity model. Phys. Fluids 1991, 3, 1760–1765. [Google Scholar] [CrossRef]
- Yoon, H.S.; Balachandar, S.; Ha, M.Y. Large eddy simulation of flow in an unbaffled stirred tank for different Reynolds numbers. Phys. Fluids 2009, 21, 8. [Google Scholar] [CrossRef]
- Jung, J.H.; Yoon, H.S. Large eddy simulation of flow over a twisted cylinder at a subcritical Reynolds number. J. Fluid Mech. 2014, 759, 579–611. [Google Scholar] [CrossRef]
- Yoon, H.S.; Balachandar, S.; Ha, M.Y. Large eddy simulation of passive scalar transport in a stirred tank for different diffusivities. Int. J. Heat Mass Transf. 2015, 91, 885–897. [Google Scholar] [CrossRef]
- Boghi, A.; Di Venuta, I.; Gori, F. Passive scalar diffusion in the near field region of turbulent rectangular submerged free jets. Int. J. Heat Mass Transf. 2017, 112, 1017–1031. [Google Scholar] [CrossRef]
- Ouro, P.; Fraga, B.; Viti, N.; Angeloudis, A.; Stoesser, T.; Gualtieri, C. Instantaneous transport of a passive scalar in a turbulent separated flow. Environ. Fluid Mech. 2018, 18, 487–513. [Google Scholar] [CrossRef] [PubMed]
- Silva, M.I.; De Bortoli, A.L. Improving the mixing of a turbulent jet diffusion flame of methane via linear quadratic regulator control. Phys. Fluids 2021, 33, 11. [Google Scholar] [CrossRef]
- Hubbard, J.A.; Cheng, M.-D.; Domino, S.P. Mixing in Low Reynolds Number Reacting Impinging Jets in Crossflow. J Fluids Eng. 2023, 145, 051303. [Google Scholar] [CrossRef]
- Shi, J.; Zhu, D.; Cai, Z.; Cao, X. Non-hydrostatic simulation of two-layer density stratified flows over a sill. Ocean Eng. 2024, 291, 116432. [Google Scholar] [CrossRef]
- Siemens Digital Industries Software, Simcenter STAR-CCM+, version 16.04; Siemens: Munich, Germany, 2021.
- Yoon, H.S.; Nam, S.H.; Kim, M.I. Effect of the geometric features of the harbor seal vibrissa based biomimetic cylinder on the flow over a cylinder. Ocean Eng. 2020, 218, 108150. [Google Scholar] [CrossRef]
- Lam, K.; Lin, Y.F. Large eddy simulation of flow around wavy cylinders at a subcritical Reynolds number. Int. J. Heat Fluid Flow 2008, 29, 1071–1088. [Google Scholar] [CrossRef]
- Lin, Y.F.; Bai, H.L.; Alam, M.M.; Zhang, W.G.; Lam, K. Effects of large spanwise wavelength on the wake of a sinusoidal wavy cylinder. J. Fluids Struct. 2016, 61, 392–409. [Google Scholar] [CrossRef]
- Norberg, C. Effects of Reynolds Number and a Low-Intensity Freestream Turbulence on the Flow Around a Circular Cylinder; Chalmers University Technological Publications: Göteborg, Sweden, 1987; Volume 87, pp. 1–55. [Google Scholar]
- Norberg, C. Fluctuating lift on a circular cylinder: Review and new measurements. J. Fluids Struct. 2003, 17, 57–96. [Google Scholar] [CrossRef]
- Lu, X.; Dalton, C.; Zhang, J. Application of large eddy simulation to flow past a circular cylinder. J. Offshore Mech. Arctic Eng. 1997, 119, 219–225. [Google Scholar] [CrossRef]
- Yoon, H.S.; Shin, H.; Kim, H. Asymmetric disturbance effect on the flow over a wavy cylinder at a subcritical Reynolds number. Phys. Fluids. 2017, 29, 9. [Google Scholar] [CrossRef]
- Zukauskas, A. Advances in Heat Transfer; Academic Press: New York, NY, USA, 1972; pp. 93–160. [Google Scholar]
- Sanitjai, S.; Goldstein, R.J. Forced convection heat transfer from a circular cylinder in crossflow to air and liquids. Int. J. Heat Mass Transf. 2004, 47, 4795–4805. [Google Scholar] [CrossRef]
- Hilpert, R. Warmeabgabe von geheizen Drahten und Rohren. Forsch. Geb. Ingenieurwes. 1933, 4, 220. [Google Scholar]
- Zhou, J.; Adrian, R.J.; Balachandar, S.; Kendall, T. Mechanisms for generating coherent packets of hairpin vortices in channel flow. J. Fluid Mech. 1999, 387, 353–396. [Google Scholar] [CrossRef]
Disclaimer/Publisher’s Note: The statements, opinions and data contained in all publications are solely those of the individual author(s) and contributor(s) and not of MDPI and/or the editor(s). MDPI and/or the editor(s) disclaim responsibility for any injury to people or property resulting from any ideas, methods, instructions or products referred to in the content. |
© 2024 by the authors. Licensee MDPI, Basel, Switzerland. This article is an open access article distributed under the terms and conditions of the Creative Commons Attribution (CC BY) license (https://creativecommons.org/licenses/by/4.0/).