1. Introduction
Mines’ demand for electric drives is increasing year by year. As an essential power source, the safe and efficient operation of a mine power battery pack is necessary. The mine power battery pack mainly comprises lithium iron phosphate batteries [
1] (referred to as lithium batteries from now on), which have a stable chemical composition, are safer to use in high temperatures and other environments, and reduce potential safety hazards. Lithium batteries are not resistant to deep discharge or overcharging; if left in this state for a long time, they will suffer irreparable damage. Therefore, the battery management system (BMS) is needed to regulate the lithium battery to improve its operational safety and prolong its service life [
2,
3]. The BMS monitors the battery’s state of charge (SOC) to ensure it is not overcharged or over-discharged during operation.
The SOC of a lithium-ion battery cannot be measured directly but can be predicted by analyzing the characteristic factors during its operation, including voltage, current, and temperature. At the same time, lithium-ion batteries are highly nonlinear and time-varying systems, and it is difficult to fit a model that can accurately estimate the charge and discharge state of the battery using traditional methods. The application of artificial intelligence theory based on machine learning to solve the problems of nonlinear systems has a good performance. Because machine learning is highly nonlinear, fault-tolerant, and self-learning, it can be trained with known samples to obtain the internal law of nonlinear systems. Therefore, the method can solve the battery state of charge prediction problem without considering the internal details of the battery [
4].
The machine learning (ML) method establishes the mapping relationship between battery state information and SOC, which avoids establishing a complex battery model. It consists of three parts: the input, model, and output. The input and output can train the ML model without physical constraints by optimizing the algorithm and training data. Machine learning methods, such as support vector machines (SVM) [
5], neural networks (NNs) [
6], and Gaussian process regression (GPR) [
7], are often used in SOC prediction. A joint SOC and SOH estimation framework has been proposed in the literature [
8], utilizing both data-driven and model-based approaches. For the first part, the proposed method applies a least squares support vector machine (LS-SVM) to identify the dynamics of the cell and then creates a state-space model in which an odorless particle filter (UPF) is used to estimate the SOC of the cell. The 2.2 Ah NMC 18650 cell was tested on the NEWARE BTS3000N battery cycle machine, and the results show that the maximum SOC estimation error is less than 2%, and the RMSE of SOH estimation is less than 4%. Gaussian process regression (GPR) models were proposed in the literature [
9]. First, the input dataset related to SOC is combined with the feature extraction strategy. Data preprocessing, correlation analysis, and principal component analysis were used. The exponential square kernel function optimizes the feature weights via the automatic association determination method. Finally, the autoregressive GPR model is constructed to improve the estimation accuracy and confidence further. The battery pack, consisting of 177 Ah NMC cells, was tested on a Digatron EVT 300–600 battery tester and had an estimated error of less than 3.9%. The above work is based on the single model to obtain the SOC value, but the performance of the single model is limited and can only be met in some cases.
The ensemble learning model is a kind of model used in machine learning. The ensemble learning model combines multiple individual models to optimize its prediction results, which can further improve the accuracy of SOC prediction. Ensemble learning methods have superior nonlinear fitting ability and can reduce computational complexity via parallel computing. In the literature [
10], the differential search optimization RF (DSA-RF) algorithm is used to predict the SOC of electric vehicle batteries, and two different types of lithium-ion battery data, LiNCA and LiNMC, are used. The robustness of the algorithm is further verified under various temperature conditions. The RMSE and MAE were lower than 1% and 0.5% in the DST and FUDS cycles at different temperatures. In the HPPC test, the proposed algorithm achieves high SOC accuracy in LiNCA and LiNMC batteries, with RMSE of 0.508% and 0.382%, respectively. The literature [
11] uses support vector regression (SVR) and XGBoost to predict SOC, and both models are validated on the University of Maryland Cycle battery dataset. By comparison, it is found that XGBoost is faster and more accurate. This paper uses a new classification and promotion algorithm (Catboost) [
12] to predict the SOC of mine power batteries. The model optimized via the particle swarm optimization algorithm has achieved good prediction results.
2. SOC Prediction Model
Catboost (Categorical Boosting) is an improved GBDT (Gradient Boosting Decision Trees) algorithm [
13]. It is an ensemble learning algorithm based on a symmetric decision tree, which can deal with data with different characteristics and is enormously robust. Catboost can effectively deal with the problems of gradient deviation and prediction offset, reduce overfitting occurrence, and have good accuracy and versatility.
2.1. GBDT Algorithm
The GBDT algorithm is a framework algorithm for ensemble learning. Its basic idea is to use the primary weak learner to obtain the strong learner through current reinforcement and iteration. The GBDT algorithm is an ensemble learning algorithm based on a boosting algorithm composed of a gradient lifting algorithm and a decision tree algorithm. The model is additive, and the basis function is a decision tree (CART). The iterative process of the algorithm is to obtain the gradient of the current model based on the same dataset and to obtain the weak learner based on the gradient training.
Given a training dataset
,
is a sample and
is the label of sample
. Let
be the prediction model, and GBDT aims to learn an optimal model
. Formally, at each iteration t of the gradient GBDT algorithm, the model
is updated in the following manner:
In the formula,
is the model built in the previous iteration,
is a weak learner selected from the function
, and
ϵ is the learning rate. Select the weak learner
. The output fits the loss function according to the orientation of the negative gradient of the current model as follows:
In the formula, represents the newly generated weak learner, is the negative gradient of the loss function, and is the loss function where n indicates the number of iterations, and n = 1, 2, …, N.
2.2. Catboost Algorithm
The significant advantage of the Catboost algorithm is that the classification data can be processed during the model training process rather than during the data preprocessing process. Hypothetical dataset
, of which
, is a vector containing both numeric and categorical features; m is the number of features; and
is the corresponding label. First, the data are randomly arranged. Then, for each sample, the average of the labels of the samples with the same class value in the permutation is calculated. The set
represents a permutation. Then, observations of the permutation
are replaced with
. The calculation formula is as follows:
where
if
, and otherwise, 0.
is the prior value and α is the corresponding weight value. The initial is the average label value of the regression and the prior probability that the label used for classification encounters a positive label. Adding the prior helps reduce the noise of the secondary class. On the one hand, the method uses all the data for training; conversely, it avoids the overfitting problem by performing random permutations.
Like the traditional standard GBDT algorithm, Catboost constructs a new tree structure to approximate the gradient of the current model. However, almost all enhancement algorithms have the problem of overfitting due to the estimation of the offset gradient. In some GBDT-derived algorithms, there are two ways to construct a new tree: one is to select the tree structure after the tree structure is fixed, and the other is to set the values in the leaves. Catboost, to overcome the partial gradient problem in the traditional enhancement algorithm, proposes a new mode of leaf value calculation when the tree structure is selected. Specifically, suppose that
represents a built model and
represents the gradient value of the kth training sample after constructing
i trees. To keep the gradient unbiased, for each sample
, a separate model is mis-trained, which does not need to be updated with the gradient estimate, and each
has the same structure. Use
to estimate the gradient on
, then score the resulting tree based on the estimation. The model update process is shown in the following Algorithm 1:
| Algorithm 1: Updating the models and calculating model values for gradient estimation
|
![Energies 17 05920 i001]() |
In addition, Catboost uses the forgetting tree as the primary learner of prediction. Each tree uses the same segmentation criteria in this tree structure, which makes the overall structure of the algorithm balanced and not prone to overfitting. This symmetry has a regularization effect on the constraints of the tree structure. More importantly, it allows the Catboost model to have a speedy inference process. In tree prediction, each feature segmentation is independent of the priority order, and multiple samples can be predicted together. To summarize, Catboost has unique advantages for the model learning of multi-type feature datasets.
2.3. Particle Swarm Optimization
The machine learning models usually have default parameters, typically set by the author after some consideration when the model is proposed, to perform well on general problems and datasets. However, these default parameters may not be optimal for a particular situation, dataset, or application scenario. In this paper, the factors that need to be considered in predicting SOC for specific data are complex, and the default parameters may not be the most suitable. Therefore, model tuning is one of the critical steps to optimize the performance of machine learning models.
To improve the performance of the Catboost model, this paper uses particle swarm optimization (PSO) to enhance its performance [
14]. Particle swarm optimization algorithm has the characteristics of self-organization, evolution, and strong global search ability. Particle swarm can iterate to find the optimal initial parameters of the Catboost model. The particle swarm optimization algorithm is to find the optimal solution through cooperation and information sharing between individuals in the group, and its implementation process is roughly similar to the process of birds foraging. Assuming that each possible solution is a particle, the optimal solution is obtained by adjusting the position and velocity of the particle according to the mutual information and the fitness value in the D-dimensional space.
Assume that there are n particles in the population, which is expressed as
; each particle is iteratively searched in the solution space according to the set rules, and two extreme values are generated at the end of each particle;
is the optimal solution searched by the particle itself;
is the current optimal solution of the whole population. Adapt the current position according to these two extreme values. The velocity of the
ith particle is assumed to be
. The position is expressed as
, and the updated equation is
where
is the number of population iterations,
d is the dimension of population space,
ω is the inertia weight,
is a random number distributed over (0, 1), and
and
are learning factors.
is a cognitive learning factor, representing a coefficient for adjusting to the optimal position, and
is a social learning factor, representing a coefficient for the entire population to move to the optimal position.
When the PSO optimization algorithm is used to optimize the Catboost model, the position of each particle in the PSO algorithm represents the optimization parameters required by the Catboost model. Appropriate initial parameters accelerate the Catboost model to obtain the prediction results.
2.4. PSO-Catboost Model
For machine learning algorithms, hyperparameter tuning is crucial to the model’s performance, which directly controls the behavior of the training algorithm. Some simple methods for hyperparameter tuning include random search (RS), grid search (GS), and so on. However, these methods have shortcomings, such as a complex search space, more time required for each iteration, and high variance. The PSO algorithm is a population-based meta-heuristic optimization technology that is simple to implement and can quickly search for the optimal solution close to the actual value in a multi-dimensional space. In this study, the PSO method is used to optimize the hyperparameters of the Catboost algorithm. The PSO model parameter setting is conducted as follows: in the method proposed in this paper, the learning factor , , the number of iterations , the population size pop = 20, and the inertia weight , . Randomly initialize a group of particles; the parameters are shown.
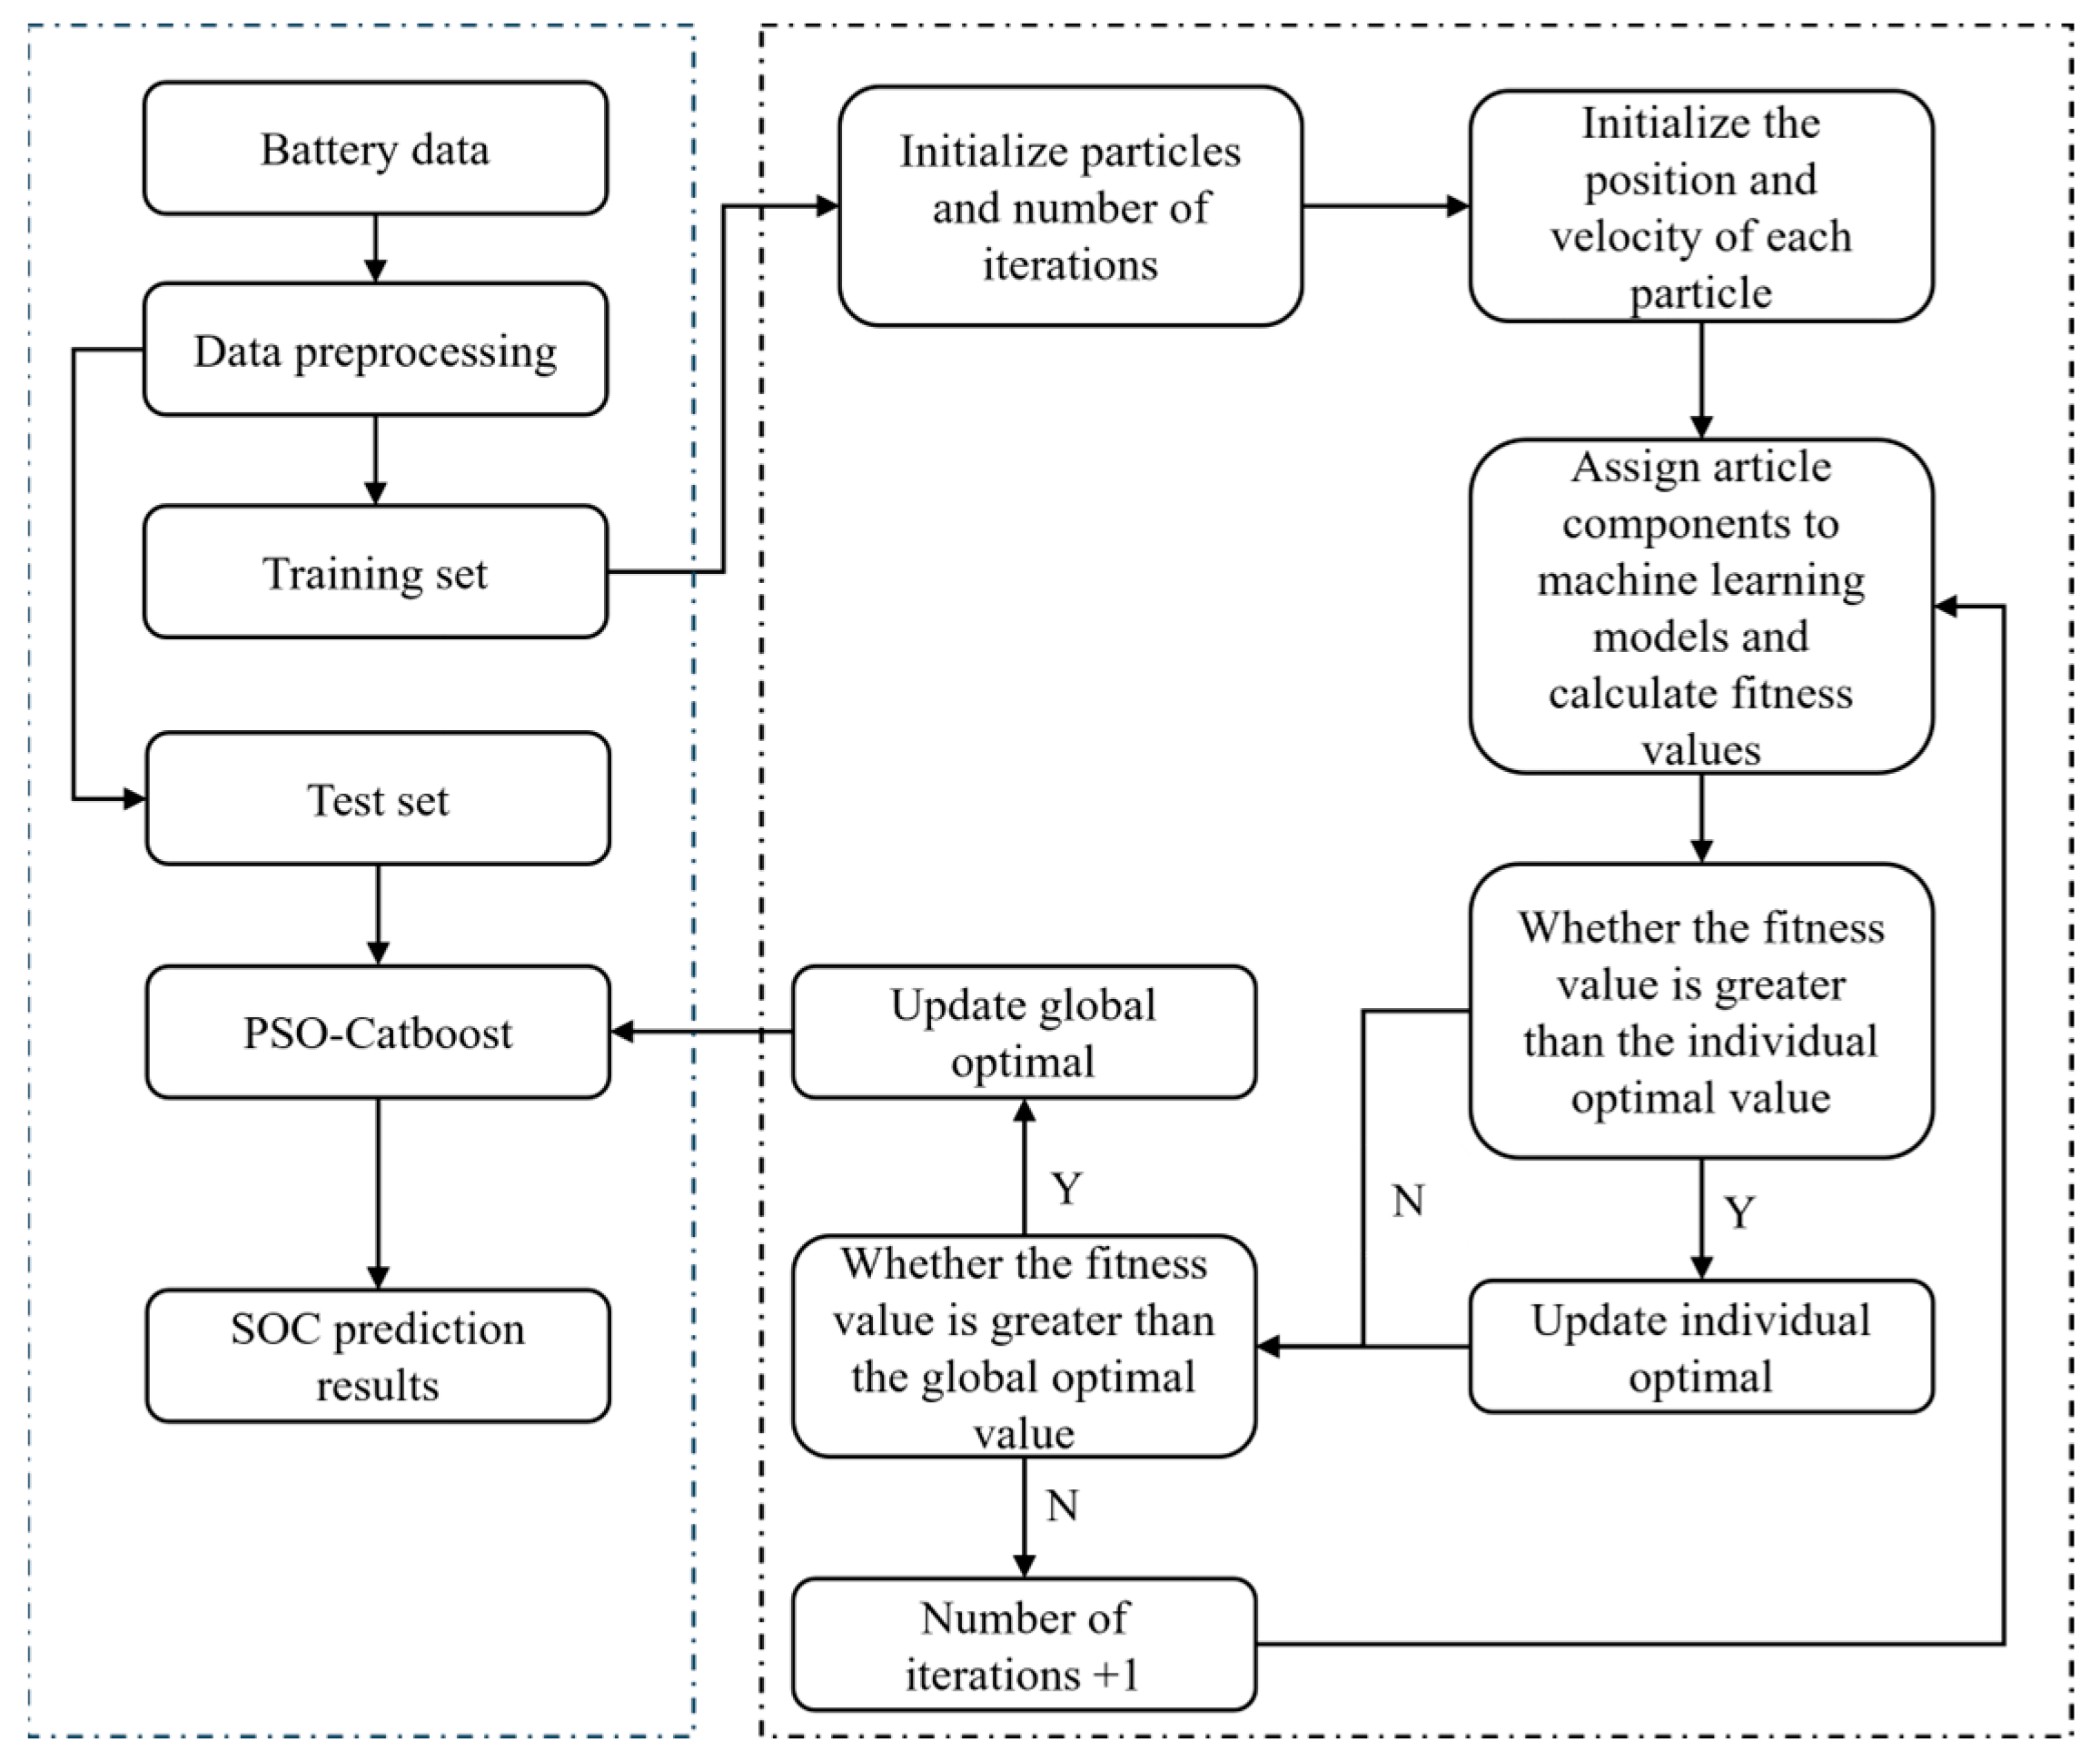
The flow of the PSO-Catboost model is shown in the
Figure 1. The model-building process is as follows:
- (1)
Data preprocessing and dividing the dataset into training and test sets.
- (2)
Each particle component is initialized according to the value range of the parameter range.
- (3)
Start the iterative calculation and update each particle’s velocity and position components according to Equations (5) and (6).
- (4)
Fit value comparison. Firstly, whether the fitness value is more excellent than the individual optimum is judged, and if the fitness value is more excellent than the individual optimum, the model is updated; otherwise, the individual optimum remains unchanged. Secondly, whether the fitness value is more excellent than the global optimum is judged and the model is updated if the fitness value is greater than the global optimum; otherwise, the global variable remains unchanged.
- (5)
Determining whether to terminate the iteration according to the iteration termination condition and performing the following operation if the iteration is terminated; otherwise, continue to iterate.
- (6)
Finally, output the predicted SOC result.
3. Dataset
In the vehicle driving condition data acquisition experiment, we used the mine explosion-proof vehicle as a platform for dynamic data acquisition. The experimental vehicle is shown in
Figure 2. The test vehicle is equipped with 176 single 60 Ah lithium iron phosphate batteries. The specifications of the battery pack are shown in
Table 1.
To evaluate the battery pack’s performance under actual use, we conducted a 1-month experiment, including charge–discharge and rest periods. Driving a vehicle on a closed road includes all phases of realistic driving: starting, stopping, accelerating, decelerating, constant speed, etc., with five different driving periods. The temperature of the experimental environment is about 10 °C. The experimental process is as follows:
- (1)
Fully charge the battery. The criterion of full charge is that when a single battery in the battery pack reaches the limited voltage value (3.5 V), the system sends an instruction to stop charging.
- (2)
Drive the vehicle to a designated closed road for a driving test at a speed not exceeding 25 km/H. The test road is a circular route with a slight slope.
- (3)
In the driving process, the SOC is reduced by 10%, the vehicle is stopped for 0.5 h, and the voltage of the single battery is sampled and measured.
- (4)
When the SOC value drops below 30%, stop the test and return to charging.
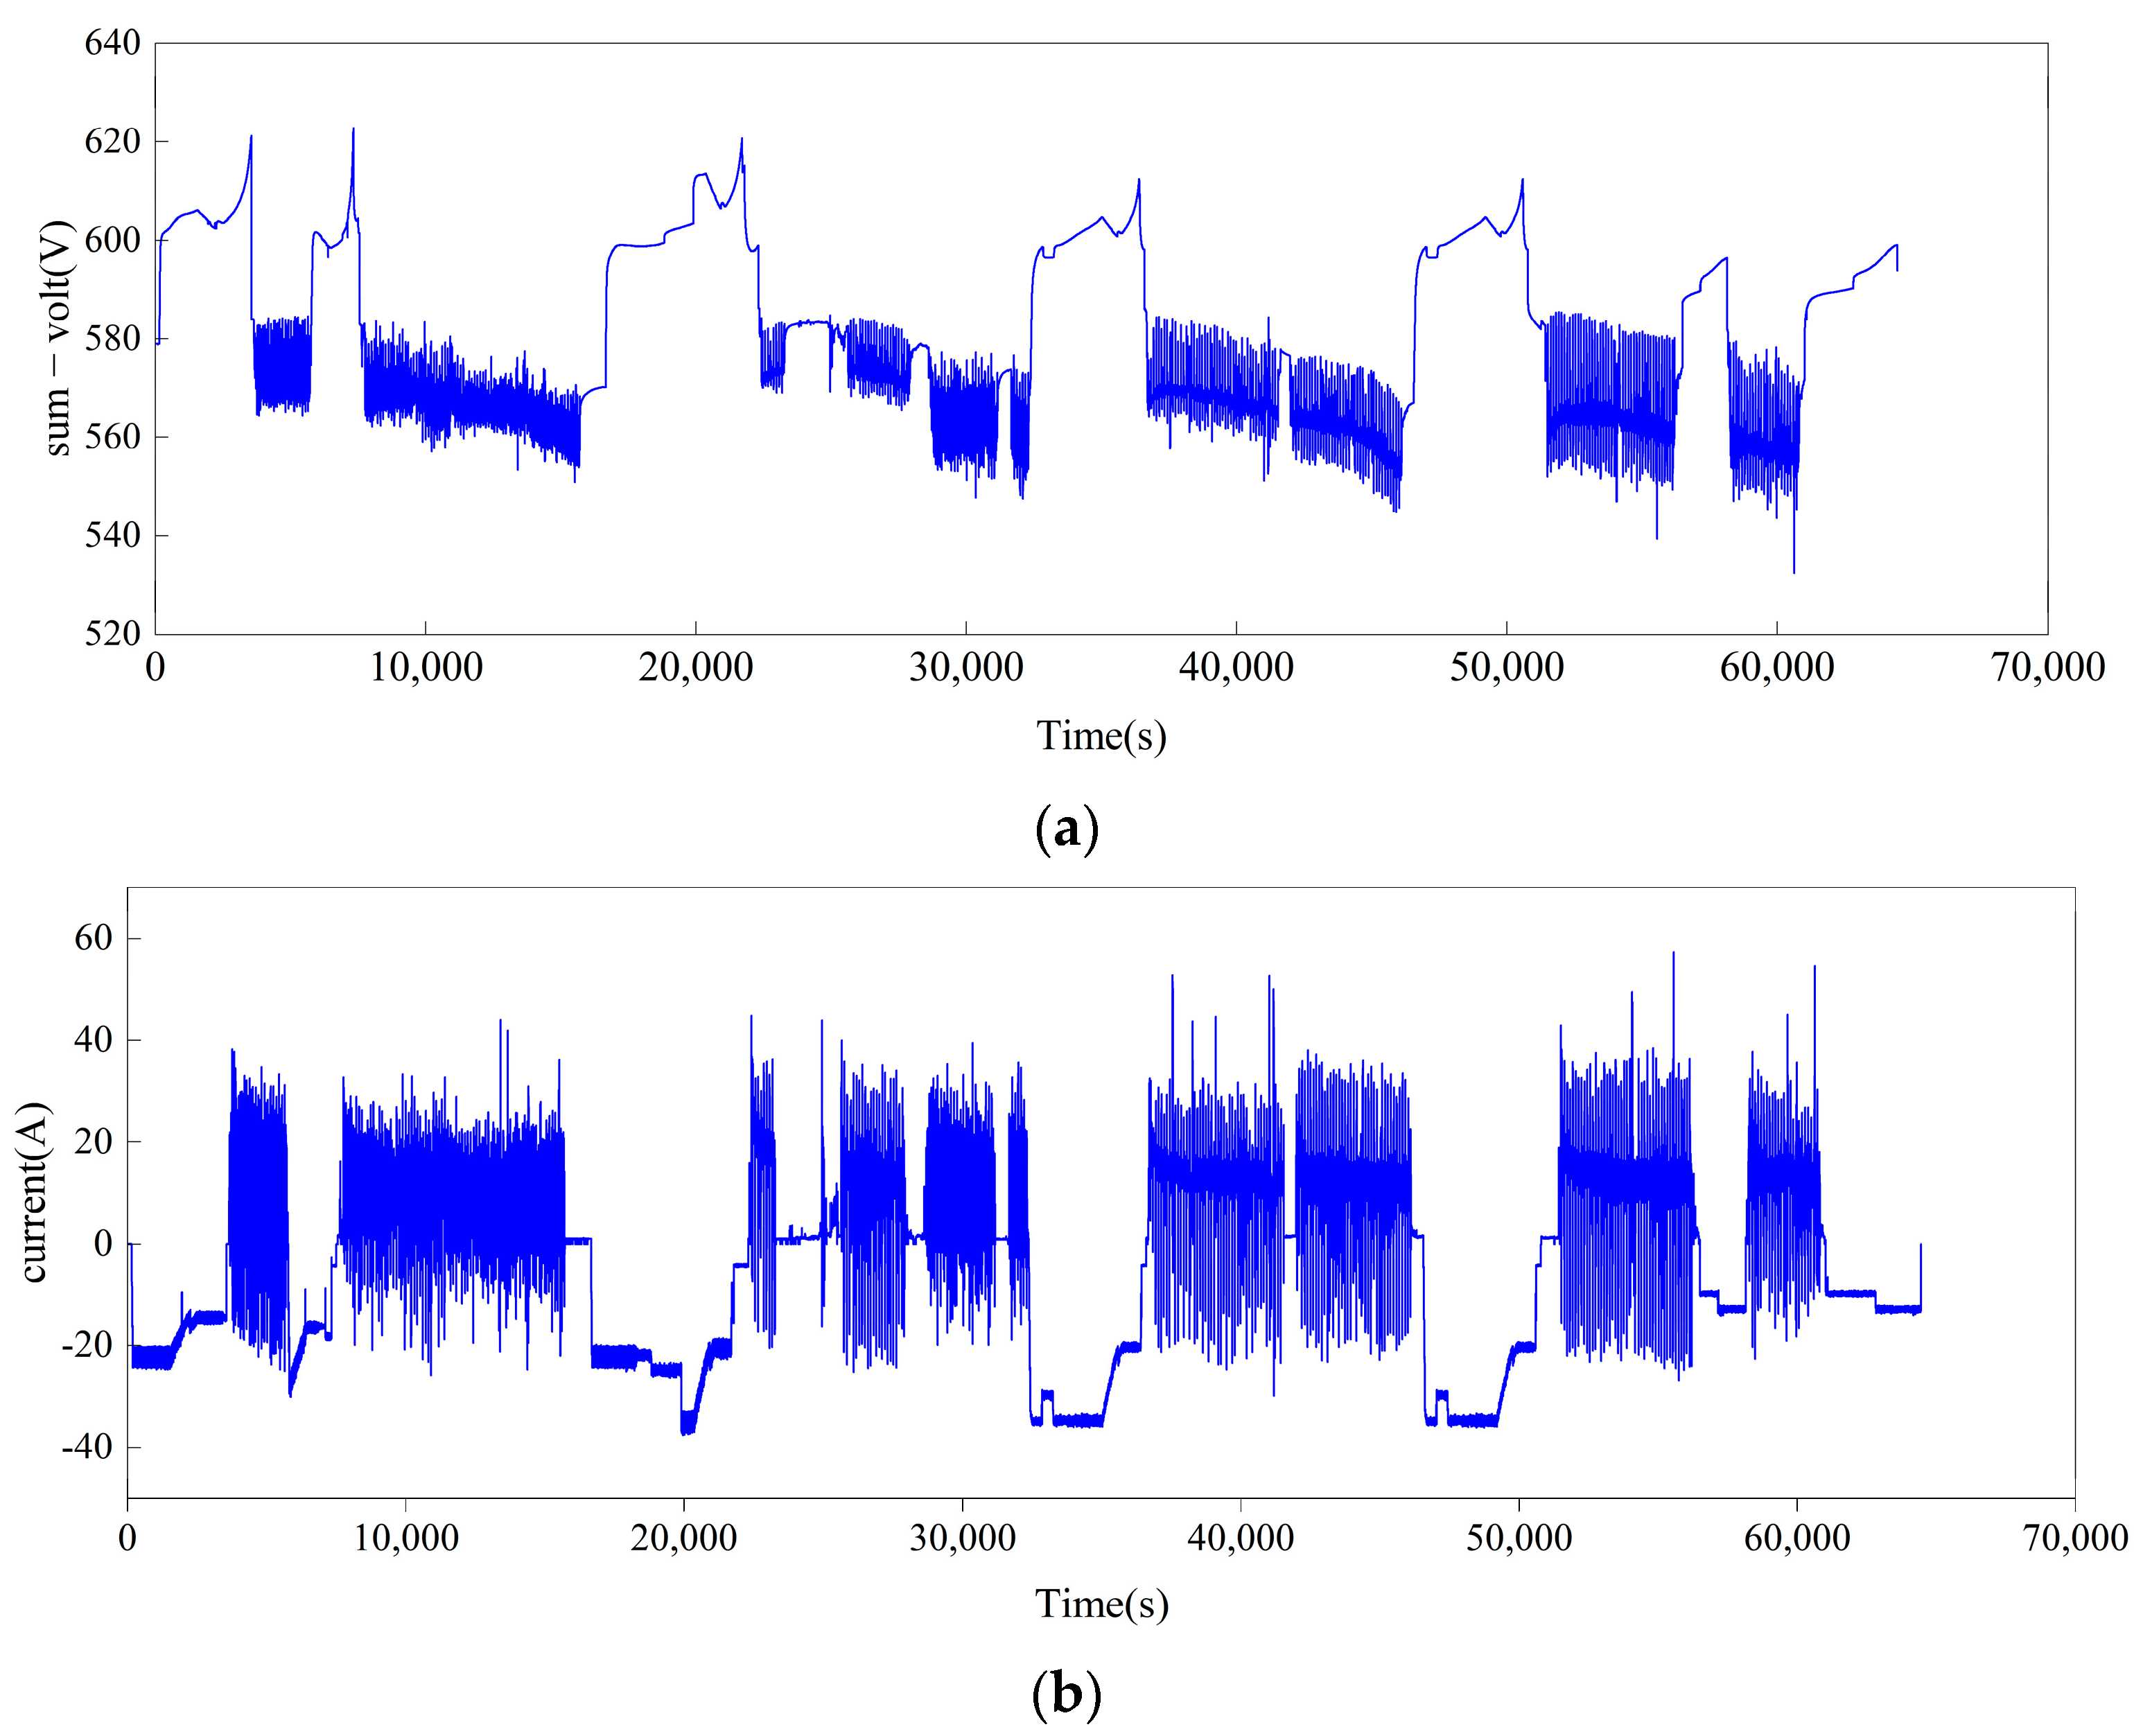
The test data are stored in an Excel format, and the battery voltage (
Figure 3a), current (
Figure 3b), and temperature (
Figure 3c) during charging and discharging are extracted as characteristic data to predict the battery pack’s SOC. The reference SOC value is calculated using the ampere-hour integration method, and the calculation formula is as follows:
The formula is the battery’s initial SOC value, T is the discharge time, I is the discharge current, and C is the battery capacity.
After the data are acquired, the data are normalized, and normalizing the input data before the training process is the key to obtaining good results. In a feature, there is usually a significant difference between the maximum and the minimum. For example, at 0.01 and 1000, the magnitude of the value is scaled to a relatively small value when normalization is performed. Assume that for some feature x,
x′ is the normalized value, then the min–max normalization is calculated as shown in Equation (8), where
is the minimum value of
and
is the maximum value:
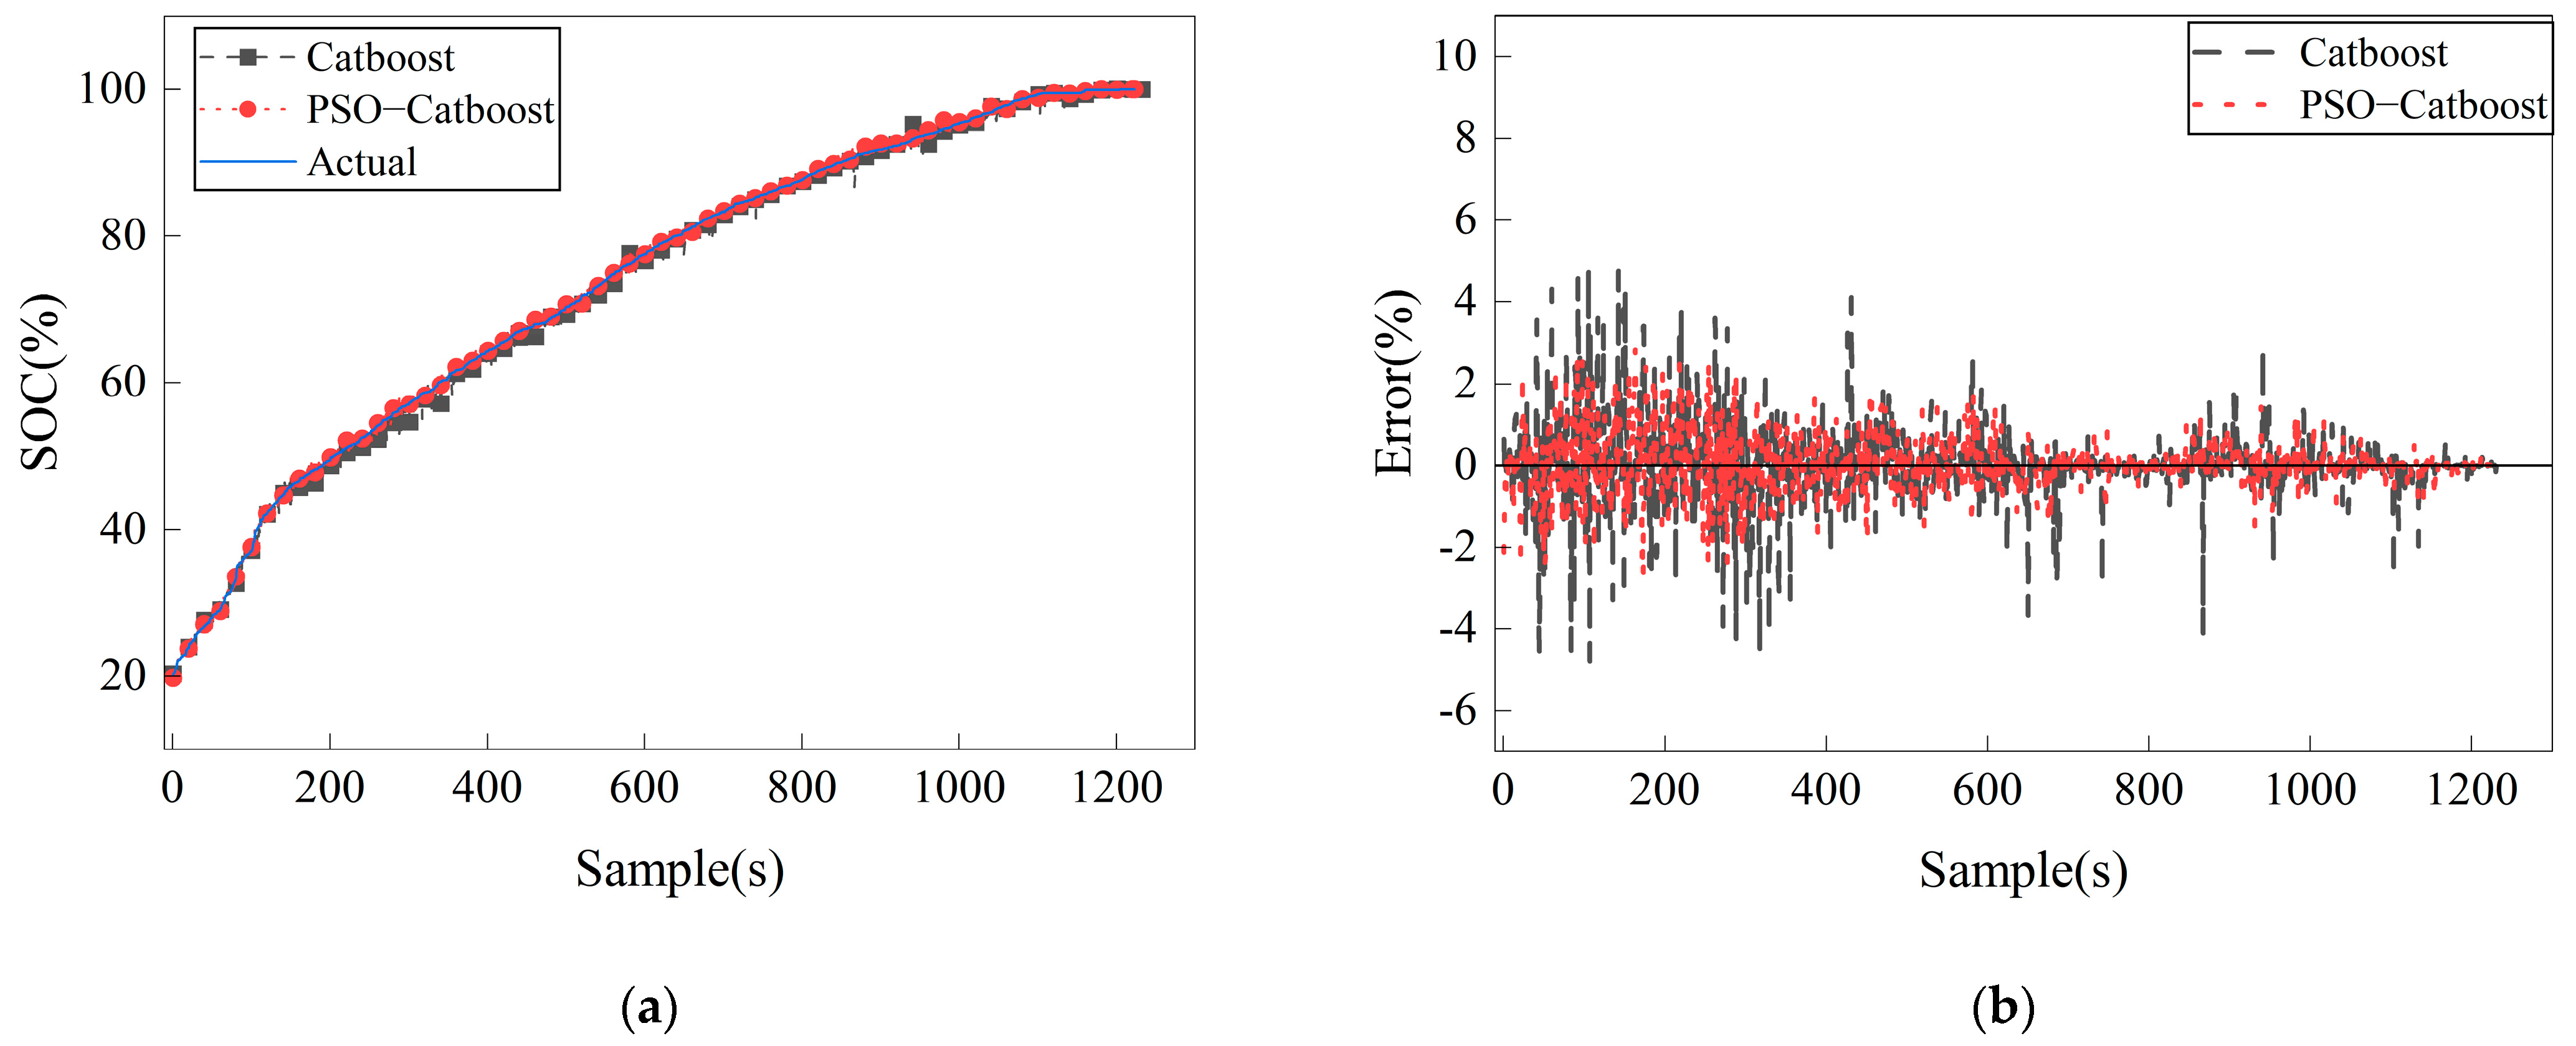
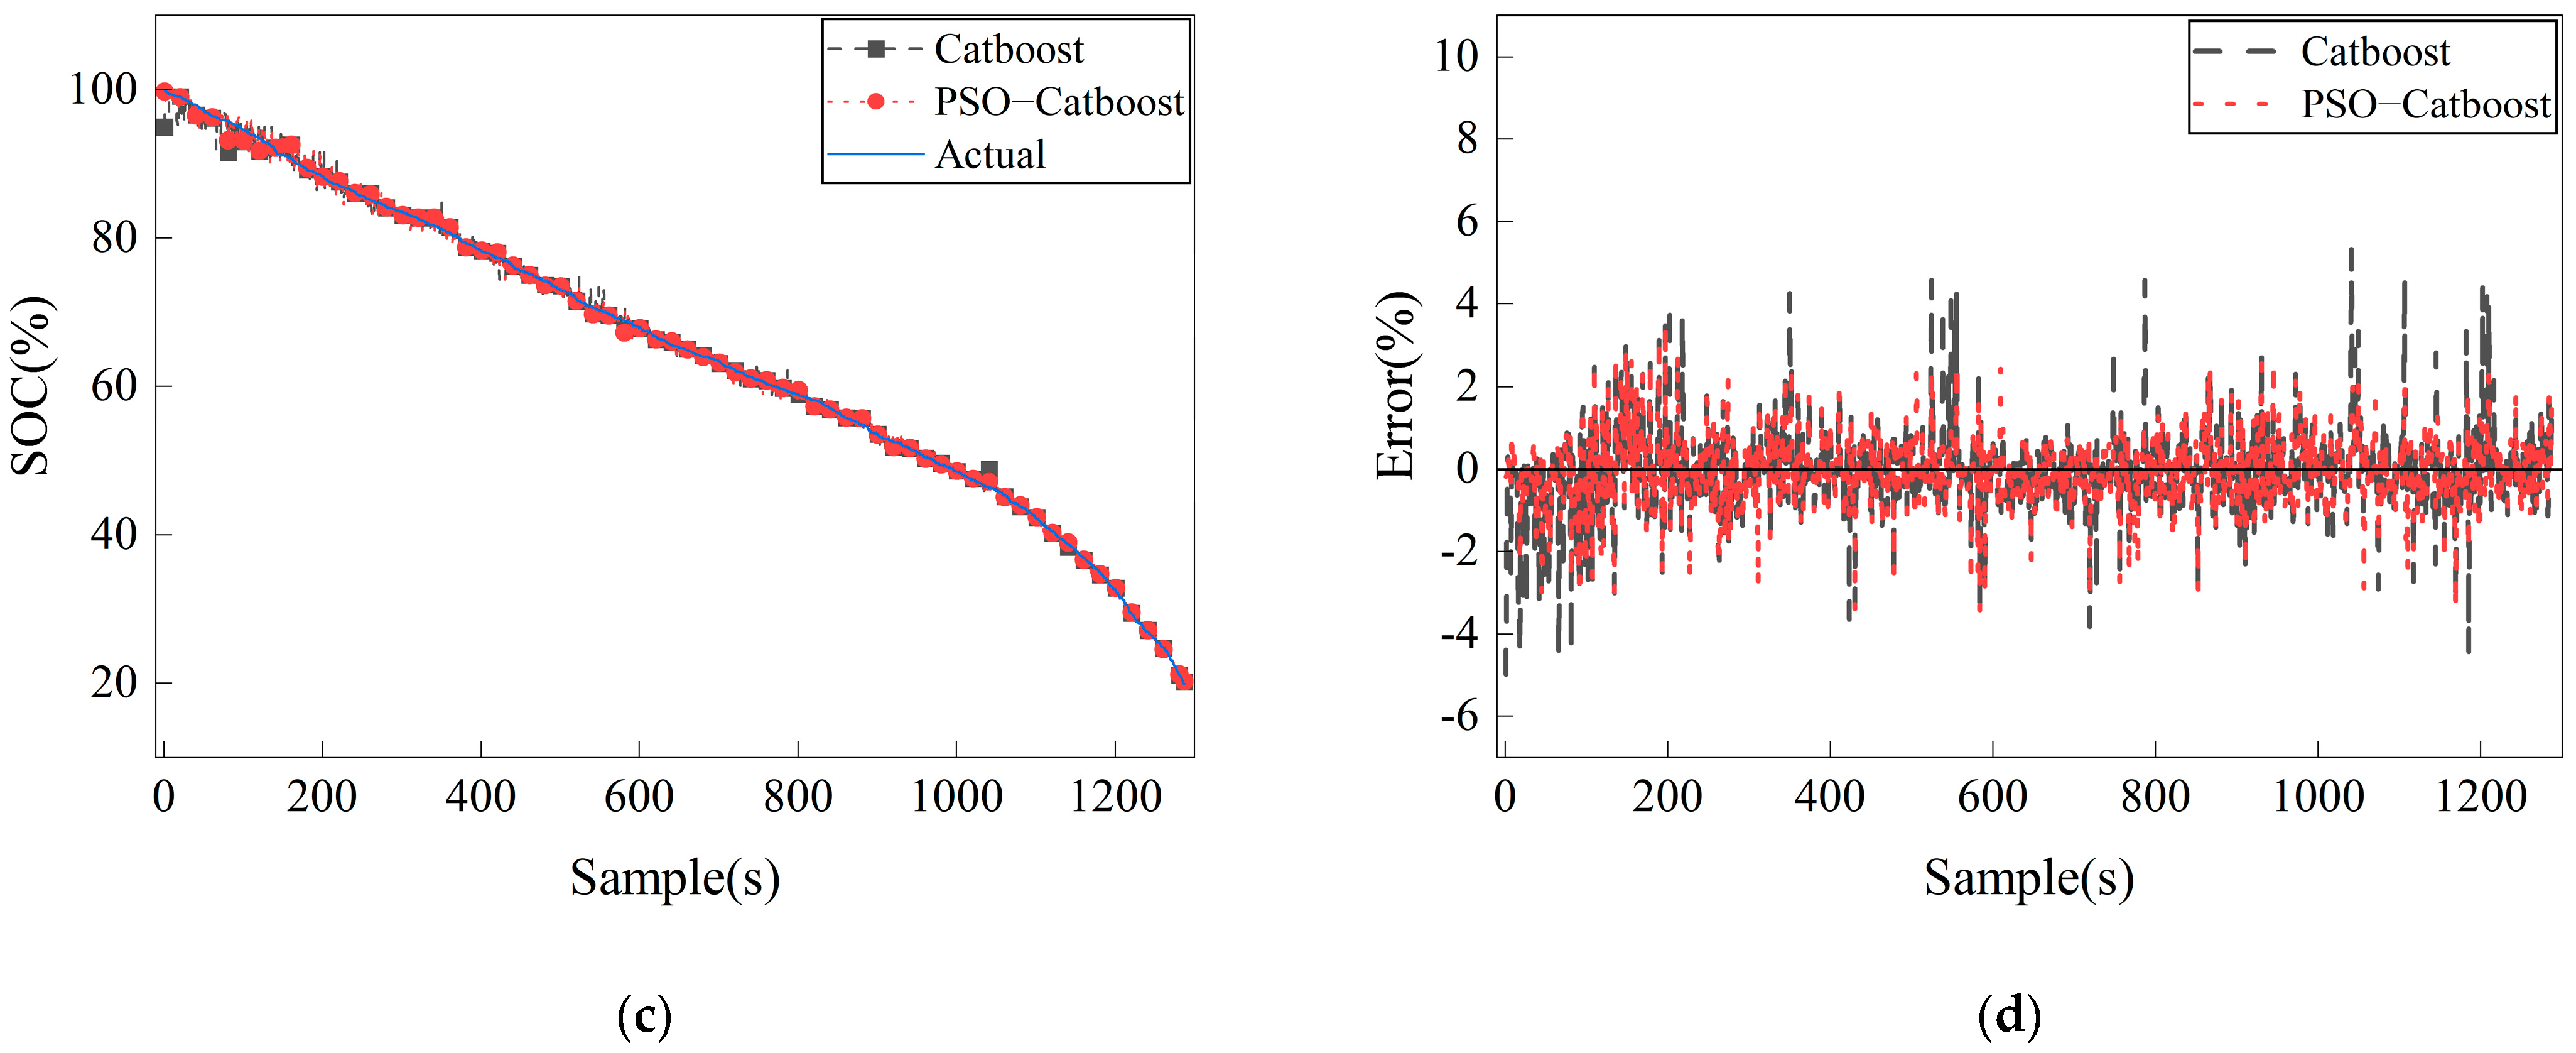
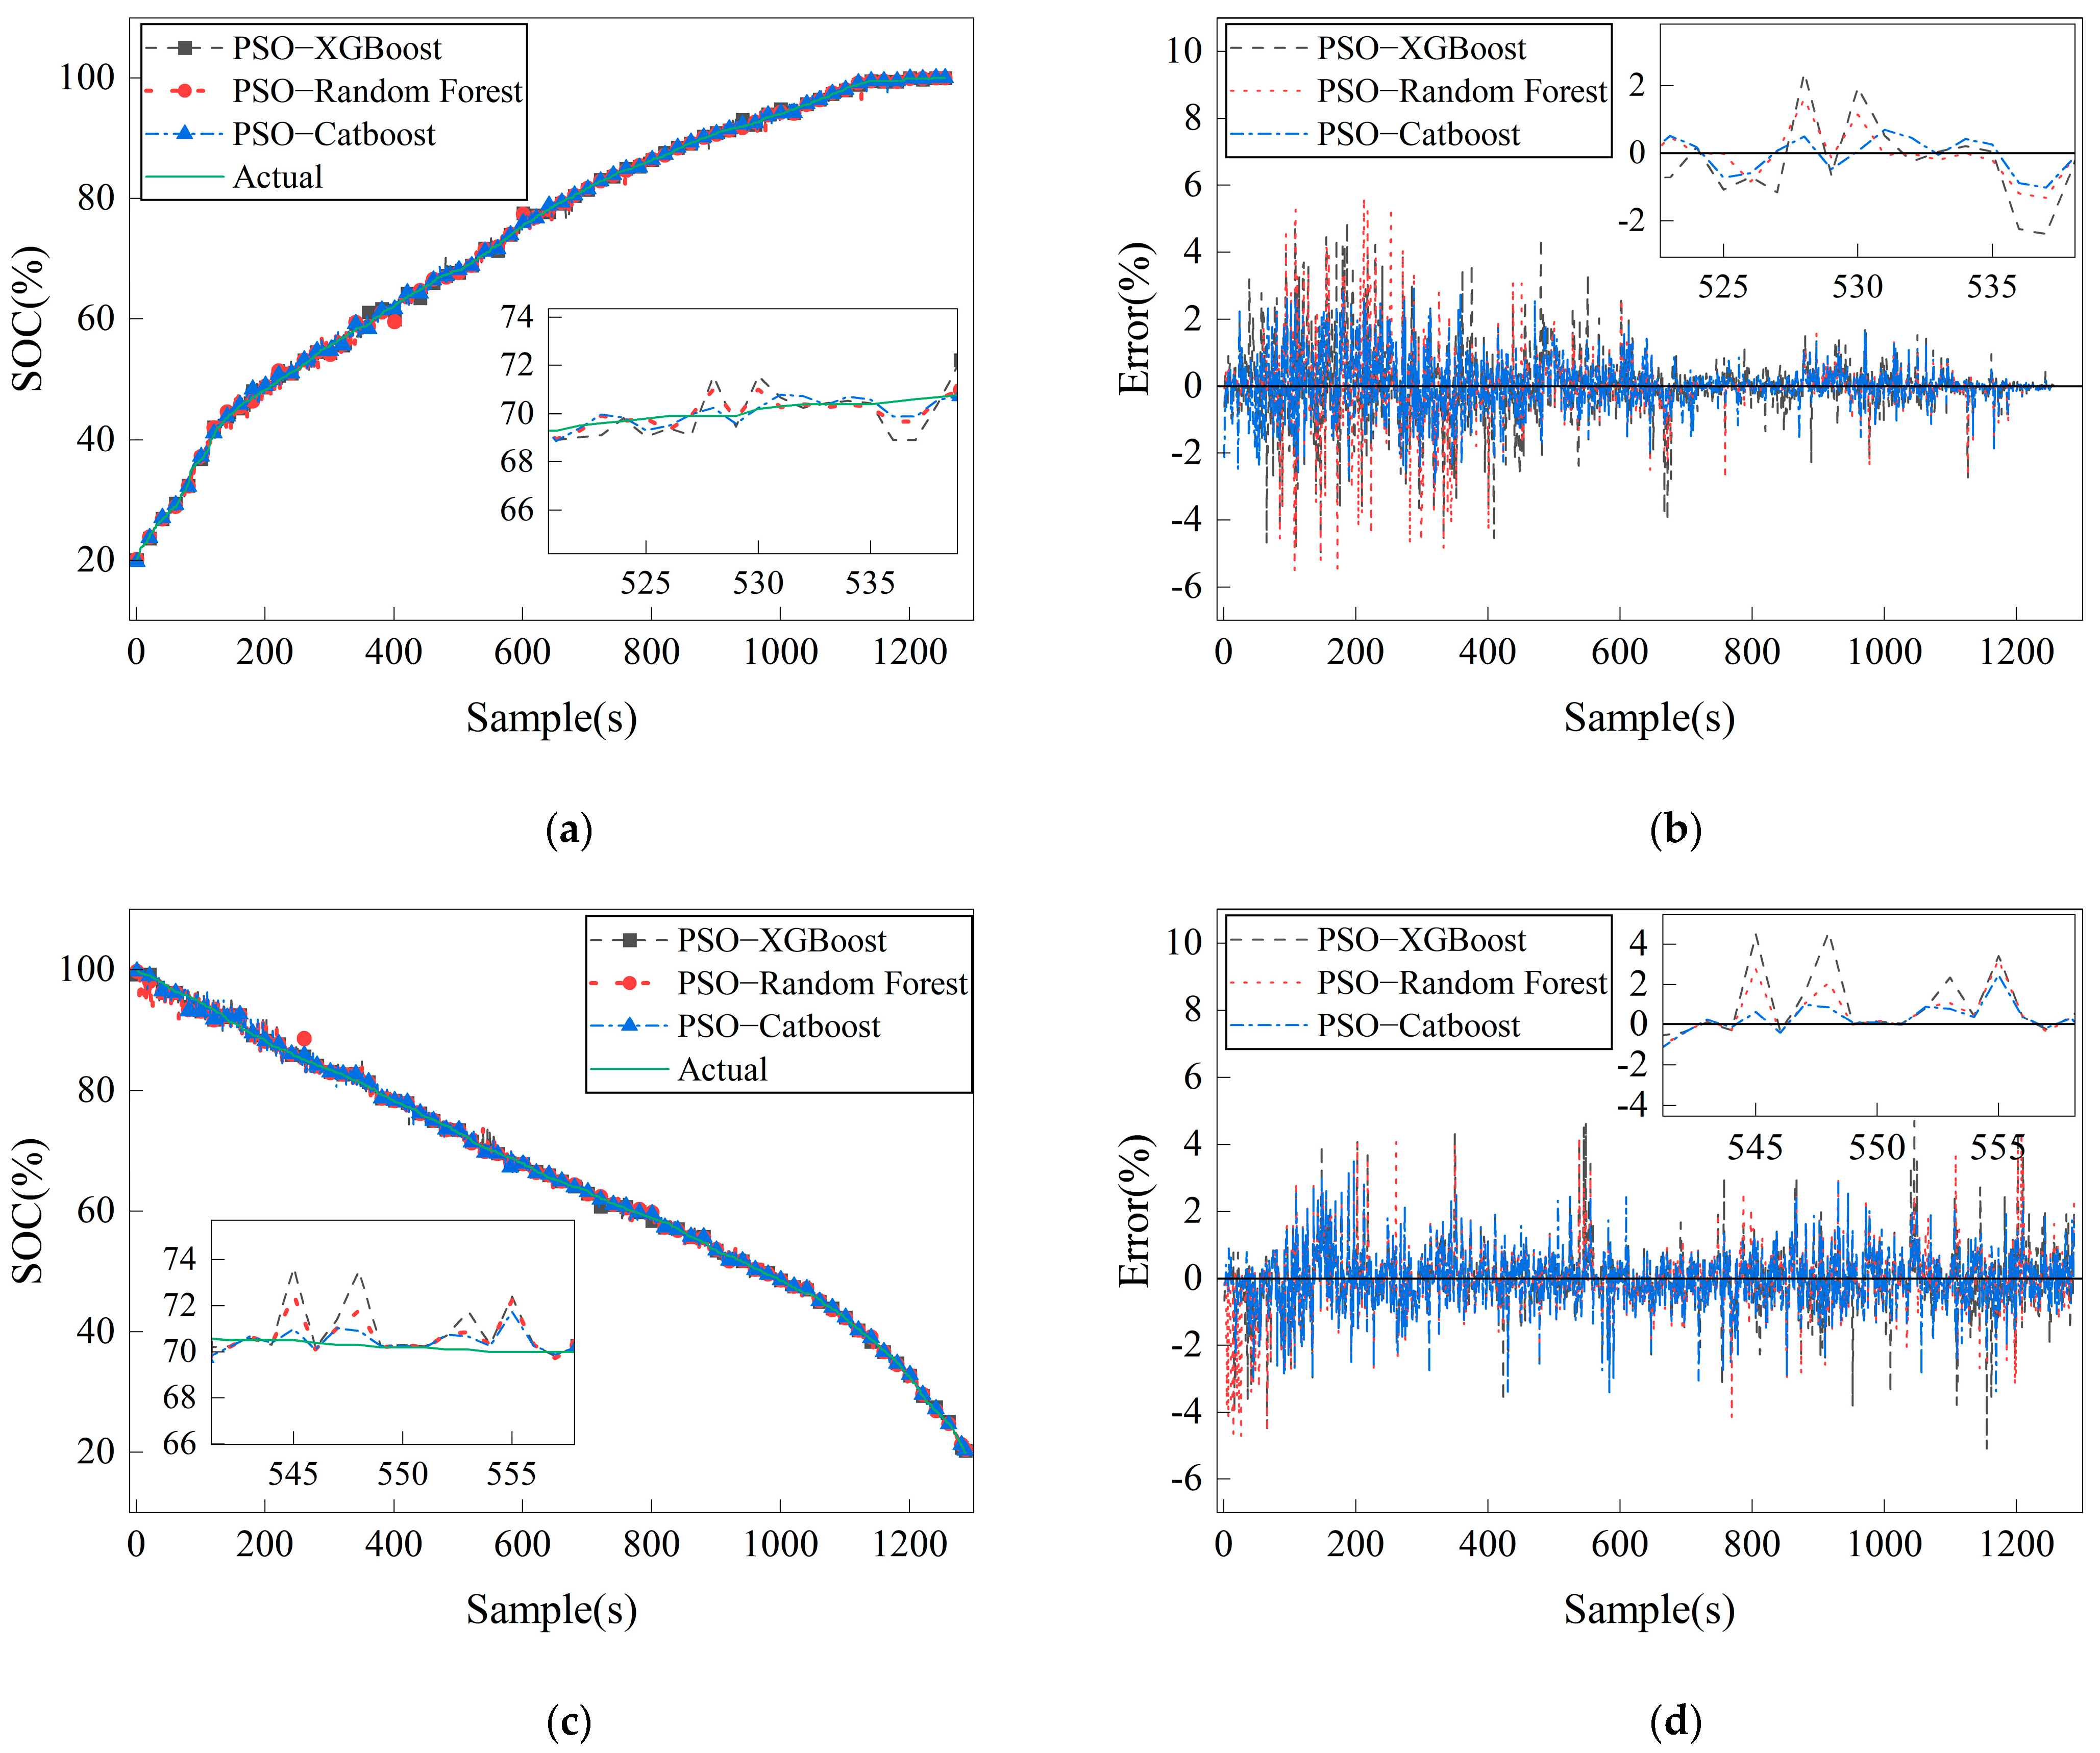
4. Accuracy Standard
The Relative Absolute Error (MAE), Root Mean Square Error (RMSE), and linear regression coefficient of determination (R2) are used to evaluate the estimation effect of different models on a power battery’s SOC. The three indicators confirm the accuracy of various models and assess the deviation between the SOC value of the power battery predicted using different models and the actual value from other dimensions.
4.1. Mean Absolute Error—MAE
The mean absolute error of the model is the average of the absolute value of each prediction error over all instances of the test dataset. The prediction error is the difference between that instance’s actual and predicted values. The
formula is as follows:
4.2. Root Mean Square Error—RMSE
The Root Mean Square Error (RMSE) quantifies the average disparity between the predicted and actual values of the statistical model. It evaluates the magnitude of error in the regression or other statistical models. A value of 0 signifies an exact match between the predicted and actual values, though this scenario is seldom observed in practical applications. A low
value signifies a well-fitted model with more accurate predictions. Conversely, a higher value indicates a more significant error and reduced prediction accuracy.
4.3. Coefficient of Determination of Linear Regression—R2
The Coefficient of Determination for Linear Regression, commonly used as
R2, is an indicator used to assess the degree of fit of a linear regression model
R2. The value range is between 0 and 1. The closer to 1, the better the model fits, and the closer to 0, the worse the model fits.
R2’s calculation formula is as follows
In the above formula, represents the number of values in the dataset. represents a true value, represents a predicted value, and represents the average of the true values.


