Article

Prediction and Scenario Simulation of Carbon Emissions Peak of Resource-Based Urban Agglomeration with Industrial Clusters—Case of Hubaoe Urban Agglomeration Inner Mongolia Autonomous Region, China

1
College of Geographical Sciences, Inner Mongolia Normal University, Hohhot 010028, China
2
Institute of Geographic Sciences and Natural Resources Research, Chinese Academy of Sciences, Beijing 100101, China
*
Authors to whom correspondence should be addressed.
Energies 2024, 17(22), 5521; https://doi.org/10.3390/en17225521
Submission received: 27 September 2024 / Revised: 22 October 2024 / Accepted: 31 October 2024 / Published: 5 November 2024
(This article belongs to the Section B: Energy and Environment)

Abstract

:
China has implemented a “dual-carbon” policy in response to the Paris Agreement’s global climate change objectives. Hohhot, Baotou, and Ordos (HBO-UA) is a resource-based urban agglomeration that is noteworthy for having significant heavy industry in China. Based on the extended STRIPAT model, which broadens the study indicators into six aspects—population, economics, technology, urbanization, industrial energy, and industrial structure—this paper develops a research framework of “Driving–Predicting–Simulating” for carbon emissions. According to the “one formula for one city” principle, driver models were constructed for Hohhot, Baotou, and Ordos, respectively. The following conclusions were drawn: (1) Population and urbanization are the dominant factors of carbon emissions in HBO-UA, following the economy and industrial energy. (2) Carbon emissions are multifactor-driven in Hohhot, double-factor-driven in Baotou, and single-factor-driven in Ordos. (3) Hohhot can achieve its carbon emissions peak under more efficient and lower policy costs, while Ordo is under great pressure to reduce carbon emissions. (4) We suggest multiple strategies to accomplish the “dual-carbon” goals for resource-based urban agglomeration with industrial clusters. These strategies include fostering diversified consumption by continuously enhancing urban functions, directing the transformation of the industrial structure, and fostering the growth of emerging industries.

1. Introduction

As the 28th United Nations Climate Change Conference gets underway, the new report from the United Nations Framework Convention on Climate Change (UNFCCC) indicates that global efforts to achieve climate targets are falling short of expectations. Existing climate plans have failed to limit global warming to 1.5 °C. Realizing the Paris Agreement is improbable. Accelerating the carbon peaking process is imperative. China, the biggest energy user and CO2 emitter in the world, has put out “dual-carbon” targets, aiming to reach carbon neutrality by 2060 and carbon peaking by 2030. The European Union has proposed the European Green Deal, aiming to achieve carbon neutrality by 2050. Many countries’ industrial policies focus on coordinated regional economic development, especially in resource-based cities and peripheral areas, promoting economic diversification and transformation. For example, some mining cities in Australia face the challenge of high carbon emissions due to coal and natural gas mining. Therefore, it is urgent to study the carbon emissions of resource-based cities. A resource-based city is a special type of industrial city that has emerged by utilizing local natural resources. It refers to a city that uses coal resources as its foundation to mine, wash, and process coal resources into its main industry. The output value and employees of the coal industry account for a large proportion in this city [1]. In 2021, these cities accounted for approximately 42.7% of all types of cities in China [2]. China has a large number of industrialized cities, and there is a strong link between the density of mines and mineral enterprises and ecological risks [3]. China’s consumption of coal resources accounts for a high proportion of the total consumption [4,5], and relevant research shows that although the proportion of coal consumption in China is showing a decreasing trend, the rate of decrease is decreasing [4]. To summarize, reducing carbon emissions in resource-based urban agglomerations with industrial clusters is of great significance to the realization of the “dual-carbon” goals of China as a whole.
With a total emission of 843.4 Mt, the Inner Mongolia Autonomous Region ranks third in the nation for carbon emissions. It has about 10 times the carbon emissions of Beijing (79.96 million tons), according to the 2021 China Carbon Emissions Inventory published by the China Carbon Emissions Database [5]. This region is crucial to China’s efforts to reduce carbon emissions. HBO-UA, as the industrial agglomeration and economic growth core of Inner Mongolia, is the most dynamic economic circle and an important resource-based urban agglomeration with industrial clusters in China. At the same time, being dominated by heavy industry, its industrial characteristics indicate that it has high emission characteristics different from other light industrial cities [6]. Some researchers have pointed out that the HBO-UA is one of the 19 city agglomerations in China with high carbon emissions, and its carbon emissions have continued to show an upward trend [7]. In addition, the three cities of HBO-UA have different industrialization processes and dominant industries, which will be highly representative in the global urban agglomeration. Therefore, research on carbon emissions and scenario simulations of carbon peaking in HBO-UA represent what is typical in similar regions in developing countries as concerns exploring the path of carbon peaking and green sustainable development.
With respect to current research on carbon emissions forecasting, in terms of the study area, the existing studies on China’s carbon emissions mainly include national, provincial, and urban agglomerations. At the national level, some scholars have constructed a carbon emissions decomposition model by combining the extended Kaya model with the LMDI model. The research found that China’s carbon emissions accounted for one-third of the world’s carbon emissions, and the rapid development of the economy and urbanization have made it more difficult to reduce carbon emissions. The research suggests that in order to develop a low-carbon society, it is important to adjust the industrial structure, reduce energy consumption, and improve the policy system [8]. Researchers have used models to forecast the carbon emissions of the research area at the provincial level in Shandong Province [9], Shanxi Province [10], and Hubei Province [11]. Regarding urban agglomerations, researchers have looked at the socioeconomic conditions and carbon emissions in 19 Chinese urban agglomerations. They suggest that for city agglomerations with highly polarized carbon emissions, regional integration and coordination should be maintained in order to minimize the total regional cost [7]. In research focused on the Pearl River Delta (PRD) in China, researchers explored how land urbanization, population urbanization, and economic urbanization impact carbon emissions. The findings indicate that energy consumption and industrial production emissions are the key factors driving the rise in carbon emissions [12]. There is insufficient research on resource-based urban agglomeration with industrial clusters. Typically, a single model equation is used to simulate the prediction of the entire city agglomerations or region. The method by which the industrial structure and industrialization process within urban agglomerations contribute differently to carbon emissions is difficult to reflect in this way. In the selection of indicators, the main focus is on the economy [13], population [14], urbanization [15], industrial structure [9], and energy [9]. Resource-based cities often focus on resource extraction and primary processing, and the singularity of their economic structure increases their dependence on high-polluting and high-energy-consuming industries. When the production of major industrial products increases, the overall carbon emissions also rise. For example, the mining and production of coal and minerals directly affect the carbon emissions level of cities [6]. And the fluctuation of market demand for major industrial products will directly affect production volume, thereby affecting carbon emissions [16]. In terms of the construction of the indicator system, there is little targeted selection of industrial type indicators for the study of industrial cities. In the selection of carbon emissions simulation and prediction models, scholars mostly adopt the LEAP model [17], STIRPAT model [18,19], Kaya model [20], LMDI decomposition method [21,22], system dynamics model [18,19,23], neural network model [24,25], and so on. Some scholars use a gray rolling prediction model to predict carbon emissions and involve the development of new information [26]. Although this method makes up for the previous model construction based on historical data, it is difficult to obtain new indicators and new information, which is not suitable for most of the studies. Therefore, some scholars have used stochastic frontier analysis to determine carbon emissions indicators, construct carbon emissions prediction models based on the extreme learning mechanism, and forecast future carbon emissions trends [21]. However, this type of approach is suitable for studies with small data sets.
In summary, there has been good progress in research on carbon emissions and their driving factors in urban agglomerations, but there is still a lack of research on resource-based urban agglomerations with industrial agglomeration. Therefore, this paper empirically studies the HBO carbon peak situation through the STRIPAT model combined with ridge regression, and uses scenario analysis to simulate the carbon peak of the Hohhot Baotou Hubei urban agglomeration from 2023 to 2035. The main innovation is to construct a research framework for carbon peak and scenario simulation of resource-based urban agglomerations with industrial agglomeration, focusing on industrial energy indicators as specific indicators for analyzing industrial agglomeration resource cities. The second is to comprehensively analyze resource endowment and production factor allocation, as well as industrial processes and industrialization, and construct driving factor regression models for the three cities of HBO to compare and analyze the differences in carbon emission processes within urban agglomerations. The third is to consider the dependence of the economic growth of the Hohhot Baotou Hubei urban agglomeration on industry, and simulate the carbon peak of the three cities in multiple scenarios without sacrificing the proportion of industrial added value. This study aims to provide scientific basis and decision-making reference for carbon reduction in resource-based urban clusters with similar industrial agglomeration worldwide.

2. Methods and Indicators

2.1. Extended STIRPAT Model

The STIRPAT model evolved from the IPAT model established by Ehrlich and Holdren [22]. The IPAT model, also known as the Environmental Pressure Control Model, is used to study the impact of population, wealth, and technology on the environment. However, the equation is a constant equation, and there are many limitations to the equation as the environment is often influenced by many factors between the environment and the influencing elements, each of which has a different proportion of influence. The STIRPAT model adds flexibility to the IPAT model and effectively solves the limitations of the IPAT equation [27]. The equation is expressed as follows:
I = a P b A c T d e
where I is the environmental pressure, P is the population size, A is the affluence, and T is the technology level; a is the coefficient of the equation; b, c, and d are the indices of the driving forces, namely population size, affluence, and technology level, respectively, and the magnitude of the indices represents the magnitude of the impact of the driving forces on the environment; and e is the error term.
The application of indices overcomes the limitations of the IPAT model and has been widely used in carbon emissions-related studies in recent years. It is often expressed in logarithmic form in practical applications:
ln I = ln a + b ln P + c ln A + d ln T + ln e
To conduct a more thorough analysis of the factors influencing carbon emissions, scientists have primarily employed the extended STIRPAT model, which divides population, wealth, and technological advancement into more significant factors. Most scholars consider the economy to be the main factor influencing carbon emissions, with real GDP per capita [13] usually appearing as a proxy for economic factors. Population has also been recognized by some research as a key factor influencing carbon emissions, and the indicator usually chosen is the total population [14]. The rapid development of urbanization tends to promote the growth of carbon emissions, and the indicators are selected to represent the urbanization rate [17,28], population density, and population density [9]. The industrial structure frequently becomes a significant factor for scholars to take into account because there are significant differences in the industrial structure and the impact on carbon emissions for different research regions. The indicators are typically chosen as the ratio of the industry sector output value over the total GDP [9] and the ratio of the industry sector output value over the total GDP [29]. Energy consumption and energy structure are often important factors affecting carbon emissions. The reasonable energy consumption structure can effectively inhibit the increase of carbon emissions, and the indicators are selected to include energy intensity [9], the consumption of various fossil energy sources [24,25,30], and the proportion of fossil energy consumption [9].
Based on the previous research, in order to study the carbon emissions of the industrial resource-based urban agglomeration in the HBO-UA in a more targeted manner, this paper also extends the STIRPAT model by adding urbanization, industrial structure, and industrial energy factors, in addition to the above three factors of population, wealth, and technology. Specific indicators were selected as shown in Table 1. Therein, the demographic factor is the total population; the wealth factor is expanded to include real GDP per capita and the total exports and imports; and the urbanization factor is expanded to include urbanization rate, employment, and landscaping space. The industrial structure is expanded to include the ratio of the primary industry output value over the total GDP, the ratio of the secondary industry output value over the total GDP, the ratio of the tertiary industry output value over the total GDP, and the ratio of the industry sector output value over the total GD. Industrial energy production factors expand into raw coal production and electricity generation. The extended STIRPAT model is as follows:
ln c c = ln a + b 1 ln p + b 2 ln r g + b 3 ln p g + b 4 ln s g + b 5 ln t g + b 6 ln g i + b 7 ln l e + b 8 ln l i + b 9 ln i e + b 10 ln e p + b 11 ln u r + b 12 ln l c + b 13 ln r y + b 14 ln g c + ln e

2.2. Ridge Regression

Since the expanded STIRPAT model is essentially a multivariate regression model, there could be a major issue with multicollinearity between the independent variables [31]. In this study, there is very severe multicollinearity between the independent variables, which affects the model fit and reduces the interpretability of the model as well as increases the likelihood of misdiagnosis. Ridge Regression can effectively reduce the uncertainty of coefficients, thereby improving the stability of the model. In the presence of multicollinearity, ordinary least squares (OLSs) may lead to large variances and unstable prediction results. Ridge Regression can reduce the complexity of the model and improve prediction accuracy by penalizing large coefficients [32]. Due to the addition of regularization terms, Ridge Regression can effectively avoid model overfitting in the presence of multicollinearity [33]. Therefore, this article introduces ridge regression for research. The essence of ridge regression is to add a non-negative factor k to the main diagonal of the standardized matrix of the independent variables to eliminate the interference of multicollinearity in the results [33]. The standard binary regression equation is as follows:
Y = β X + ε
The unbiased estimation of β is usually given by the following formula:
β = ( X X ) 1 X Y
When there is collinearity between X variables, the matrix is ill conditioned. Therefore, a non-negative factor k is added along the diagonal to the normalized independent variable matrix with the following equation:
β = ( X X + k I ) 1 X Y
The range of values of k is 0 < k < 1.
First, all variables were subjected to correlation analysis in Stata. A high correlation was found between the variables, and then a multiple covariance test was performed, which revealed a serious covariance problem between the variables. Then, ridge regression is performed to determine the optimal k value to reduce the covariance between the variables, and then the suitable and significant driving factors are screened to improve the stability of the model and finally eliminate the covariance problem.

2.3. Urban Model Determination

Considering that each city has different leading industries and industrial development stages, this study constructs ridge regression models for each city separately. Firstly, all indicators are subjected to ridge regression, and the indicators that pass the significance test in the first regression are extracted for further regression. Finally, the regression coefficients and equations of the indicators are determined. This article ensures that the selected indicators are in line with the current development status of the city to the greatest extent possible. The process of establishing models for each city is detailed in Supplementary Materials.

2.4. Scenario Setting
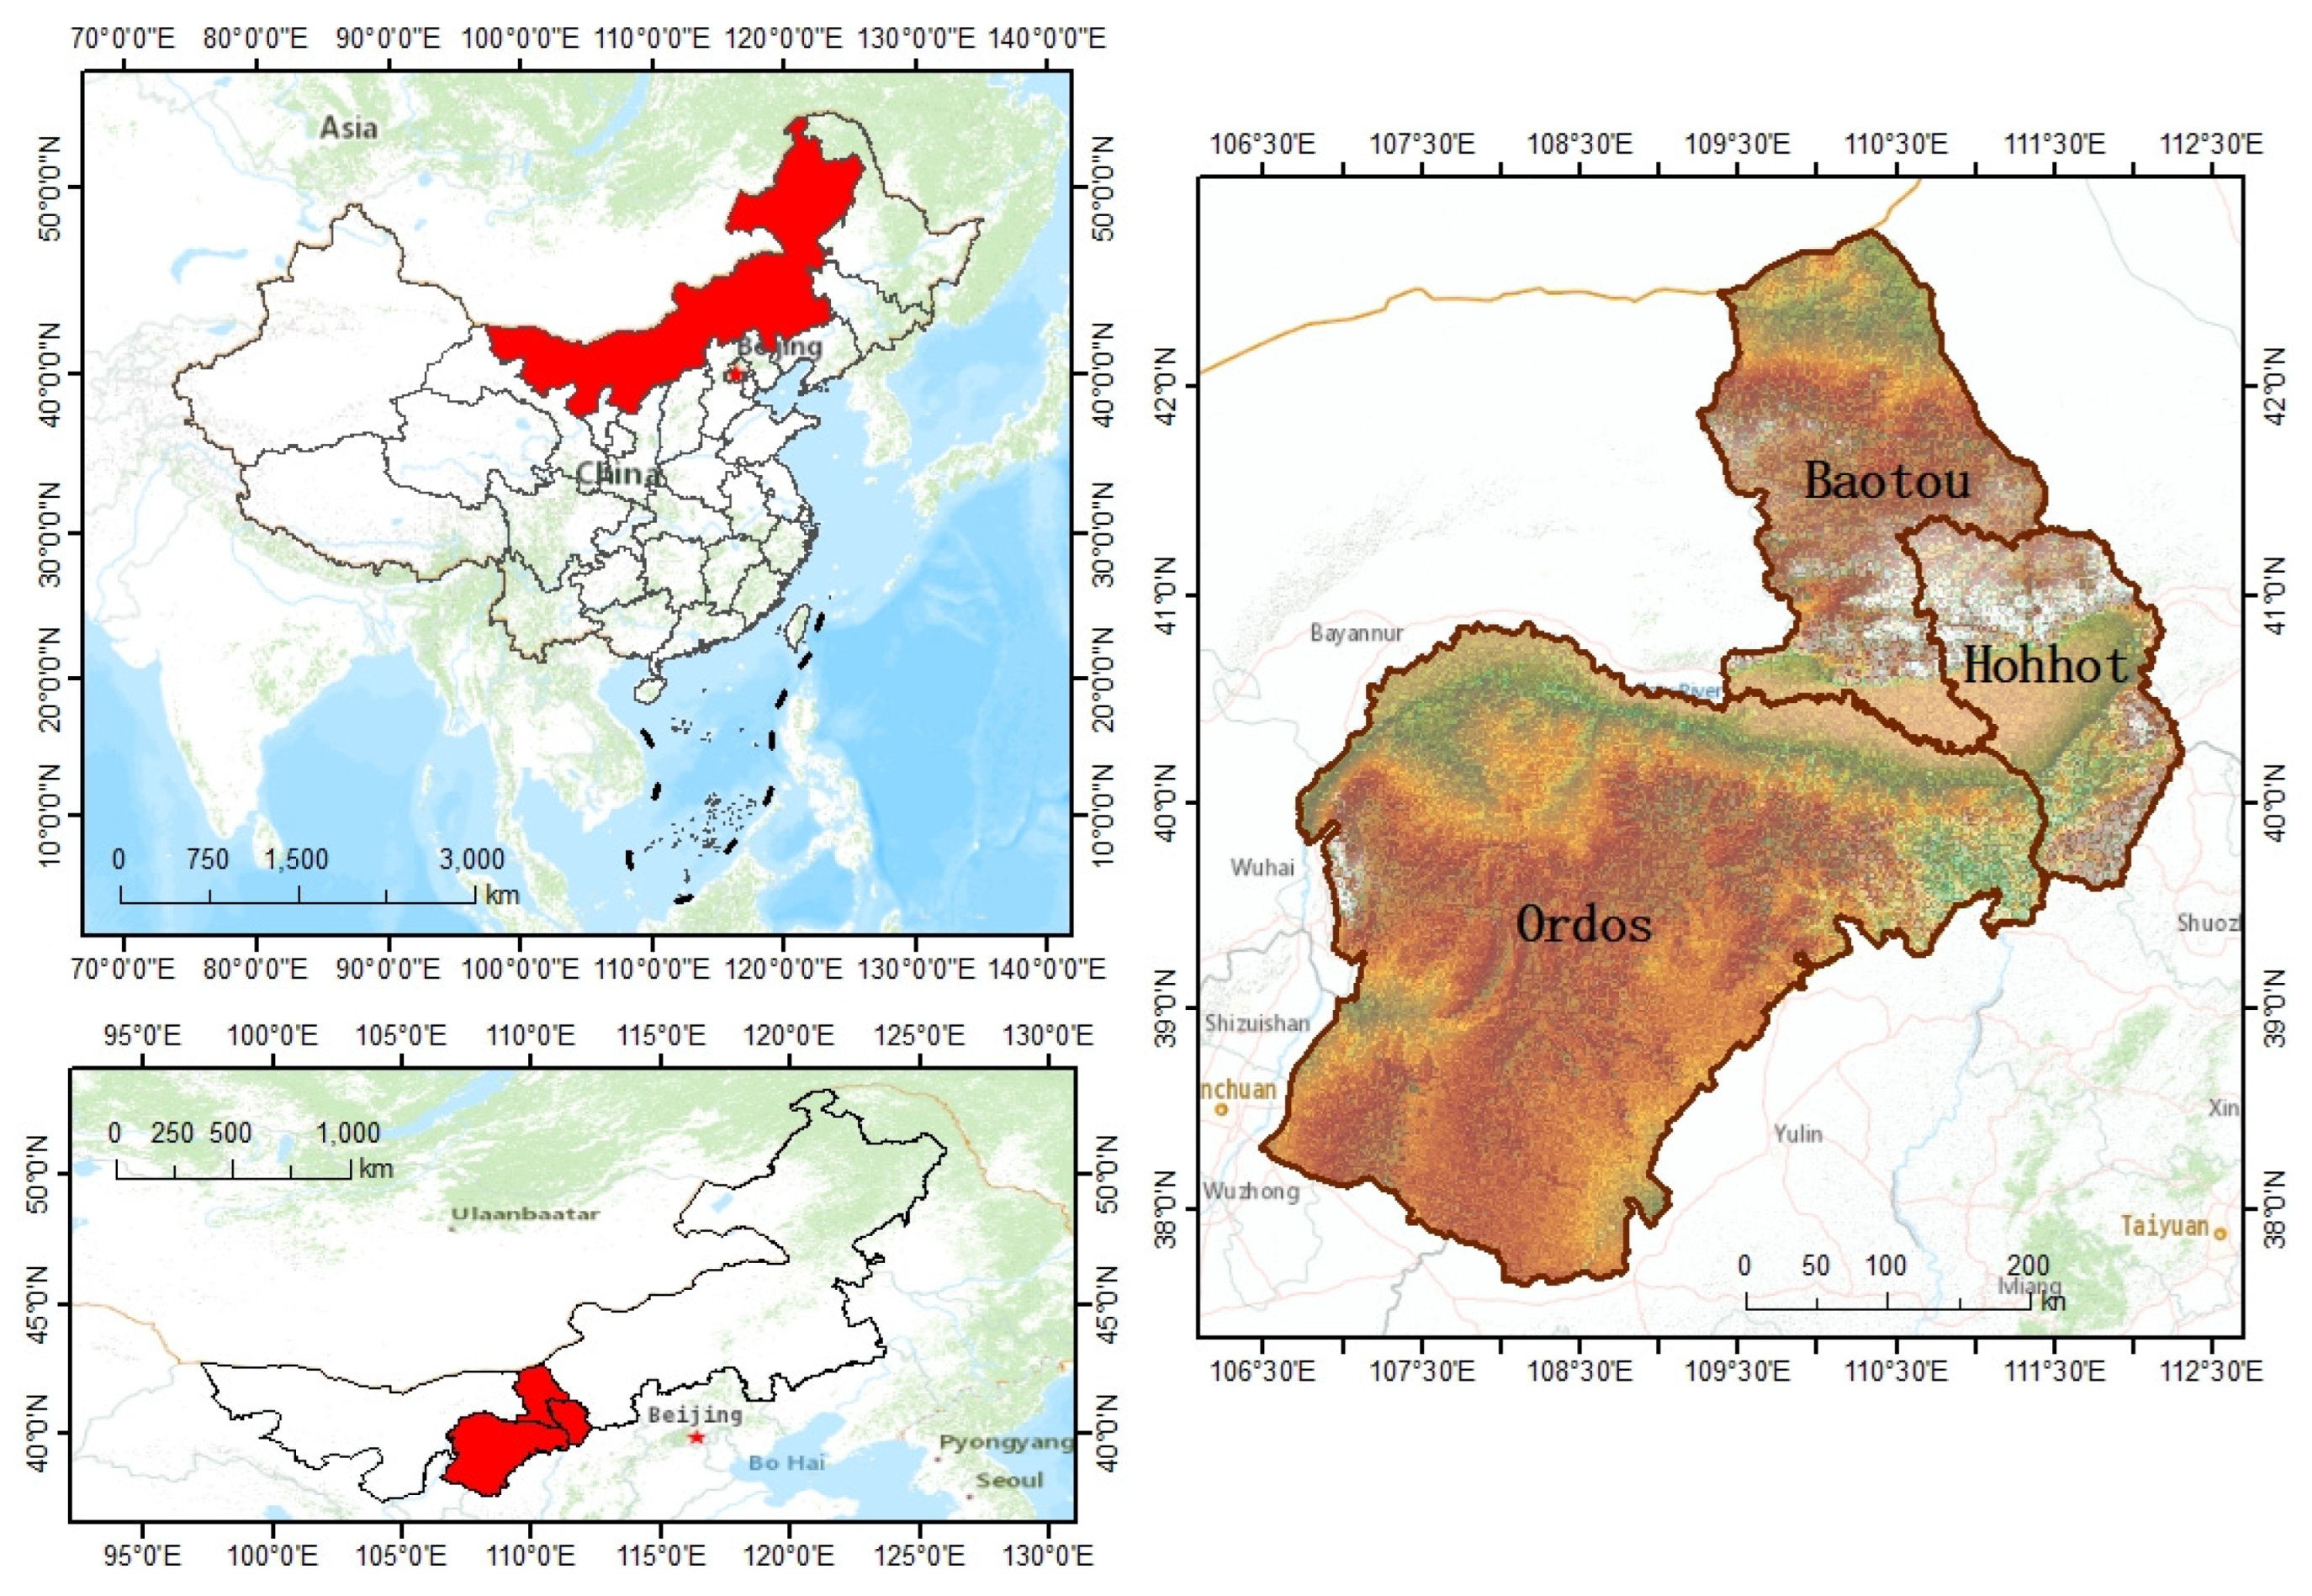
Scenario analysis is widely used in research on carbon emissions projections. This paper refers to relevant studies and sets the growth rate of all carbon emissions influencing factors as low carbon (L), planning (M), and natural (H) according to China’s carbon emissions policy. In order to reduce the subjectivity of artificially setting development scenarios, all three growth rates of all the factors are combined in a full ranking, and the different development scenarios of the three cities are simulated (729 scenarios of Hohhot, 243 scenarios of Baotou, and 59,049 scenarios of Ordos), and each city predicts the value of carbon emissions according to its different scenarios. Considering that HBO-UA are resource-based urban agglomeration with industrial clusters, setting the GI (the ratio of the industry sector output value over the total GDP) to always be M. The scenarios were then scored to quantify the cost of the control instruments. Finally, all scenarios were categorized into zero-measure, single-measure, and multiple-measure adjustments based on the amount of L in the scenario, and the optimal regulation was found based on the size of the peaks.

2.5. Study Area

As shown in Figure 1, Located in the middle and upper reaches of the Yellow River, the HBO-UA includes the cities of Hohhot, Baotou, and Ordos in the Inner Mongolia Autonomous Region of China, with close economic and trade ties among the three. In 2022, the HBO-UA’s GDP was CNY 1269.25 billion, with a growth rate of 5.1%, accounting for 54.81% of the region’s GDP [34]; the growth pole effect was remarkable. HBO-UA has a fragile ecological environment, the accumulation of environmental pollution is relatively deep, heavy industry and energy-based industries account for a large proportion of the urban agglomerations, carbon emissions in the region continue to increase, low-quality and low-efficiency problems are prominent, and high-quality development is insufficient [28]. In the Hubao Eyu Urban Agglomeration Development Plan released by the state in 2018, HBO-UA is defined as a national high-end energy and chemical base, and an ecological civilization cooperation and co-construction zone in the northwest region [35]. Meanwhile, the urban agglomeration is abundant with energy resources, which is one of the important bases for the development of the Yellow River Basin [28]. Therefore, how to balance the relationship between regional economic growth and carbon emissions and promoting the modernization of HBO-UA in harmony with human beings and nature are the key to build a high-quality urban agglomeration along the Yellow River.

2.6. Data Sources

HBO-UA carbon emissions data come from the China Carbon Accounting Database. Data for each indicator were obtained from the Statistical Yearbook at the municipal level, in which missing data were filled in using a linear function.
In 2000, the Leading Group for the Development of the Western Region of the State Council of China conducted in-depth research on accelerating the development of the western region, clarified the basic ideas and strategic tasks, and deployed key work for the large-scale development of the western region. In 2001, China officially became a member of the World Trade Organization, which was in the early stages of industrialization. Hohhot, Baotou, and Ordos fully seized the historical opportunity of expanding domestic demand and implementing the Western Development Strategy, actively promoting industrial development, resulting in a significant increase in carbon emissions. Therefore, this article conducts research in the study area from 2000 to 2022.

3. Analysis of Results

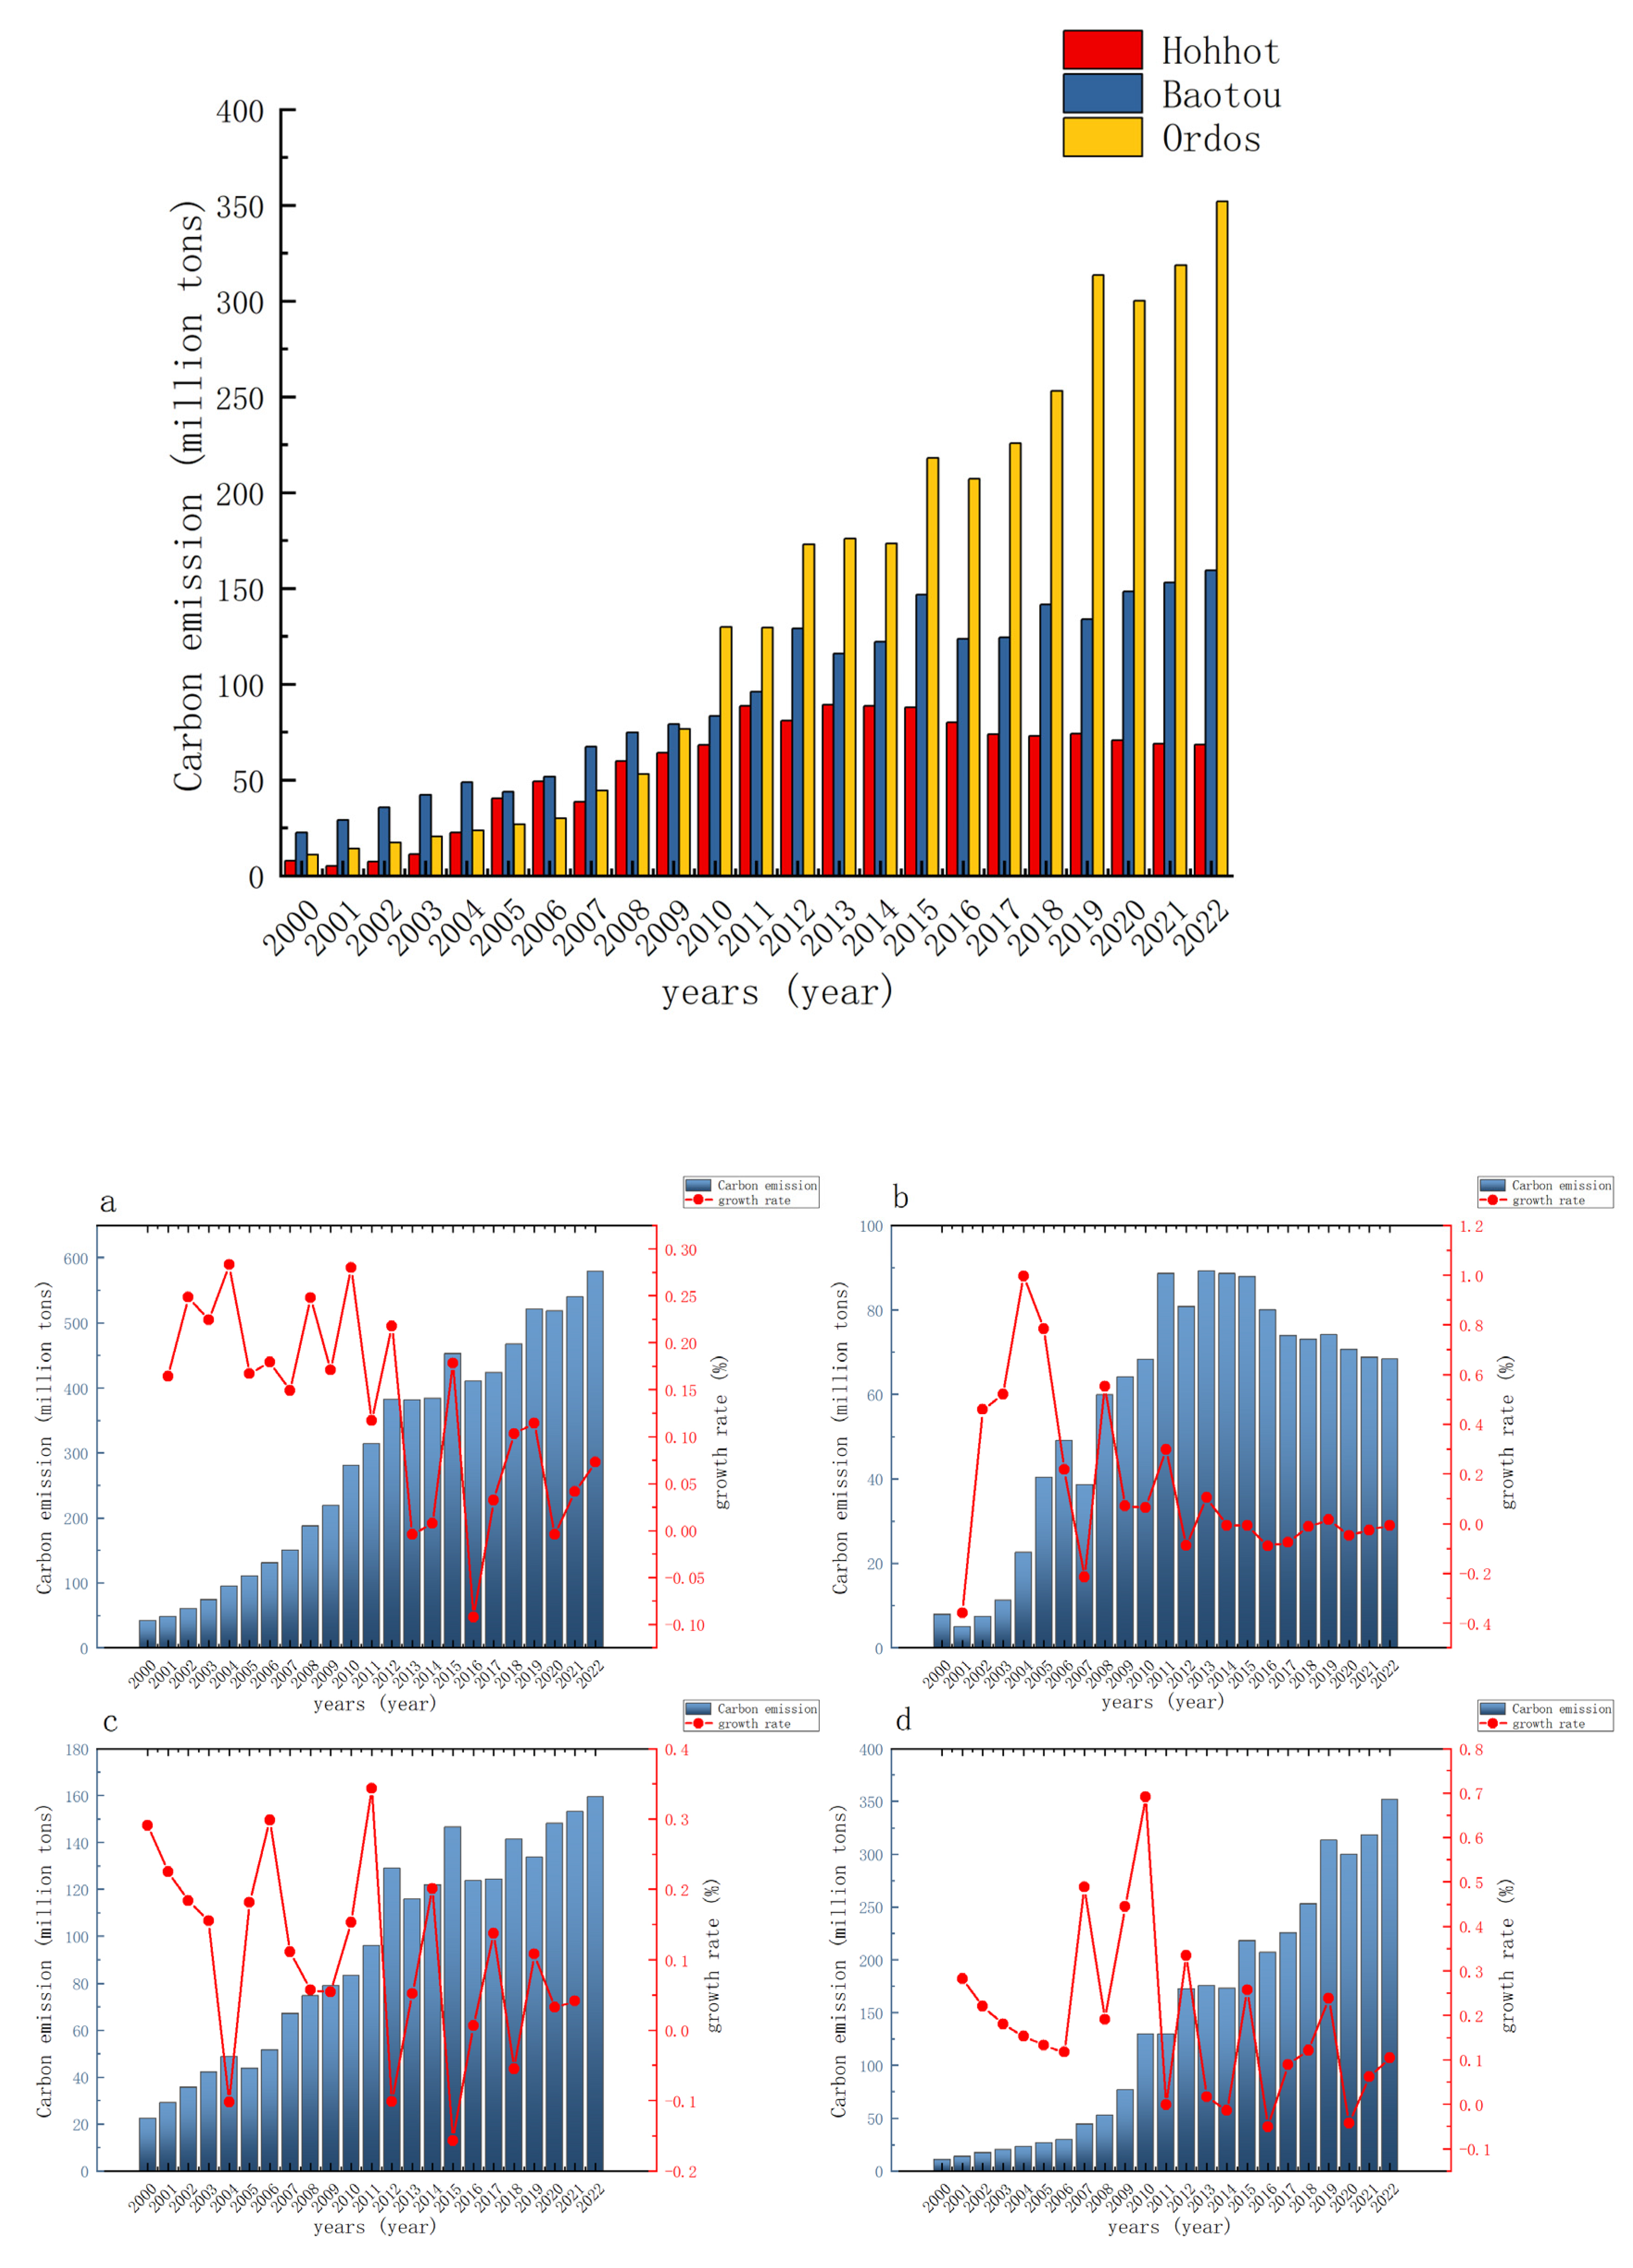
3.1. Analysis of Carbon Emissions

Using 2010 as the border, the structure of HBO-UA’s carbon emissions has changed significantly: before 2010, Baotou was the largest city in HBO-UA, and after 2010, Ordos’ carbon emissions sharply increased, making it the region’s greatest carbon source. As shown in Figure 2, in 2000, the carbon emissions of the three cities of the HBO-UA were, in descending order, Baotou (22.58 megatons), Ordos (11.13 megatons), and Hohhot (7.97 megatons). But from in 2010, Ordos surpassed Baotou to become the biggest source of carbon emissions in the HBO-UA, a significant shift in the three cities’ relative carbon emission rankings. As much as 352.05 megatons of carbon dioxide were predicted to be emitted from Ordos by 2022, roughly twice as much as Baotou (159.44 megatons) and five times more than Hohhot (68.41 megatons). The primary cause of this is the disparities in Hohhot, Baotou, and Ordos’ energy and mining resource endowments, which result in variations in their industrial structures and emission reduction strategies. For instance, Baotou proposed a special incentive management scheme for air pollution prevention and control in 2015 with an effort to lower the concentration of air pollutants emitted by businesses. This scheme aimed to encourage and elevate the technical level of air pollution prevention and control of businesses [36]. Such emission reduction programs have effectively stimulated the decrease of carbon emissions.
Hohhot is already setting the example for carbon peak trends, but Baotou and Ordos still have a long way to go before they can cut carbon emissions. As shown in Figure 2, the growth rate of carbon emissions in Hohhot has been decreasing year by year, and its trend is gradually stabilizing. Although the growth rates of Ordos and Baotou also show a general downward trend, their fluctuations are large. It was calculated that the average annual growth rate of carbon emissions in Ordos over the past two decades was about 18.26%, which was higher than that of Baotou (10.09%) and Hohhot (14.31%). Prior to 2010, Hohhot had the highest yearly growth rate in carbon emissions in the HBO-UA, with averages of 30.93%, 14.56%, and 29.01% for Hohhot, Baotou, and Ordos, respectively. But after 2010, Hohhot’s average annual growth rate fell precipitously to 0.46%, whereas Baotou and Ordos had average annual growth rates of 6.36% and 9%, respectively. There is tremendous pressure on Baotou and Ordos to cut carbon emissions going forward, and finding a low-carbon, green development strategy is critical. Hohhot has implemented a number of pertinent regulations to reduce carbon emissions during this time. The Hohhot Economic and Technological Development Zone Economic Development “Eleventh Five-Year Plan” was released in 2006 by the Hohhot Municipal People’s Government. Its objectives include refining and streamlining the industrial structure, striving to establish a contemporary manufacturing base, highlighting resource conservation and efficient use, and advancing the circular economy among other projects. The success of the current carbon emissions reduction in Hohhot has been firmly ensured by the proposal and execution of similar governance regulations [37].

3.2. Analysis of Carbon Emissions Drivers

3.2.1. Urban Agglomeration Level

The equation regression coefficients for each city were obtained by building regression equations, as shown in Table 2.
Population and urbanization are the dominant factors in carbon emissions from HBO-UA, and economic and industrial energy are important drivers of HBO-UA. Through the analysis, population, economy, technology, urbanization, and industrial energy have a promoting effect on the carbon emissions of HBO-UA with the magnitude of the effect as follows: Population > Urbanization > Industrial Energy > Economy > Technology. It has been shown that low-quality population size growth and increased urbanization will lead to ecological problems [38].
Real GDP per capita, which represents economic development, and electricity generation, which represents industrial energy, are both significant contributors to the increase in carbon emissions in the three cities. Both factors have a positive effect on the three cities, with little difference in effect magnitude, stabilizing above and below 0.15. The elasticity coefficients of real GDP per capita for Hohhot, Baotou, and Ordos are 0.132, 0.173, and 0.132, respectively. The elasticity coefficients of power generation to Hohhot, Baotou and Ordos are 0.14, 0.096, and 0.121, respectively. We are considering that this is due to the HBO-UA as the “Golden Triangle” area for the economic development of the Inner Mongolia Autonomous Region. The three cities have become the most dynamic economic belt in the Inner Mongolia Autonomous Region through rapid economic development and have close economic ties with each other. Electricity is one of the key industries in all three cities.
In resource-based cities, the same factor’s direction of action on carbon emissions may change depending on the degree of industrialization and urbanization. For example, the impact of industrial energy intensity on carbon emissions in Hohhot is a facilitating effect, while it is a suppressing effect on Ordos. The ratio of industrial sector output to total GDP has a dampening effect on Hohhot and Baotou and a promoting effect on Ordos. This is due to the fact that Hohhot and Baotou have actively introduced advanced technologies in the industrial sector and strictly enforced the relevant regulatory policies, which has resulted in lower energy consumption and increased economic benefits in the industrial sector. Baotou has always attached great importance to the development of rare earth-related industries. In 2014, Baotou City issued the Policy Support Measures for Baotou City Rare Earth New Material Producers, stating that in order to accelerate the promotion of the development of the rare earth industry, the government will subsidize the policy for rare earth new material producers [39]. The introduction of this policy effectively promotes the optimization and upgrading of the rare earth industry in Baotou and effectively reduces the impact of this industry on carbon emissions.
The strategic leadership of city agglomerations in the country’s building of new urbanization continues to rise [40]. The construction of new urbanization based on urban agglomerations with improved resource use efficiency and led by green development can effectively reduce carbon emissions. The elasticity coefficients of Hohhot, Baotou, and Ordos are 0.334, 1.27, and 0.392, respectively, which shows that the elasticity coefficients of Hohhot and Ordos are similar, but Baotou has a higher elasticity coefficient. Based on historical data, Baotou has the highest urbanization rate among the three cities. Baotou’s urbanization rate exceeded 80% in 2011. Yet Hohhot and Ordos still had urbanization rates of less than 80% in 2022. It can be seen that the urbanization level of Baotou is much faster than that of Hohhot and Ordos, and it is the city with the highest urbanization rate in the three regions, but it also brings about a high growth of carbon emissions, and it is urgent to seek for a green urbanization development model. At the same time, it has also been shown that before 2002, the urbanization process of the HBO-UA was dominated by the Baotou mono-core drive. After 2002, the city of Hohhot strengthened its functions and entered the phase of “Hubao” double-wheel drive. It is only since 2012 that urbanization in Ordos has gradually developed [41]. Therefore, the urbanization rate has a greater impact on carbon emissions in Baotou. Excessive urbanization can lead to the unfocused use of resources, resulting in wasted resources and thus higher carbon emissions. The Outline of the Fourteenth Five-Year Plan for the National Economic and Social Development of the People’s Republic of China and the Vision 2035 states, in the section on the construction of new types of urbanization, that it is necessary to change the way in which cities are developed, and to reasonably determine the size of cities in accordance with the carrying capacity of the resources and the environment [42]. Therefore, in the future, Baotou should establish a more efficient city agglomerations cooperation mechanism with Hohhot and Ordos to realize the comprehensive driving effect of the city agglomerations and accelerate the exploration of the development path of green, low-carbon, and high-quality new urbanization in resource-based urban agglomeration with industrial clusters in the Yellow River Basin.

3.2.2. Urban Level

As can be seen from Table 2 and Figure 3, there are significant differences in the extent to which different cities are affected by the various carbon emissions factors. Among them, Hohhot’s carbon emissions show a trend of multi-factor driving, Baotou is double-factor driving, and Ordos is obviously single-factor driving.
The drivers of carbon emissions in Hohhot are the economy, urbanization, industrial energy, and technology. The constantly optimized industrial structure contributes greatly to Hohhot’s carbon emissions reduction. The internal logic behind the sustained growth of Hohhot’s foreign trade lies in the optimization of its industrial structure. In recent years, Hohhot’s exports have been dominated by electromechanical products and high-tech products. By 2023, the total export value of these two types of products will reach CNY 4.16 billion, accounting for 21.4% of the city’s total export value. The urbanization rate is the most influential factor among the carbon emissions drivers, although the degree of influence is far less than that of Baotou, but in the future, it is still necessary to continuously improve the level of green development of urbanization and ultimately to build a new type of urbanization that is green, low-carbon, and high-quality. The ratio of industrial sector output to total GDP under the factor of industrial structure has a strong inhibitory effect on carbon emissions in Hohhot, which is considered to be related to the deep optimization of Hohhot’s industrial structure. Since the Thirteenth National Congress of the Communist Party of China, Hohhot has always been integral to the real economy, industry, and parks, going all out in the following industries, which make up “six major industrial clusters” [35]: processing of green agricultural and livestock products, manufacturing of new materials and modern equipment, biomedicine, electronic information technology, clean energy, and modern chemical industry. In 2022, the contribution of Hohhot’s primary, secondary, and tertiary industries to GDP growth were expected to be 7.1%, 31.0%, and 61.9%, respectively. In the above-scale industry, by sector, the added value of the mining industry declined by 67.8%, the manufacturing industry grew by 5.9%, and the electricity, heat, gas, and water production and supply industry declined by 3.0% [43]. The development of the industrialization process makes Hohhot’s urban function more diversified and pulls Hohhot’s industrial structure from the consumption side to optimize continuously. The continuous optimization of the internal structure of industry brings greater opportunities for decoupling economic growth and carbon reduction in Hohhot. In addition, the elasticity coefficient of total exports and imports is 0.25, although studies have shown that foreign investment and the introduction of advanced technology can reduce carbon emissions [44]; this is contrary to the situation in Hohhot, which may be due to the fact that most of the foreign-invested enterprises are industrial industries and high-energy-consuming industries, resulting in the total amount of imports and exports contributing to Hohhot’s carbon emissions. It is worth noting that the ratio of industry to GDP and industrial energy intensity have a dampening effect on carbon emissions, a result that is contrary to the results of other regional studies, and is considered to be due to the fact that the ratio of industry to GDP and industrial energy intensity have been decreasing since 2000.
The drivers of carbon emissions in Baotou are the population and the urbanization rate; in addition, industrial energy consumption also has a large impact on Baotou. The drivers of carbon emissions in Baotou are population, GDP per capita, industrial energy consumption, urbanization rate, and electricity generation. The ranking is population > urbanization rate > industrial energy consumption > GDP per capita > electricity generation. As can be seen from Figure 3, the elasticity coefficients of the factors influencing the carbon emissions in Baotou are widely disparate, among which the elasticity coefficients of the population and urbanization rate are 1.86 and 1.27, respectively, which are the main driving factors influencing the carbon emissions in Baotou. This is because an increase in the size of the population and the rate of urbanization can result in a mismatch between the quality of urbanization and eco-social development [38], it will also cause pressure on carbon reduction facilities. In addition, the total industrial energy consumption also has a large impact on the carbon emissions of Baotou, which is mainly related to the urban function and industrial structure of Baotou. Baotou is a comprehensive industrial city dominated by metallurgy, and rare earth and machinery industries. Although the proportion of its secondary industry has declined in recent years, it is still at a high level. As a result, industrial energy consumption also has a large impact on Baotou’s carbon emissions.
Ordos is the city most affected by the industrial structure among the three cities, and its internal structure of industry has more space for optimization compared with that of Hohhot. As can be seen from Figure 3, there is a large difference in the degree of contribution of each factor to Ordos’ carbon emissions. Changes in Ordos’ carbon emissions are mainly dominated by the industrial structure, and the main driving factor is the ratio of the industry sector output value over the total GDP, with a coefficient of 1.772. This is related to the industrial structure and urban function of Ordos. As an important energy base of the country, Ordos has rich mineral and natural gas resources, with proven coal reserves of 167.6 billion tons, accounting for one-sixth of the country, and proven natural gas reserves of 800 billion cubic meters, accounting for one-third of the country’s reserves. In 2022, the structure of the three industries in Ordos was 3.5:68.9:27.6, with the proportion of the second industry far exceeding the proportion of the first and the third industries, and the above-scale industry was divided by the three major categories, with the mining industry growing by 9.3% year-on-year, the manufacturing industry growing by 2.7% year-on-year, and the electric power, heat, gas, and water production and supply industry growing by 11.2% year-on-year. The shares of the three main categories are 80.3%, 13.3%, and 6.5%, respectively [45]. Compared with Hohhot, Ordos has a low level of industrial structure and a single industry structure, which has ultimately resulted in a high-emission economic growth model.

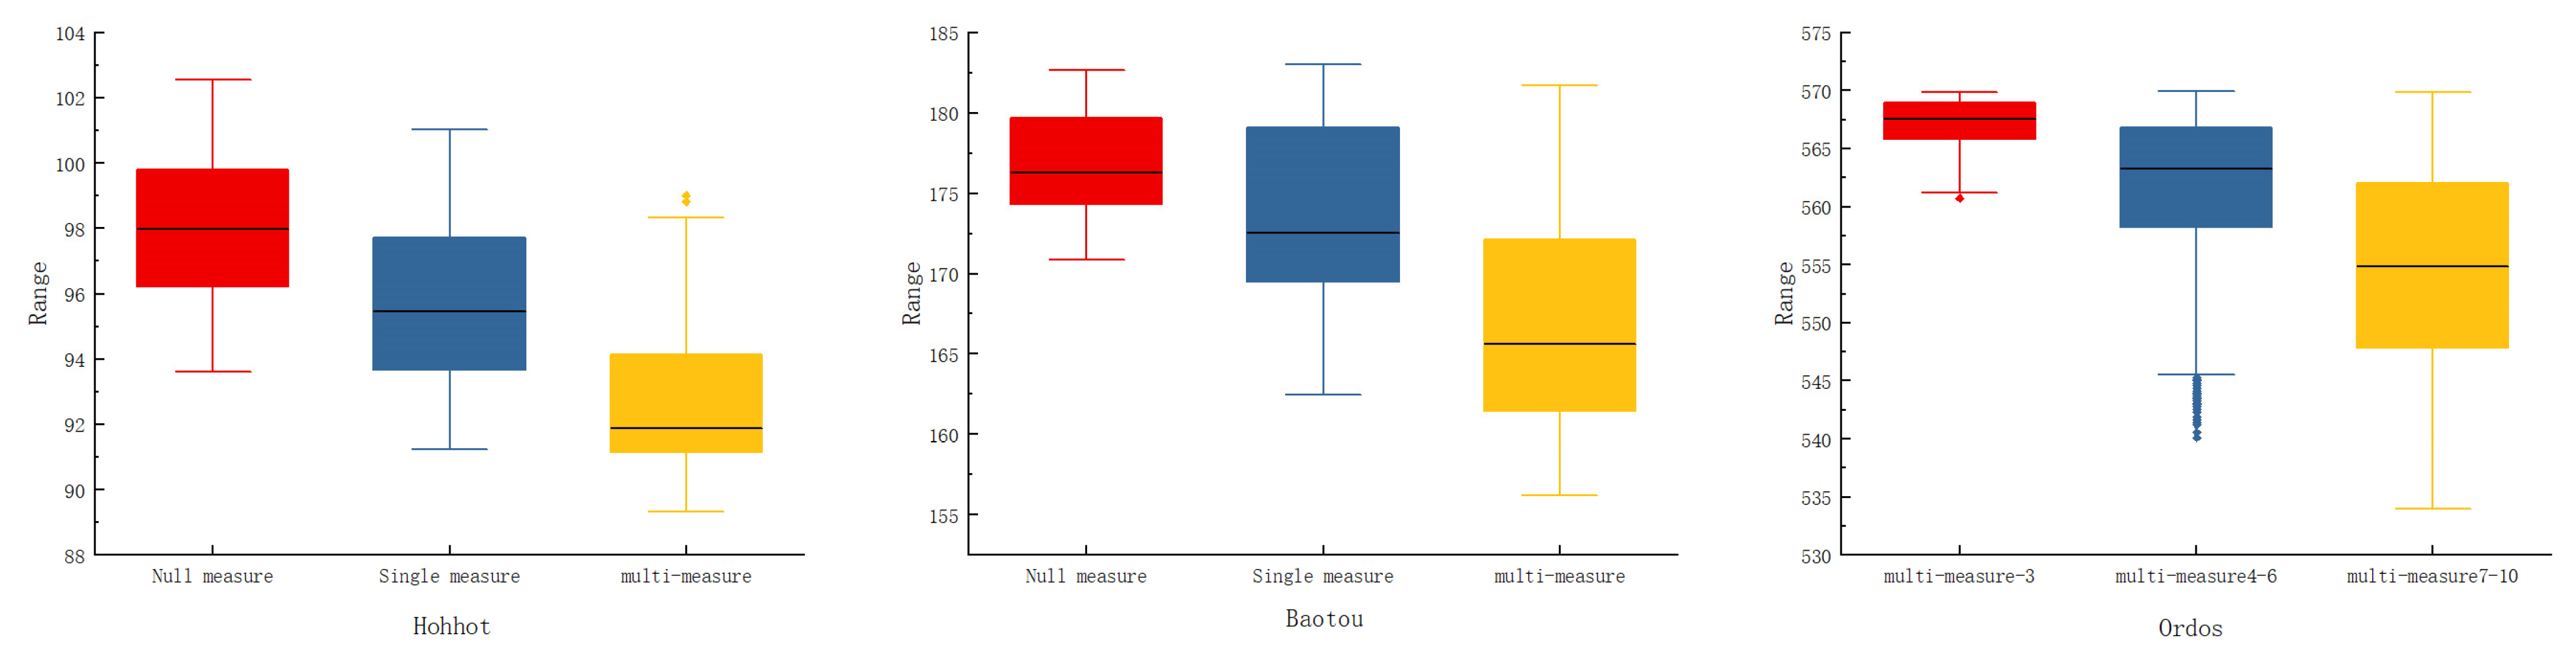
3.3. Analysis of Peak Carbon Scenario Modeling Projections

The regression equation was fitted according to the constructed STRIPAT model, and its error value is within reasonable limits, as shown in Table 3. Therefore, the constructed model was used to forecast future carbon emissions.

Simulation of Carbon Emissions Scenarios at the City Level

Hohhot’s carbon reduction efforts have been effective, and it is expected to achieve peak carbon at the earliest time. According to the forecast results, it is more reasonable to realize the carbon peak in 2025. Single-measure regulation is the most efficient; the foreign trade economy is the key area of peak regulation in Hohhot. Establishing green import and export channels, such as reducing the export of primary industrial products such as coal, changing the mode of import and export transportation, and using more clean energy, will effectively reduce carbon emissions. As shown in Figure 4, According to the results of the full permutation multi-scenario modeling, Hohhot’s carbon peak will occur in 2025 or 2030, and the carbon emissions at the peak in 2025 are significantly lower than in 2030. Based on the statistical results, all zero-measure-adjusted scenarios peak in 2030, with a peak range of 93.62–102.54 million tons. The single-measure adjustment scenarios include both the 2025 and 2030 peaking scenarios. The peak range in 2025 is 91.23–92.56 million tons and the peak range in 2030 is 92.11–101.02 million tons. The multi-measure adjustment scenarios also include both the 2025 and 2030 peaking scenarios. The peak range in 2025 is 89.33–92.47 million tons and the peak range in 2030 is 91.90–99.02 million tons. In summary, single-measure regulation is considered as the best scenario. In the medium-cost measure regulation, when the peak is low, L is concentrated on IE (total import and export), indicating that the adjustment of foreign trade policy is the most efficient means of carbon emissions peak regulation when single-measure regulation is in force.
The pressure to reduce carbon emissions in Baotou is high, and peaking in 2030 is more appropriate, with both single and multiple measures enabling Baotou to achieve a reasonable level of carbon peaking. Reducing industrial energy consumption and implementing energy-saving technologies such as high-efficiency motors, heat recovery technology, and intelligent control systems can significantly reduce energy demand [46]. Implementing clean production technology reduces waste and pollutant emissions through improved processes, material substitution, and resource recycling [47]. Ensuring high-quality urbanization development will be an important focus of future carbon reduction efforts. The results show that the peak carbon in Baotou will occur in 2025 or 2030. By analyzing the cost of control and the size of the peak, the peak in 2030 is more appropriate. The peak range for the 2025 peaking scenario is 156.22–157.18 million tons, and the peak range for the 2030 peaking scenario is 157.44–183.01 million tons. As shown in Figure 5, both single- and multi-measure regulation can keep peak attainment within a relatively reasonable range. The peak range is 170.87–182.63 million tons under zero measures, 162.44–183.01 million tons under single measures, and 156.22–181.68 million tons under multiple measures. It is worth noting that the peak range is even lower at 162.44–170.94 million tons when urbanization is L under single-measure regulation. Therefore, promoting high-quality urbanization and building new urbanization can contribute more efficiently to achieving carbon peak in Baotou. Under multiple measures of regulation, the peak is at a low level when both LE (industrial energy consumption) and UR (urbanization level) are L, with a range of 156.22–165.44 million tons. Therefore, strengthening the scientific and technological support for green and low-carbon transformation of energy and accelerating the green and low-carbon development of urbanization will be an effective path for carbon emissions reduction in the future. In addition, the reason for the late onset of carbon peaking is related to the high intensity of industrial energy consumption. By looking at historical data, it can be seen that in 2022, Baotou’s industrial energy consumption is five times that of Hohhot. Therefore, the government should reasonably control the consumption of industrial energy, optimize the structure of energy consumption, encourage the use of new and clean energy sources, and change the pattern of industrial energy consumption, which is dominated by the consumption of traditional energy sources such as coal.
Ordos’ carbon peak time is 2030, which is the highest carbon emissions peak among the three cities and the city has the greatest pressure to reduce carbon emissions, which can only be achieved with a number of measures. It is recommended to promote the circular economy by reusing and recycling resources and reducing the demand for raw materials and waste generation. This not only reduces energy consumption in the production process, but also reduces related carbon emissions [48]. Strengthening policies and management measures and providing tax incentives, subsidies, and technical support to promote green transformation and reduce carbon emissions are crucial. The establishment of policy frameworks can provide clear sustainable development goals for enterprises. As shown in Figure 5, Ordos’ carbon peaks only in 2030, with a higher overall peak and a peak range of 534.01–569.87 million tons. Since Ordos can only achieve peak carbon with multiple measures, the multiple scenarios of Ordos are categorized into three types according to the number of “L”: multi-measure-3, multi-measure-4–6, and multi-measure-7–10. The multi-measure-3 peak range is 560.74–569.90 million tons. The multi-measure-4–6 peak range is 540.10–569.94 million tons. The multi-measure-7–10 peak range is 534.01–569.87 million tons. Taking peaks and costs into account, this paper concludes that the multi-measure-4–6 scenario is more efficient in promoting Ordnance Carbon peaking, and the others are ruled out due to peaks or control costs that are too high. Carbon emissions are minimized when LE (industrial energy consumption), LI (industrial energy intensity), UR (urbanization rate), and GC (major industrial products—electricity generation) together are “L”. It can be seen that the main areas of work for carbon emissions reduction in Ordos should focus on three aspects: technology, industrial energy, and urbanization. Ordos has a high peak of carbon emissions, three times that of Baotou. This is mainly determined by the industrial structure of Ordos, which has the highest proportion of secondary production among the three regions and still shows an increasing trend. In addition to this, Ordos’ industrial energy consumption and two industrial products, electricity generation and coal production, are also much larger than the other two cities. Massive energy consumption accelerates carbon emissions. Therefore, Ordos should accelerate the change in industrial structure, reduce the total energy consumption, optimize the energy consumption structure, and improve the efficiency of energy consumption.

4. Discussion

4.1. Comparison with Previous Studies

This paper adopts the extended STRIPAT model combined with ridge regression to establish a prediction equation and adopts the principle of “one formula for one city” to analyze the three cities separately. However, the direction of the driving factors is slightly different from the existing research. In the existing studies, the ratio of the industry sector output value over the total GDP mostly contributes to carbon emissions [49]. However, in the study of Hohhot on the inhibitory effect, this paper argues that this is due to the continuous improvement of the function of the regional central city of Hohhot; the industrial structure continues to be optimized [50], contributing to achieving low-carbon green development. In addition, urban peak carbon modeling studies mostly assume that peak carbon is achievable before 2030. However, the study of Baotou and Ordos in this paper shows that it is more difficult to achieve the carbon peak before 2030. Ordos will not even be able to achieve peak carbon until after 2035. Therefore, city agglomerations’ coordinated allocation of production factors and promotion of overall industrial structure optimization are an important way for traditional industrial resource cities such as Ordos to achieve the “dual-carbon” goals. Carbon emissions can be effectively reduced by adjusting the industrial structure, especially the ratio of the industry sector output value over the total GDP [51], The research in this paper corroborates these points, but adjusting the share of industrial value added in industrial-dependent cities comes at a high economic cost. Therefore, this paper simulates carbon peaking in resource-based industrial city agglomerations by adjusting for other drivers. In addition, the research and development of a single measure to adjust a carbon emissions system is unlikely support the re-optimization of the carbon emissions system; multi-policy, integrated adjustment is more effective for achieving a region’s carbon peak [52]. This is especially true for traditional industrial resource-based cities similar to Ordos with high carbon emissions.

4.2. Research Limitations

This paper uses the STRIPAT model, which suffers from the problem of multicollinearity in the selection of indicators. This paper combines Ridge Regression to reduce the multicollinearity of the model, but Ridge Regression reduces the covariance by losing some amount of information, which may reduce the interpretability of the model. The carbon emissions process of human activities is a giant complex system, and nonlinear factors are also the most important components affecting carbon emissions. Therefore, future research will further introduce nonlinear regression models, such as using machine learning algorithms to explain the nonlinear information in carbon emissions projections [53] and integration of multiple models to predict carbon emissions more accurately. Research on how to improve the adaptability and resilience of socio-economic systems to the impacts of climate change is key, including analyzing how to optimize resource allocation in different scenarios to achieve low-carbon development goals.
City agglomerations as a unified whole, due to the different nature of cities and their leading industries, as well as the size and direction of the flow of system elements such as the flow of people, logistics, information, value, and energy between cities, will have different impacts on carbon emissions. Future research will further explore the process of inter-city factor mobility and the mechanism of its impact on carbon emissions, in order to explore carbon emissions reduction options for urban agglomerations as a whole.

4.3. Countermeasures and Recommendations

By forecasting peak carbon attainment for HBO-UA, this paper finds that HBO-UA is under pressure to achieve peak carbon attainment before 2030, and that the timing of peak carbon attainment is highly polarized among HBO-UA. This is mainly determined by the different city orientations and leading industries. Accordingly, the following points are proposed.
Hohhot’s key areas of work related to carbon emissions reduction can be focused on the development of foreign trade. Firstly, the city should promote green trade cooperation in the China Mongolia Russia Economic Corridor, participate in domestic and international dual circulation, and introduce advanced technologies and green and recyclable management models, such as renewable energy sources including solar energy, wind energy, and bioenergy to replace traditional fossil fuels, which can effectively reduce carbon emissions. It should guide industrial enterprises to invest in renewable energy projects to achieve more sustainable production methods [54]. Secondly, in international trade, building green trade barriers to maximize the protection of natural resources, ecological environment, and human health in the country is important. In addition, by optimizing transportation methods and improving energy efficiency, companies can reduce carbon emissions while lowering transportation costs. In addition, implementing green supply chain management can systematically reduce the carbon footprint of each link in the supply chain, which not only helps with environmental protection but also enhances the competitiveness of enterprises [55].
Baotou can support carbon emissions reduction by promoting the green transformation of industrial energy consumption and accelerating new urbanization-related construction, and developing advanced chemical materials based on the existing coal chemical industry. The city should develop their modern coal and chemical industry in a steady and orderly manner, and promote the efficient and clean utilization of coal by quality assessments and grading [56]. They should encourage enterprises to establish a comprehensive standard system focusing on environmental protection, energy consumption, quality, safety, and technology. Regulators should eliminate backward production capacities in strict accordance with relevant laws and regulations. By adopting digital technologies such as the Internet of Things, big data analysis, and artificial intelligence, the production process can be monitored and optimized in real time, improving resource utilization efficiency and reducing waste [57]. Providing training on energy management and environmental protection knowledge to employees to enhance their awareness of the importance of energy conservation and emissions reduction can help to form an energy-saving culture within the company. The active participation of employees can effectively promote the implementation of energy-saving and emission reduction measures [58]. Implementing green urbanization development, optimizing industrial distribution, and constructing a scientific and reasonable scale of urbanization in accordance with the ecological red line that is defined by what is compatible with the carrying capacity of resources and the environment are all important.
Ordos is under great pressure to reduce carbon emissions and needs to combine several measures to implement a strict carbon reduction policy. In the future, the main direction of work should be to promote major breakthroughs in green and low-carbon technologies; promote the optimization of the industrial structure [51]; resolutely curb the blind development of high-energy-consuming, high-emission, and low-level projects; increase the supply of green and low-carbon products in the field of urban and rural construction; and promote the green development of urbanization [56]. CCS technology can capture carbon dioxide emissions from industrial processes and store them underground or utilize them in other industrial processes. This technology can significantly reduce industrial emissions and is an important means to achieve carbon neutrality goals [59]. At the same time, it promotes low-carbon synergistic development of industries, strengthens the interconnection of supply and demand within the industrial chain, and carries out synergistic carbon-reducing actions.

5. Conclusions

Conducting research on carbon emissions in resource-based urban agglomerations with industrial clusters is of great significance for achieving carbon emissions reduction targets at the provincial and national levels. This paper follows the research principle of “one city, one formula” to construct different analytical prediction equations for three cities. In the scenario simulation, industry is controlled to grow steadily, and other elements are combined in full rows at three rates of change, high, medium, and low, to form a variety of carbon emission scenarios. Finally, based on the different carbon emission scenarios, we explore the optimal carbon peak paths for cities with different industrial processes and resource endowments within the city agglomerations and their interiors.
This study finds that Hohhot will be the first in HBO-UA to achieve peak carbon. Taking 2010 as the cut-off year, the distribution of carbon emissions from the HBO-UA has changed dramatically. Ordos has replaced Hohhot as the largest source of carbon for the HBO-UA.
As HBO-UA is characterized by industrial clusters, economic growth and energy consumption become the core drivers of carbon emissions in HBO-UA. The HBO-UA cities that have different industrialization and urbanization processes have significant differences in terms of the driving mechanisms of carbon emissions under different resource endowments and factor configurations. The drivers of carbon emissions in Hohhot are the economy, urbanization, industrial energy, and technology. The main drivers of carbon emissions in Baotou are population, urbanization, and industrial energy consumption. The driver of carbon emissions in Erdos is a single industrial structure.
By conducting multi-factor, full-permutation scenario simulations and considering the peak carbon value, as well as the costs of policy optimization and regulation, Hohhot can achieve peak carbon emissions by 2025. This can be accomplished through optimizing the foreign trade structure and promoting green transformation within the industrial sector. Baotou can promote carbon peaking by 2030 through the green transformation of industrial energy and high-quality urbanization. Ordos is under great pressure to reduce carbon emissions. In order to minimize the region’s overall costs and eventually reach the carbon peak steadily, it must develop a strict carbon peak program, optimize the regulation of various measures, encourage the exchange of factors with Hohhot and Baotou, investigate the possibility of a carbon trading mechanism within the urban agglomeration, optimize the industrial structure through the coordinated development of the urban agglomeration, and insist on regional coordination.

Supplementary Materials

The following supporting information can be downloaded at: https://www.mdpi.com/article/10.3390/en17225521/s1, File S1: Regression process.

Author Contributions

W.Y.: Writing—Original draft preparation, Writing—Reviewing and Editing, Visualization, Data curation, B.X.: Methodology, Funding acquisition, Writing—Reviewing and Editing, Y.L.: Project administration, Funding acquisition, Formal analysis, X.Q.: Project administration, Data curation, Writing—Reviewing and Editing, J.Z.: Data curation, Writing—Original draft preparation. All authors have read and agreed to the published version of the manuscript.

Funding

This research was supported by National Earth System Science Data Center Program of Operation and Service of the Earth System Science Data Sharing Platform (Y11J0200), Ministry of Science and Technology of the People’s Republic of China, the third Comprehensive Scientific Expedition Project in Xinjiang (2022xjkk0905); the Science & Technology Fundamental Resources Investigation Program of China (2022FY101904); the National Natural Science Foundation of China (NSFC-MFST 32161143029); the National Natural Science Foundation of China (42201321).

Data Availability Statement

The original contributions presented in the study are included in the article, further inquiries can be directed to the corresponding author.

Conflicts of Interest

The authors declare no conflict of interest.

References

  1. Liu, L.; Lei, Y.; Zhang, W.; Fu, J. Resilient development of resource-based cities under the dual carbon goals. Geol. Bull. China 2024, 43, 1361–1372. [Google Scholar]
  2. Zheng, F.; Niu, Y. Environmental Decentralization, Resource Endowment and Urban Industrial Transformation and Upgrading: A Comparison of Resource-Based and Non-Resource-Based Cities in China. Sustainability 2023, 15, 475. [Google Scholar] [CrossRef]
  3. Li, Y.; Zhang, L.Y.; Wu, B.; Li, L.L.; Zhang, Y.L. Spatial response relationship between mining and industrial activities and eco-environmental risks in mineral resource-based areas. Environ. Sci. Pollut. Res. 2023, 30, 84765–84777. [Google Scholar] [CrossRef]
  4. Zeng, S.; Su, B.; Zhang, M.L.; Gao, Y.; Liu, J.; Luo, S.; Tao, Q.M. Analysis and forecast of China’s energy consumption structure. Energy Policy 2021, 159, 112630. [Google Scholar] [CrossRef]
  5. Shan, Y.; Liu, J.; Liu, Z.; Shao, S. An emissions-socioeconomic inventory of Chinese cities. Sci. Data 2019, 6, 190027. [Google Scholar] [CrossRef]
  6. Qiu, S.L.; Wang, Z.L.; Liu, S. The policy outcomes of low-carbon city construction on urban green development: Evidence from a quasi-natural experiment conducted in China. Sustain. Cities Soc. 2021, 66, 102699. [Google Scholar] [CrossRef]
  7. Qian, Y.; Wang, H.; Wu, J.S. Spatiotemporal association of carbon dioxide emissions in China’s urban agglomerations. J. Environ. Manag. 2022, 323, 116109. [Google Scholar] [CrossRef]
  8. Ma, X.J.; Wang, C.X.; Dong, B.Y.; Gu, G.C.; Chen, R.M.; Li, Y.F.; Zou, H.F.; Zhang, W.F.; Li, Q.N. Carbon emissions from energy consumption in China: Its measurement and driving factors. Sci. Total Environ. 2019, 648, 1411–1420. [Google Scholar] [CrossRef]
  9. Tian, S.; Xu, Y.; Wang, Q.S.; Zhang, Y.J.; Yuan, X.L.; Ma, Q.; Chen, L.P.; Ma, H.C.; Liu, J.X.; Liu, C.Q. Research on peak prediction of urban differentiated carbon emissions—A case study of Shandong Province, China. J. Clean. Prod. 2022, 374, 134050. [Google Scholar] [CrossRef]
  10. Zhang, Z.W.; Wang, G.K.; Guo, X.J. Long-Term and Short-Term Effects of Carbon Emissions on Regional Healthy Development in Shanxi Province, China. Sustainability 2022, 14, 5173. [Google Scholar] [CrossRef]
  11. Cheng, J.; Huang, C.B.; Gan, X.T.; Peng, C.H.; Deng, L. Can forest carbon sequestration offset industrial CO2 emissions? A case study of Hubei Province, China. J. Clean. Prod. 2023, 426, 139147. [Google Scholar] [CrossRef]
  12. Xu, Q.; Dong, Y.X.; Yang, R. Urbanization impact on carbon emissions in the Pearl River Delta region: Kuznets curve relationships. J. Clean. Prod. 2018, 180, 514–523. [Google Scholar] [CrossRef]
  13. Yang, L.; Xia, H.; Zhang, X.; Yuan, S. What matters for carbon emissions in regional sectors? A China study of extended STIRPAT model. J. Clean. Prod. 2018, 180, 595–602. [Google Scholar] [CrossRef]
  14. Zhao, L.T.; Zhao, T.; Yuan, R. Scenario simulations for the peak of provincial household CO2 emissions in China based on the STIRPAT model. Sci. Total Environ. 2022, 809, 151098. [Google Scholar] [CrossRef] [PubMed]
  15. Wang, Z.H.; Huang, W.J.; Chen, Z.F. The peak of CO2 emissions in China: A new approach using survival models. Energy Econ. 2019, 81, 1099–1108. [Google Scholar] [CrossRef]
  16. Edomah, N. Governing sustainable industrial energy use: Energy transitions in Nigeria’s manufacturing sector. J. Clean. Prod. 2019, 210, 620–629. [Google Scholar] [CrossRef]
  17. Zhang, C.Q.; Luo, H.X. Research on carbon emission peak prediction and path of China’s public buildings: Scenario analysis based on LEAP model. Energy Build. 2023, 289, 113053. [Google Scholar] [CrossRef]
  18. Huo, T.F.; Xu, L.B.; Liu, B.S.; Cai, W.G.; Feng, W. China’s commercial building carbon emissions toward 2060: An integrated dynamic emission assessment model. Appl. Energy 2022, 325, 119828. [Google Scholar] [CrossRef]
  19. Liu, D.N.; Xiao, B.W. Can China achieve its carbon emission peaking? A scenario analysis based on STIRPAT and system dynamics model. Ecol. Indic. 2018, 93, 647–657. [Google Scholar] [CrossRef]
  20. Yang, P.G.; Liang, X.; Drohan, P.J. Using Kaya and LMDI models to analyze carbon emissions from the energy consumption in China. Environ. Sci. Pollut. Res. 2020, 27, 26495–26501. [Google Scholar] [CrossRef]
  21. Sun, W.; Huang, C.C. Predictions of carbon emission intensity based on factor analysis and an improved extreme learning machine from the perspective of carbon emission efficiency. J. Clean. Prod. 2022, 338, 130414. [Google Scholar] [CrossRef]
  22. Ehrlich, P.R.; Holdren, J.P. Impact of Population Growth: Complacency concerning this component of man’s predicament is unjustified and counterproductive. Science 1971, 171, 1212–1217. [Google Scholar] [CrossRef] [PubMed]
  23. Du, L.L.; Li, X.Z.; Zhao, H.J.; Ma, W.C.; Jiang, P. System dynamic modeling of urban carbon emissions based on the regional National Economy and Social Development Plan: A case study of Shanghai city. J. Clean. Prod. 2018, 172, 1501–1513. [Google Scholar] [CrossRef]
  24. Chang, K.L.; Du, Z.F.; Chen, G.J.; Zhang, Y.X.; Sui, L.L. Panel estimation for the impact factors on carbon dioxide emissions: A new regional classification perspective in China. J. Clean. Prod. 2021, 279, 123637. [Google Scholar] [CrossRef]
  25. Xiao, B.W.; Niu, D.X.; Wu, H. Exploring the impact of determining factors behind CO2 emissions in China: A CGE appraisal. Sci. Total Environ. 2017, 581, 559–572. [Google Scholar] [CrossRef]
  26. Zhou, W.H.; Zeng, B.; Wang, J.Z.; Luo, X.S.; Liu, X.Z. Forecasting Chinese carbon emissions using a novel grey rolling prediction model. Chaos Solitons Fractals 2021, 147, 110968. [Google Scholar] [CrossRef]
  27. Shahbaz, M.; Chaudhary, A.R.; Ozturk, I. Does urbanization cause increasing energy demand in Pakistan? Empirical evidence from STIRPAT model. Energy 2017, 122, 83–93. [Google Scholar] [CrossRef]
  28. General Office of the State Council of the People’s Republic of China. Outline for Ecological Protection and Quality Development of the Yellow River Basin; General Office of the State Council of the People’s Republic of China: Beijing, China, 8 October 2021.
  29. Liu, Z.; Wang, F.; Tang, Z.Y.; Tang, J.T. Predictions and driving factors of production-based CO2 emissions in Beijing, China. Sustain. Cities Soc. 2020, 53, 101909. [Google Scholar] [CrossRef]
  30. Liu, X.; Meng, X.; Wang, X. Carbon Emissions Prediction of Jiangsu Province Based on Lasso-BP Neural Network Combined Model. IOP Conf. Ser. Earth Environ. Sci. 2021, 769, 022017. [Google Scholar] [CrossRef]
  31. Wu, C.B.; Huang, G.H.; Xin, B.G.; Chen, J.K. Scenario analysis of carbon emissions’ anti-driving effect on Qingdao’s energy structure adjustment with an optimization model, Part I: Carbon emissions peak value prediction. J. Clean. Prod. 2018, 172, 466–474. [Google Scholar] [CrossRef]
  32. Tibshirani, R. Regression shrinkage and selection via the Lasso. J. R. Stat. Soc. Ser. B Stat. Methodol. 1996, 58, 267–288. [Google Scholar] [CrossRef]
  33. Wang, P.; Wu, W.S.; Zhu, B.Z.; Wei, Y.M. Examining the impact factors of energy-related CO2 emissions using the STIRPAT model in Guangdong Province, China. Appl. Energy 2013, 106, 65–71. [Google Scholar] [CrossRef]
  34. Inner Mongolia Autonomous Region Development and Reform Commission. Indicator of Urbanization Rate of Resident Population in Inner Mongolia Autonomous Region Steadily Increasing in 2022; Inner Mongolia Autonomous Region Development and Reform Commission: Hohhot, China, 8 March 2023.
  35. National Development and Reform Commission of China. Circular of the National Development and Reform Commission of China on the Issuance of the Development Plan for the Hubao-Eyu City Cluster; National Development and Reform Commission of China: Beijing, China, 7 March 2018.
  36. The People’s Government of Baotou Municipality. Baotou City Air Pollution Prevention and Control Special Reward Management Measures (Trial); The People’s Government of Baotou Municipality: Baotou, China, 11 May 2015.
  37. Hohhot Party and Government Office. Hohhot Economic and Technological Development Zone Economic 11th Five-Year Plan; Hohhot Party and Government Office: Hohhot, China, 8 June 2006.
  38. Sun, D.Q.; Zhou, L.; Li, Y.; Liu, H.M.; Shen, X.Y.; Wang, Z.D.; Wang, X.X. New-type urbanization in China: Predicted trends and investment demand for 2015–2030. J. Geogr. Sci. 2017, 27, 943–966. [Google Scholar] [CrossRef]
  39. The People’s Goverment of Baotou Municipality. General Office of The People’s Goverment of Baotou Municipality on the Issuance of New Rare Earth Materials Production Enterprises to Support Policy Measures Notice; The People’s Government of Baotou Municipality: Baotou, China, 24 November 2014.
  40. Fang, C. China’s Urban Agglomeration and Metropolitan Area Construction Under the New Development Pattern. Econ. Geogr. 2021, 41, 1–7. [Google Scholar]
  41. Luo, P.; Cao, X.; Ji, Y. Urban Economic Linkage, Spatial Network and Regional Economic Gap: Based on Empirical Evidence Analysis of Five Provinces in Northwest China. Areal Res. Dev. 2021, 40, 43–49. [Google Scholar]
  42. The People’s Government of China. Outline of the 14th Five-Year Plan for National Economic and Social Development of the People’s Republic of China and the Vision 2035; The People’s Government of China: Beijing, China, 13 March 2021.
  43. Statistics Bureau of Inner Mongolia Autonomous Region. Hohhot City 2022 National Economic and Social Development Statistical Bulletin; Statistics Bureau of Inner Mongolia Autonomous Region: Hohhot, China, 27 March 2023.
  44. Yu, X.; Wu, Z.; Zheng, H.; Li, M.; Tan, T. How urban agglomeration improve the emission efficiency? A spatial econometric analysis of the Yangtze River Delta urban agglomeration in China. J. Environ. Manag. 2020, 260, 110061. [Google Scholar] [CrossRef]
  45. The People’s Government of Ordos Municipality. Statistical Bulletin of National Economic and Social Development of Ordos City 2022; The People’s Government of Ordos Municipality: Ordos, China, 4 August 2023.
  46. Cobut, A.; Blanchet, P.; Beauregard, R. The environmental footprint of interior wood doors in non-residential buildings—Part 1: Life cycle assessment. J. Clean. Prod. 2015, 109, 232–246. [Google Scholar] [CrossRef]
  47. Northey, S.A.; Mudd, G.M.; Saarivuori, E.; Wessman-Jääkeläinen, H.; Haque, N. Water footprinting and mining: Where are the limitations and opportunities? J. Clean. Prod. 2016, 135, 1098–1116. [Google Scholar] [CrossRef]
  48. Geissdoerfer, M.; Savaget, P.; Bocken, N.M.P.; Hultink, E.J. The Circular Economy A new sustainability paradigm? J. Clean. Prod. 2017, 143, 757–768. [Google Scholar] [CrossRef]
  49. Wang, S.H.; Wang, X.Q.; Chen, S.S. Global value chains and carbon emission reduction in developing countries: Does industrial upgrading matter? Environ. Impact Assess. Rev. 2022, 97, 106895. [Google Scholar] [CrossRef]
  50. Shen, L.Y.; Du, X.Y.; Cheng, G.Y.; Shi, F.C.; Wang, Y.X. Temporal-spatial evolution analysis on low carbon city performance in the context of China. Environ. Impact Assess. Rev. 2021, 90, 106626. [Google Scholar] [CrossRef]
  51. Zhou, X.Y.; Zhang, J.; Li, J.P. Industrial structural transformation and carbon dioxide emissions in China. Energy Policy 2013, 57, 43–51. [Google Scholar] [CrossRef]
  52. Wang, L.; Li, Z.; Xu, Z.; Yue, X.; Yang, L.; Wang, R.; Chen, Y.; Ma, H. Carbon emission scenario simulation and policy regulation in resource-based provinces based on system dynamics modeling. J. Clean. Prod. 2024, 460, 142619. [Google Scholar] [CrossRef]
  53. Zheng, L.; Mueller, M.; Luo, C.B.; Yan, X.Y. Predicting whole-life carbon emissions for buildings using different machine learning algorithms: A case study on typical residential properties in Cornwall, UK. Appl. Energy 2024, 357, 122472. [Google Scholar] [CrossRef]
  54. Jiang, F.; Zhang, L.L.; She, X.H.; Li, C.; Cang, D.Q.; Liu, X.L.; Xuan, Y.M.; Ding, Y.L. Skeleton materials for shape-stabilization of high temperature salts based phase change materials: A critical review. Renew. Sustain. Energy Rev. 2020, 119, 109539. [Google Scholar] [CrossRef]
  55. Seuring, S.; Müller, M. From a literature review to a conceptual framework for sustainable supply chain management. J. Clean. Prod. 2008, 16, 1699–1710. [Google Scholar] [CrossRef]
  56. Ecology and the Environment Department of National Development and Reform Commission People’s Republic of China. Peak Carbon Implementation Program for Industry; Ecology and the Environment Department of National Development and Reform Commission People’s Republic of China: Beijing, China, 7 July 2022.
  57. Yu, J.S.; Song, Y.; Tang, D.Y.; Dai, J. A Digital Twin approach based on nonparametric Bayesian network for complex system health monitoring. J. Manuf. Syst. 2021, 58, 293–304. [Google Scholar] [CrossRef]
  58. Wu, J.; Ahmad, S.F.; Jaweria; Ali, Y.A.; Al-Razgan, M.; Awwad, E.M.; Ayassrah, A. Investigating the role of green behavior and perceived benefits in shaping green car buying behavior with environmental awareness as a moderator. Heliyon 2024, 10, e30098. [Google Scholar] [CrossRef]
  59. Gheibi, S.; Vilarrasa, V.; Holt, R.M. Numerical analysis of mixed-mode rupture propagation of faults in reservoir-caprock system in CO2 storage. Int. J. Greenh. Gas Control 2018, 71, 46–61. [Google Scholar] [CrossRef]
Figure 1. Location map of Hubaoe urban agglomeration.
Energies 17 05521 g001
Figure 2. Hubaoe urban agglomeration carbon emissions 2000–2021. (a) Carbon emissions in HBO-UA; (b) Carbon emissions in Hohhot; (c) Carbon emissions in Baotou; (d) Carbon emissions in Ordos.
Energies 17 05521 g002
Figure 3. Coefficients of carbon emissions drivers in the three regions.
Energies 17 05521 g003
Figure 4. Multi-scenario cost scores.
Energies 17 05521 g004
Figure 5. Multi-scenario peaking program.
Energies 17 05521 g005
Table 1. Correspondence of indicators.
CategorizationFactorAbbreviationUnit of MeasurementConcrete Meaning
demographicTotal populationPten thousand personsResident population
economicsReal GDP per capitaRGconstant 2000, CNY ten thousandGDP to population ratio
Total exports and importsIEconstant 2000, CNY ten thousandTotal exports and imports
technicalIndustrial energy consumption per GDPLIkilograms of standard coal per CNY ten thousandTotal industrial energy consumption and GDP ratio
urbanizationUrbanization rateUR%Ratio of urban population to resident population
Number of employedEPpersonNumber of employed persons
Landscaping spaceLChektareArea of landscaped green space
industrial energyTotal industrial energy consumptionLEtons of standard coalTotal industrial energy consumption
Raw coal productionRYtonsOutput of major industrial products—raw coal production
Generation of electricityGCbillion kilowatt hoursOutput of major industrial products—electricity generation
industrial structureRatio of primary industry output value over total GDPPG%Ratio of primary industry output value over total GDP
Ratio of secondary industry output value over total GDPSG%Ratio of secondary industry output value overe total GDP
Ratio of tertiary industry output value over total GDPRG%Ratio of tertiary industry output value over total GDP
Ratio of industry sector output value over total GDPGI%Ratio of industry sector output value over total GDP
implicit variableCarbon emissionsCCmillion tonsTotal carbon emissions
Table 2. Urban carbon emissions factor coefficients.
FactorHohhotBaotouOrdos
lnP-1.861.195
lnRG0.1320.1730.132
lnPG--−0.173
lnSG---
lnTG---
lnGI−1.461−0.4591.772
lnLE-0.2170.098
lnLI−0.176-0.305
lnIE0.25--
lnEP--0.851
lnUR0.3341.270.392
lnLC--0.106
lnRY0.088-0.087
lnGC0.140.0960.121
_cons−3.96−16.117−13.892
Table 3. The deviations between the actual and the calculated carbon emissions data.
YearProportional Error%
HohhotBaotouOrdos
200011.25%−5.02%3.15%
2001−18.68%−0.20%1.44%
2002−14.11%2.63%1.24%
2003−7.69%1.47%1.92%
20043.59%2.67%−4.06%
2005−1.96%−3.31%−5.54%
20063.12%−2.65%−6.68%
2007−6.18%−0.43%−3.17%
20082.76%−0.29%−6.00%
20097.07%−1.95%−0.19%
20100.81%−2.37%5.86%
20114.29%−1.10%0.10%
20123.21%3.67%1.64%
20137.07%0.77%−1.29%
20144.96%0.76%−1.29%
20153.29%3.31%1.83%
20163.54%−0.02%0.95%
2017−0.59%−1.42%0.85%
2018−5.05%0.23%0.74%
2019−5.44%−1.94%2.84%
2020−4.73%0.03%2.63%
2021−2.70%1.51%−1.49%
2022−5.19%1.38%−0.15%
Disclaimer/Publisher’s Note: The statements, opinions and data contained in all publications are solely those of the individual author(s) and contributor(s) and not of MDPI and/or the editor(s). MDPI and/or the editor(s) disclaim responsibility for any injury to people or property resulting from any ideas, methods, instructions or products referred to in the content.

