Article

Hydrogen Yield Enhancement in Biogas Dry Reforming with a Ni/Cr Catalyst: A Numerical Study

1
Division of Mechanical Engineering, Mie University, Tsu 514-8507, Japan
2
Faculty of Engineering and Science, University of Agder, Jon Lilletuns vei 9, NO 4879 Grimstad, Norway
*
Author to whom correspondence should be addressed.
Energies 2024, 17(21), 5421; https://doi.org/10.3390/en17215421
Submission received: 27 September 2024 / Revised: 27 October 2024 / Accepted: 28 October 2024 / Published: 30 October 2024
(This article belongs to the Section A5: Hydrogen Energy)

Abstract

:
This numerical study investigates the impact of the reaction temperature, molar ratio of CH4:CO2, and catalyst porosity (εp) on the H2 yield and H2 selectivity during biogas dry reforming over a Ni/Cr catalyst. Using COMSOL Multiphysics, we conducted detailed simulations to elucidate the underlying reaction characteristics. Our findings reveal that increasing εp from 0.1 to 0.95 significantly provides a 5 times increase in H2 production and a 2.3% increase in H2 selectivity while simultaneously reducing CO selectivity by 2.3%. This effect is attributed to the improved mass transfer within the catalyst bed, leading to more efficient reactant conversion and product formation. Additionally, we observed a strong correlation between higher reaction temperatures and increased H2 yield and H2 selectivity. By optimizing these operational parameters, our results suggest that Ni/Cr catalysts can be effectively employed for the sustainable production of H2 from biogas.

1. Introduction

The production of H2 as a clean energy carrier has attracted considerable attention in recent years because of its potential to address climate change and decrease reliance on fossil fuels. Among the different methods for generating H2, biogas dry reforming (BDR) stands out as a promising approach to utilizing a renewable feedstock and creating a valuable product. A biogas is a fuel consisting of CH4 (55–75 vol%) and CO2 (25–45 vol%) [1], generally. It is produced from fermentation by the action of anaerobic microorganisms on raw materials, e.g., garbage, livestock excretion, and sewage sludge. In total, 1.46 EJ of produced biogas was obtained in the world in 2020 [2]. It was five times as large as that in 2000 [2]. We can expect the amount of produced biogas to increase more and more in the near future. Consequently, this study thinks biogas is a promising source for producing H2.
While biogas is commonly utilized as a fuel for gas engines and micro gas turbines [3], its lower heating value due to its significant CO2 content can limit power generation efficiency. To overcome this limitation, the authors propose a synergistic system integrating a BDR reactor with a solid oxide fuel cell (SOFC) [4,5,6]. CO, which is a by-product from BDR, as well as H2, can be used as a fuel for SOFC. This approach allows for the valorization of biogas, dry-converting its CO2 and CH4 components into valuable syngas, which can then be efficiently utilized as a fuel in the SOFC. Consequently, this study thinks this system can be used for a wider operation application compared to the existing system.
Much research on biogas dry reforming (BDR) has been reported [7,8,9,10,11,12,13,14,15,16,17]. To decide the performance of a BDR reactor, this study thinks the selection of the catalyst is important. According to the literature survey, Ni-based catalysts have emerged as promising candidates due to their high-superiority performance in converting biogas into valuable syngas for BDR [7,8,9,10,11,12,13,14,15,16,17]. Research has investigated various Ni-based catalysts, including Ni/Co/TiO2, Ni-promoted pyrochlore, Ni/Al/LDH with Mg and Zn, Ni-Ce/TiO2-ZrO2, Ni/Ru, etc. to optimize BDR performance. These studies have demonstrated the influence of the catalyst composition, reaction temperature, and molar ratio of CH4:CO2 on the conversion rates, H2 yield, and product selectivity. While the Ni-based catalyst has shown promising results, challenges such as catalyst deactivation, carbon formation, and H2/CO ratio control remain to be addressed. Recent advancements in catalyst design and process engineering have aimed to mitigate these issues and enhance the overall efficiency of BDR. For example, the incorporation of promoters or supports can improve catalyst stability and selectivity, while advanced reactor configurations can optimize heat and mass transfer.
At 900 °C, the Ni/Co/TiO2 catalyst performed CH4 conversion of 87.13%, CO2 conversion of 92.6% and H2 production of 41.1% [7]. In this study [7], the optimum ratio of Ni and Co was 7 wt% and 4 wt%, respectively. Ni with hollow silica spheres performed CH4 conversion of 94.4% and CO2 conversion of 95% [8]. Ni-promoted pyrochlore showed that the highest CH4 conversion and CO2 conversion were obtained in the case of CH4:CO2 = 1.1 and 1.85:1, respectively [9]. A BDR experiment was carried out using a Ni/Al/LDH with Mg and Zn in the case of CH4:CO2:N2 = 1.5:1:7.5 at the temperature range from 500 °C to 700 °C [10]. This catalyst performed CH4 conversion of 73%, CO2 conversion of 90% and a H2/CO ratio of approximately 2. Ni-Ce/TiO2-ZrO2 performed the highest CH4 conversion of approximately 98% at 750 °C and the highest H2/CO ratio of approximately 0.71 and 800 °C [11]. The Ni/Ru catalyst was investigated, exhibiting that CH4 and CO2 conversions were 70% and 78%, respectively, at 750 °C [12]. In the case of a CH4-rich condition, i.e., CH4:CO2 = 2:1, low Ni loading (2.5 wt%) modified with Gd, Sc or La showed the highest CH4 conversion of 49%, the highest CO2 conversion of 95% and the highest H2/CO ratio of 1.0 at 750 °C [13]. Kaviani et al. investigated the effect of Ni loading on the performance of the Ni/SiO2/SiO2 core-shell for BDR [14]. As a result, when the Ni content increased from 2.5 wt% to 15 wt%, the Ni loading of 15 wt% performed the highest CH4 conversion of 75%, the highest CO2 conversion of 90%, and the highest H2/CO ratio of 0.9. The Ni-SiO2 sandwiched core-shell catalyst performed the highest CH4 conversion of 71.5% and CO2 conversion of 91.5% in the case of CH4:CO2 = 1.5:1 at 700 °C [15]. The SiO2 layer in the sandwiched catalyst prevented the agglomeration of metal particles and minimized carbon deposition. The Ni/LnOx (Ln = La, Ce, Sm or Pr)-type catalyst was developed for the investigation of the characteristics of BDR [16]. As a result, CH4 and CO2 conversions increased with the increase in reaction temperature from 600 °C to 750 °C irrespective of catalyst type, while the temperature change of H2/CO ratio depended on catalyst type. According to the review paper on Ni-based catalyst [17], CH4 and CO2 conversions increased with the increase in the reaction temperature from 300 °C up to 1000 °C, irrespective of the molar ratio of CH4:CO2. On the other hand, the H2/CO ratio decreased with the increase in the reaction temperature from 300 °C to 500 °C and kept a constant value, i.e., approximately 0 over 500 °C. According to the other previous study [14], when using a Ni-SiO2@SiO2 core-shell catalyst, the H2/CO ratio increased with the increase in the reaction temperature from 500 °C to 700 °C, attaining approximately 0.8. On the other hand, the H2/CO ratio kept approximately the same value of 1.5 with the increase in the reaction temperature from 500 °C to 750 °C when using the Mg/F/Ni-Al catalyst [10]. Therefore, the authors think that the impact of the reaction temperature on the H2/CO ratio is influenced by the catalyst type and experimental conditions.
Though several Ni alloy catalysts have been investigated, few Ni/Cr catalysts were reported, except for the experimental studies using a membrane reactor, which were carried out by the authors of this paper [5,18]. These previous studies reported that Ni/Cr exhibited the better performance compared to the Ni catalyst due to it preventing a carbon deposition [5,18]. The H2 yield obtained by the Ni/Cr catalyst was approximately 10–100 times as large as that of the Ni catalyst, which depended on the experimental condition. The H2 yield increased with the increase in temperature from 400 °C to 600 °C, irrespective of the molar ratio of CH4:CO2. The highest H2 yield, which was 12.8%, was obtained using Ni/Cr in the case of CH4:CO2 = 1.5:1 at 600 °C, and the differential pressure between the reaction chamber and the sweep chamber was 0.010 MPa without sweep gas. In addition, the CO selectivity was much larger than H2 selectivity within the temperature range from 400 °C to 600 °C, which was over 90%. According to the previous studies [5,18], it was thought that not only dry reforming (DR) but also the other reactions were conducted. However, the numerical analysis of the characteristics of the Ni/Cr alloy catalyst used for BDR including the other reactions has not been investigated. It is perceived that only numerical analysis allows for establishing reaction mechanisms. In addition, a catalyst porosity (εp) which influences the performance of a catalyst as well as a reactor has not been investigated numerically and experimentally.
While the Ni/Cr catalyst has shown a promising performance in previous experimental studies for BDR [5,18], its reaction mechanisms and the influence of εp on performance remain unclear. The aim of this study is to clarify the reaction mechanism of BDR and the other reactions as well as the influence of εp on the performance of these reactions through the numerical simulation using the CFD software COMSOL Multiphysics ver. 6.2. This study also aims to reveal the reaction characteristics and optimize the H2 yield in BDR using the Ni/Cr catalyst by investigating the impact of the reaction temperature, molar ratio of CH4:CO2, and εp on the characteristics. Since there are more previous studies using COMSOL Multiphysics for the numerical analysis of BDR and reports on the reaction characteristics as well as heat and mass transfer [19,20,21,22], we have adopted COMSOL Multiphysics for the numerical analysis in this study. To investigate the impact of the reaction temperature, molar ratio of CH4:CO2, and εp on the characteristics of BDR including the other reactions, the following reactions are considered:
<Dry reforming (DR)>
CH4 + CO2 ↔ 2H2 + 2CO + 247 kJ/mol
<Steam reforming (SR)>
CH4 + H2O ↔ CO + 3H2 + 206 kJ/mol
<Reverse water gas shift reaction (RWGS)>
CO2 + H2 ↔ CO + H2O + 41 kJ/mol
<Methanation reaction (MR)>
CO2 + 4H2 ↔ CH4 + 2H2O − 165.0 kJ/mol
<Methane decomposition reaction (MDR)>
CH4 ↔ C + 2H2 + 74 kJ/mol
<Boudouard reaction (BD)>
2CO ↔ C + CO2 − 172 kJ/mol

2. Numerical Simulation of BDR over the Ni/Cr Catalyst

2.1. A Mathematical Formulation

The numerical simulation was conducted by multi-physics software, COMSOL Multiphysics, ver. 6.2. In COMSOL Multiphysics, users can select or customize various partial differential equations and combine them to achieve direct coupled multi-physics field analysis easily [23]. COMSOL Multiphysics has simulation function codes. The following governing equations are involved in COMSOL Multiphysics.
The equations of mass conservation in porous material can be defined as follows:
u = κ μ p + ρ g D
ρ u = Q m
ρ κ μ p = Q m
where u is a velocity vector [m/s], κ is permeability [m2], μ is viscosity [Pa·s], p is pressure [Pa], ρ is density [kg/m3], g is gravitational acceleration [m2/s], D is height [m], and Qm is a mass source term [kg/(m3·s)].
The equation of momentum conservation in porous material can be defined by the Brinkmann equation, as follows:
ρ ε p u u ε p = p + 1 ε p μ u + u T 2 3 μ u I κ 1 μ + Q m ε p 2 u + F
where εp is porosity [-], I is a unit vector [-], and F is a force vector [kg/(m3·s)].
The equation of mass transfer in porous material can be defined by the Maxell–Stefan equation, as follows:
ρ ω i u ρ ω i k = 1 n ε p 3 2 D i k ~ x k + x k ω k p p ε p 3 2 D i T T T = R i , t o t
where ω i , ω k is the mass ratio of chemicals i and k, respectively [-], D i k ~ is a Fick’s diffusion coefficient of effective multi components [m2/s], D i T is a thermal diffusion coefficient [kg/(m·s)], and R i , t o t is a reaction rate of chemical species [mol/(m3·s)].
The equations of heat transfer in porous material can be defined as follows:
ρ f C p , f u T + q = Q + Q p + Q v d
q = k e f f T
where f is a physical quantity on fluid [-], Cp is the constant pressure specific heat [J/(kg·K)], q is a thermal flux vector [W/m2], Q is a thermal source [W/m3], Qp is a thermal source due to pressure loss [W/m3], Qvd is a thermal source due to viscosity dissipation [W/m3], and keff is an effective thermal conductivity [W/(m·K)].

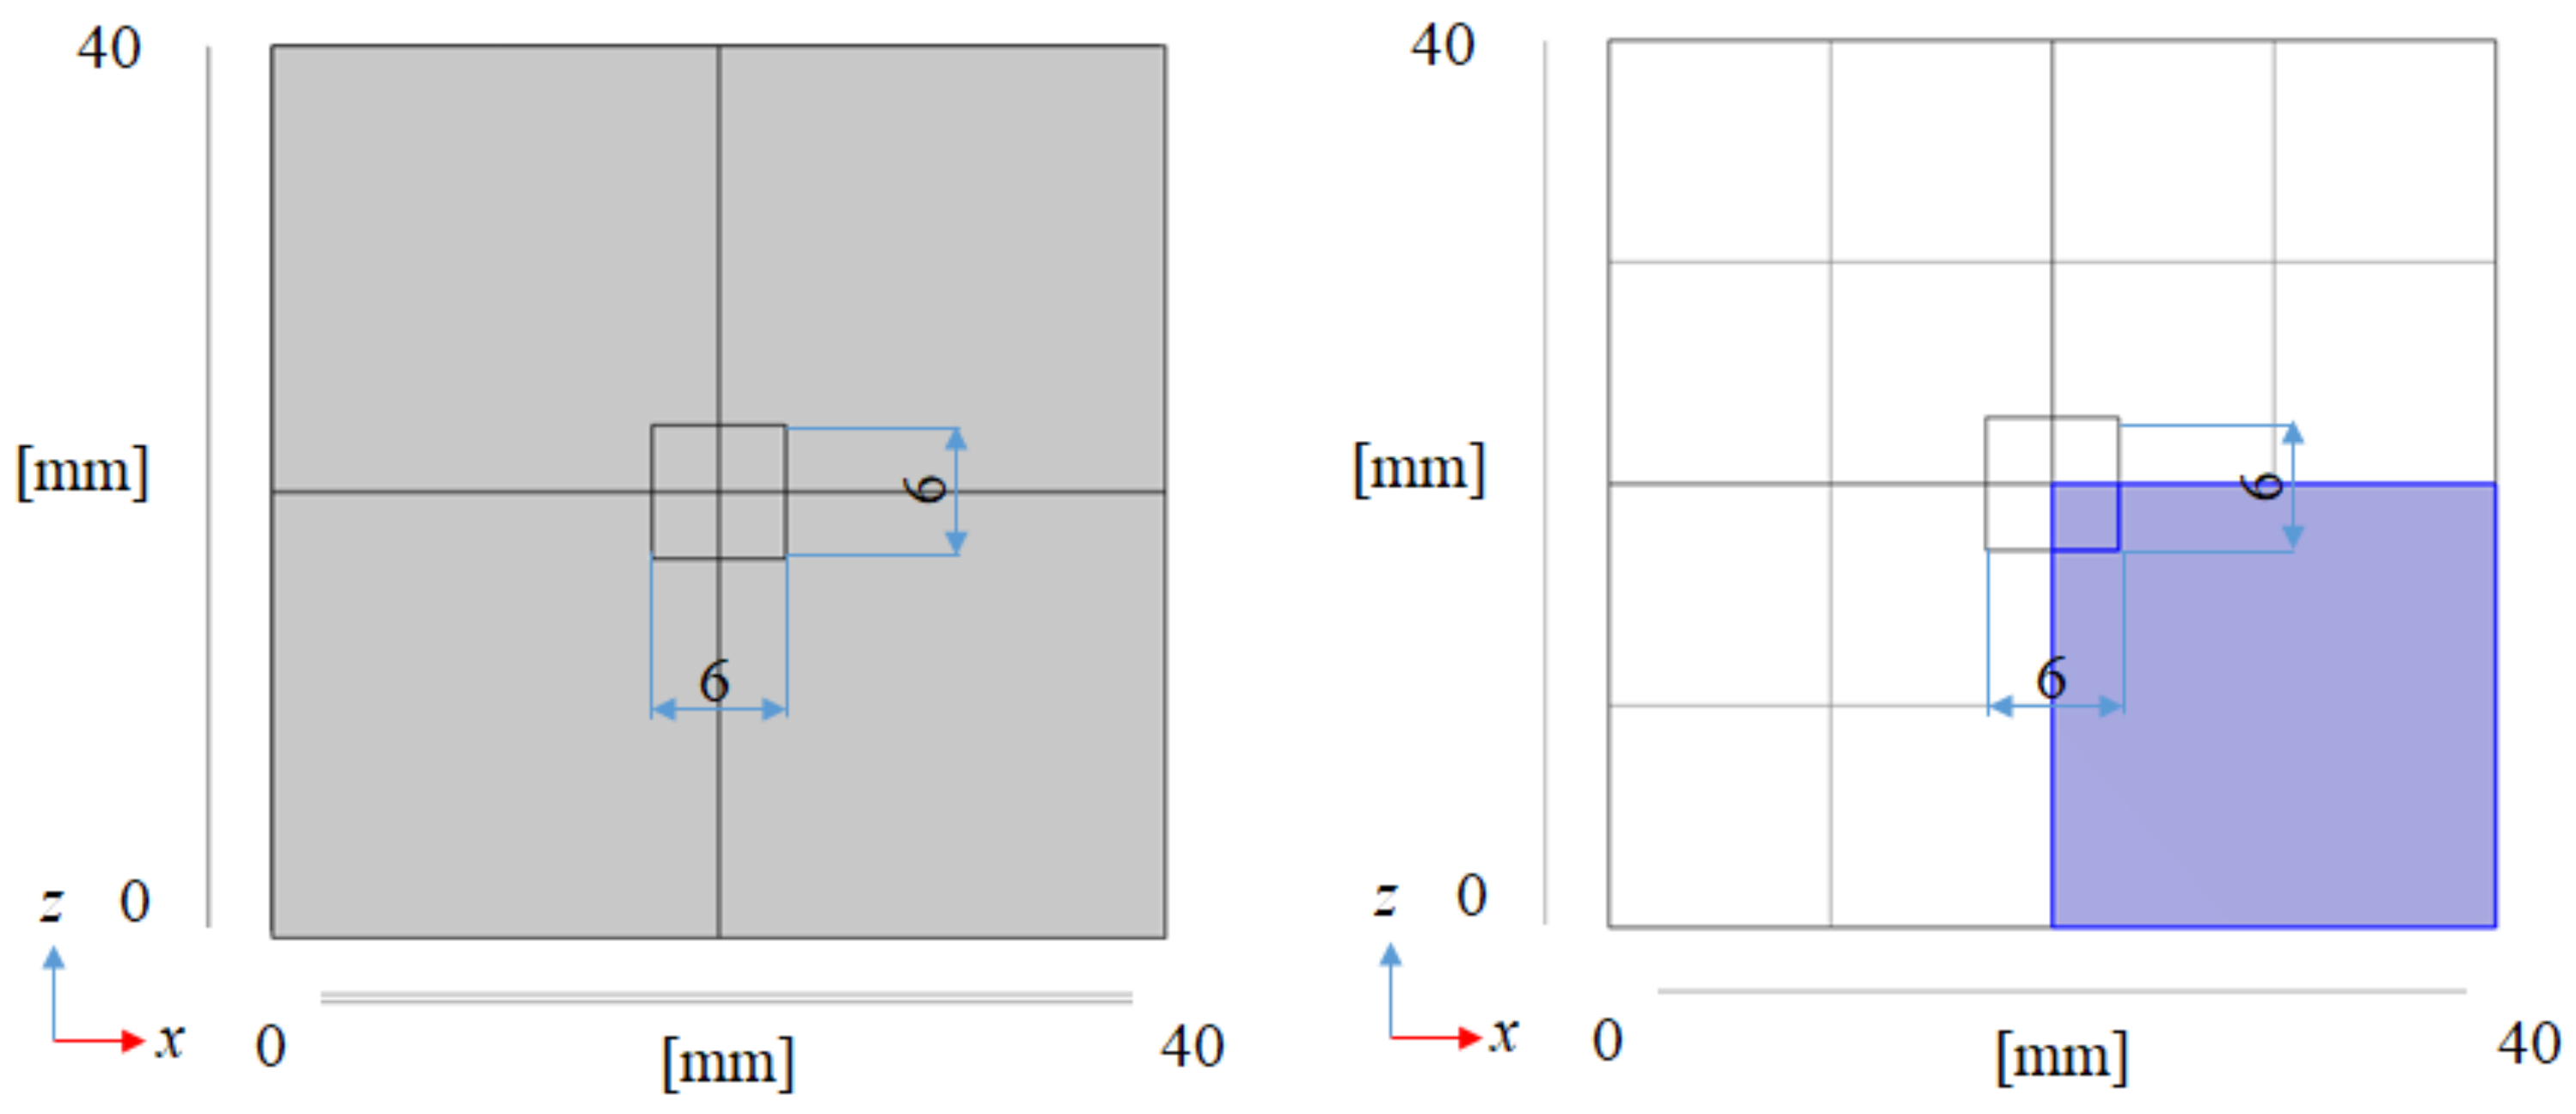
2.2. 3D Numerical Modeling of BDR

Figure 1 illustrates the overview of the 3D model. Figure 2 illustrates the front view of the 3D model. The 3D model simulates the experimental apparatus of the reaction chamber used for the previous experimental studies carried out by the authors [5,18]. Though the BDR experiment was carried out using a membrane reactor in the previous studies [5,18], this study focuses on the reaction chamber only without H2 separation to clarify the reaction characteristics of biogas dry reforming including the other reactions. The dimensions of the 3D model are 40 mm × 40 mm × 100 mm. This study has adopted the dimensions of the 3D model of 40 mm × 40 mm × 100 mm for the numerical simulation following the experimental studies conducted by the authors [5,18]. In this experimental study, the diameters of the inlet and outlet of the reactor were 6 mm. Therefore, this study has set the area of 6 mm × 6 mm as the area of the inlet and outlet of the full-scale model.
In this study, the numerical simulation is carried out by the one-fourth-sized model cut with the dimensions of 10 mm × 10 mm × 100 mm, which are also shown in Figure 1 and Figure 2, since the similarity of the results toward horizontal and vertical directions have been confirmed by this study.

2.3. Kinetic Modeling of BDR

This study considers the reaction shown in Equations (1)–(5) for the numerical simulation. The reaction rates of these equations are defined as follows [19,23,24,25]:
<Dry reforming (DR)>
r 1 = k 1 K C O 2 , 1 K C H 4 , 1 P C O 2 P C H 4 1 + K C O 2 , 1 P C O 2 + K C H 4 , 1 P C H 4 2 1 P C O P H 2 2 K 1 P C O 2 P C H 4
where k 1 = 1290 × 5000 e 102065 R T , K C O 2 , 1 = 2.64 × 10 2 e 37641 R T , K C H 4 , 1 = 2.63 × 10 2 e 40684 R T , and K 1 = e 34.011 e 258598 R T .
<Steam reforming (SR)>
r 2 = k 2 P H 2 2.5 P C H 4 P H 2 O P C O P H 2 3 K 2 1 + P H 2 O K H 2 O , 2 P H 2 + K C O , 2 P C O + K H 2 , 2 P H 2 + K C H 4 , 2 P C H 4 2
where k 2 = 2.636 × 10 12 e 240100 R T , K 2 = 1.198 × 10 17 e 26830 R T , K C O 2 , 2 = 8.23 × 10 5 e 70650 R T , K C H 4 , 2 = 6.65 × 10 4 e 38280 R T , K H 2 , 2 = 6.12 × 10 9 e 82900 R T , and K H 2 O , 2 = 1.77 × 10 5 e 88680 R T .
<Reverse water gas shift reaction (RWGS)>
r 3 = k 3 P C O 2 1 P C O P H 2 O K 3 P C O 2 P H 2
where k 3 = 9.28 × 10 3 e 73105 R T and K 3 = 68.78 e 37500 R T .
<Methanation reaction (MR)>
r 4 = k 4 P H 2 3.5 P C H 4 P H 2 O 2 P C O 2 P H 2 4 K 4 1 + P H 2 O K H 2 O , 4 P H 2 + K C O , 4 P C O + K H 2 , 4 P H 2 + K C H 4 , 4 P C H 4 2
where k 4 = 6.364 × 10 11 e 24390 R T , K 4 = 2.117 × 10 15 e 22430 R T , K C H 4 , 4 = 6.65 × 10 4 e 38280 R T , K C O , 4 = 8.23 × 10 5 e 70650 R T , K H 2 , 4 = 6.12 × 10 9 e 82900 R T , and K H 2 O , 4 = 1.77 × 10 5 e 88680 R T .
<Methane decomposition reaction (MDR)>
r 5 = k 5 K C H 4 , 5 P C H 4 P H 2 2 K 5 1 + K C H 4 , 5 P C H 4 + P H 2 1.5 K H 2 , 5 2
where k 5 = 6.95 × 10 3 e 58983 R T , K 5 = 2.95 × 10 5 e 84440 R T , K C H 4 , 5 = 0.21 e 567 R T , and K H 2 , 5 = 5.18 × 10 7 e 133210 R T .
<Boudouard reaction (BD)>
r 6 = k 6 K C O , 6 K C O 2 , 6 P C O K 6 P C O 2 P C O 1 + K C O , 6 P C O + 1 K C O , 6 K C O 2 , 6 P C O 2 P C O 2
where k 6 = 1.34 × 10 15 e 243835 R T , K 6 = 1.9393 × 10 9 e 168527 R T , K C O 2 , 6 = 2.81 × 10 7 e 104085 R T , and K C O , 6 = 7.34 × 10 6 e 100395 R T . In addition, r n is a kinetic rate (n = 1, 2, 3, 4, 4, 6) [mol/(kg·s)], k n is a kinetic constant (n = 1, 2, 3, 4, 5, 6) [mol/(kg·s)], P i is a particle pressure of chemical species i [Pa], K n is an equilibrium constant (n = 1, 2, 3, 4, 5, 6) [-], and K i is the absorption equilibrium constants of chemical species i [-].

2.4. Numerical Simulation Parameters and Conditions for BDR

In this study, the molar ratio of CH4:CO2 is changed by 1.5:1, 1:1, and 1:1.5. The initial reaction temperature is changed by 400 °C, 500 °C, 600 °C, and 700 °C. Ni/Cr alloy is assumed to be the catalyst, which was used for the previous experimental studies [5,18]. The weight ratio of Cr to the whole weight of Ni/Cr alloy is 20 wt%. The porosity, permeability, constant pressure-specific heat, and thermal conductivity of Ni/Cr alloy catalysts are estimated considering the weight ratio of Cr. εp is changed by 0.95, 0.7, 0.4, and 0.1. This study has selected εp of 0.95 following the experimental studies conducted by the authors [5,18]. The other εp, i.e., 0.7, 0.4, and 0.1 have been selected to clarify the impact of εp on the characteristics of BDR and the other reactions. Table 1 lists the main physical properties and parameters for the numerical simulation in this study.
In this study, the following assumptions are set:
(i)
The catalyst is a porous material. The porosity, permeability, constant pressure-specific heat, and thermal conductivity are isotropic.
(ii)
The wall temperature is isothermal.
(iii)
G = The gas is a Newton fluid and an ideal gas.
(iv)
W = The wall of the reactor excluding the inlet and outlet is no-slip.
(v)
The pressure of the outlet is atmosphere (gauge pressure = 0 Pa).
(vi)
The temperature of the inflow gas is the same as the initial reaction temperature.
(vii)
The produced carbon is treated as a gas.
As for (vii), generally speaking, a solid carbon is produced by Equations (5) and (6). However, the numerical simulation software COMSOL Multiphysics, which is used by this study, cannot treat a solid carbon as a gaseous carbon. Therefore, this study has set the assumption (vii).

2.5. Evaluaion Factors and Reaction Pathways in BDR

In this study, the following evaluation factors are considered:
CH 4   conversion = C C H 4 , i n C C H 4 , o u t C C H 4 , i n × 100   %
where C C H 4 , i n is the molar concentration of CH4 at the inlet [mol] and C C H 4 , o u t is the molar concentration of CH4 at the outlet [mol].
CO 2   conversion = C C O 2 , i n C C O 2 , o u t C C O 2 , i n × 100   %
where C C O 2 , i n is the molar concentration of CO2 at the inlet [mol] and C C O 2 , o u t is the molar concentration of CO2 at the outlet [mol].
H 2   yield = 1 2 C H 2 , o u t C C H 4 , i n × 100   %
where C H 2 , o u t is the molar concentration of H2 at the outlet [mol].
H 2   selectivity = C H 2 , o u t C H 2 , o u t + C C O , o u t × 100   %
where C C O , o u t is the molar concentration of CO at the outlet [mol].
CO   selectivity = C C O , o u t C H 2 , o u t + C C O , o u t × 100   %

3. Results and Discussion

3.1. Impact of Catalyst Porosity on Reaction, Heat, and Mass Transfer Phenomena in BDR

Figure 3, Figure 4, Figure 5 and Figure 6 illustrate the 3D distributions of the molar concentrations (CH4, CO2, H2, CO2, H2O, and C), temperature, gas pressure, and gas velocity within the reactor. To exemplify the numerical simulation results, Figure 3 and Figure 5 present the data for the CH4:CO2 ratio of 1.5:1 at 600 °C with εp of 0.95, while Figure 4 and Figure 6 show the corresponding data for the same conditions but with a lower εp of 0.1.
As depicted in Figure 3 and Figure 4, the molar concentrations of CH4 and CO2 (reactants) decrease progressively along the gas flow from the inlet to the outlet, regardless of εp. In the initial section (0 mm ≤ y ≤ 20 mm), the molar concentrations of CH4 and CO2 exhibit a radial gradient, with higher values near the center and lower values near the wall. However, this radial distribution becomes less pronounced or disappears in the downstream region (30 mm ≤ y ≤ 100 mm). This behavior can be attributed to the high gas velocity near the inlet, which promotes preferential axial flow and limits radial diffusion. As the gas progresses through the reactor, the diffusion becomes more significant, leading to a more uniform distribution. In addition, the molar concentrations of H2, CO, H2O, and C, which are products, increase along the gas flow direction from the inlet to the outlet, regardless of εp. Conversely, the temperature profiles depicted in Figure 5 and Figure 6 demonstrate a decrease from the initial reaction temperature of 600 °C, except near the inlet and the outlet regions. This temperature reduction is attributed to the endothermic nature of the reactions described by Equations (1)–(6). These observations validate the accuracy of the simulated reaction model. Furthermore, the gas velocity is notably higher near the inlet and the outlet compared to the central reaction of the reactor. This is due to the larger cross-sectional area in these regions. However, away from the inlet and the outlet, the gas velocity stabilizes as a result of sufficient gas diffusion towards the reactor walls.
As illustrated in Figure 3 and Figure 4, a higher εp leads to lower molar concentrations of CH4 and CO2 and, conversely, higher molar concentrations of H2, CO, H2O, and C. This enhancement in product formation and reactant consumption can be attributed to the improved mass transfer within the porous catalyst structure at higher εp values. The enhanced diffusivity within the catalyst facilitates reactant diffusion to active sites and product diffusion away from the catalyst surface, thereby promoting the reaction kinetics. Further analysis of Figure 5 and Figure 6 reveals that the temperature for εp = 0.95 is lower than that for εp = 0.1. This observation can be attributed to the enhanced diffusion within the catalyst bed at higher porosities, facilitating the progress of the endothermic reactions (Equations (1)–(3) and (5)). Additionally, the pressure near the inlet is lower for εp = 0.95 compared to that for εp = 0.1, which is directly related to the increased catalyst permeability at higher porosities, as indicated in Table 1.
Figure 7, Figure 8, Figure 9 and Figure 10 illustrate the influence of εp on the distribution of molar concentrations along the reactor centerline for CH4:CO2 = 1.5:1 at various reaction temperatures (400 °C, 500 °C, 600 °C, and 700 °C). εp is changed by 0.95, 0.7, 0.4, and 0.1. The results demonstrate that increasing εp leads to a decrease in the molar concentrations of CH4 and CO2 while simultaneously enhancing the concentrations of H2, CO, H2O, and C. This enhancement is attributed to the improved mass diffusion within the porous catalyst structure, facilitating the progress of the reforming reactions. Moreover, elevating the reaction temperature promotes the formation of H2 and CO, as evidenced by the increased molar concentrations of these species. The enhanced performance of DR, SR, RWGS, and MR, as described by Equations (1)–(4), at a higher reaction temperature contributes to the observed H2 and CO production. In addition, according to Figure 7, Figure 8, Figure 9 and Figure 10, the molar concentration of C for εp increases along the y-direction at 400 °C and 500 °C. On the other hand, we cannot see the production of C for εp along the y-direction at 600 °C and 700 °C. The authors think BD (Equation (6)), which is an exothermic reaction, produces C from CO at a lower reaction temperature after CO is produced by DR (Equation (1)), SR (Equation (2)), and RWGS (Equation (3)).
Figure 11 quantitatively evaluates the influence of εp on the distribution of the molar concentration ratios for each gas along the reactor centerline under the condition of CH4:CO2 = 1.5:1 at 600 °C. The analysis reveals that the impact of εp on the molar concentration distribution becomes more pronounced as εp increases, regardless of the gas species. Notably, the effect of εp on the products species (H2, CO, H2O, and C) is more significant near the inlet (y = 20 m). In addition, it can be seen that the effect of εp on the reactant species (CH4 and CO2) is more pronounced near the inlet (y = 20 m), e.g., in the case of 0.1/0.95, which is similar to the tendency of products species. This observation can be attributed to the gradual consumption of CH4 and CO2 through the various reactions (Equations (1)–(5)) along the gas flow. The enhanced diffusivity within the porous catalyst at higher εp values contributes to the more significant impact on reactant concentrations near the outlet. Moreover, it is revealed in Figure 11 that increasing εp from 0.1 to 0.95 significantly provides a five times increase in H2 production.
Figure 12 illustrates the influence of εp on the distribution of temperature for CH4:CO2 = 1.5:1 at 600 °C. As depicted in the figure, a larger temperature drop is observed near the inlet (y = 20 m) with increasing εp. This phenomenon is attributed to the dominance of the endothermic reactions represented by Equations (1), (2), (3) and (5), which absorb heat from the surrounding, leading to a localized temperature decrease.

3.2. Influence of the Molar Ratio of CH4:CO2 on BDR over the Ni/Cr Catalyst

Figure 13 and Figure 14 compare the distributions of the molar concentration for different molar ratios of CH4:CO2 at 400 °C and 700 °C, respectively, with εp = 0.95. The results indicate that the highest molar concentrations of CH4 and CO2 are achieved at CH4:CO2 = 1.5:1 and 1:1.5, respectively, regardless of the reaction temperature. This is primarily attributed to the higher inflow rates associated with these ratios. Additionally, the highest molar concentrations of H2 and CO2 are consistently observed at CH4:CO2 = 1:1, irrespective of the reaction temperature, aligning with the theoretical molar ratio for DR.
Regarding H2O production, the highest molar concentration of H2O is obtained for CH4:CO2 = 1:1.5 at 700 °C. This is due to the favorable conditions for MR, which consumes CO2 to produce H2O. In contrast, at 400 °C, the highest H2O concentration occurs at CH4:CO2 = 1:1 and 1:1.5. Under these conditions, RWGS, which also produces H2O, is more favored due to its exothermic nature. The lower molar concentration of H2O at 400 °C for CH4:CO2 = 1.5:1 can be attributed to the reduced availability of CO2 for RWGS. Moreover, the molar concentration of C is lower at 700 °C compared to that at 400 °C, suggesting a decreased contribution of BD at higher temperatures.

3.3. Comparison of Numerical Simulation and Experimental Results for BDR

To comprehensively evaluate the performance of BDR including the other reactions, this study employs the evaluation merits defined by Equations (20)–(24). Table 2 presents a comparative analysis of the CH4 conversion, CO2 conversion, H2 yield, H2 selectivity and CO selectivity for various εp values at CH4:CO2 = 1.5:1 and the reaction temperature of 600 °C.
As shown in Table 2, increasing εp leads to enhanced CH4 conversion, CO2 conversion, H2 yield, and H2 selectivity. Conversely, CO selectivity decreases with rising εp. The improved performance can be attributed to enhanced mass diffusion within the porous catalyst structure. This facilitates the progress of the reaction, particularly those consuming CH4 and CO2 as reactants. In addition, it is revealed in Table 2 that increasing εp from 0.1 to 0.95 provides the increase in H2 selectivity by 2.3% while simultaneously reducing CO selectivity by 2.3%.
Table 3 presents a comparative analysis of CH4 conversion, CO2 conversion, H2 yield, H2 selectivity, and CO selectivity among various reaction temperatures for CH4:CO2 = 1.5:1 and εp = 0.95. Table 4 provides a similar comparison based on experimental data for εp 0.95 obtained from the previous experimental study conducted by the authors using the membrane reactor [5]. Due to the experimental limitations, data for 700 °C were not available in the experimental study [5]. The data presented in Table 4 correspond to the specific condition of 0 MPa of the pressure difference between the reaction chamber and the sweep chamber, without the use of a sweep gas. This condition aligns with the numerical simulation setup, which does not consider H2 separation.
As expected from the endothermic nature of H2 production reactions (Equations (1), (2) and (5)), Table 3 and Table 4 reveal a positive correlation between the reaction temperature and both the H2 yield and H2 selectivity. However, a discrepancy exists between the numerical simulation results (Table 3) and the experimental data (Table 4). The experimental data were obtained using a membrane reactor [5]. On the other hand, the 3D model used for the numerical simulation in this study considers the reactions in only the reaction chamber without a separation membrane and a sweep chamber. As the first step in this study, the numerical simulation by a 3D model considering several reactions without H2 separation has been conducted. As a result, each evaluation factor shown in Table 3 and Table 4 indicates the discrepancy between the numerical simulation results and the experimental results. This study suggests that the impact of H2 separation might influence the progress of each reaction considered in this study.
According to the literature review by the authors, the numerical studies on biogas dry reforming using a membrane reactor have been mainly conducted for the double circular tube type [26,27,28,29]. On the other hand, this study has conducted the rectangular reactor type since the authors’ previous experimental studies [4,5] have used the rectangular membrane reactor consisting of a reaction chamber and sweep chamber. In this paper, the numerical study using the 3D model for a rectangular reactor has been conducted to compare the results obtained by the authors’ experimental studies using the rectangular membrane reactor. As a result, this study has clarified the characteristics of biogas dry reforming including the other reactions using the rectangular reactor without H2 separation. This is the first step. In the next step of this study, the numerical study on the rectangular membrane reactor consisting of a reaction chamber and a sweep chamber is going to be carried out to understand the effect of H2 separation on the biogas dry reforming including the other reactions considered in this study, which is being prepared now. This study would report the results obtained by the numerical study on the rectangular membrane reactor consisting of a reaction chamber and a sweep chamber compared to the results obtained by the authors’ previous experimental studies [4,5] in the near future.

4. Conclusions

This study employed numerical simulations using COMSOL Multiphysics to elucidate the reaction characteristics of a Ni/Cr catalyst employed for BDR. By systematically varying the reaction temperature, molar ratio of CH4:CO2, and εp, the study aimed to comprehensively understand the impact of these parameters on the BDR process. The findings of this investigation are summarized as follows:
i
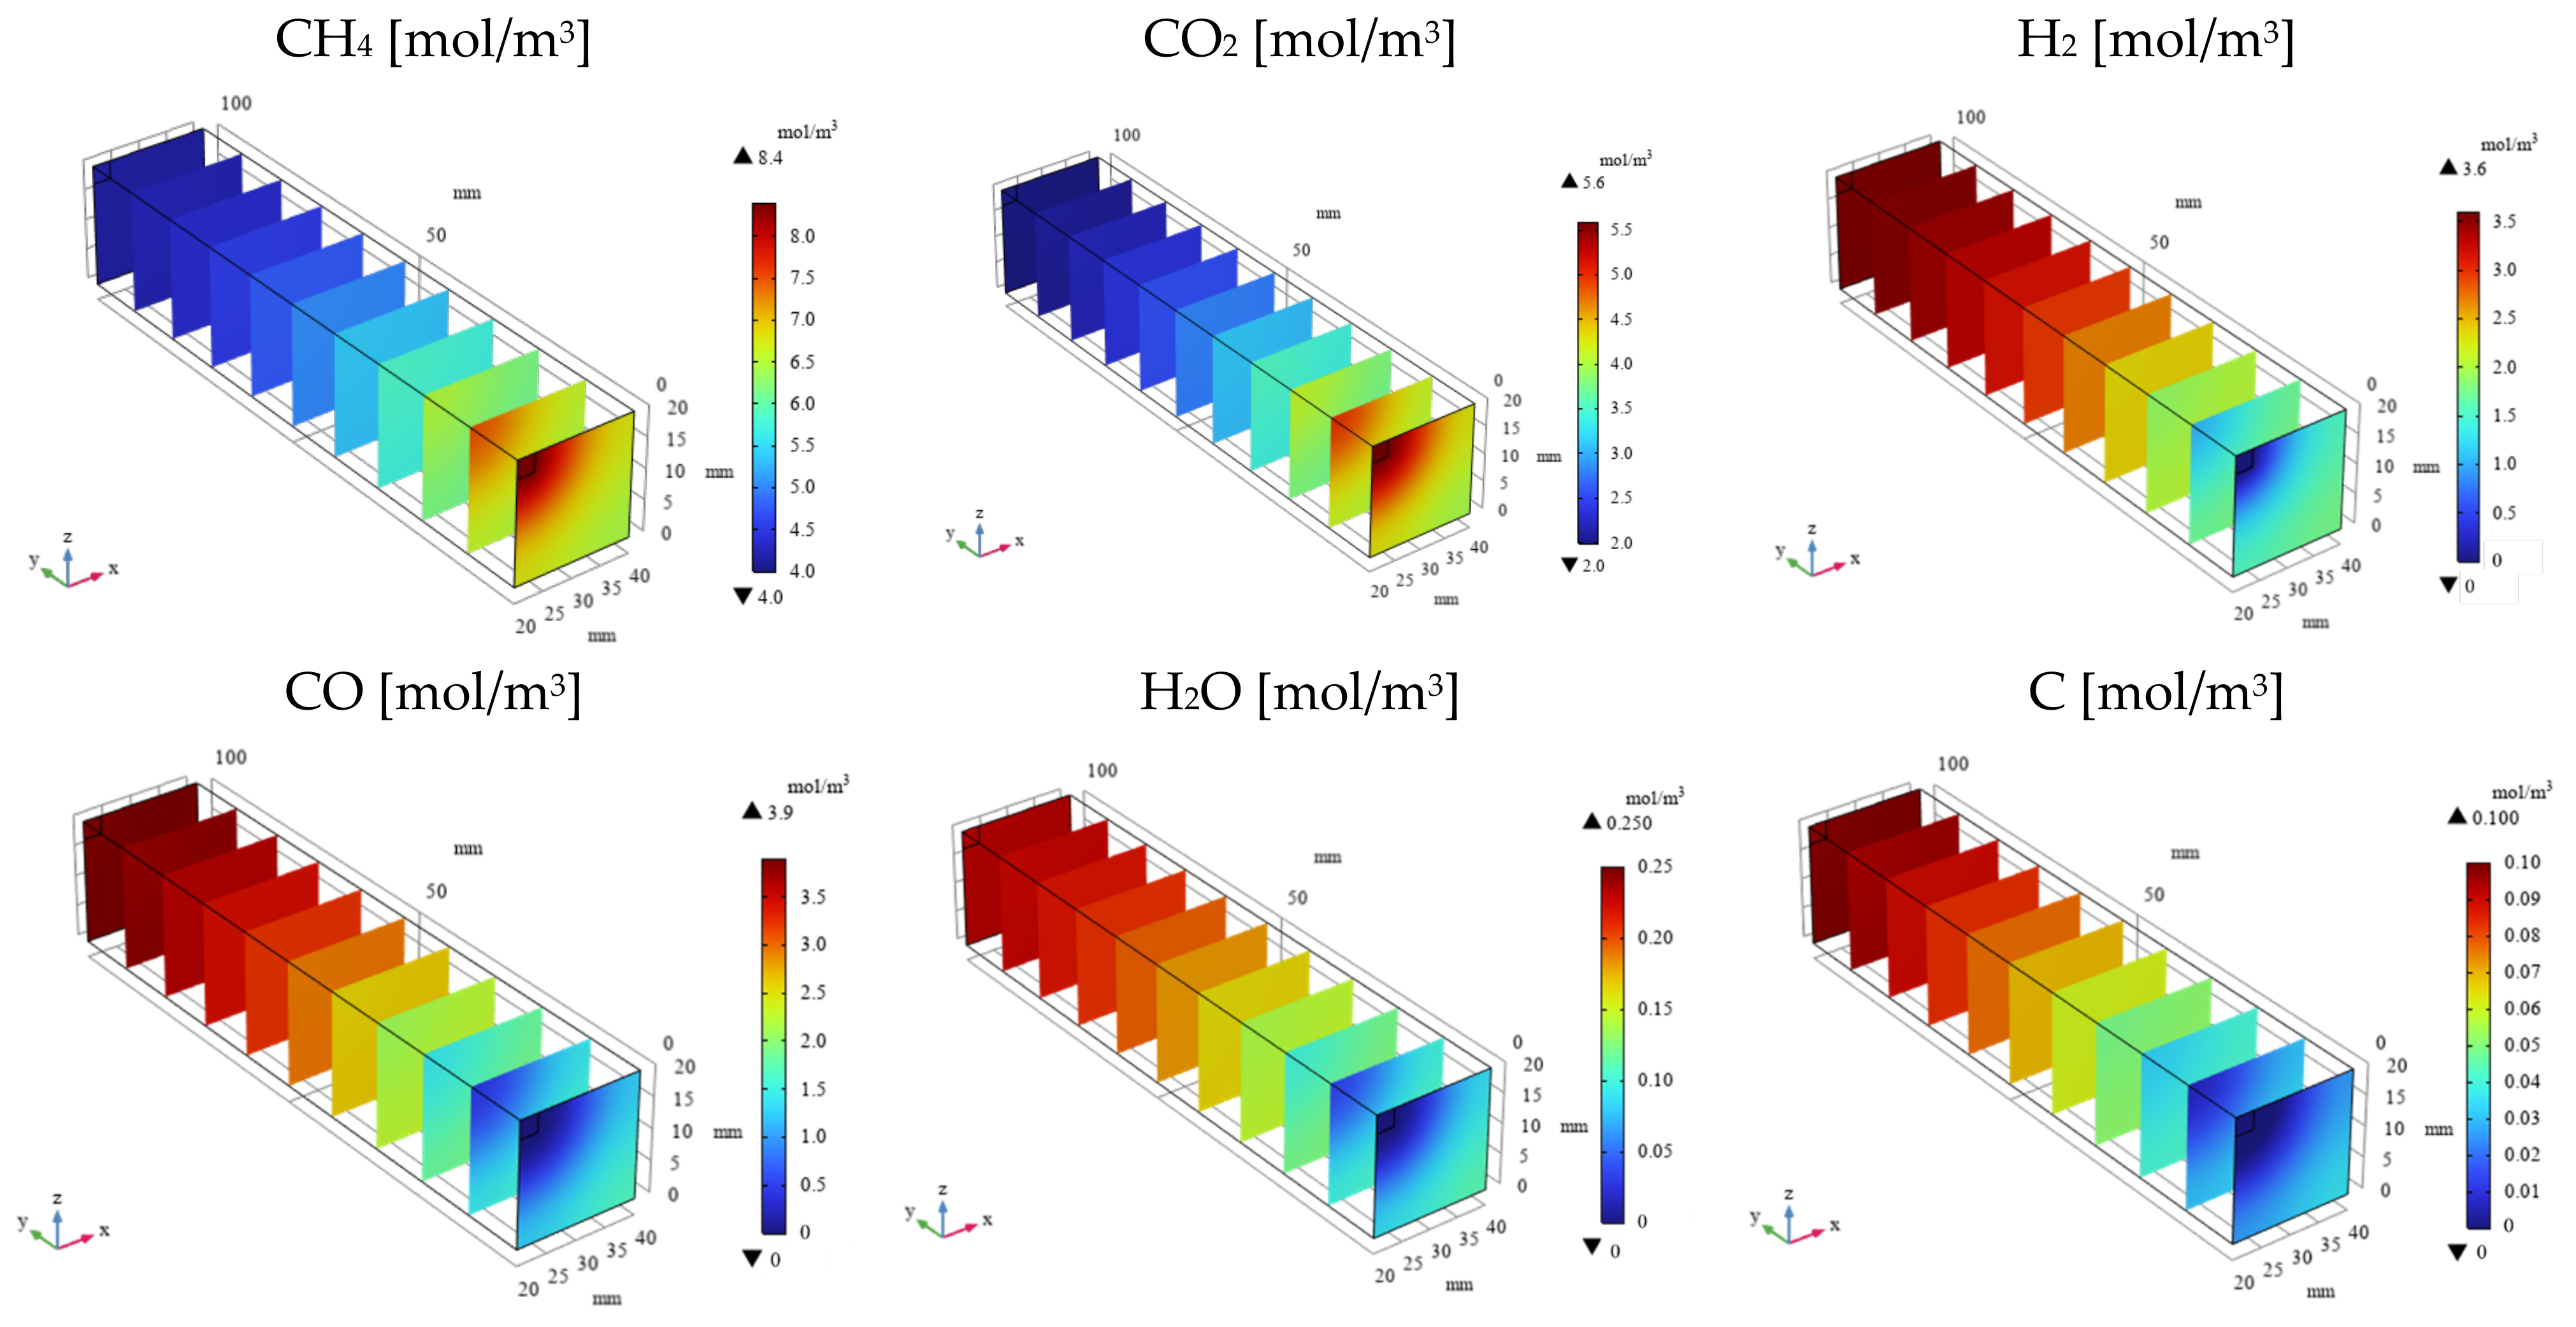
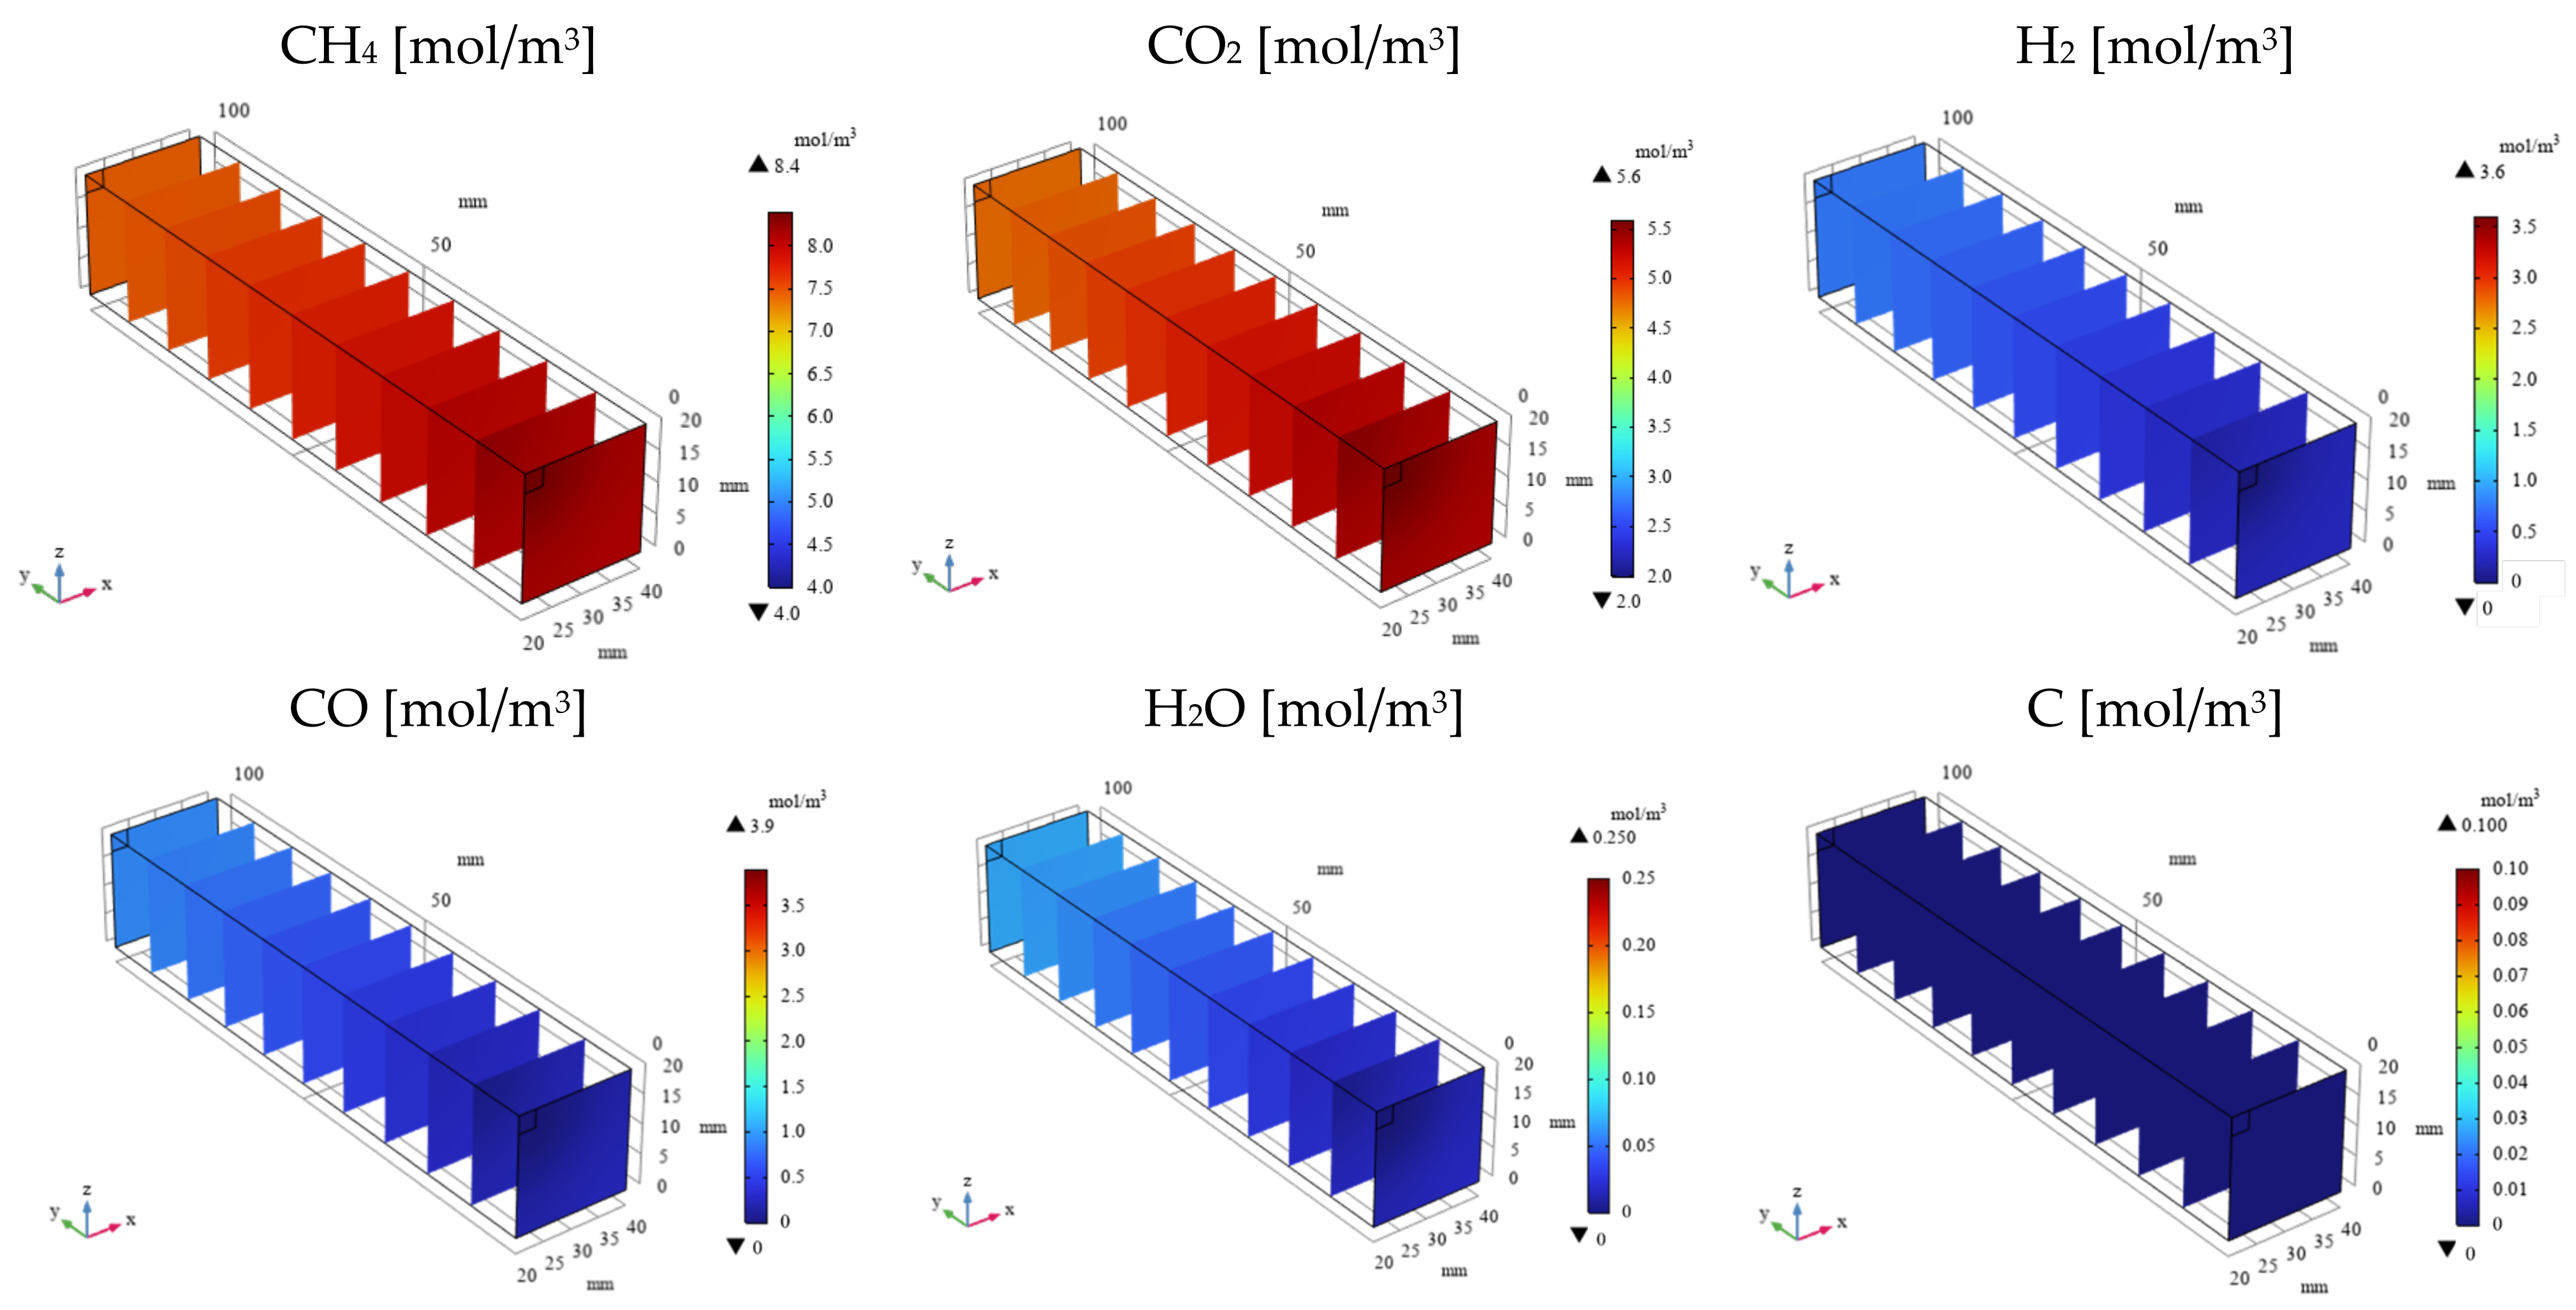
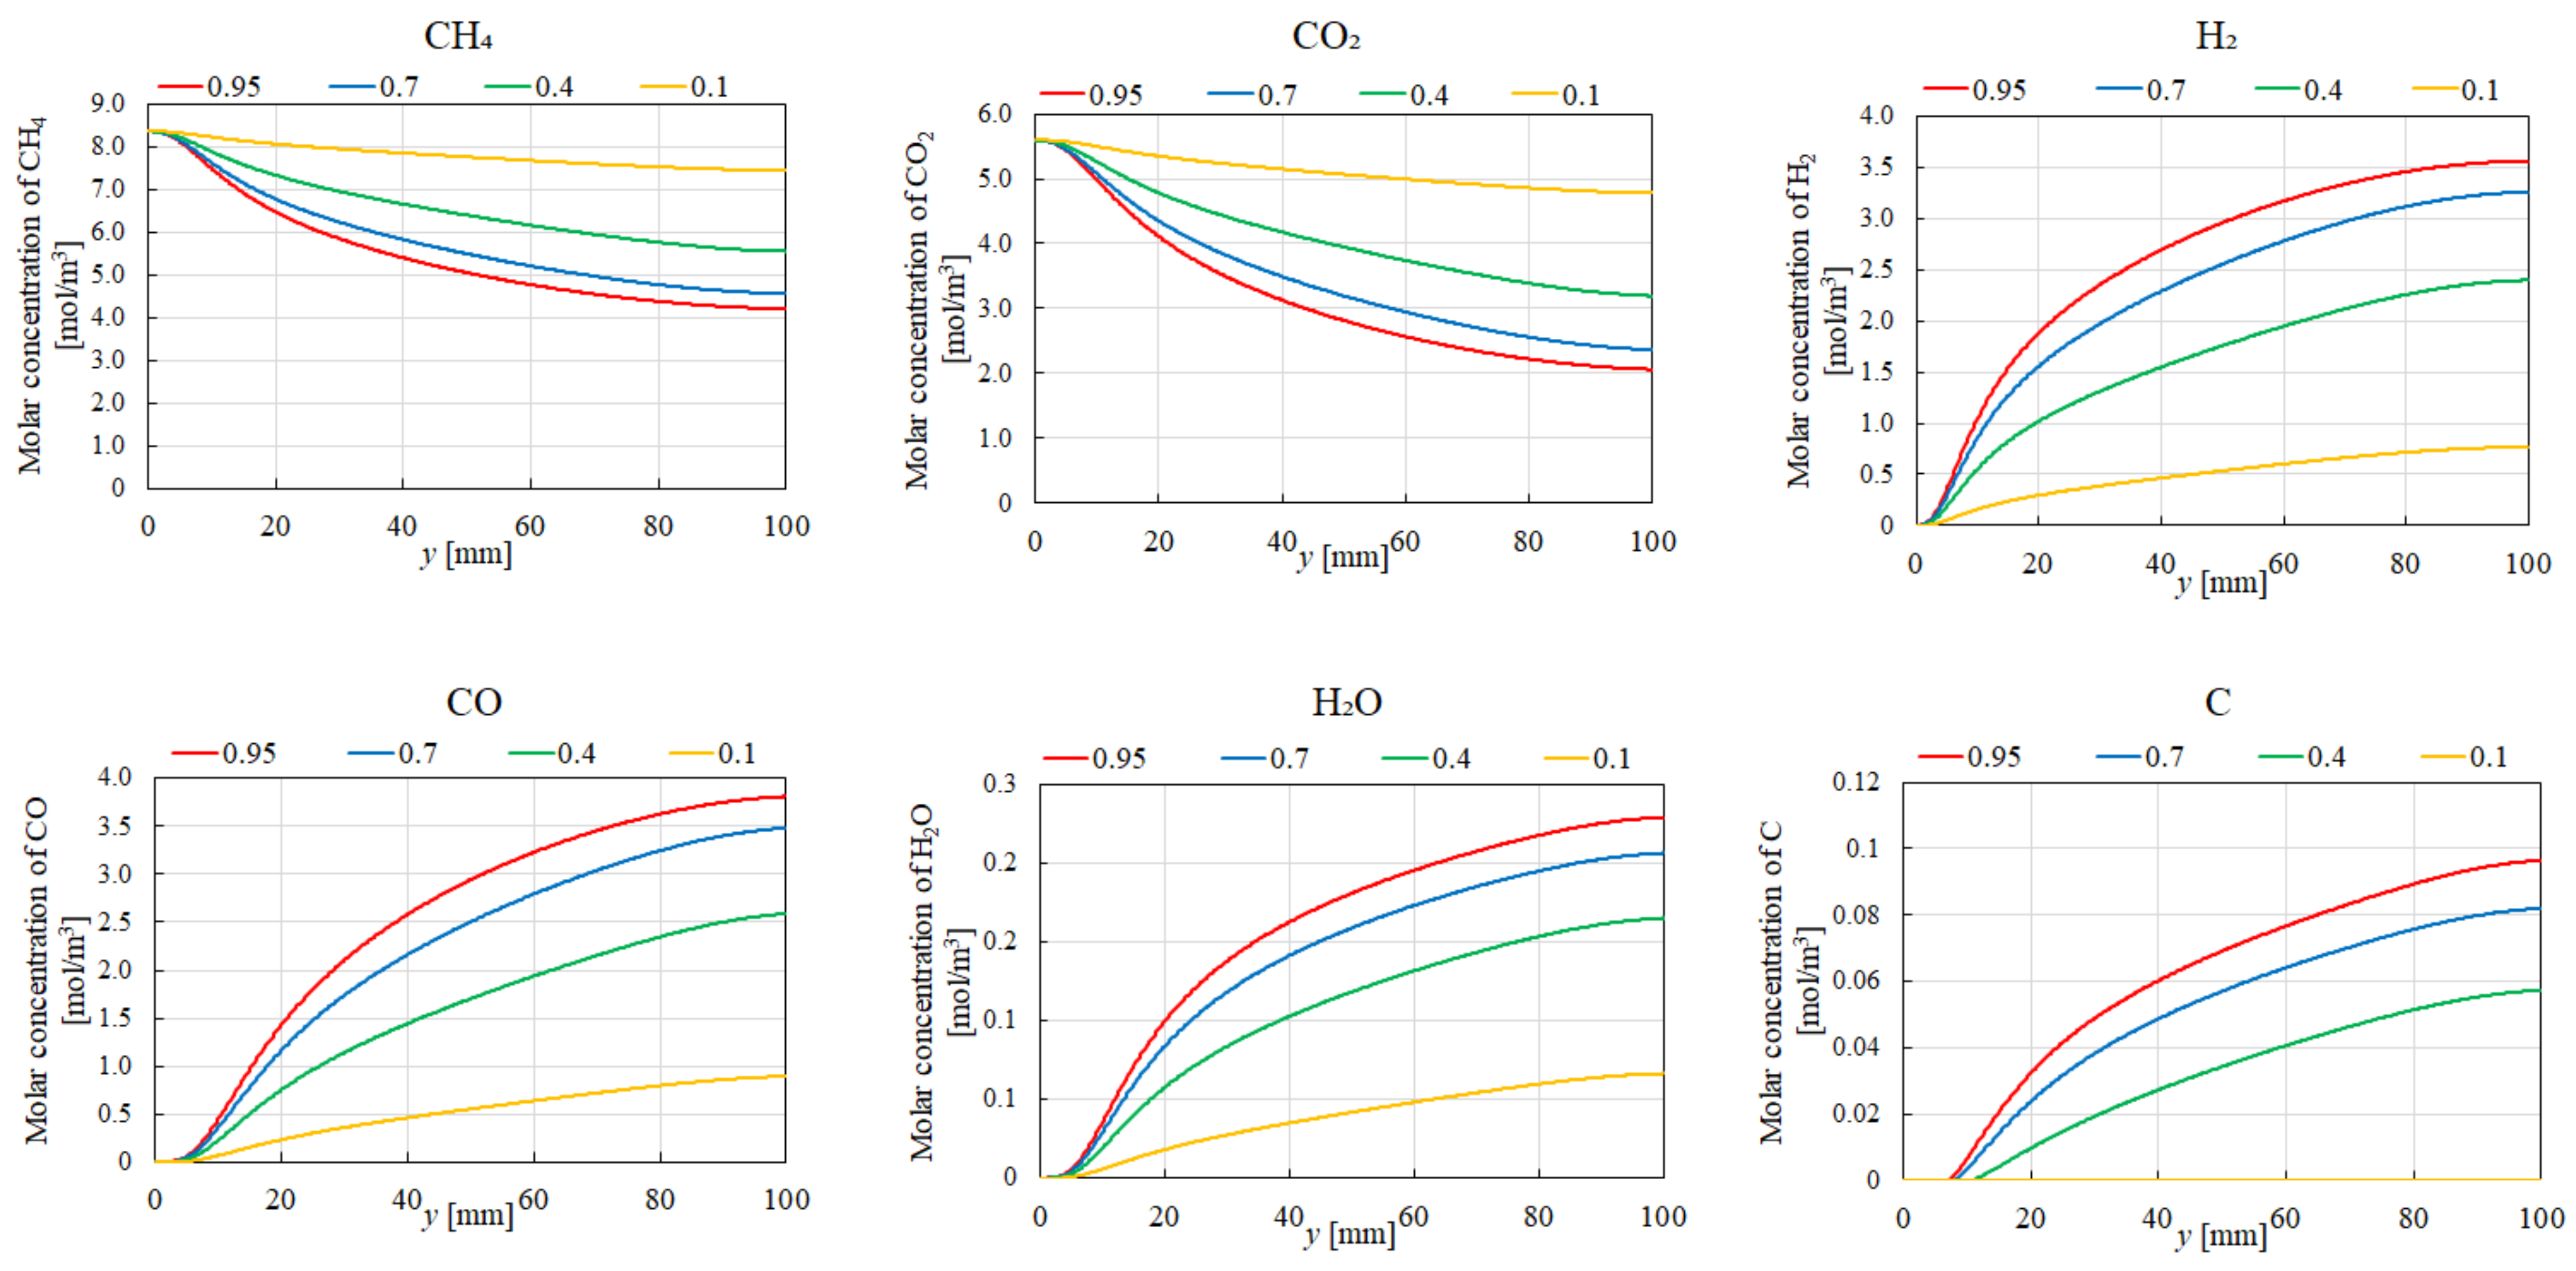
The results indicate that increasing εp leads to a decrease in the molar concentrations of CH4 and CO2 while simultaneously enhancing the molar concentrations of H2, CO, H2O, and C. This enhancement is attributed to the improved mass diffusion within the porous catalyst structure, while it facilitates the progress of the reforming reactions.
ii
A positive correlation is observed between the reaction temperature and the molar concentrations of H2 and CO. The enhancement of H2 and CO production is attributed to the promotion of DR, SR, RWGS, and MR at elevated reaction temperatures.
iii
The results indicate that the influence of εp on the distribution of the molar concentration of all gases increases with rising εp. Notably, the impact of εp on the product species (H2, CO, H2O, and C) is more pronounced near the inlet (y = 20 m), which is similar to the tendency of reactant species (CH4 and CO2).
iv
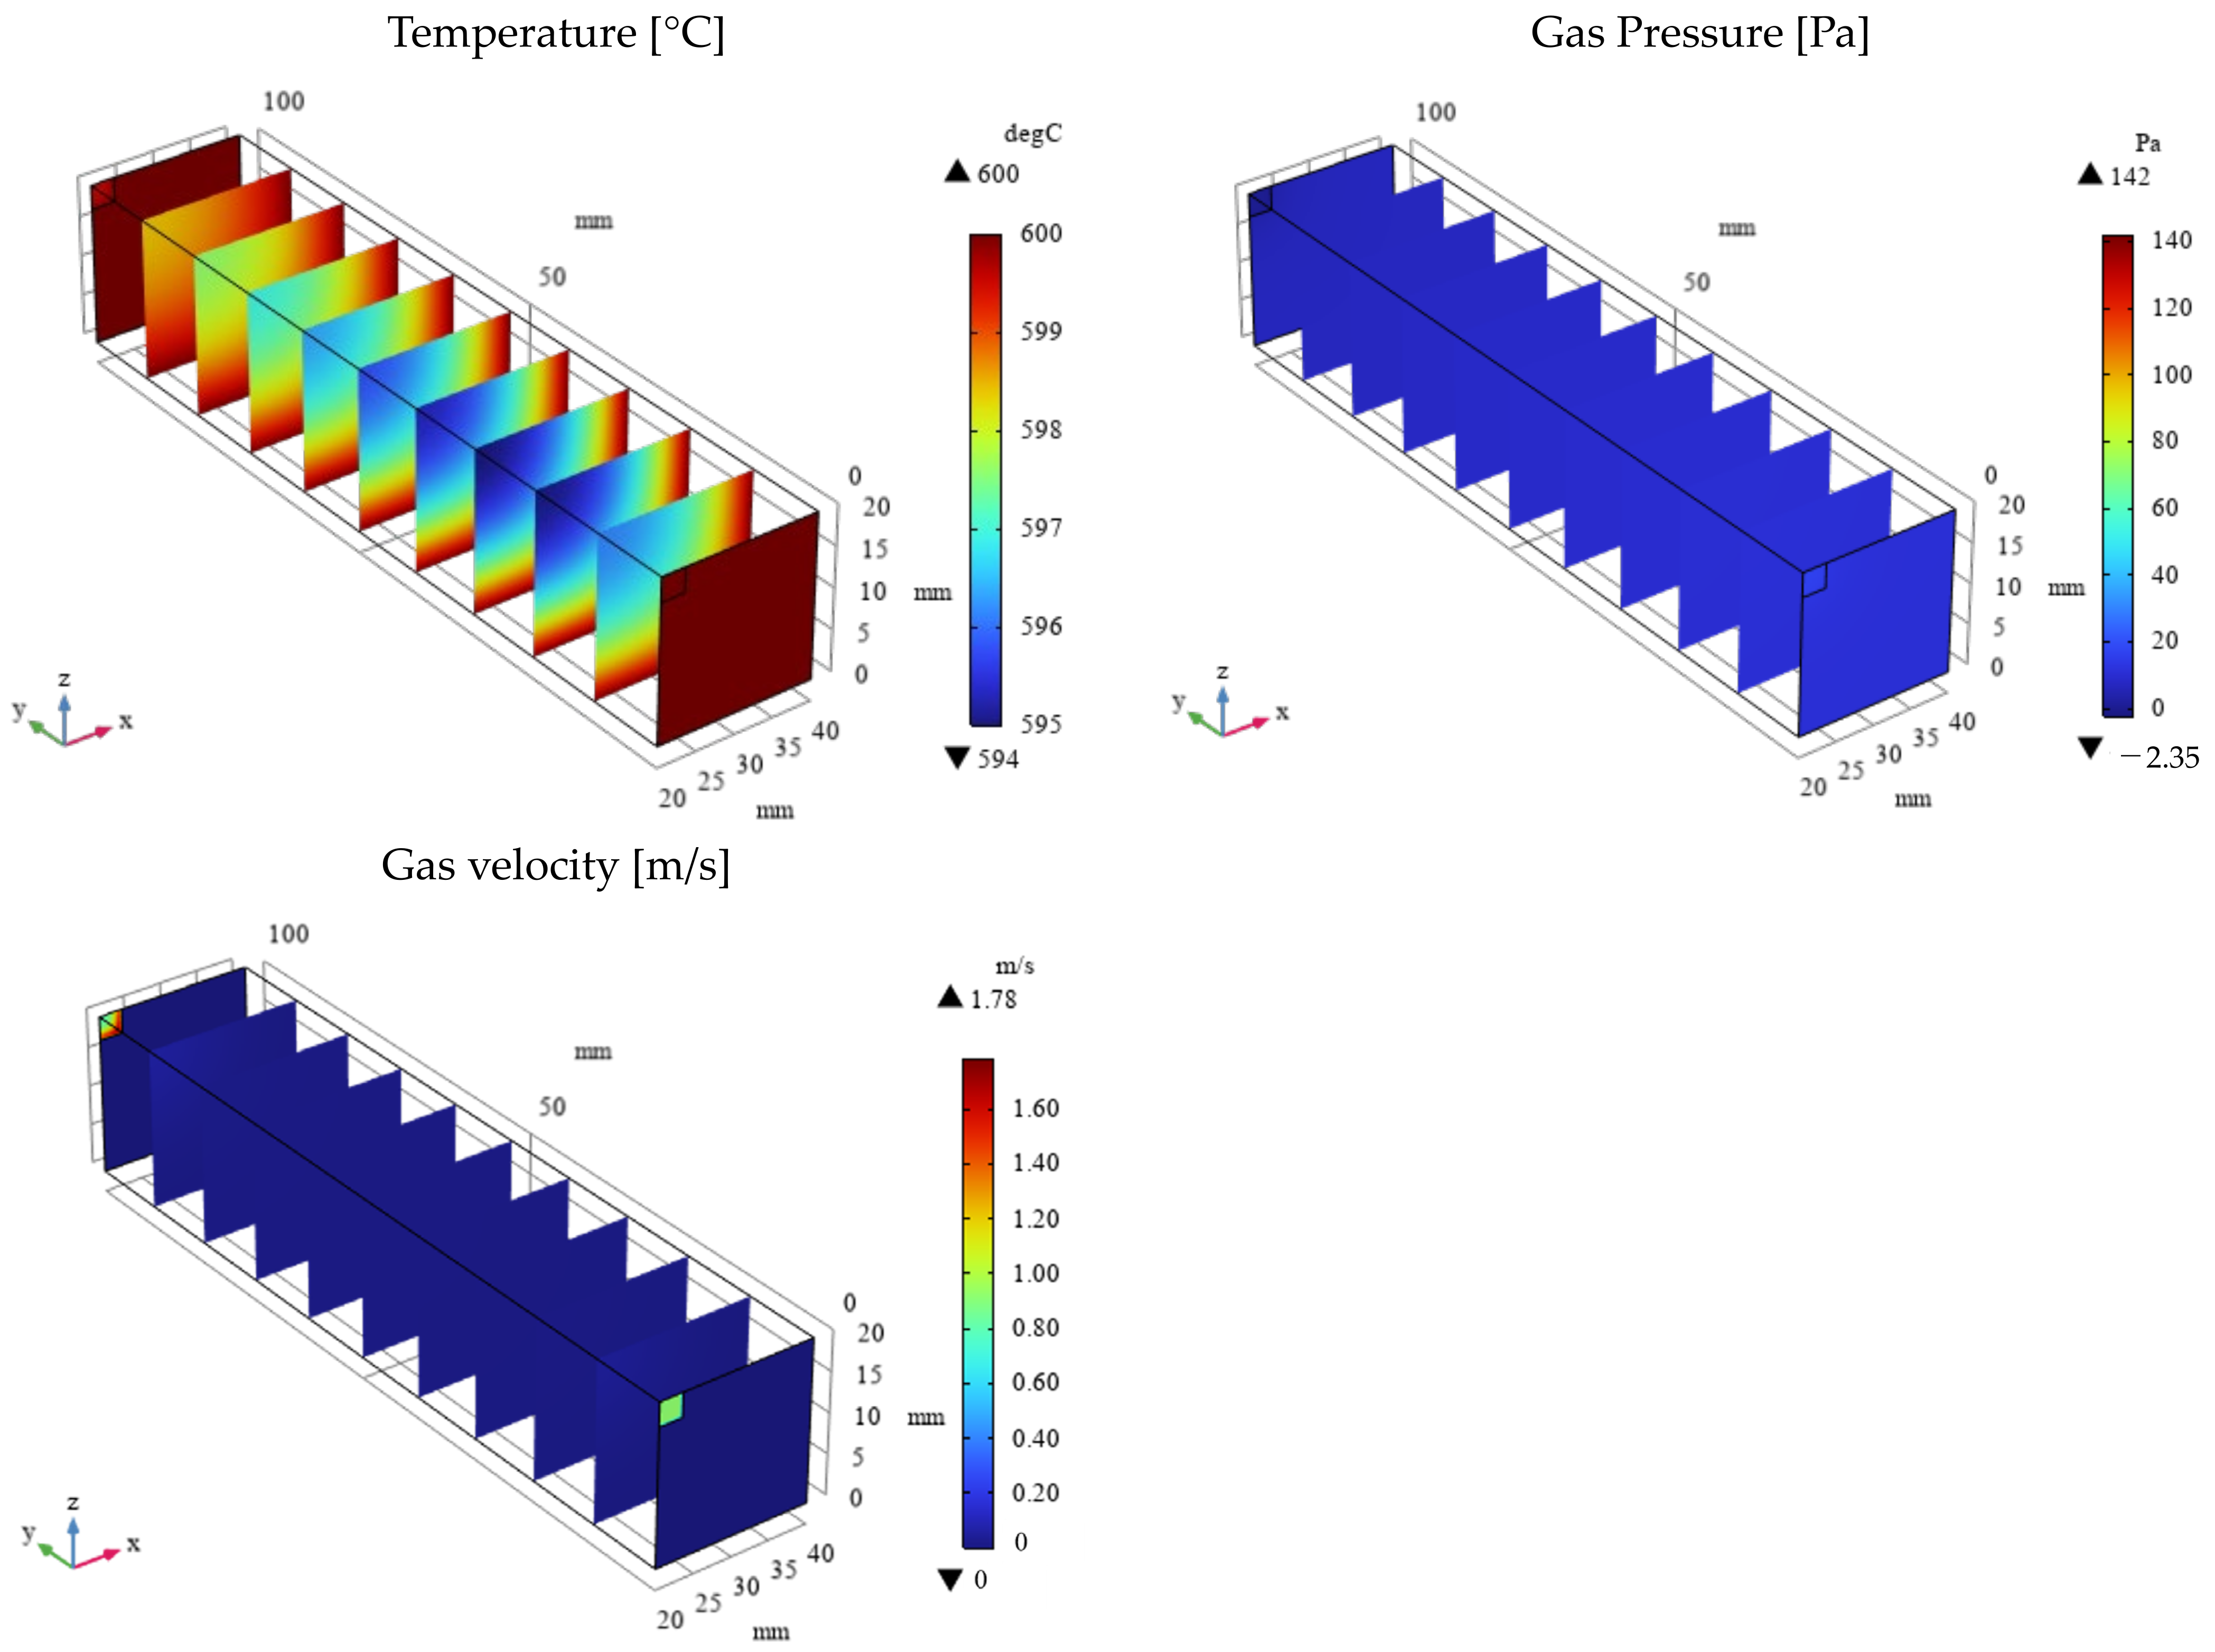
A more pronounced temperature drop near the inlet (y = 20 m) is observed with increasing εp. This phenomenon is attributed to the dominance of the endothermic reactions in this region, which absorb heat from the surroundings, leading to a localized temperature decrease.
v
The highest molar concentrations of H2 and CO2 are consistently obtained for CH4:CO2 = 1:1, regardless of the reaction temperature. This finding aligns with the theoretical stoichiometry of DR, where equal molar amounts of CH4 and CO2 are converted to H2 and CO2. Therefore, the optimal CH4:CO2 for maximizing product yields in BDR is 1:1.
vi
The highest molar concentration of H2O is observed at 700 °C for CH4:CO2 = 1:1.5, whereas the highest molar concentration of H2O at 400 °C occurred with CH4:CO2 = 1:1 and 1:1.5. Additionally, the molar concentration of C is found to be lower at 700 °C compared to 400 °C, suggesting a reduced contribution of BD at higher reaction temperatures.
vii
The results indicate that increasing εp leads to higher CH4 conversion, CO2 conversion, H2 yield, and H2 selectivity. Conversely, CO selectivity decreases with increasing εp. Furthermore, both the numerical simulations and experiments’ data demonstrate a positive correlation between the reaction temperature and H2 yield and H2 selectivity. This enhancement is attributed to the endothermic nature of the reactions producing H2, which are favored at higher reaction temperatures.
viii
This study has revealed the reaction mechanism of BDR and the other reactions as well as the influence of εp on the performance of these reactions by numerical simulation. This study has also revealed the impact of the reaction temperature and molar ratio of CH4:CO2 on the reaction characteristics. The results obtained by this study, e.g., which reaction occurred in the reactor under the different parameters, are novel findings according to the scientific viewpoint. In addition, the optimum molar ratio and reaction temperature have been clarified in this study. These optimum operation conditions are meaningful for practical applications. On the other hand, this study has not conducted a numerical simulation on the BDR membrane reactor, and we would like to conduct this in the near future for a more accurate comparison with the experimental data.

Author Contributions

Conceptualization and writing—original draft preparation, A.N.; methodology and software, S.Y. and R.I.; data curation, M.I. and T.H.; writing—review and editing, M.L.K. All authors have read and agreed to the published version of the manuscript.

Funding

This research was funded by KRI as the 19th bud flush research.

Data Availability Statement

The authors agree to share the data of the article published in this journal.

Conflicts of Interest

The authors declare no conflicts of interest.

References

  1. Kalai, D.Y.; Stangeland, K.; Jin, R.; Tucho, W.M.; Yu, Z. Biogas dry reforming for syngas production on La promoted hydrotalcitederived Ni catalyst. Int. J. Hydrogen Energy 2018, 43, 19438–19450. [Google Scholar] [CrossRef]
  2. World Bioenergy Association. Available online: https://worldbioenergy.org/global-bienergy-statistics (accessed on 19 September 2024).
  3. The Japan Gas Association. Available online: https://www.gas.or.jp/gas-life/biogas/ (accessed on 19 September 2024).
  4. Nishimura, A.; Takada, T.; Ohata, S.; Kolhe, M.L. Biogas dry reforming for hydrogen through membrane reactor utilizing negative pressure. Fuels 2021, 2, 194–209. [Google Scholar] [CrossRef]
  5. Nishimura, A.; Hayashi, Y.; Ito, S.; Kolhe, M.L. Performance analysis of hydrogen production for a solid oxide fuel cell system using a biogas dry reforming membrane reactor with Ni and Ni/Cr catalysts. Fuels 2023, 4, 295–313. [Google Scholar] [CrossRef]
  6. Nishimura, A.; Sato, R.; Hu, E. An energy production system powered by solar heat with biogas dry reforming reactor and solar heat with biogas dry reforming reactor and solid oxide fuel cell. Smart Grid Renew. Energy 2023, 14, 85–106. [Google Scholar] [CrossRef]
  7. Sharma, H.; Dhir, A. Hydrogen augmentation of biogas through dry reforming over bimetallic nickel-cobalt catalysts supported on titania. Fuel 2020, 279, 118389. [Google Scholar] [CrossRef]
  8. Yusuf, M.; Farooqi, A.S.; Keong, L.K.; Hellgardt, K.; Abdullah, B. Contemporary trends in composite Ni-based catalysts for CO2 reforming of methane. Chem. Eng. Sci. 2021, 229, 116072. [Google Scholar] [CrossRef]
  9. Sache, E.L.; Moreno, A.A.; Reina, T.R. Biogas conversion to syngas using advanced Ni-promoted pyrochlore catalysts: Effect of the CH4/CO2 ratio. Front. Chem. 2021, 9, 672419. [Google Scholar] [CrossRef]
  10. Rosset, M.; Feris, L.A.; Perez-Lopez, O.W. Biogas dry reforming using Ni-Al-LDH catalysts reconstructed with Mg and Zn. Int. J. Hydrogen Energy 2021, 46, 20359–20376. [Google Scholar] [CrossRef]
  11. Shah, M.; Modal, P. Optimization of CO2 reforming of methane process for the syngas production over Ni-Ce/TiO2-ZrO2 catalyst using the Taguchi method. Int. J. Hydrogen Energy 2021, 46, 22799–22812. [Google Scholar] [CrossRef]
  12. Moreno, A.A.; Ramirez-Reina, T.; Ivanoya, S.; Roger, A.C.; Centeno, M.A.; Odriozola, J.A. Bimetallic Ni-Ru and Ni-Re catalysts for dry reforming of methane: Understanding the synergies of the selected promoters. Front. Chem. 2021, 9, 694976. [Google Scholar] [CrossRef]
  13. Ha, Q.L.M.; Atia, H.; Kreyenschulte, C.; Lund, H.; Bartling, S.; Lisak, G.; Wohlrab, S.; Armbruster, U. Effects of modifier (Gd, Sc, La) addition on the stability of low Ni content catalyst for dry reforming of model biogas. Fuel 2022, 312, 122823. [Google Scholar] [CrossRef]
  14. Kaviani, M.; Rezaei, M.; Alavi, S.M.; Akbari, E. High coke resistance Ni-SiO2@SiO2 core-shell catalyst for biogas dry reforming: Effects of Ni loading and calcination temperature. Fuel 2022, 330, 125609. [Google Scholar] [CrossRef]
  15. Kaviani, M.; Rezaei, M.; Alavi, S.M.; Akbari, E. Biogas dry reforming over nickel-silica sandwiched core-shell catalysts with various shell thicknesses. Fuel 2024, 355, 129533. [Google Scholar] [CrossRef]
  16. Georgiadis, A.G.; Siakavelas, G.I.; Tsiotsias, A.I.; Charisiou, N.D.; Ehrhardt, B.; Wang, W.; Sebastian, V.; Hinder, S.J.; Baker, M.A.; Mascotto, S.; et al. Biogas dry reforming over Ni/LnOx-type catalysts (Ln = La, Ce, Sm or Pr). Int. J. Hydrogen Energy 2023, 48, 19953–19971. [Google Scholar] [CrossRef]
  17. Chava, R.; Varma, D.B.A.; Roy, B.; Appari, S. Recent advances and perspectives of perovskite-derived Ni-based catalysts for CO2 reforming of biogas. J. CO2 Util. 2022, 65, 102206. [Google Scholar] [CrossRef]
  18. Nishimura, A.; Ichikawa, M.; Yamada, S.; Ichii, R. The characteristics of a Ni/Cu/Ru catalyst for a biogas dry reforming membrane reactor using a Pd/Cu membrane and a comparison of it with a Ni/Cr catalyst. Hydrogen 2024, 5, 414–435. [Google Scholar] [CrossRef]
  19. Lee, S.; Lim, H. The power of molten salt in methane dry reforming: Conceptual design with a CFD study. Chem. Eng. Process.-Process Intensif. 2021, 159, 108230. [Google Scholar] [CrossRef]
  20. Lee, S.; Lim, H. The effect of changing the number of membranes in methane carbon dioxide reforming: A CFD study. J. Ind. Eng. Chem. 2020, 87, 110–119. [Google Scholar] [CrossRef]
  21. Ghasemzadeh, K.; Ghahremani, M.; Amiri, T.Y.; Basile, A. Performance evaluation of Pd-Ag membrane reactor in glyceol steam reforming process: Development of the CFD model. Int. J. Hydrogen Energy 2019, 44, 1000–1009. [Google Scholar] [CrossRef]
  22. Lee, B.; Lee, S.; Lim, H. Numerical modeling studies for a methane dry reforming in a membrane reactor. J. Nat. Gas Sci. Eng. 2016, 34, 1251–1261. [Google Scholar] [CrossRef]
  23. Nishimura, A.; Mishima, D.; Ito, S.; Konbu, T.; Hu, E. Impact of separator thickness on relationship between temperature distribution and mass & current density distribution in single HT-PEMFC. Therm. Sci. Eng. 2023, 6, 4424. [Google Scholar] [CrossRef]
  24. Amini, A.; Sedaghat, M.H.; Jamshidi, S.; Shariati, A.; Rahimpour, M.R. A comprehensive CFD simulation of an industrial-scale side-fired steam methane reformer to enhance hydrogen production. Chem. Eng. Process. 2023, 184, 109269. [Google Scholar] [CrossRef]
  25. Benguerbaa, Y.; Virginieb, M.; Dumas, C. Computational fluid dynamics study of the dry reforming of methane over Ni/Al2O3 catalyst in membrane reactor—Coke deposition. Kinet. Catal. 2017, 58, 345–355. [Google Scholar] [CrossRef]
  26. Albano, M.; Madeira, L.M.; Miguel, C.V. Use of Pd-Ag membrane reactors for low-temperature dry reforming of biogas—A simulation study. Membranes 2023, 13, 630. [Google Scholar] [CrossRef]
  27. Jokar, S.M.; Farokhnia, A.; Tavakolian, M.; Pejman, M.; Parvasi, P.; Javanmardi, J.; Zare, F.; Gonqalves, M.C.; Basile, A. The recent areas of applicability of palladium based membrane technologies for hydrogen production from methane and natural gas: A review. Int. J. Hydrogen Energy 2023, 48, 6451–6476. [Google Scholar] [CrossRef]
  28. Wang, B.; Lu, X.; Lundin, S.T.B.; Kong, H.; Wang, J.; Su, B.; Wang, H. Thermodynamics analysis and optimization of solar methane dry reforming enhanced by chemical hydrogen separation. Energy Convers. Manag. 2022, 268, 116050. [Google Scholar] [CrossRef]
  29. Osat, M.; Shojaati, F. Development of a trireforming fluidized bed reactor with a hydrogen permselective membrane. Chem. Eng. Technol. 2022, 45, 824–833. [Google Scholar] [CrossRef]
Figure 1. 3D model structure of the numerical simulation in this study (left: full scale, right: actual numerical simulation scale, i.e., 1/4 scale compared to the full scale).
Energies 17 05421 g001
Figure 2. Front view of the 3D model (left: full scale, right: actual numerical simulation scale, i.e., 1/4 scale compared to the full scale).
Energies 17 05421 g002
Figure 3. 3D distribution of molar concentrations of CH4, CO2, H2, CO, H2O, and C in the reactor (εp = 0.95).
Energies 17 05421 g003
Figure 4. 3D distribution of molar concentrations of CH4, CO2, H2, CO, H2O, and C in the reactor (εp = 0.1).
Energies 17 05421 g004
Figure 5. 3D distribution of temperature, gas pressure, and gas velocity in the reactor (εp = 0.95).
Energies 17 05421 g005
Figure 6. 3D distribution of temperature, gas pressure, and gas velocity in the reactor (εp = 0.1).
Energies 17 05421 g006
Figure 7. Impact of εp on the distribution of molar concentrations of CH4, CO2, H2, CO, H2O, and C in the case of CH4:CO2 = 1.5:1 at 400 °C.
Energies 17 05421 g007
Figure 8. Impact of εp on the distribution of molar concentrations of CH4, CO2, H2, CO, H2O, and C in the case of CH4:CO2 = 1.5:1 at 500 °C.
Energies 17 05421 g008
Figure 9. Impact of εp on the distribution of molar concentrations of CH4, CO2, H2, CO, H2O, and C in the case of CH4:CO2 = 1.5:1 at 600 °C.
Energies 17 05421 g009
Figure 10. Impact of εp on the distribution of molar concentrations of CH4, CO2, H2, CO, H2O, and C in the case of CH4:CO2 = 1.5:1 at 700 °C.
Energies 17 05421 g010
Figure 11. Impact of εp on the distributions of molar concentration of each gas in the case of CH4:CO2 = 1.5:1 at 600 °C.
Energies 17 05421 g011
Figure 12. Impact of εp on the distribution of temperature in the case of CH4:CO2 = 1.5:1 at 600 °C.
Energies 17 05421 g012
Figure 13. Impact of the molar ratio of CH4:CO2 on the distribution of the molar concentrations of CH4, CO2, H2, CO, H2O, and C at 400 °C.
Energies 17 05421 g013
Figure 14. Impact of the molar ratio of CH4:CO2 on the distribution of the molar concentrations of CH4, CO2, H2, CO, H2O, and C at 700 °C.
Energies 17 05421 g014
Table 1. Numerical simulation conditions.
Initial reaction temperature [°C]400, 500, 600
Pressure in reactor [Pa]1.013 × 10⁵
Inlet flow rate of CH4 [NL/min]
(CH4:CO2 = 1.5:1, 1:1, 1:1.5)
1.088, 0.725, 0.725
Inlet flow rate of CO2 [NL/min]
(CH4:CO2 = 1.5:1, 1:1, 1:1.5)
0.725, 0.725, 1.088
Outlet pressure [Pa]1.013 × 10⁵
Density of the catalyst [kg/m3]8901, 8752, 8709, 8664, 8619
(@20 °C, 400 °C, 500 °C, 600 °C, 700 °C)
Porosity of the catalyst (εp) [-]0.95, 0.7, 0.4, 0.1
Permeability of the catalyst [m2]1.9 × 10⁻⁸, 1.4 × 10⁻⁸, 8.0 × 10⁻⁹, 2.0 × 10⁻⁹
(εp = 0.95, 0.7, 0.4, 0.1)
Constant pressure-specific heat of the catalyst [J/(kg·K)]458, 558, 551, 541, 538
(@20 °C, 400 °C, 500 °C, 600 °C, 700 °C)
Thermal conductivity of the catalyst [W/(m·K)]91.2, 65.3, 66.5, 69.1, 72.2
(@20 °C, 400 °C, 500 °C, 600 °C, 700 °C)
Apparent density of the catalyst bed in the reactor [kg/m3]418, 2504, 5008, 7511
(εp = 0.95, 0.7, 0.4, 0.1)
Apparent thermal conductivity of the catalyst bed in the reactor [W/(m·K)]3.5, 20.9, 41.7, 62.5
(εp = 0.95, 0.7, 0.4, 0.1)
Table 2. Comparison of CH4 conversion, CO2 conversion, H2 yield, H2 selectivity, and CO selectivity among different εp values in the case of CH4:CO2 = 1.5:1 at 600 °C.
εp [-]CH4 Conversion [%]CO2 Conversion [%]H2 Yield [%]H2 Selectivity [%]CO Selectivity [%]
0.9549.963.521.348.251.8
0.745.658.219.548.151.9
0.433.843.314.347.852.2
0.111.114.84.645.954.1
Table 3. Comparison of CH4 conversion, CO2 conversion, H2 yield, H2 selectivity, and CO selectivity among different temperatures in the case of CH4:CO2 = 1.5:1 (based on numerical simulation data).
Reaction Temperature [°C]CH4 Conversion [%]CO2 Conversion [%]H2 Yield [%]H2 Selectivity [%]CO Selectivity [%]
4002.12.70.848.052.0
50016.221.06.547.152.9
60049.963.521.348.251.8
70074.492.133.249.450.6
Table 4. Comparison of CH4 conversion, CO2 conversion, H2 yield, H2 selectivity, and CO selectivity among different temperatures in the case of CH4:CO2 = 1.5:1 (based on experimental data).
Reaction Temperature [°C]CH4 Conversion [%]CO2 Conversion [%]H2 Yield [%]H2 Selectivity [%]CO Selectivity [%]
40024.1−29.70.090.1699.8
5008.24−3.081.012.0997.9
60012.70.084.487.2492.8
Disclaimer/Publisher’s Note: The statements, opinions and data contained in all publications are solely those of the individual author(s) and contributor(s) and not of MDPI and/or the editor(s). MDPI and/or the editor(s) disclaim responsibility for any injury to people or property resulting from any ideas, methods, instructions or products referred to in the content.

