Abstract
The influence of carrier mobility on the space charge transport behavior inside the oil-impregnated pressboard insulation of converter transformers cannot be neglected. However, at present, current knowledge is usually derived from empirical or theoretical values, lacks experimental studies, and often ignores the effects of temperature and field strength under actual operating conditions. In this paper, based on the variable-temperature surface potential decay (SPD) method, a carrier mobility measurement platform for oil-impregnated pressboard is established, and the carrier mobility values for different combinations of oil and oil-impregnated pressboard are obtained experimentally to analyze and reveal the influence mechanisms of temperature and field strength on the carrier mobility. The results indicate the following: (1) The positive and negative carrier mobilities of oil-impregnated pressboard are in the range of 10−12–10−13 m2·V−1·s−1, and the negative carrier mobility is always higher than the positive carrier mobility. (2) The carrier mobility is positively correlated with the changes of temperature and field strength, and when the temperature increases from 20 °C to 80 °C, the positive and negative carrier mobilities increase by 4.01 times and 4.72 times, respectively; when the field strength increases from 1 kV/mm to 7 kV/mm, the positive and negative carrier mobility increases by 2.53 and 2.72 times, respectively. (3) The carrier mobility of the pressboard with a higher oil absorption rate changes more significantly with temperature; when the field strength is 7 kV/mm and the temperature increases from 20 °C to 80 °C, the positive polarity carrier mobility increases from 3.96 × 10⁻¹³ m2·V−1·s−1 to 2.64 × 10⁻¹¹ m2·V−1·s−1, an increase of 66.67 times, while the increase in the carrier mobility of the pressboard with a lower oil absorption rate is only 1.59 times. (4) The carrier mobility of the naphthenic transformer oil-impregnated pressboard is higher than that of the paraffin-based transformer oil-impregnated pressboard, and the carrier mobility of two kinds of naphthenic transformer oil-impregnated pressboard is 3.16 times and 2.47 times higher than that of the paraffin-based transformer oil-impregnated pressboard, respectively, under the conditions of 60 °C and 7 kV/mm. (5) Utilizing the Darcy model and microscopic scanning results of the pressboard morphology, it was revealed that permeability and fiber structure are key factors influencing the variation in carrier mobility. The research results of this paper can provide theoretical basis for the calibration and optimization of the oil-pressboard insulation structure of converter transformers.
1. Introduction
The insulation structure of converter transformers predominantly comprises insulating oil and a high-density electrical pressboard. The accurate and reliable computation of the internal insulation electric field provides a robust theoretical basis for the verification and optimization of insulation structures [1]. Currently, the majority of studies employ relatively simplistic methodologies for calculating the internal electric field within oil–paper insulation systems, typically utilizing the R–C (resistance–capacitance) model. However, substantial discrepancies arise between the outcomes derived from the R–C model and the actual operating conditions under a DC voltage [2].
Wu investigated an oil–paper insulation configuration featuring a single oil gap, employing the Kerr electro-optic effect to empirically determine the spatiotemporal distribution of the electric field within oil under a DC voltage. They discovered that the marked deviation between the measured electric field and the results computed by the R–C model was attributed to the distortion effect induced by charge accumulation at the oil–paper interface under the DC voltage. Furthermore, their findings indicated that the electric field in the oil exhibited distinct polarity effects, which could not be elucidated by the R–C model. The primary reason for this limitation is that the R–C model fails to account for the generation, migration, and localized accumulation of space charges within insulating materials, thereby being unable to replicate the electric field distortion engendered by space charge accumulation [3,4,5,6,7]. The bipolar charge carrier model and ion drift model, which serve as prevailing explanations for charge transport, are applicable to high-field, small-scale scenarios and low-field, large-scale scenarios, respectively [8]. Nevertheless, critical simulation parameters in these charge models, such as carrier mobility, are often based on empirical or theoretical values while disregarding the influence of temperature, electric field intensity, and other factors on carrier mobility, thereby leading to significant computational inaccuracies [9,10,11,12].
Currently, the predominant technique for determining carrier mobility in dielectric materials is the time-of-flight (TOF) method. Under an applied electric field, ions migrate towards electrodes of opposite polarity, forming a current with a waveform that exhibits a peak, where a temporal delay exists between the current peak and the excitation signal. This temporal interval is used to calculate carrier mobility within the oil [13]. However, the TOF method is restricted to mobility measurements under low electric field strengths, typically below 150 V/mm, which falls significantly short of the electric field strengths encountered by oil–paper insulation materials in practical operational scenarios. G.C. and G.M. employed the space-charge-limited current (SCLC) technique to investigate the mechanisms of charge injection, transport, and trapping within low-density polyethylene (LDPE), high-density polyethylene (HDPE), and cross-linked polyethylene (XLPE). Their findings demonstrated that the carrier mobility in LDPE surpasses that in XLPE and HDPE. However, the applicability of this method is contingent upon the fulfillment of the conditions under which the SCLC theory is valid, and experimental evidence has shown that the SCLC does not predominate electrical conduction in most instances [14]. Wu utilized the pulsed electroacoustic (PEA) technique to quantify the carrier mobility of a transformer oil-impregnated insulation pressboard under varying temperatures and electric field strengths. The results revealed that the carrier mobility within the oil-impregnated insulation pressboard exhibits temperature dependence, with the mobility of positive charge carriers being more significantly affected by temperature variations [15,16]. Li employed the surface potential decay (SPD) method to investigate carrier mobility in silicone gel under different temperatures, demonstrating a positive correlation between carrier mobility and temperature [17,18].
This paper proposes a novel approach for measuring carrier mobility in oil-impregnated pressboards based on the SPD technique. The mobility characteristics of positive and negative charge carriers within various transformer oil-electrical pressboard combinations were obtained, elucidating the mechanisms by which temperature and electric field strength influence carrier mobility. The findings contribute valuable theoretical insights and technical support for the computation and verification of internal electric fields within oil–paper insulation structures in converter transformers.
2. Carrier Mobility Measurement Platform for Oil-Impregnated Pressboard
2.1. Measuring Principle
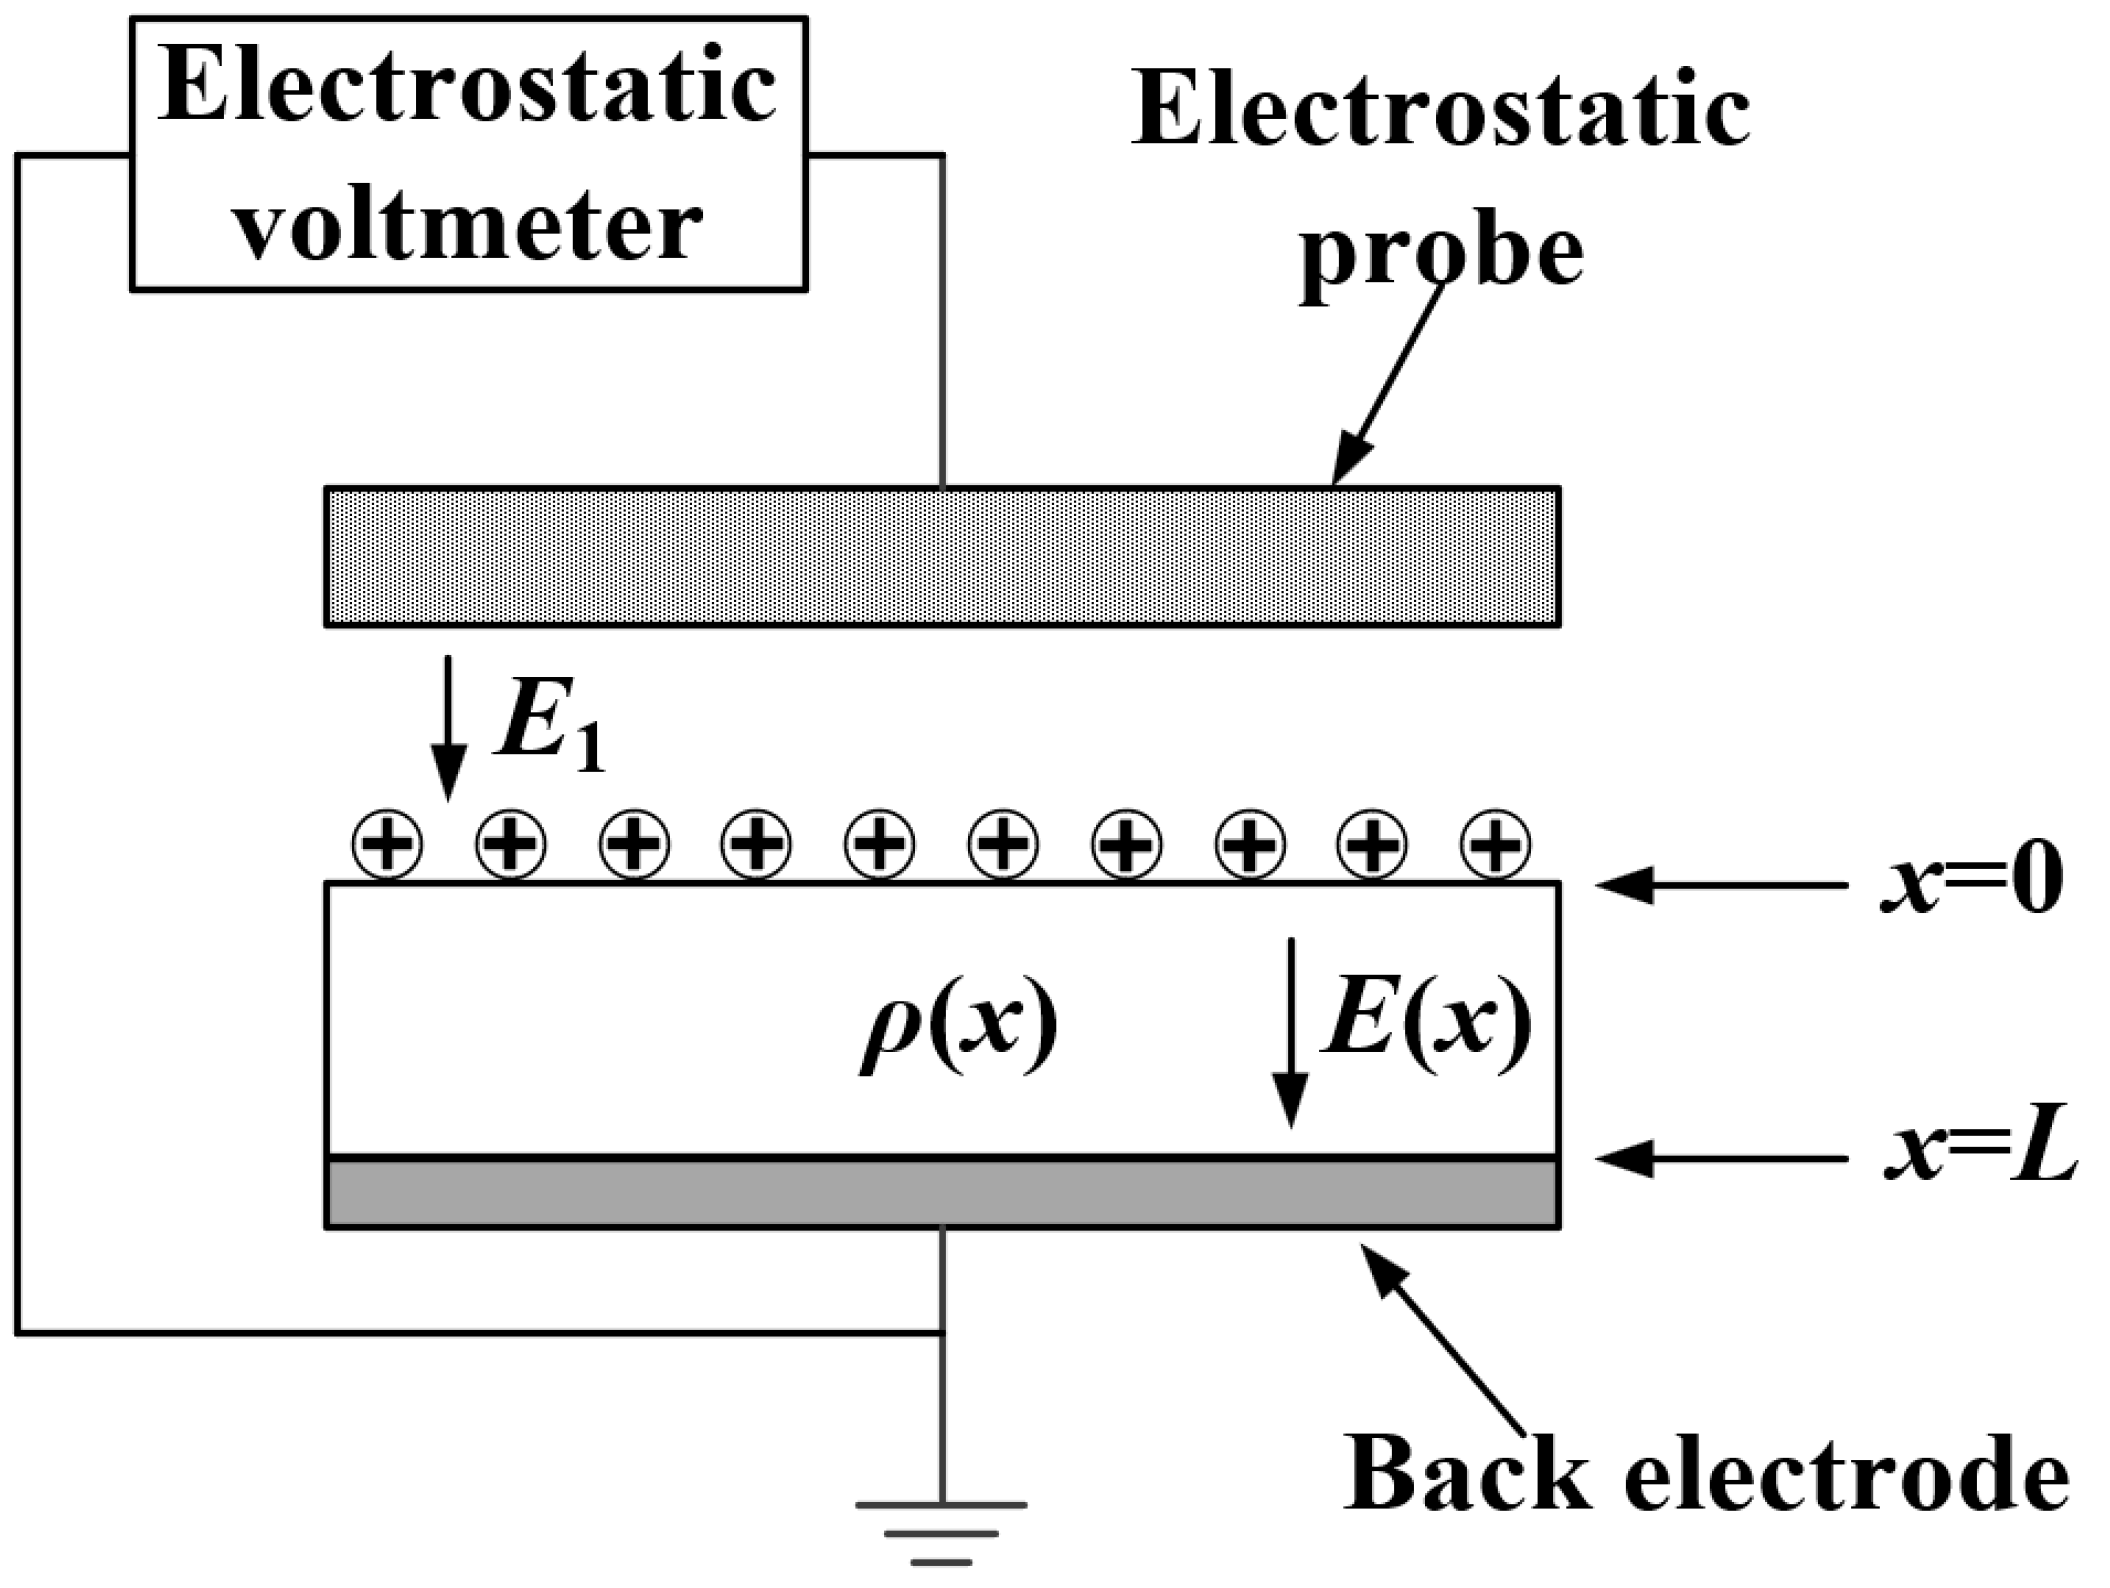
In the process of charge migration, the fundamental laws of electromagnetism are consistently adhered to. Therefore, the relationship between the surface potential decay rate and carrier mobility μ can be derived from the Poisson equation and the current continuity equation. When the surface of the oil–paper insulation carries positive charges, a Kelvin-type probe can be employed to measure the surface potential. As depicted in Figure 1, the probe and the measurement point share the same potential, which implies that the electric field strength in the air gap E1 is zero.
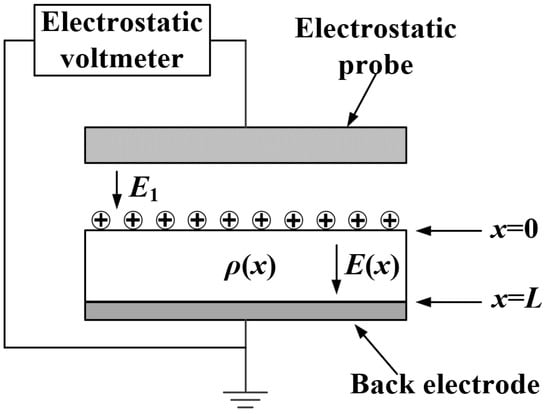
Figure 1.
Schematic diagram of surface potential measurement circuit and electric field distribution.
When t is zero, the surface potential and electric field intensity are US0 and ES0, respectively. According to the Poisson equation, when the trap charge ρ(x) is uniformly distributed within the material, US0 and ES0 are given by Equations (1) and (2).
where σ is the surface charge density, ε is the permittivity of the material, ρ is the volume charge density, and L is the distance between the electrodes.
At time t, the free charge, trap charge, and electric field intensity in the oil–paper insulation are represented by ρf(x,t), ρt(x,t), and E(x,t), respectively. According to the Poisson equation,
Assuming that during the decay of surface potential, the relationship between the displacement current and conduction current is as shown in Equation (4).
where μ is the carrier mobility.
By combining Equations (3) and (4) to eliminate the free charge ρf(x,t),
When t is zero, it is assumed that all surface charges are injected into the oil–paper insulation, as shown in Equation (6).
When the trap charge ρt(x,t) is uniformly distributed, integrating Equation (5) under the condition of Equation (6) gives the following:
where E(L,t) is the electric field intensity at the back electrode.
If the space charge has not yet reached the back electrode,
where tT is the space charge transit time.
Assuming there is no trap charge inside the oil–paper insulation, ρt = 0, combining Equations (7) and (8) provides the following:
When the space charge reaches the back electrode (t ≥ tT), the carrier mobility can be calculated as shown in Equation (10), and substituting Equation (10) into Equation (7) is shown in Equation (11).
From Equations (9) and (11), it is known that when the charge has not reached the back electrode, 0 ≤ t ≤ tT, lg(|dUS/dt|) is a constant; when the charge reaches the back electrode, t ≥ tT, lg(|dUS/dt|) is a linear function of lg(t). Therefore, the point t = tT is considered the inflection point of the lg(|dUS/dt|) versus lg(t) curve, and the mobility μ at this point is calculated as shown in Equation (12).
2.2. Measuring Platform
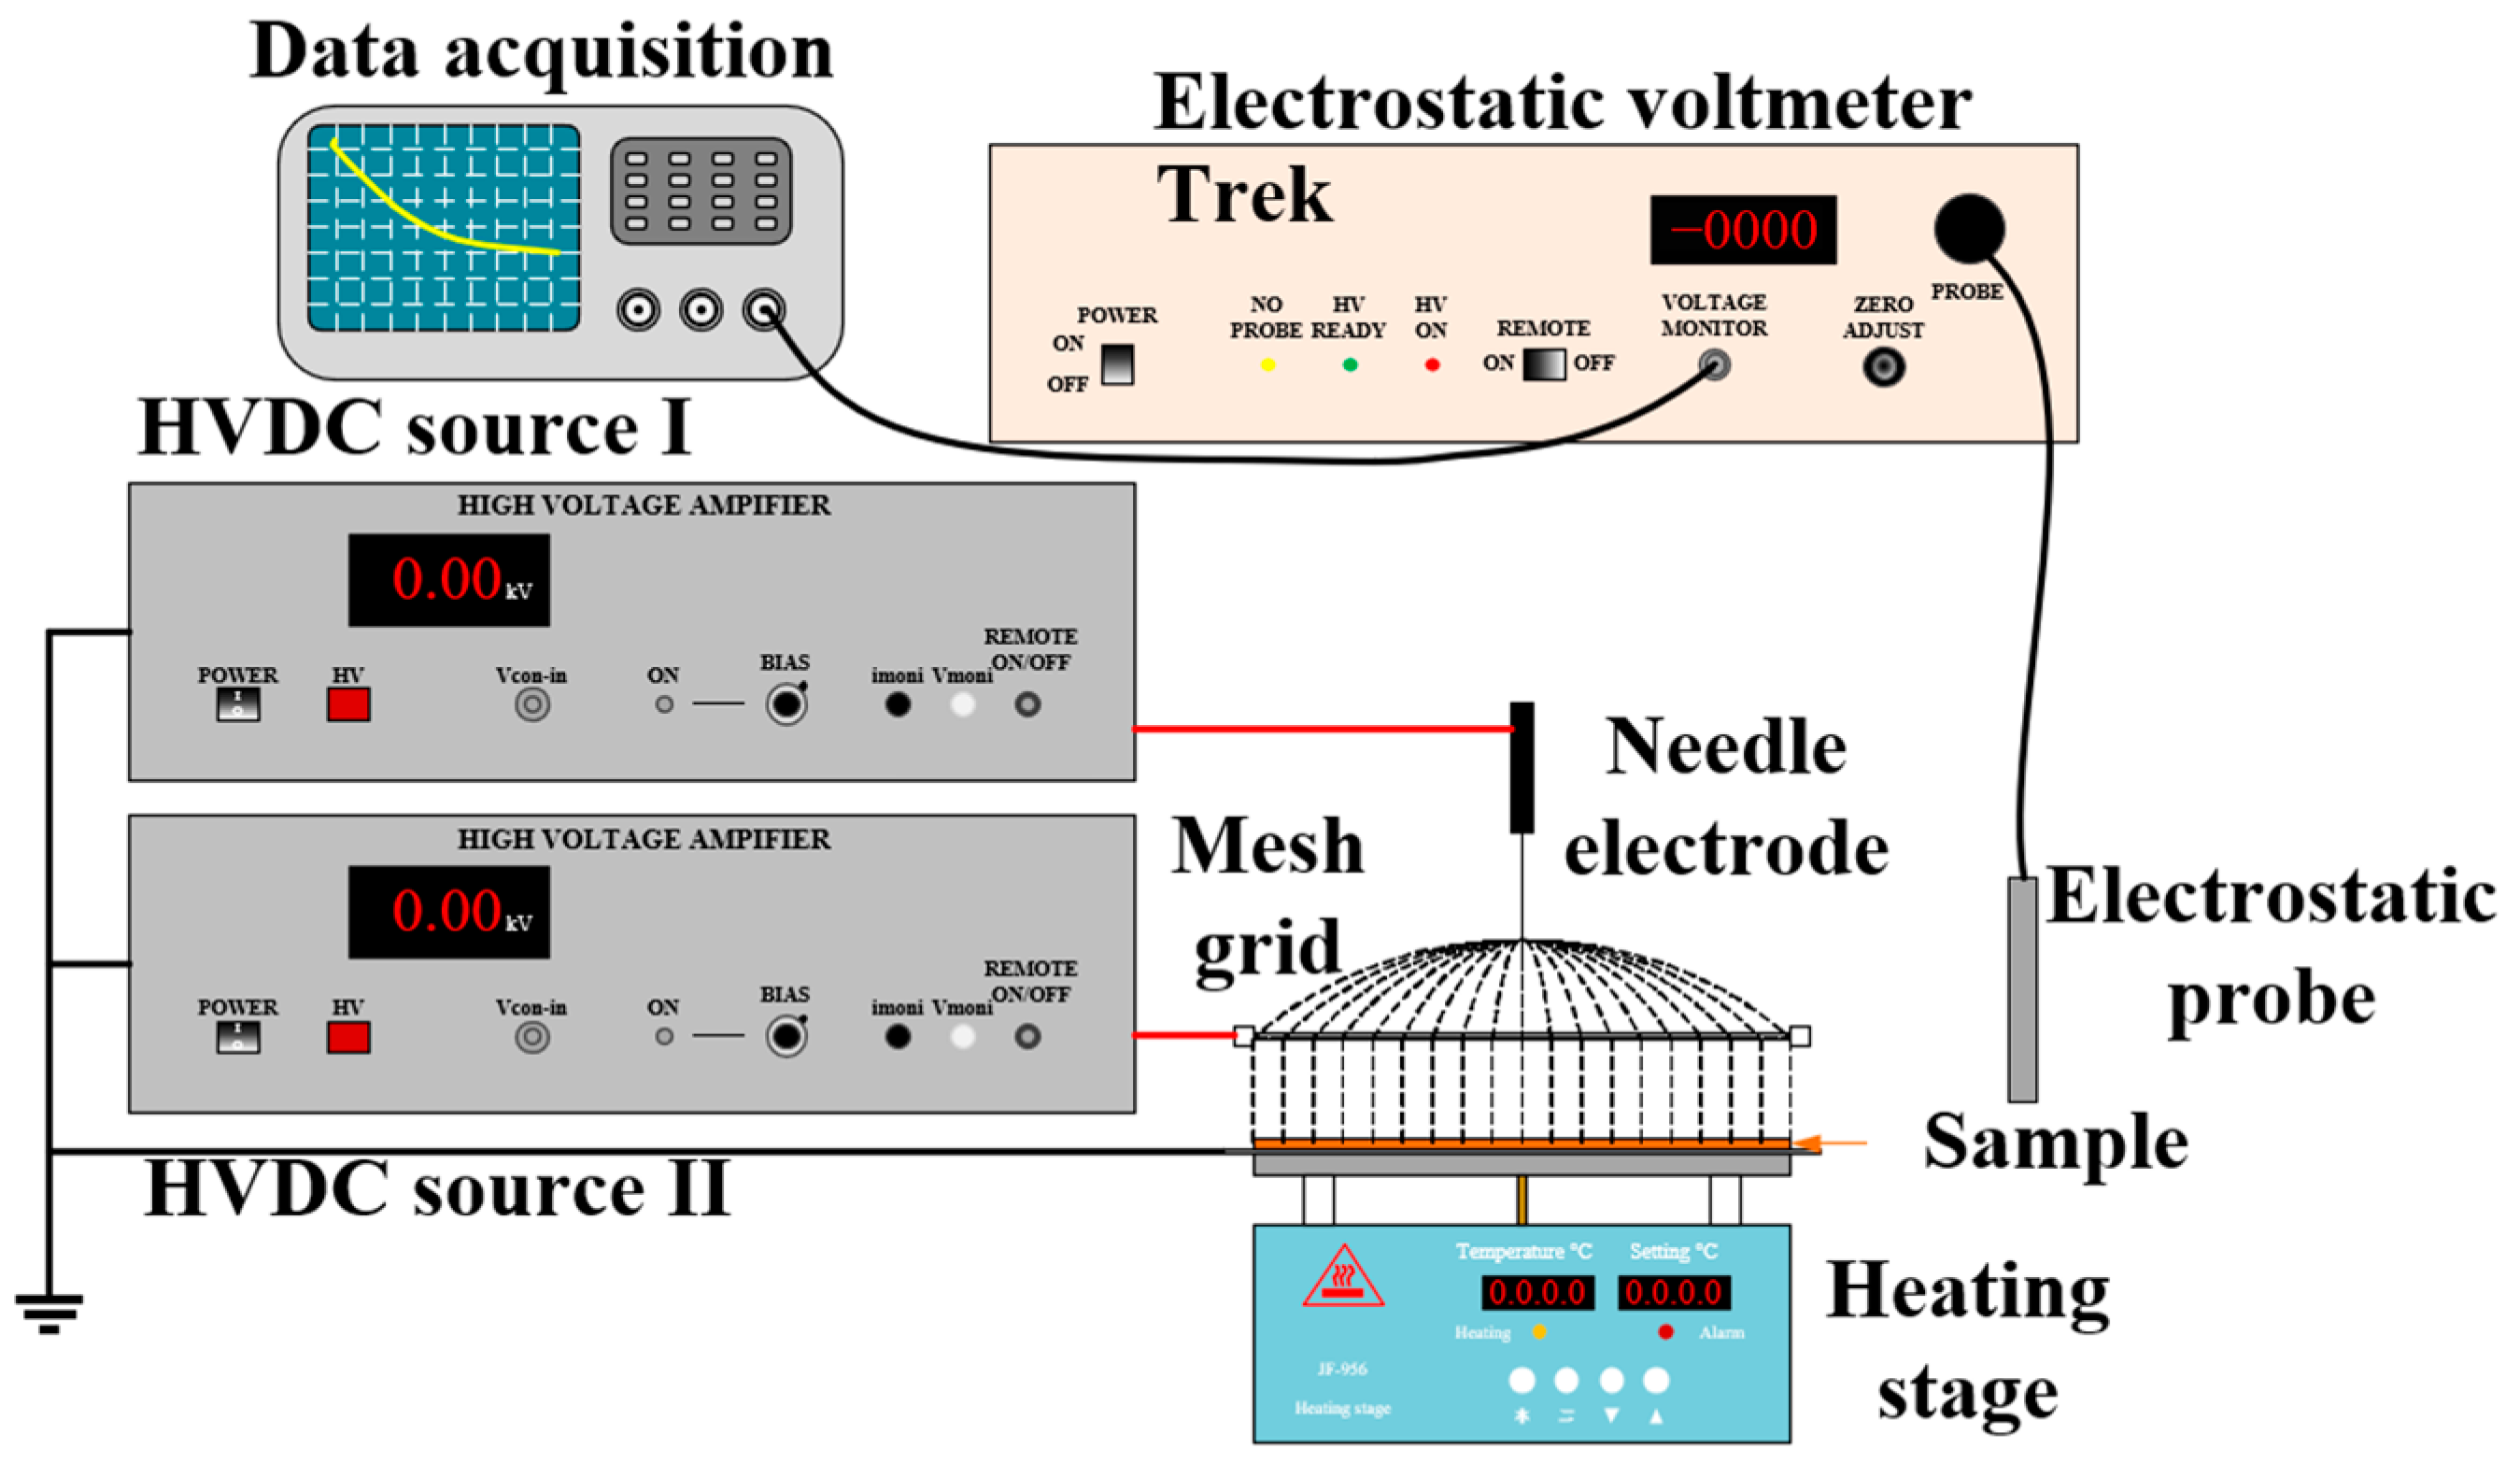
The experimental setup for measuring the carrier mobility in oil-impregnated pressboard, as illustrated in Figure 2, was constructed in this project. To ensure that the surface charges on the oil–paper insulation are of the same polarity and uniformly distributed, a needle-plane electrode system with a grid was utilized in this experiment. The needle electrode has a diameter of 0.3 mm, a tip radius of a curvature of approximately 13 μm, a distance of 5 mm between the needle tip and the grid, and 8 mm between the grid and the sample surface. The needle tip and the grid are connected to two separate DC power supplies, and a thermal platform is used to heat the sample. A Kelvin vibration probe equipped with a high-precision electrostatic voltmeter (Trek-P0865) model number Trek-6000B-5C from Advanced Energy, Inc. in the U.S. was used in the measurement. When SPD measurement is not being conducted, the probe is kept at a distance greater than 40 cm from the sample to prevent damage to the probe during the corona charging process.
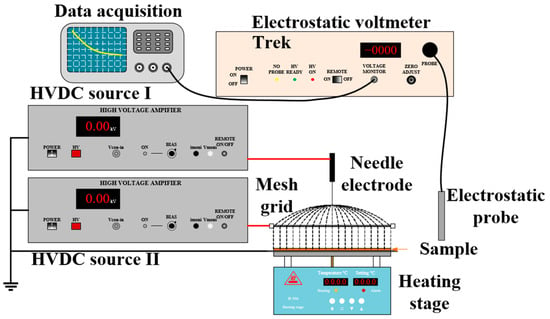
Figure 2.
Test platform diagram.
2.3. Experimental Specimens and Pretreatment
Based on the carbon-type analysis of oil, base oil is categorized into three types: naphthenic oil, intermediate-base oil, and paraffinic oil [19]. In this study, two commonly used naphthenic oils for converter transformers, named N-Oil-A and N-Oil-B, were selected, along with a paraffinic oil, named P-Oil. The difference between the two types of naphthenic oils lies in the different uses: N-Oil-A is more used for transformer electrical equipment, while N-Oil-B is more used for ultra-high voltage direct current transmission, etc. The relevant parameters of the two types of transformer oils are shown in Table 1. Additionally, two types of high-density electrical insulating pressboards provided by mainstream suppliers of converter transformer insulation materials, both domestically and internationally, were chosen and named Pressboard F and Pressboard W. The sample thickness is 1 mm.

Table 1.
Comparison of typical parameters of paraffin-based transformer oil and naphthenic transformer oil.
After filtration (a filter pore size of 0.45 μm), dehydration, and degassing, the moisture content of the transformer oil samples was maintained below 10 mg/L, and the gas content volume fraction did not exceed 2%, meeting the requirements of IEC 62021 [20]. The insulating pressboard samples were treated according to the procedures specified in IEC 60641-2 [21]. Specifically, the samples were dried in a 105 °C forced-air oven, followed by drying in an 85 °C, 100 Pa vacuum oven, and finally in a room temperature, 100 Pa vacuum oven, each for 24 h. After drying, the moisture content of the samples was maintained below 1%.
2.4. Measuring Platform Performance Calibration
During the calibration experiment, the relative humidity was controlled within the range of 19.6% to 37.8%, and the heating platform was adjusted to maintain the sample at an ambient temperature between 20 °C and 80 °C. Different voltage levels were applied to the needle-plane electrode and the grid to induce varying surface potentials on the sample, as specified in Table 2. The deviation in surface potential on the sample surface was kept within 1.2%, and the applied voltage duration was 10 min. After removing the voltage source, an electrostatic probe was positioned 2 to 4 mm above the center of the sample to record the surface potential decay curve.

Table 2.
Needle and gate electrode applied voltage.
The surface potential decay curve is fitted using a double-exponential function as shown in Equation (13).
where τ1 and τ2 represent the relaxation times for the decay of shallow and deep-trap-captured charges, respectively.
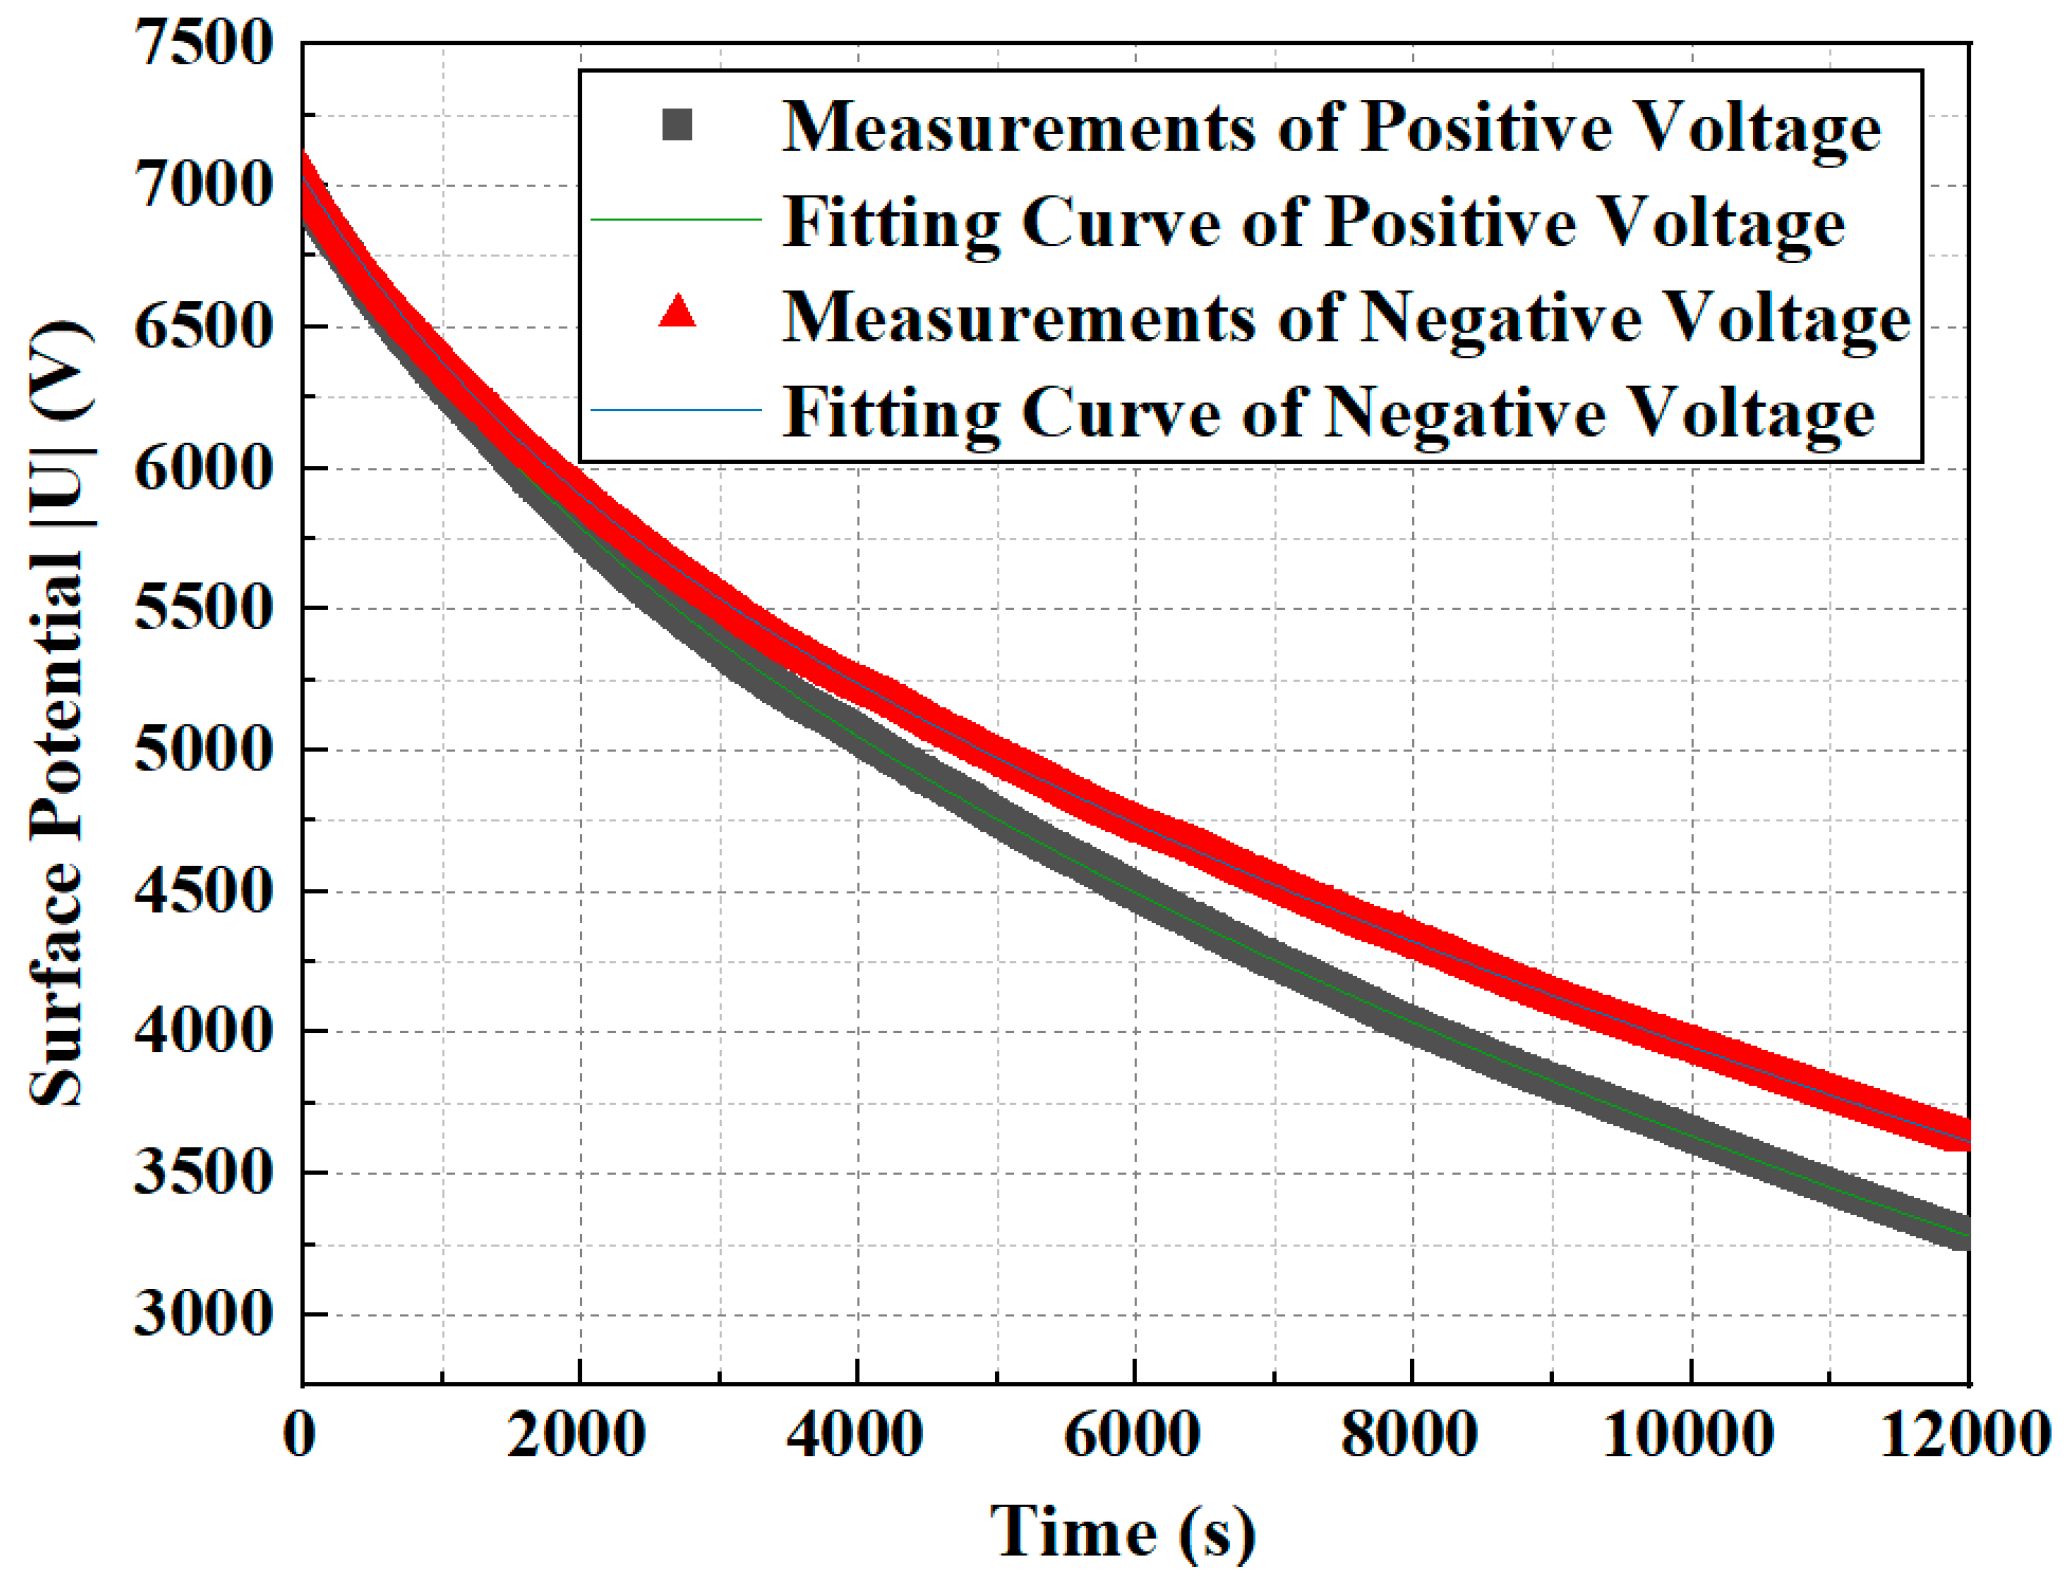
When t is zero, the surface potential is calculated as y0 + A1 + A2. The SPD characteristics of N-Oil-A-impregnated Pressboard W at 20 °C are shown in Figure 3, where the positive and negative surface potentials are +6997 V and −7053 V, respectively.
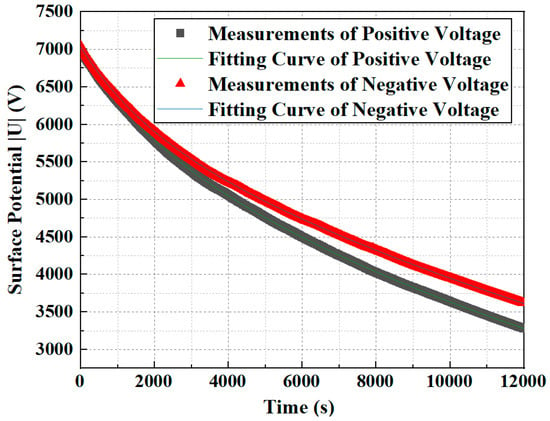
Figure 3.
Surface potential decay curves.
The curve fitting results are shown in Equation (14).
The goodness-of-fit R2 for Equation (14) is 0.99995 and 0.99996, respectively, indicating good reliability. Use the fitting function to find the inflection point of the lg(|dU/dt|) − lg|t| curve, the transit time tr can be calculated
3. Carrier Mobility Evolution Characteristics of Oil-Impregnated Pressboard
3.1. Carrier Mobility of Oil-Immersed Pressboard at Different Temperatures
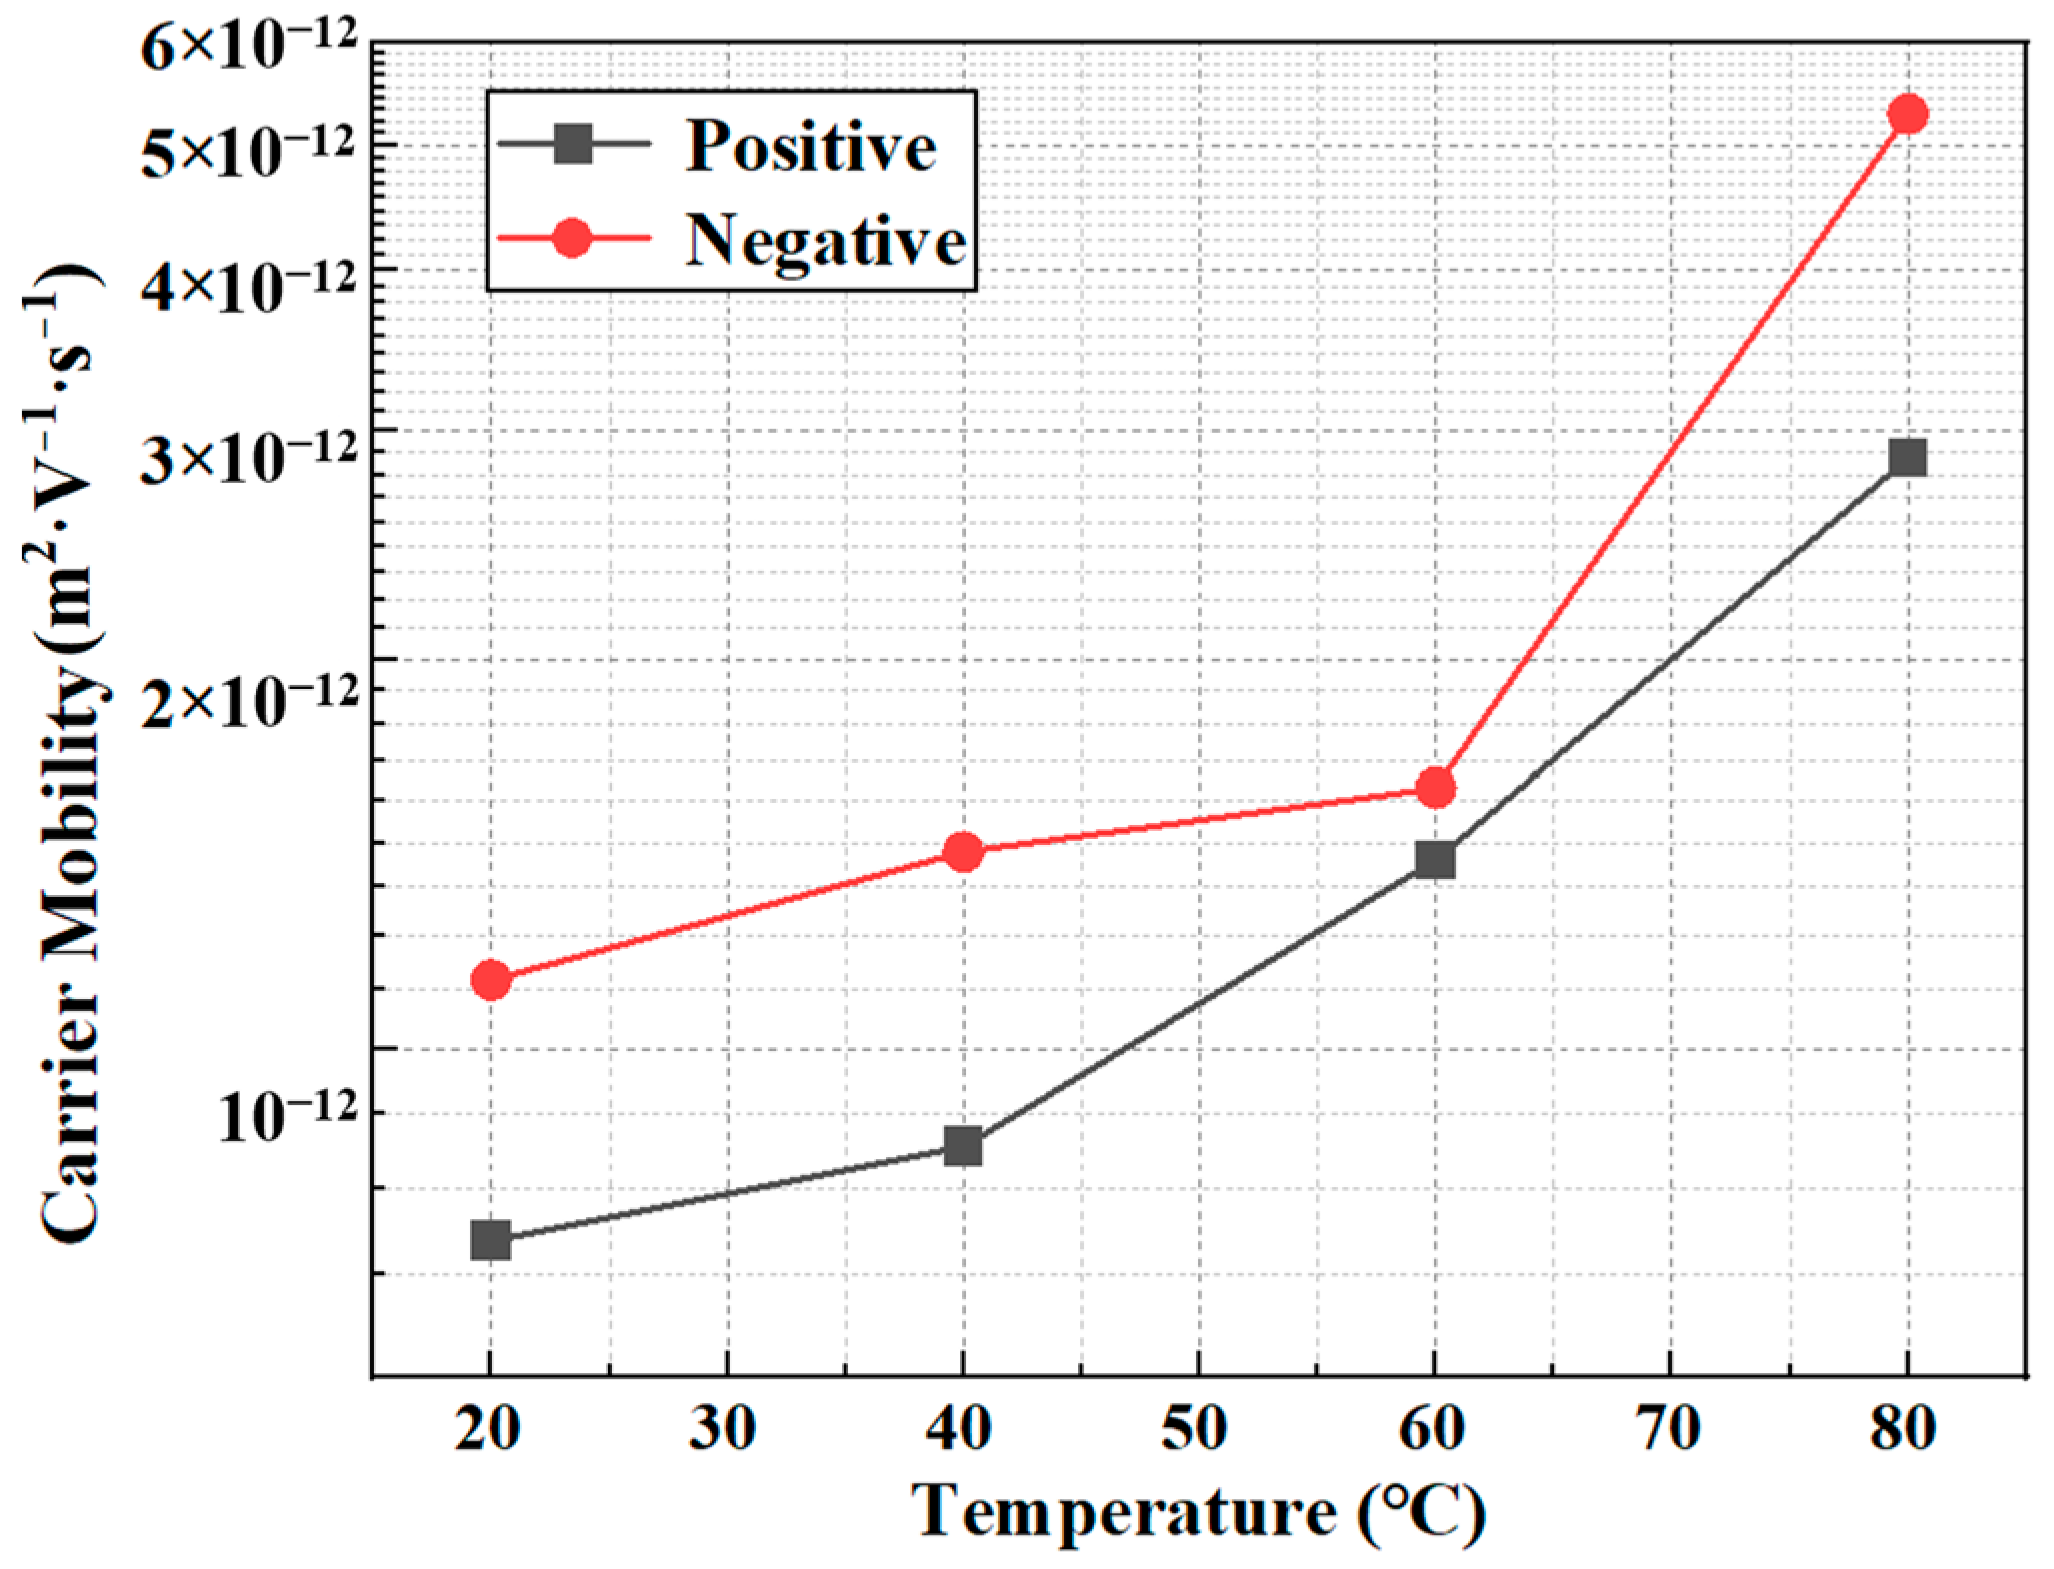
The measurement results of the carrier mobility for Pressboard W impregnated with N-Oil-A at different temperatures (20, 40, 60, and 80 °C) under electric field strengths of ±7 kV/mm are presented in Table 3 and Figure 4.

Table 3.
Carrier mobility of N-Oil-A-oil-impregnated Pressboard W at different temperatures.
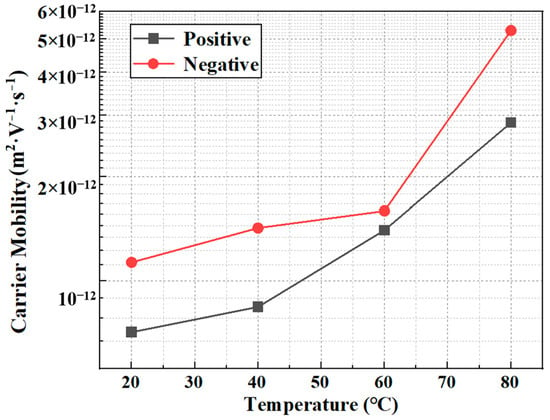
Figure 4.
Positive and negative carrier mobility of N-Oil-A-oil-impregnated Pressboard W at different temperatures.
The results from Table 3 and Figure 4 indicate the following: (1) The carrier mobility of both positive and negative charge carriers is in the range of 10−12 m2·V−1·s−1–10−13 m2·V−1·s−1. (2) The carrier mobility of both positive and negative charge carriers shows a positive correlation with temperature. When the temperature increases from 20 °C to 80 °C, the positive carrier mobility increases from 7.11 × 10⁻¹³ m2·V−1·s−1 to 2.79 × 10⁻¹² m2·V−1·s−1, an increase of approximately 4.03 times. In contrast, the negative carrier mobility increases from 1.17 × 10⁻¹² m2·V−1·s−1 to 5.26 × 10⁻¹² m2·V−1·s−1, an increase of approximately 4.69 times. (3) The negative carrier mobility is consistently greater than the positive carrier mobility. At 80 °C, the difference between negative and positive carrier mobility is the largest, with a ratio of approximately 1.85, while at 60 °C, the difference is the smallest, with a ratio of about 1.14.
3.2. Carrier Mobility of Oil-Impregnated Pressboard at Different Field Strengths
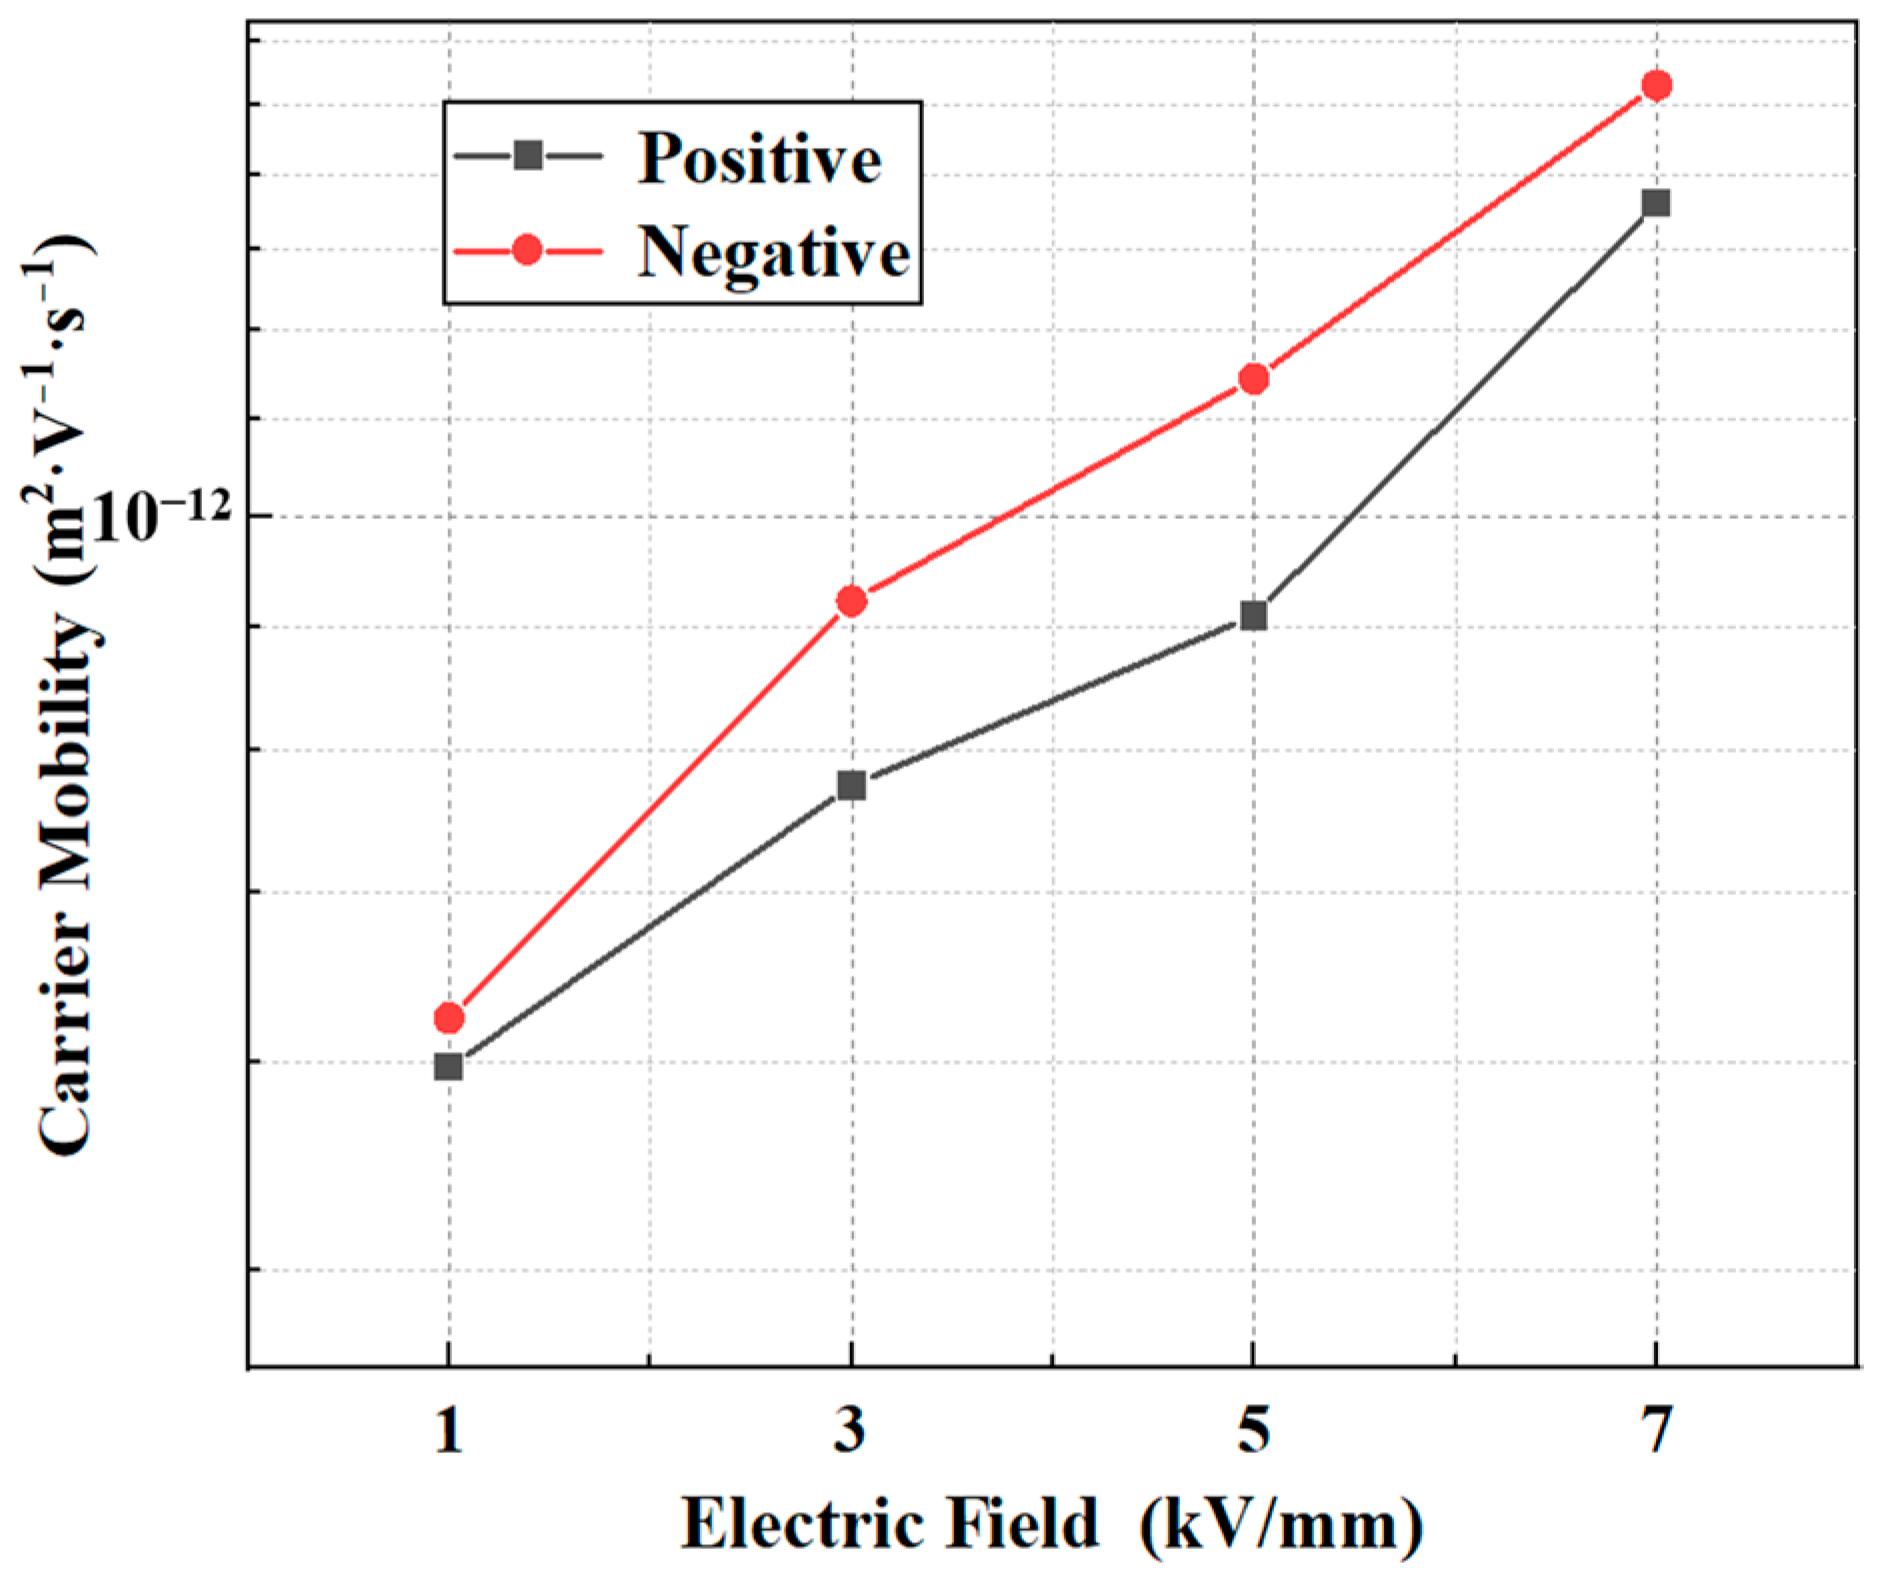
At temperatures of 20, 40, 60, and 80 °C, the carrier mobility characteristics of N-Oil-A-impregnated Pressboard W were measured under different electric field strengths: ±1, ±3, ±5, and ±7 kV/mm. In the aging and performance testing of insulation materials, 60 °C is a common test temperature, and the characteristics are more obvious at this temperature—in addition, temperatures of 20, 40, and 80 °C show the same trend—so take 60 °C as an example, and the measurement results are shown in Table 4 and Figure 5.

Table 4.
Carrier mobility of N-Oil-A-oil-impregnated Pressboard W at different field strengths.
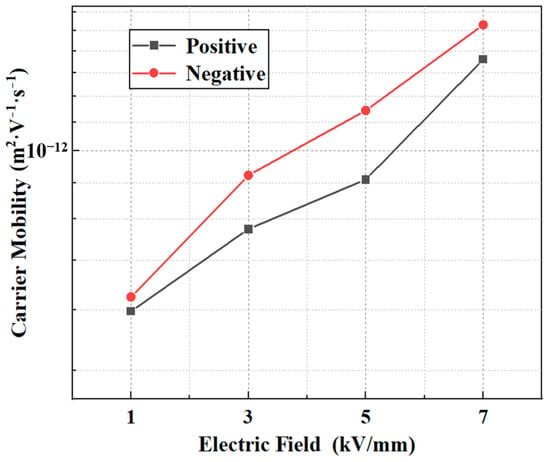
Figure 5.
Positive and negative carrier mobility of N-Oil-A-oil-impregnated Pressboard W at different field strengths.
The results from Table 4 and Figure 5 indicate the following: (1) The mobility of both positive and negative charge carriers is approximately within the range of 10−12 m2·V−1·s−1–10−13 m2·V−1·s−1. (2) There is a positive correlation between the carrier mobility and the electric field strength for both positive and negative carriers. When the electric field strength increases from 1 kV/mm to 7 kV/mm, the positive carrier mobility increases from 5.51 × 10⁻¹³ m2·V−1·s−1 to 1.40 × 10⁻¹² m2·V−1·s−1, an increase by a factor of 2.53, while the negative carrier mobility increases from 5.79 × 10⁻¹³ m2·V−1·s−1 to 1.59 × 10⁻¹² m2·V−1·s−1, an increase by a factor of 2.72. (3) The negative carrier mobility is consistently greater than the positive carrier mobility, but the difference between the two has significantly decreased compared to the results in Section 3.1. When the electric field strength is 5 kV/mm, the difference between negative and positive carrier mobility is at its maximum, with a ratio of approximately 1.29. When the field strength is 1 kV/mm, the difference is at its minimum, with a ratio of about 1.05.
3.3. Carrier Mobility of Pressboard from Different Manufacturers Impregnated with the Same Type of Oil
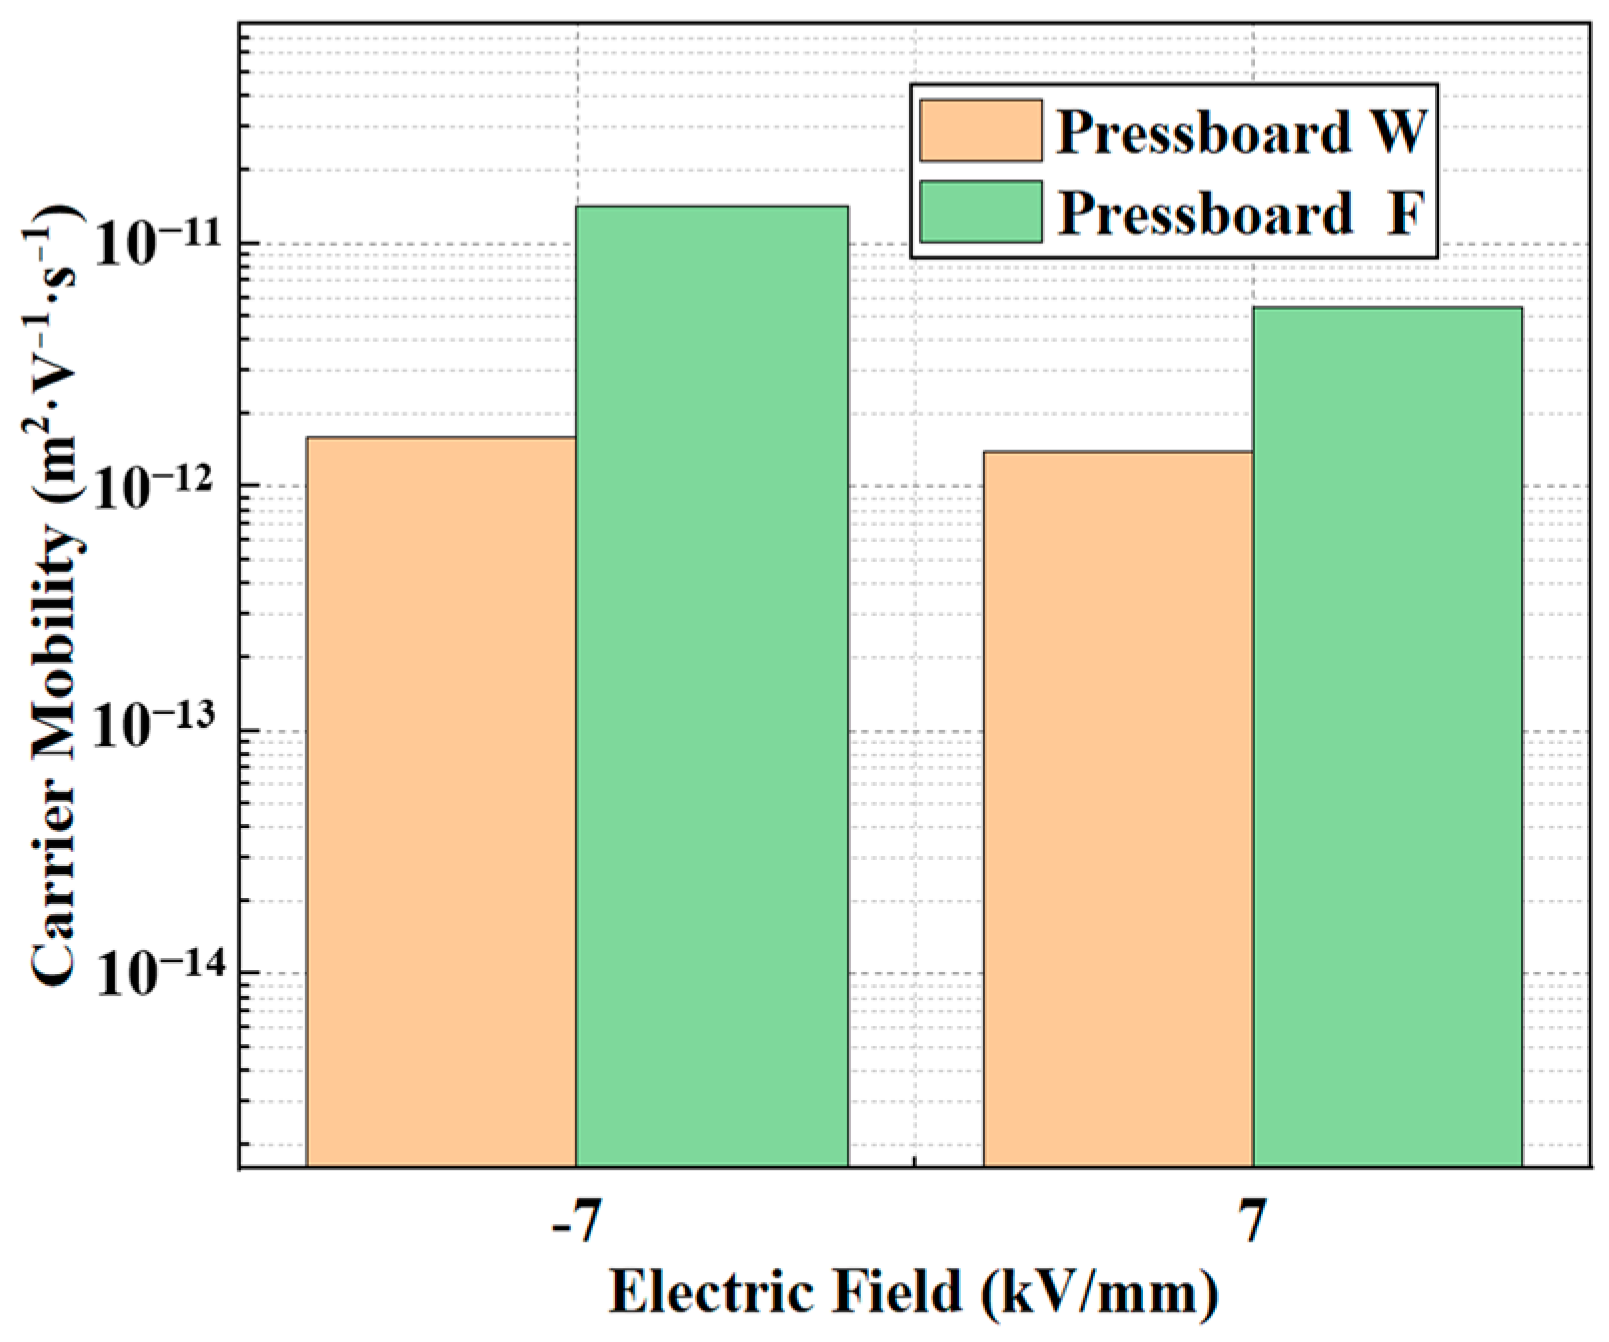
At temperatures of 20, 40, 60, and 80 °C and an electric field strength of ±7 kV/mm, the carrier mobility of N-Oil-A-oil-impregnated Pressboard W and Pressboard F was measured. Taking the condition at 60 °C as an example, the measurement results are presented in Table 5 and Figure 6.

Table 5.
Carrier mobility of different N-Oil-A-oil-impregnated pressboards.
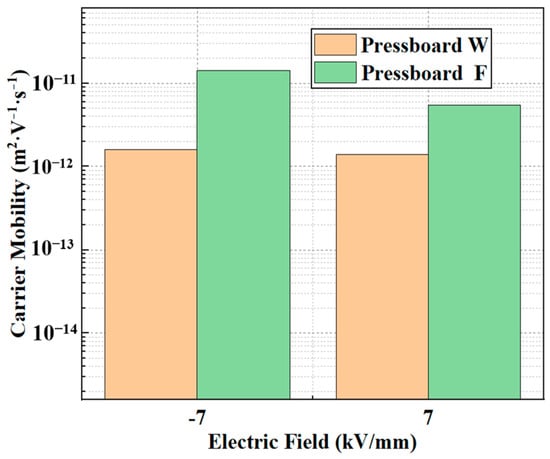
Figure 6.
Positive and negative carrier mobility of different N-Oil-A-oil-impregnated pressboards.
The results from Table 5 and Figure 6 indicate the following: (1) The positive and negative carrier mobilities for both Pressboard W and F are generally within the order of magnitude of 10−12 m2·V−1·s−1. (2) The positive and negative carrier mobilities of Pressboard F are significantly higher than those of Pressboard W. For positive carriers, the mobility of Pressboard F is 5.41 × 10⁻¹² m2·V−1·s−1, which is approximately 3.83 times that of Pressboard W, whose mobility is 1.40 × 10⁻¹² m2·V−1·s−1. The difference in negative carrier mobility is even greater, with a ratio of 8.89. (3) There is a substantial difference between the positive and negative carrier mobilities for both pressboards. For Pressboard W, the ratio of negative to positive carrier mobility is approximately 1.14, whereas for Pressboard F, the ratio is around 2.62.
3.4. Carrier Mobility of Pressboard from the Same Manufacturer Impregnated with Different Types of Oil
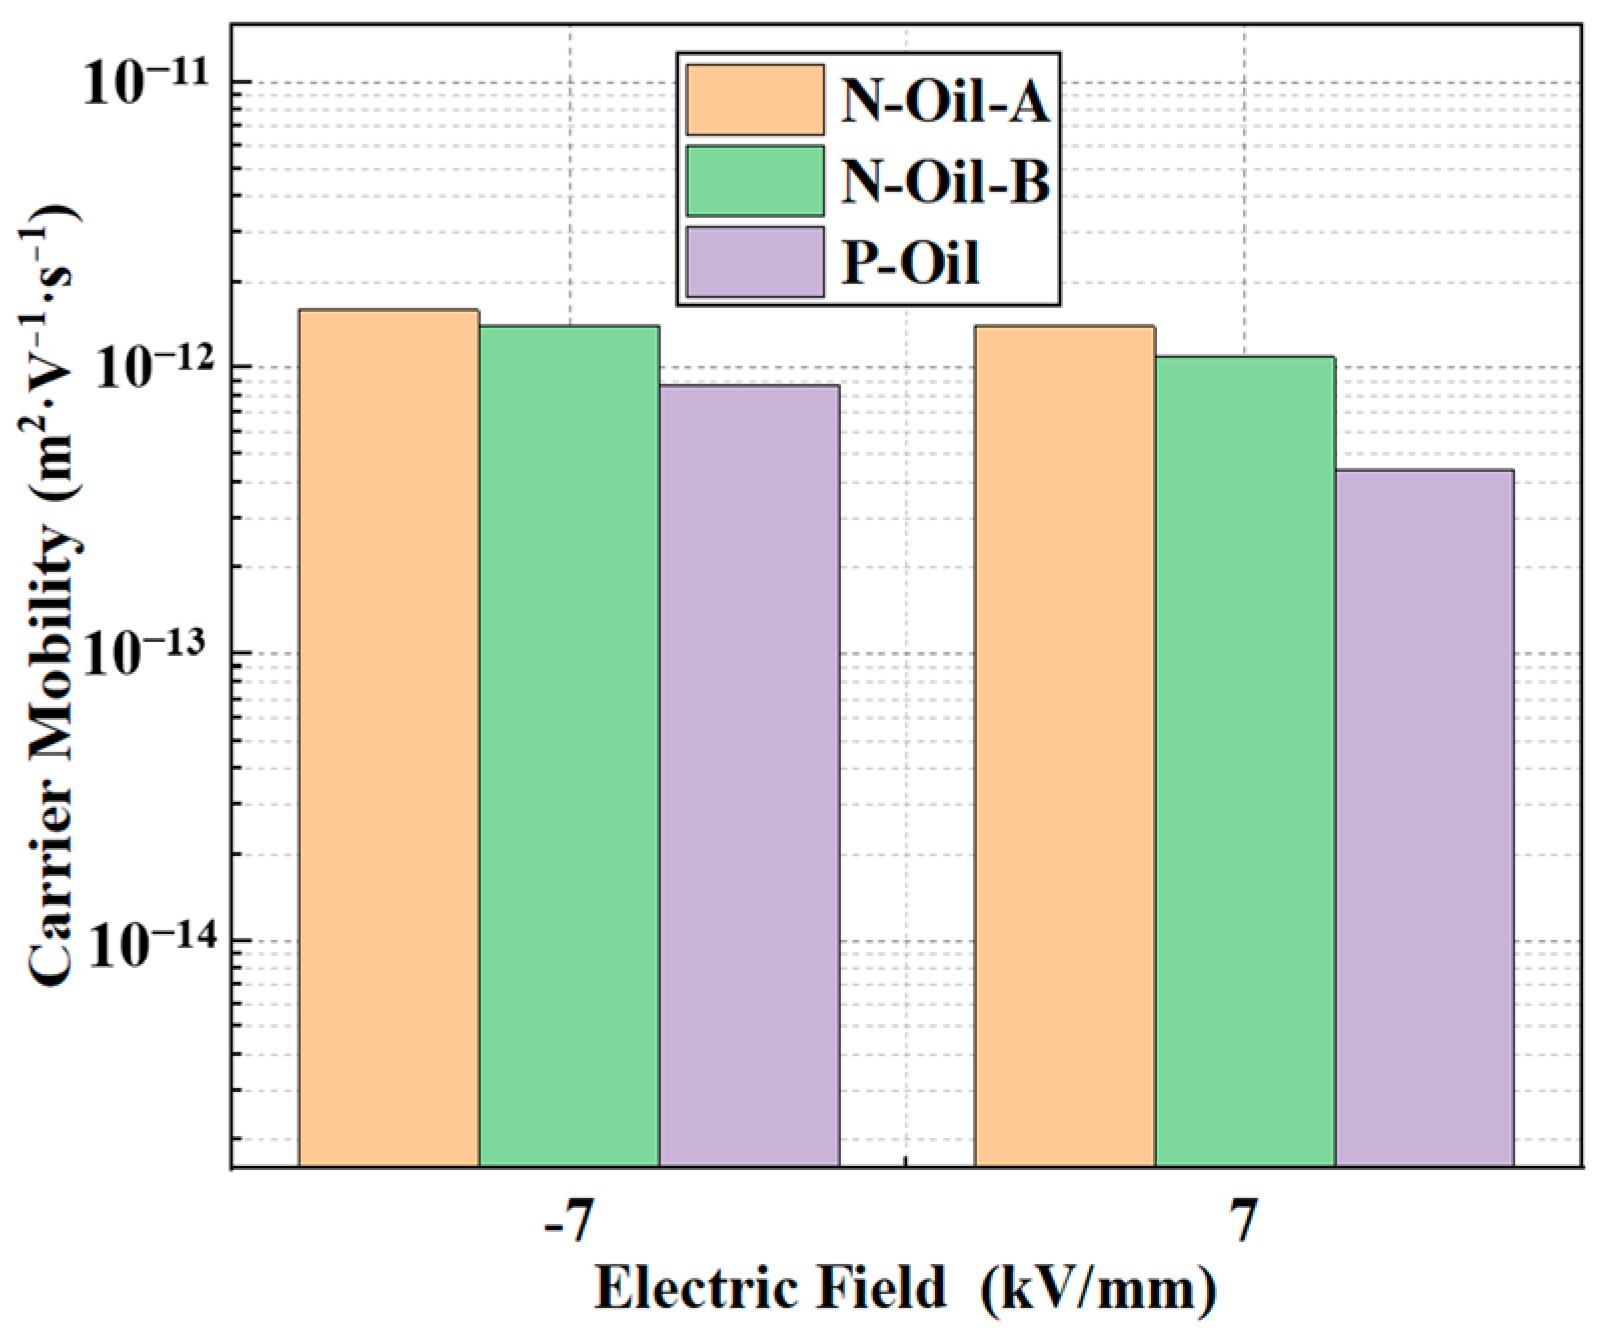
At temperatures of 20, 40, 60, and 80 °C, the carrier mobility characteristics were measured for Pressboard W impregnated with two naphthenic oils (N-Oil-A and N-Oil-B) and one paraffinic oil (P-Oil) under an electric field strength of ±7 kV/mm. The results are shown in Table 6 and Figure 7.

Table 6.
Carrier mobility of different transformer-oil-impregnated Pressboard W.
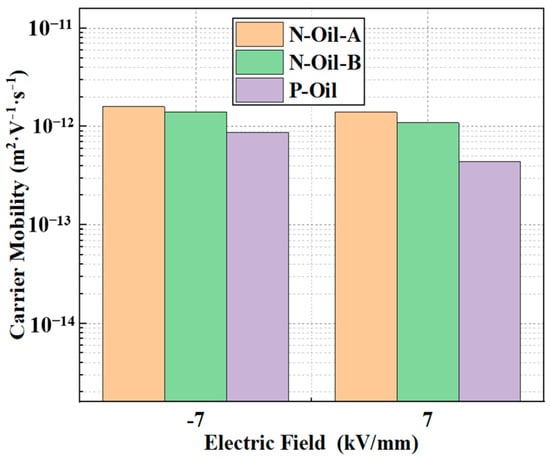
Figure 7.
Positive and negative carrier mobility of different transformer-oil-impregnated Pressboard W.
The results from Table 6 and Figure 7 indicate the following: (1) The positive and negative carrier mobilities for Pressboard W impregnated with the naphthenic oils (N-Oil-A and N-Oil-B) are of the order of 10−12 m2·V−1·s−1, whereas the mobilities for Pressboard W impregnated with the paraffinic oil (P-Oil) are of the order of 10−13 m2·V−1·s−1. (2) Pressboard impregnated with N-Oil-A exhibits the highest positive and negative carrier mobilities, which are 1.40 × 10⁻¹² m2·V−1·s−1 and 1.59 × 10⁻¹² m2·V−1·s−1, respectively, followed by N-Oil-B. Pressboard impregnated with P-Oil exhibits the lowest carrier mobility. The positive and negative carrier mobilities of N-Oil-A-impregnated pressboard are 3.16 times and 1.82 times those of P-Oil and 1.28 times and 1.13 times those of N-Oil-B, respectively. (3) There is a significant disparity in the positive and negative carrier mobilities for pressboard impregnated with different transformer oils. For N-Oil-A, the ratio of negative to positive carrier mobility is approximately 1.14; for N-Oil-B, it is around 1.29; and for P-Oil, it is about 1.97. Therefore, the disparity between the positive and negative carrier mobilities is more pronounced for paraffinic oil compared to naphthenic oil.
4. Analysis and Discussion
4.1. Mechanism of Field Strength and Temperature Effects on Carrier Mobility
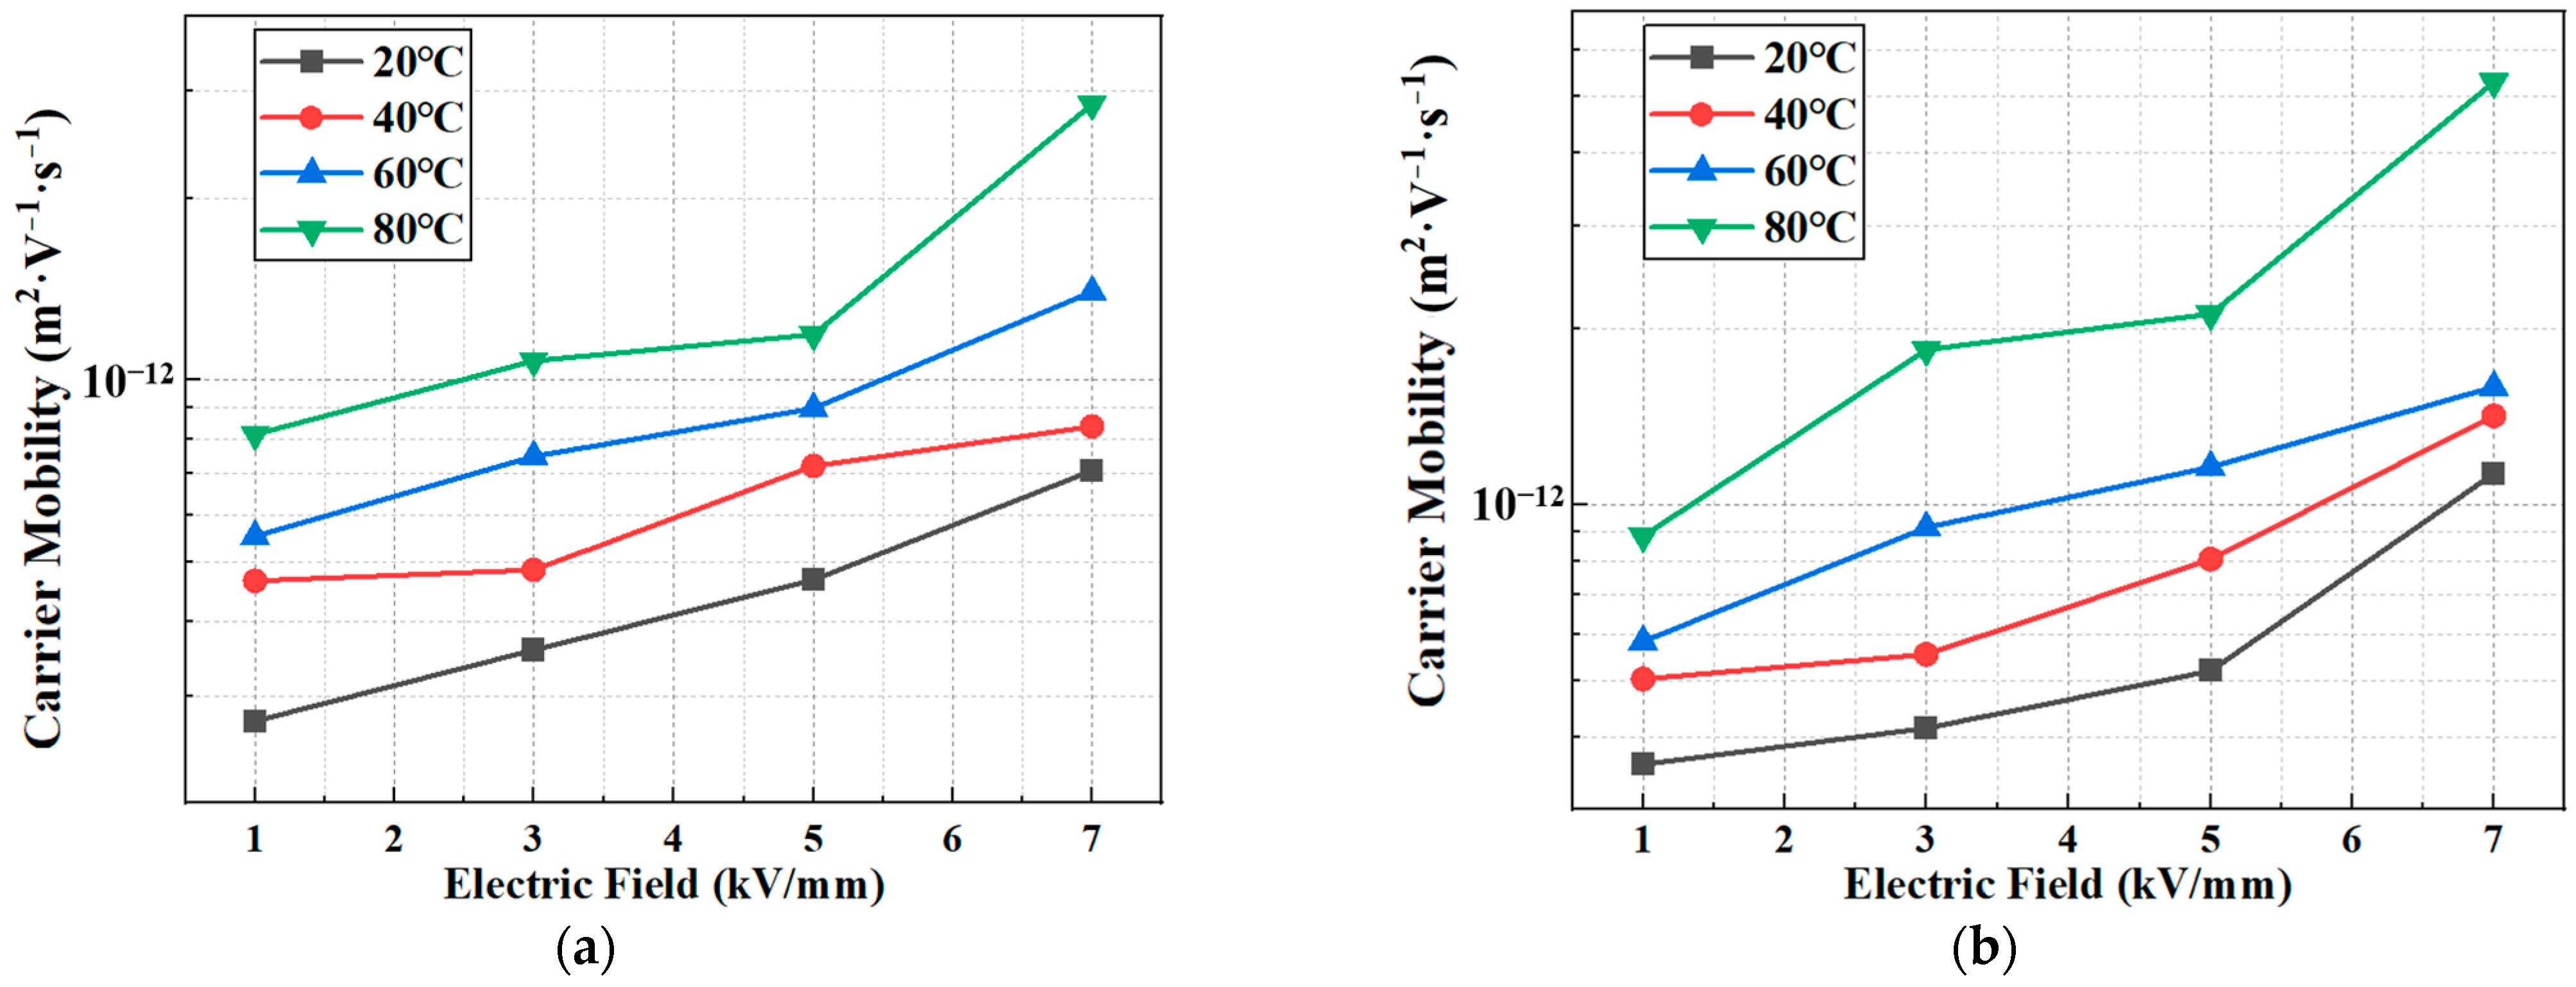
Based on the discussions in Section 3.1 and Section 3.2, the measurement results of the carrier mobility for Pressboard W impregnated with N-Oil-A under different electric field strengths and temperatures are presented in Figure 8.
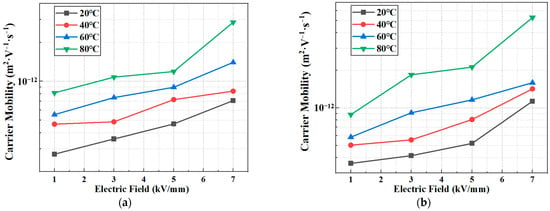
Figure 8.
Comparison of carrier mobility at different field strengths and temperatures: (a) positive polarity carrier mobility; (b) negative polarity carrier mobility.
The results in Figure 8 indicate that, when the temperature or electric field strength is held constant, the carrier mobility exhibits a positive correlation with both electric field strength and temperature. This phenomenon is analyzed using a carrier transport model based on the hopping mechanism: the content of free electrons and free holes in oil-impregnated pressboard is negligible, and the movement of carriers within the oil-impregnated pressboard primarily occurs via hopping conduction. In this process, carriers repeatedly get trapped and de-trapped while moving from one end of the pressboard to the other. According to the hopping conductivity model, carrier mobility can be calculated as shown in Equation (15).
where λ is the hopping distance, Δ is the hopping activation energy, k is the Boltzmann constant, T is the temperature, e is the electron charge, and ν is the escape frequency. The expression is as shown in Equation (16).
where h is the Planck constant.
Since the rate of the change of the exponential term is faster than that of the (1/E) term, the carrier mobility is positively correlated with the electric field intensity. The relationship between the carrier mobility and conductivity in oil–paper insulation is given by Equation (17).
where n0 is the concentration of a specific carrier in the dielectric, q is the charge of this carrier, and μ is the mobility of the carrier in the dielectric. γ is conductivity.
Carrier mobility is positively correlated with conductivity, and conductivity also shows a positive correlation with temperature. Therefore, carrier mobility exhibits a positive correlation with temperature.
The charge transport process within insulating materials is often described using the hopping mechanism, where carriers overcome potential barriers to move from one location to another. For oil-impregnated pressboard, due to the high fluidity of the composite material, calculating carrier mobility is relatively complex. A simplified carrier mobility calculation equation based on the hopping mechanism can effectively fit the conductivity characteristics. The conductivity of the medium can be obtained from Equation (18), and combining Equations (15) and (18), it can be seen that the carrier mobility and conductivity of the medium should have similar trends.
The conclusion derived from Equation (18) is consistent with the observation in Figure 8, indicating that carrier mobility is positively correlated with temperature. As the ambient temperature increases, the average kinetic energy of the carriers also increases, resulting in a greater number of activated particles. Consequently, more carriers are able to escape from trap sites [22], which ultimately accelerates the charge diffusion process, thereby increasing carrier mobility.
4.2. Comparative Analysis of Carrier Mobility of Different Oil-Impregnated Pressboards
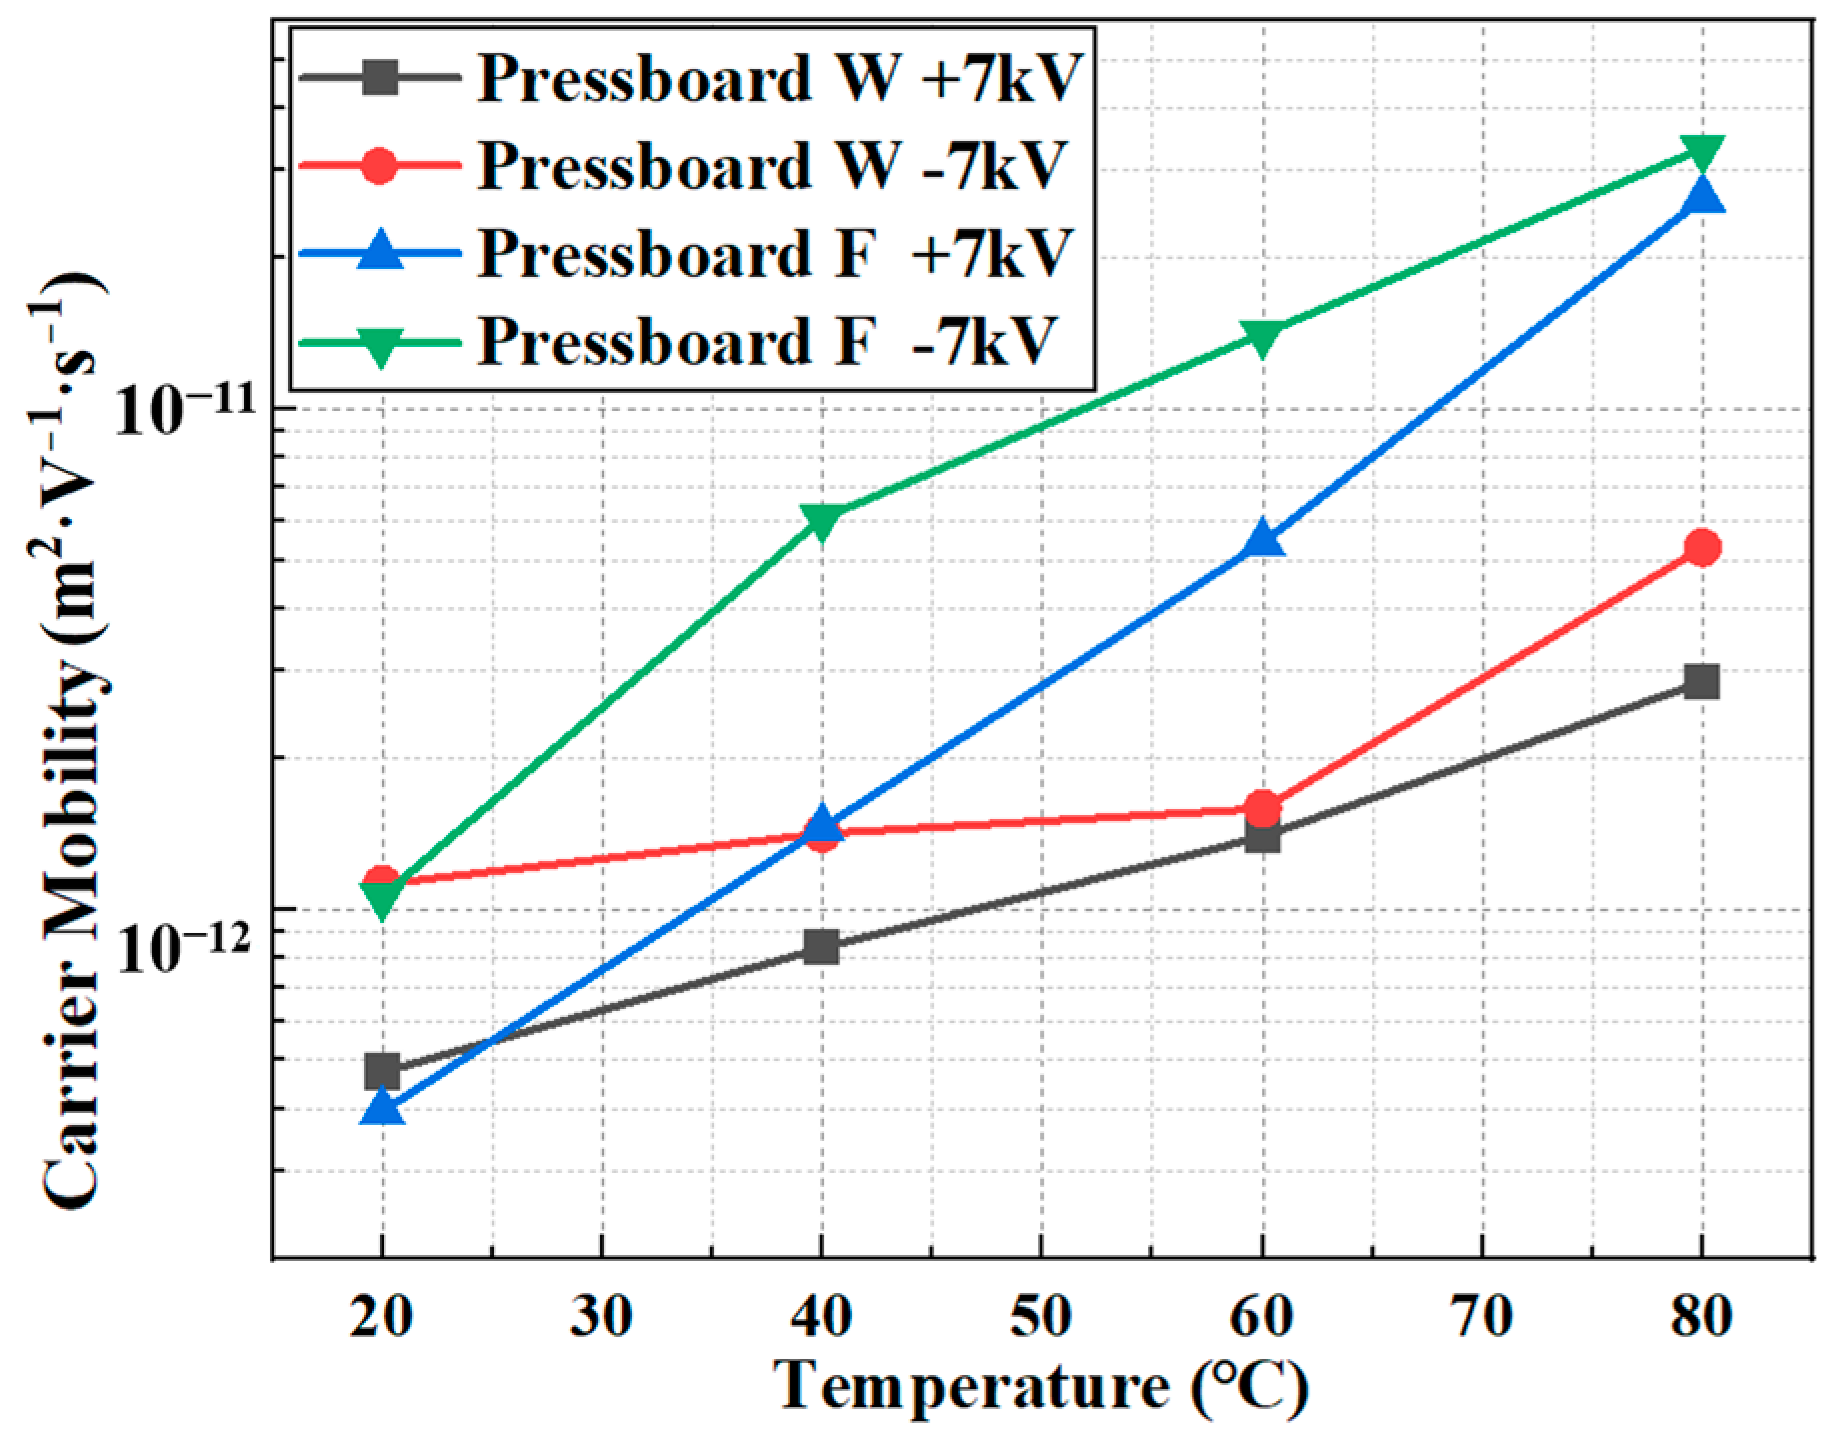
Based on the discussion in Section 3.3, the carrier mobility of oil-impregnated pressboard from different manufacturers under an electric field strength of ±7 kV/mm at various temperatures is shown in Figure 9.
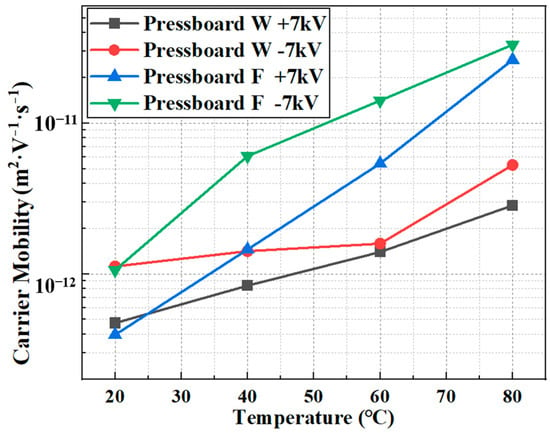
Figure 9.
Comparison of carrier mobility of oil-impregnated pressboard from different manufacturers.
The results from Figure 9 indicate the following:
At 20 °C, the positive and negative carrier mobilities of Pressboard W are higher than those of Pressboard F. As the temperature increases, the carrier mobility for both pressboards increases, but the growth rate for Pressboard F is significantly higher than that for Pressboard W. After 40 °C, the positive and negative carrier mobilities of Pressboard F surpass those of Pressboard W. The observed phenomenon can be explained by the variation in pressboard conductivity and the relationship between conductivity and carrier mobility.
As the temperature rises, the number of de-trapped carriers increases, leading to an increase in the conduction current in transformer oil. Simultaneously, the viscosity of the transformer oil decreases, resulting in an increase in flow rate and, consequently, the carrier mobility of the pressboard. Under identical impregnation conditions, Pressboard F has an oil absorption rate of 17.29%, while Pressboard W has an oil absorption rate of 14.22%, with a difference of 3.07%. The conductivity of insulating pressboard is inferior to that of transformer oil, meaning that carrier movement is weaker within the pressboard. Therefore, the conductivity of the insulating pressboard is positively correlated with its oil absorption rate. As a result, Pressboard F, which has a higher oil absorption rate, is more affected by the impregnated oil, and its carrier mobility exhibits a more significant variation with temperature.
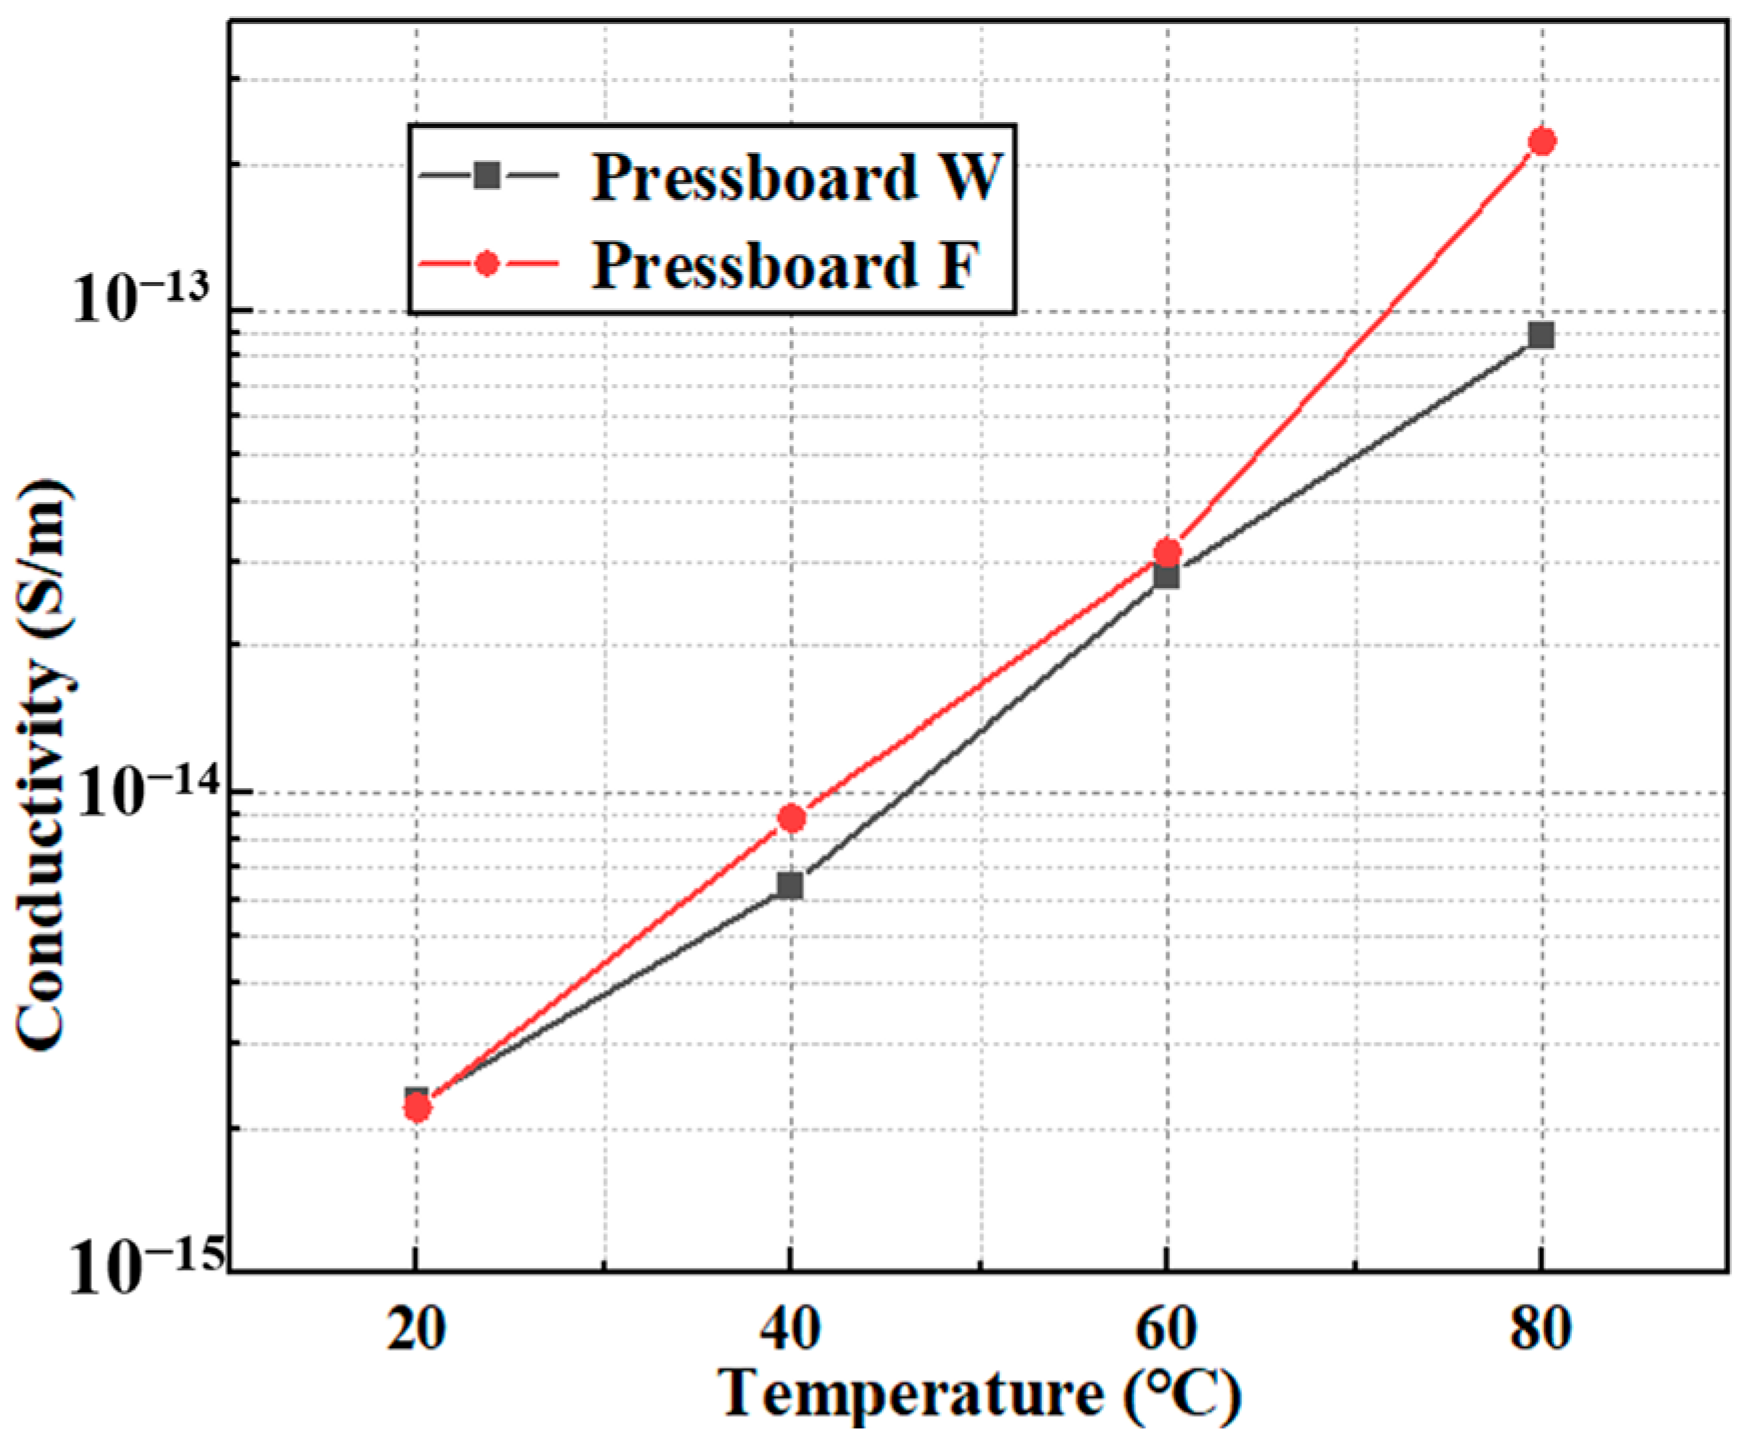
The comparison of the conductivities of oil-impregnated pressboard from different manufacturers at different temperatures is shown in Table 7 and Figure 10.

Table 7.
Comparison of conductivity of oil-impregnated pressboard from different manufacturers.
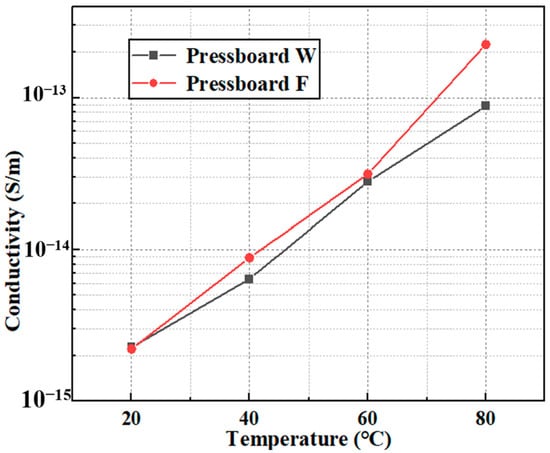
Figure 10.
Comparison of conductivity of oil-impregnated pressboard from different manufacturers.
The results from Table 7 and Figure 10 indicate that the conductivity of oil-impregnated pressboard is positively correlated with temperature. Therefore, the trend of conductivity change is consistent with the trend of carrier mobility change, which is in agreement with the conclusion derived from Equation (17).
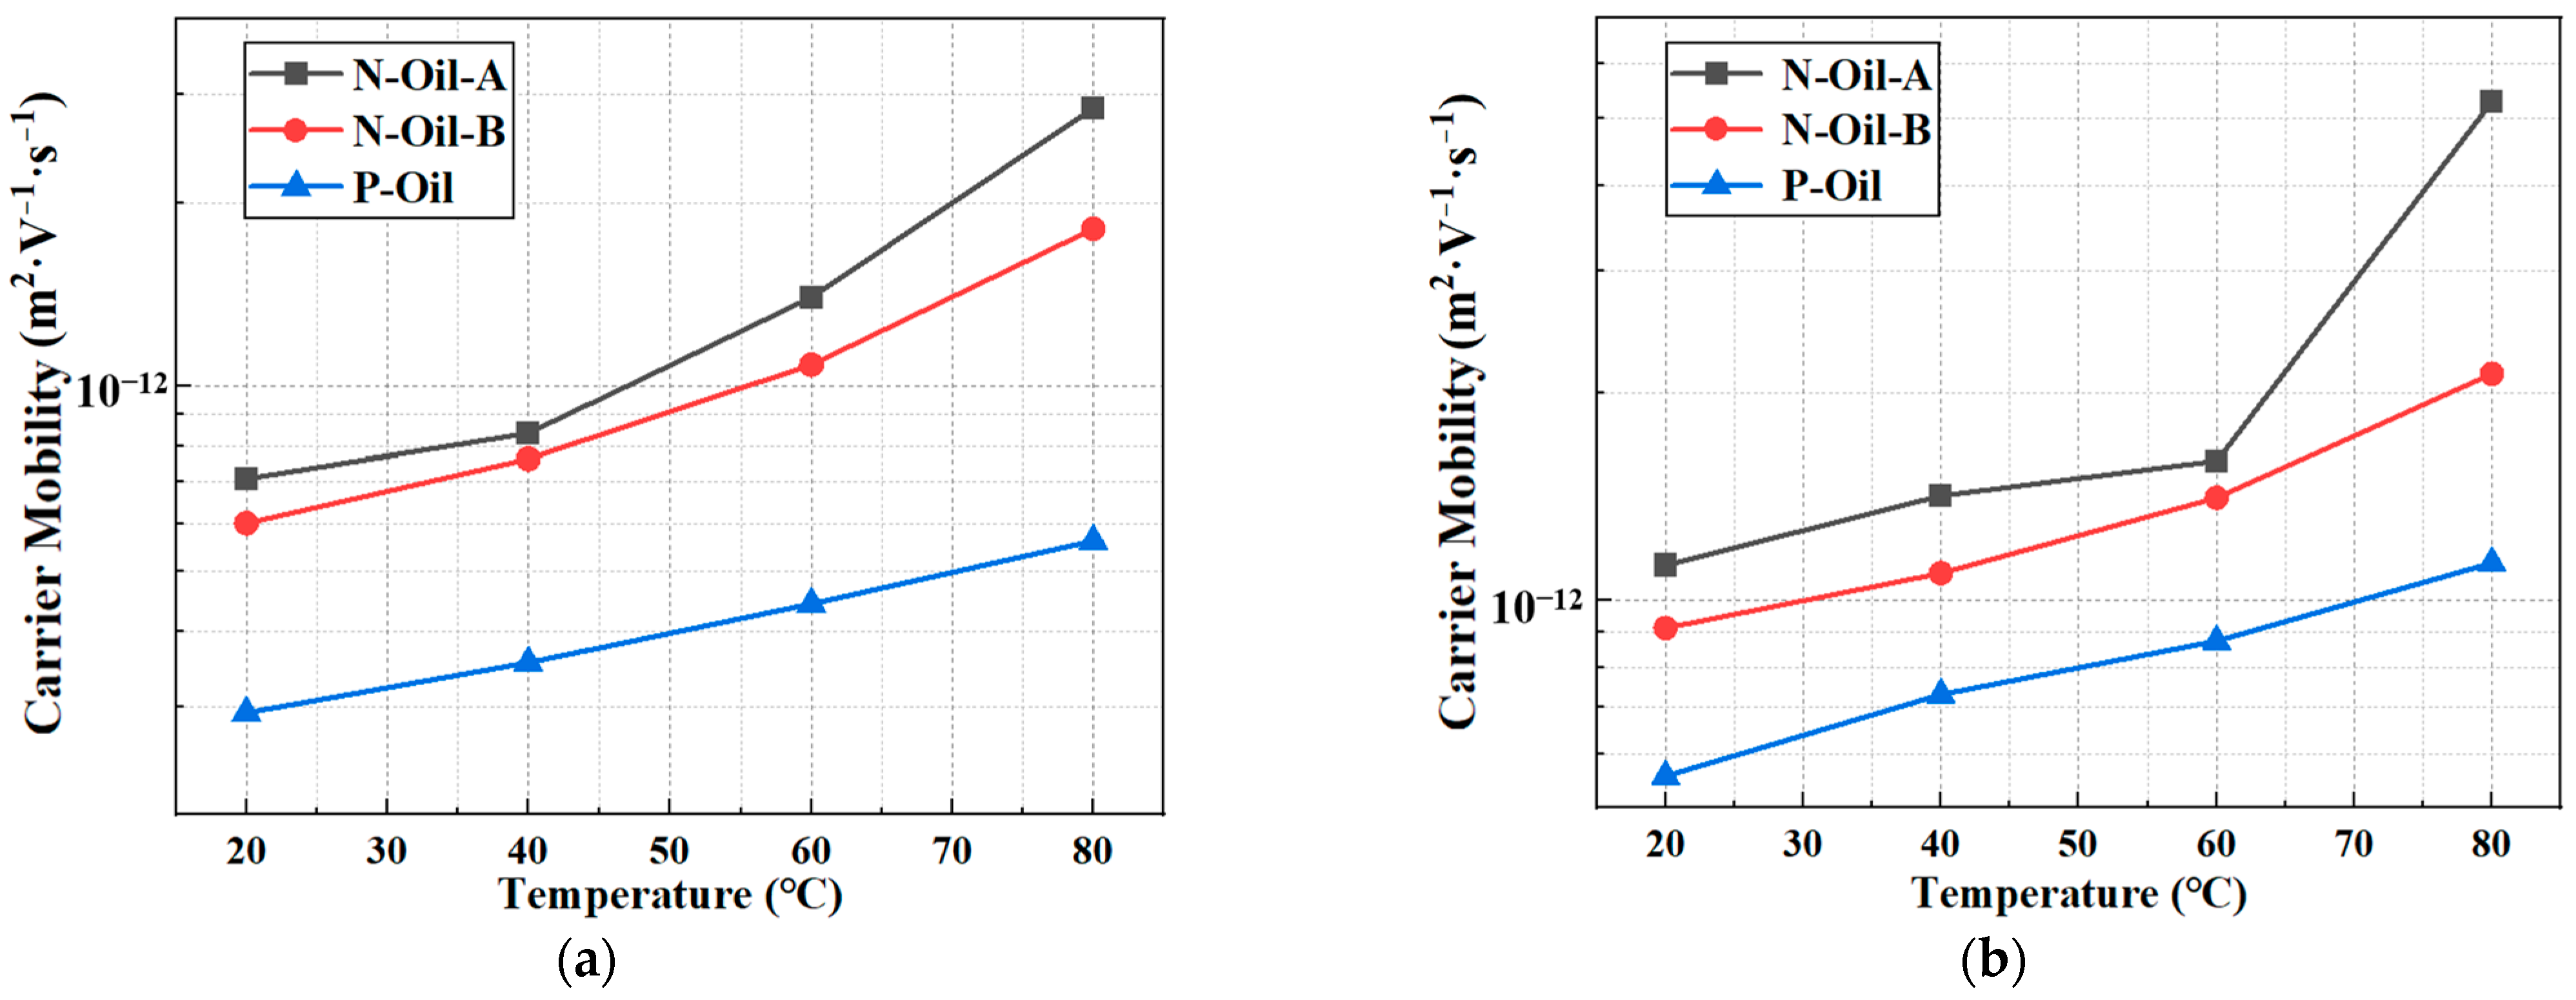
Based on the discussion in Section 3.4, the carrier mobility of pressboard impregnated with different types of transformer oil under an electric field strength of ±7 kV/mm at various temperatures is shown in Figure 11.
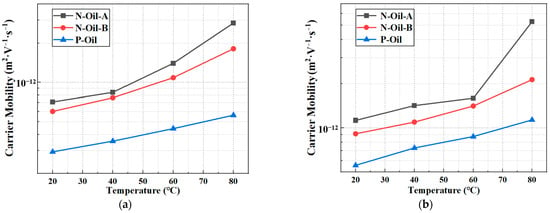
Figure 11.
Comparison of carrier mobility of different transformer-oil-impregnated pressboard: (a) positive polarity carrier mobility; (b) negative polarity carrier mobility.
The results from Figure 11 indicate that, at different temperatures, the carrier mobility of oil-impregnated pressboard follows the order N-Oil-A > N-Oil-B > P-Oil.
As discussed in Section 4.2, the conductivity of transformer oil significantly influences the conductivity characteristics of oil-impregnated pressboard. P-Oil is a paraffinic transformer oil, while N-Oil-A and N-Oil-B are naphthenic transformer oils. The conductivity of paraffinic transformer oil is significantly lower than that of naphthenic transformer oil. Therefore, the carrier mobility of pressboard impregnated with P-Oil is lower than that of pressboard impregnated with N-Oil-A and N-Oil-B.
4.3. Effect of Pressboard Microform Differences on Carrier Mobility
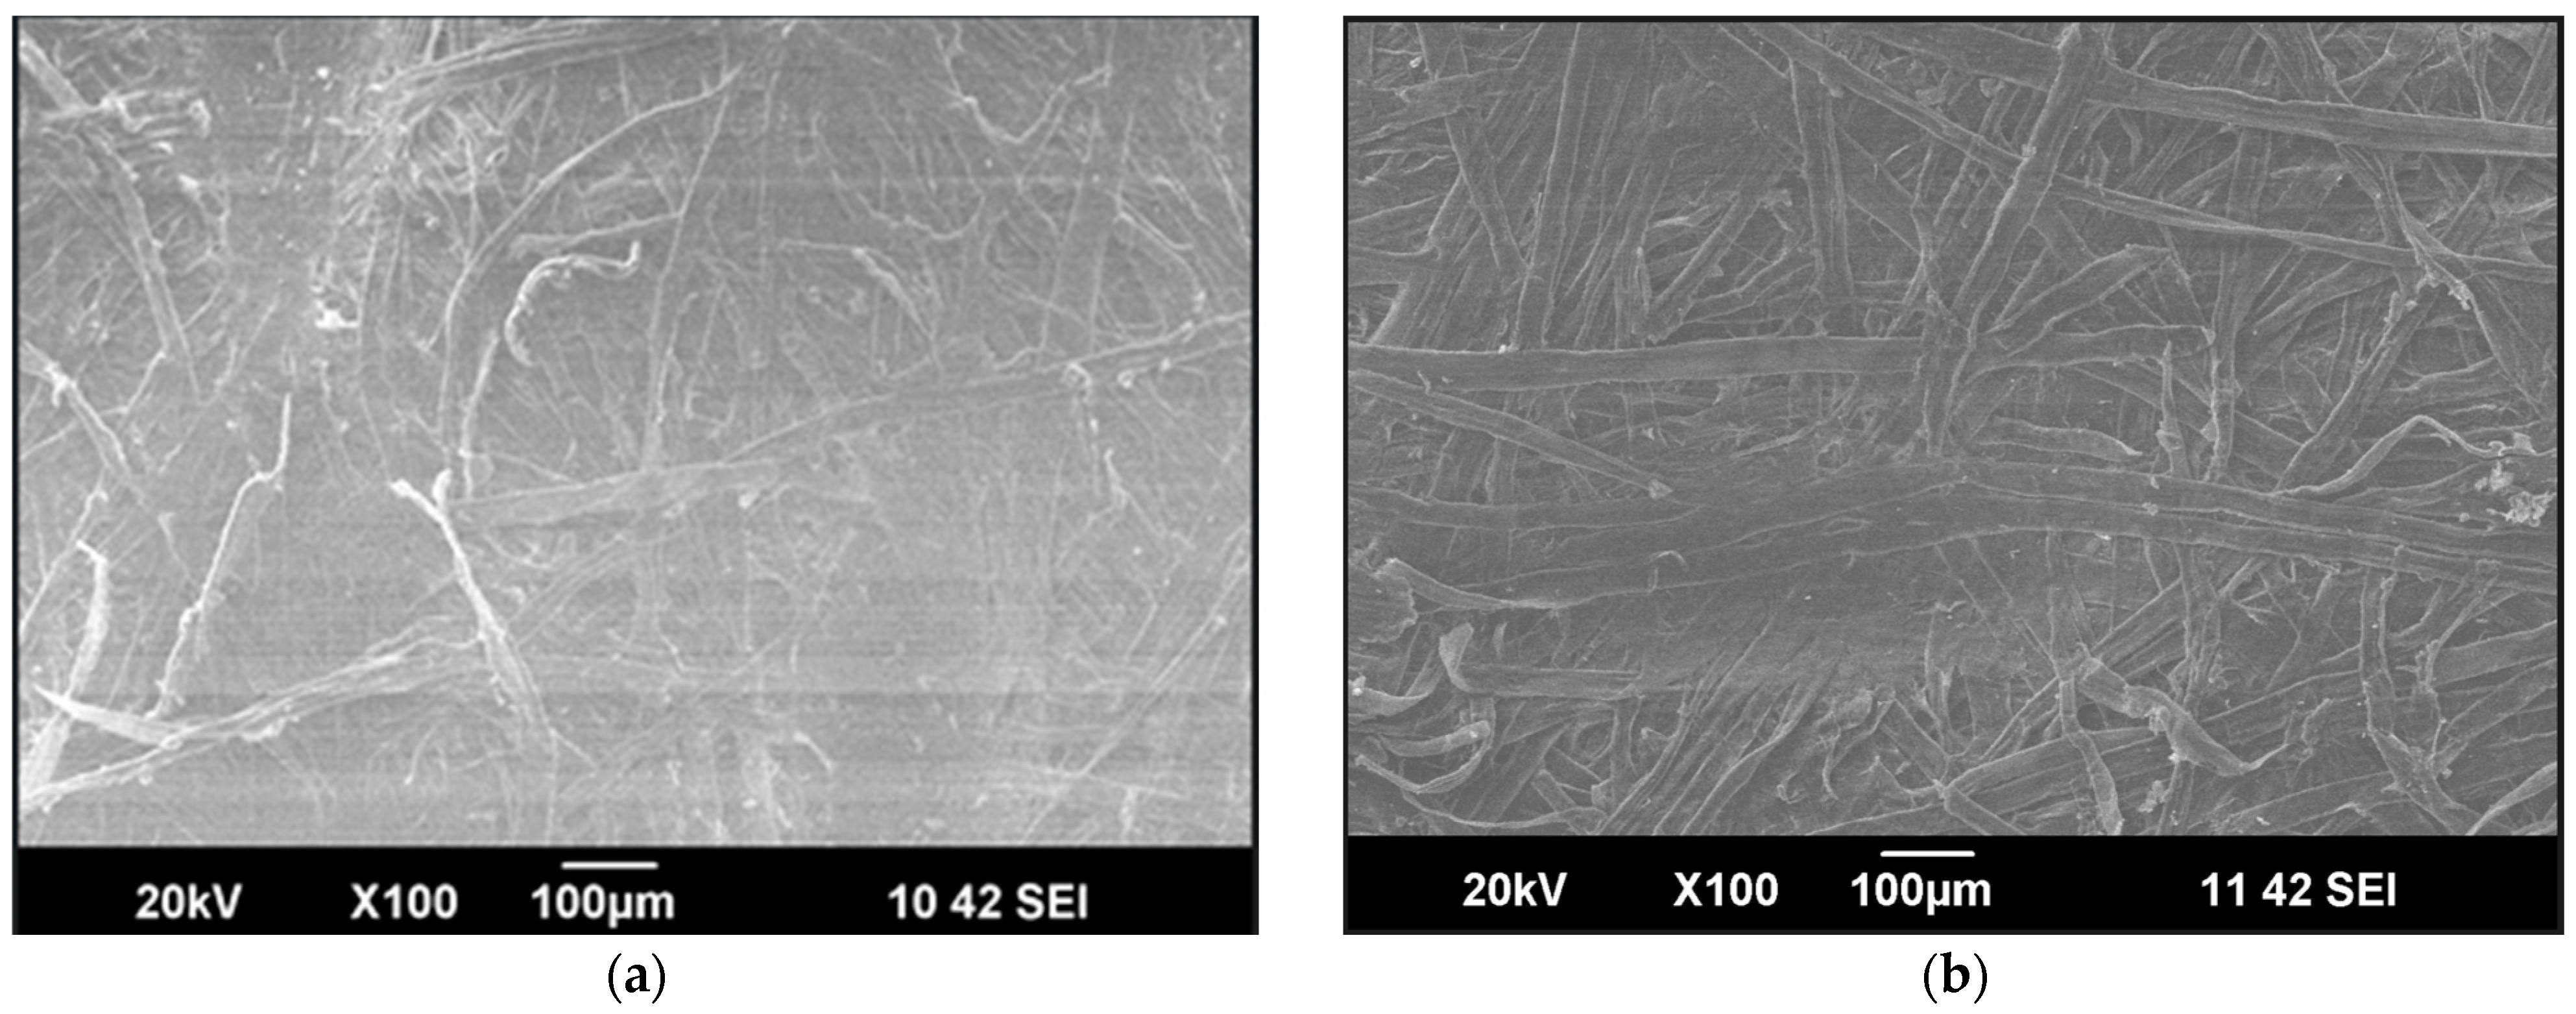
To explain, from a microscopic perspective, the reasons behind the differences in carrier mobility of oil-impregnated pressboards from different manufacturers, scanning electron microscopy (SEM) tests were conducted on Pressboard W and Pressboard F. The test results are presented in Figure 12.
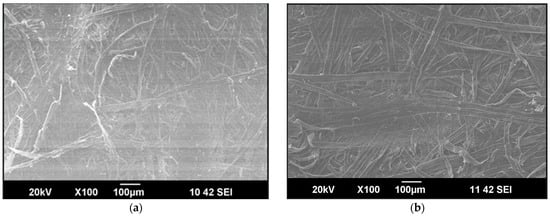
Figure 12.
SEM pictures of pressboards from different manufacturers: (a) Pressboard F; (b) Pressboard W.
The results from Figure 12 indicate the following: (1) Fiber Structure: The fibers of Pressboard F exhibit a more complex shape, a denser structure, and smaller fiber spacing, whereas the fibers of Pressboard W have a simpler shape, a looser structure, and larger fiber spacing. (2) Porosity: Pressboard F has fewer pores, which are unevenly distributed, resulting in lower porosity. In contrast, Pressboard W has more pores that are evenly distributed, resulting in higher porosity. (3) Interfaces and Defects: Pressboard F has more interfaces and more noticeable defects, such as cracks and voids, while Pressboard W has fewer interfaces and no obvious defects. (4) Surface Roughness: Pressboard F has a rough surface with higher surface roughness, whereas Pressboard W has a smoother surface with lower surface roughness.
The influence of pore structure on carrier mobility can be explained using Darcy law for flow in porous media. The flow velocity in the medium is given by Equation (19).
where v is the flow velocity, k is the permeability, η is the fluid viscosity, and ∇P is the pressure gradient.
In oil-impregnated pressboard, by replacing the pressure gradient ∇P with the electric field gradient ∇V, mobility can be indirectly reflected. Therefore, Equation (19) can be rewritten in the form of Equation (20).
where vd is the carrier drift velocity, and ∇V is the electric field gradient, which is numerically opposite to the electric field intensity E, E = −∇V.
The carrier mobility μ can be calculated as shown in Equation (21).
By combining Equations (20) and (21), the carrier mobility can be expressed as in Equation (22).
From Equation (22), it can be seen that carrier mobility is positively correlated with permeability and negatively correlated with viscosity.
Compared to Pressboard W, Pressboard F has a more complex fiber shape, a denser structure, fewer pores, and uneven pore distribution. Consequently, the migration path for carriers in Pressboard F is more tortuous, with a higher probability of scattering and collisions, which leads to a lower permeability compared to Pressboard W. Additionally, Pressboard F has smaller fiber spacing and higher surface roughness, which increases the viscous resistance encountered by the fluid during flow, resulting in higher fluid viscosity in Pressboard F than in Pressboard W. Furthermore, Pressboard F has more interfaces and more pronounced defects, which further hinder carrier migration and fluid flow, leading to reduced permeability, decreased carrier mobility, and increased fluid viscosity. According to Equation (22), the carrier mobility of Pressboard F is lower than that of Pressboard W, which is consistent with the experimental results obtained at room temperature.
5. Conclusions
In this study, a platform for measuring the carrier mobility of oil-impregnated pressboard was established based on the variable temperature surface potential decay method. The carrier mobility of different types of oil-impregnated pressboard was measured under different temperature and electric field conditions, revealing the changing law of carrier mobility and the influence mechanism of factors such as temperature and electric field strength. The main findings are as follows:
- The carrier mobility of oil-impregnated pressboard was measured under different electric field strengths and temperatures. When the electric field strength remained constant, the carrier mobility of the samples exhibited a positive correlation with temperature. As the temperature increased from 20 °C to 80 °C, the positive and negative carrier mobilities increased by factors of 4.01 and 4.72, respectively. When the temperature remained constant, the carrier mobility increased with increasing electric field strength. When the field strength increased from 1 kV/mm to 7 kV/mm, the positive and negative carrier mobilities increased by factors of 2.53 and 2.72, respectively.
- The carrier mobility of different oil-impregnated pressboard was measured under the same electric field strength and different temperatures. For different types of pressboard, the carrier mobility of pressboard with higher oil absorption rates exhibited more significant variations with temperature. Under an electric field strength of 7 kV/mm, as the temperature increased from 20 °C to 80 °C, the positive carrier mobility of pressboards with higher oil absorption rates increased from 3.96 × 10⁻¹³ m2·V−1·s−1 to 3.96 × 10⁻¹³ m2·V−1·s−1, an increase of 66.67 times, while the increase for pressboards with lower oil absorption rates was only 1.59 times. For different types of transformer oil, the carrier mobility of pressboards impregnated with the two naphthenic oil and paraffinic oil was of the order of 10−12 and 10−13, respectively.
- The variation patterns of carrier mobility with temperature and electric field strength can be explained using a carrier transport model based on the hopping mechanism. Regarding electric field strength, the exponential term in the carrier mobility calculation formula changes more rapidly than the (1/E) term, resulting in a positive correlation between carrier mobility and electric field strength. Regarding temperature, the proportion of activated particles increases, leading to faster carrier diffusion and, consequently, increased carrier mobility. Since the ability of carriers to move in insulating pressboard is relatively weak, the carrier mobility of pressboards with higher oil absorption rates exhibits more significant variations with temperature when impregnated with different types of oil. Due to the greater conductivity of naphthenic transformer oil, a higher carrier mobility for naphthenic oil-impregnated pressboard was observed.
- The influence of the microstructure of pressboard on carrier mobility can be explained using an oil–paper insulation model based on Darcy law and the scanning electron microscopy (SEM) results. Pressboard F has more complex fiber shapes, a denser structure, lower porosity, and greater obstacles during carrier migration, resulting in lower permeability. Combined with Darcy’s law, it can be concluded that carrier mobility is positively correlated with permeability. Therefore, compared to Pressboard W, Pressboard F has lower carrier mobility.
Author Contributions
Conceptualization, J.D., C.G. and G.L.; data curation, H.G., X.X. and H.Z.; formal analysis, J.D., Z.X., H.G. and C.G.; funding acquisition, J.D. and H.W.; investigation, J.D., Z.X., H.G. and C.G.; methodology, Z.X. and C.G.; project administration, J.D., H.Z. and G.L.; resources, J.D., Z.P. and H.W.; software, J.C. and Z.P.; supervision, C.G.; validation, X.X. and J.C.; visualization, J.C., H.Z. and Z.P.; writing—original draft, J.D., Z.X., H.G. and X.X.; writing—review and editing, H.G., X.X., C.G. and G.L. All authors have read and agreed to the published version of the manuscript.
Funding
This study is supported by the technology project from China Southern Power Grid EHV Power Transmission Company (Grant No. 0120002023030301SJ00004).
Data Availability Statement
The original contributions presented in the study are included in the article; further inquiries can be directed to the corresponding author.
Conflicts of Interest
Authors Jun Deng, Zhicheng Xie, Haibin Zhou, Zhicheng Pan, Gang Lyu, and Heng Wu were employed by the China Southern Power Grid EHV Power Transmission Company. The remaining authors declare that the research was conducted in the absence of any commercial or financial relationships that could be construed as potential conflicts of interest. The funding sponsors had no role in the design of the study; in the collection, analyses, or interpretation of data; in the writing of the manuscript; or in the decision to publish the results.
References
- Gao, L.; Xu, H.; Guo, H.; Wu, K. Effect of BTA on charge mobility in insulating oil and oil-immersed paper. In Proceedings of the 2023 IEEE Conference on Electrical Insulation and Dielectric Phenomena, East Rutherford, NJ, USA, 15–19 October 2023; IEEE: New York, NY, USA, 2023; pp. 1–4. [Google Scholar]
- Cremasco, A.; Limburg, A.; Wouters, P.; Duivenbode, J. Charge conduction modeling in synthetic ester and Kerr effect measurements of the electric field. In Proceedings of the 2024 IEEE International Conference on High Voltage Engineering and Applications, Berlin, Germany, 18–23 August 2024; pp. 1–4. [Google Scholar]
- Cai, X.; Wang, X.; Pang, D.; Zou, X.; Yu, J.; Lu, Z. Investigation of current density, recombination rate and space charge density in polyethylene thin films based on bipolar charge transport model. Mater. Res. Express 2019, 6, 096451. [Google Scholar] [CrossRef]
- Gao, L.; Wu, Y.; Chen, J.; Lv., Z.; Wu, K. Comparison of charge mobility in insulating oil and oil-immersed paper. In Proceedings of the 2022 IEEE Conference on Electrical Insulation and Dielectric Phenomena, Denver, CO, USA, 30 October–2 November 2022; IEEE: New York, NY, USA, 2022; pp. 9–12. [Google Scholar]
- Gao, L.; Xu, H.; Lv, Z.; Wu, K. Effect of temperature on charge mobility in oil-paper insulation. In Proceedings of the IEEE International Conference on Dielectrics, Toulouse, France, 30 June–4 July 2024. [Google Scholar]
- Tu, Y.; Wu, S.; Xu, H.; Zhang, X.; Shao, Y.; Chen, G. Simulation on solid-gas interface charge accumulation characteristics under repetitive impulse voltage. In Proceedings of the 2022 IEEE International Conference on High Voltage Engineering and Applications, Chongqing, China, 26–29 September 2022; pp. 1–4. [Google Scholar]
- Shi, S.; Hao, J.; Jian, Z.; Liao, R. DC electric field effect on conductivity and interface charge of oil-paper insulation. IEEE Trans. Dielectr. Electr. Insul. 2023, 30, 1525–1533. [Google Scholar] [CrossRef]
- Zhang, J.; Chen, Q.; Chi, M.; Tan, P.; Sun, W.; Cao, J. Effect of temperature on space charge characteristics of oil-paper insulation and its numerical simulation. IEEE Trans. Dielectr. Electr. Insul. 2019, 26, 1334–1342. [Google Scholar] [CrossRef]
- Liu, H.; Chen, K.; Xiao, M.; Du, B. Space charge deflection behavior under strong magnetic fields. In Proceedings of the 2024 IEEE 5th International Conference on Dielectrics (ICD), Toulouse, France, 30 June–4 July 2024; pp. 1–4. [Google Scholar]
- Hao, J.; Zou, R.; Liao, R.; Yang, L.; Liao, Q. New Method for Shallow and Deep Trap Distribution Analysis in Oil Impregnated Insulation Paper Based on the Space Charge Detrapping. Energies 2018, 11, 271. [Google Scholar] [CrossRef]
- Zhang, J.; Chi, M.; Chen, Q.; Sun, W.; Cao, J. Effect of Temperature on Space Charge Distribution in Two Layers of Transformer Oil and Impregnated Pressboard Under DC Voltage. IEEE Access 2020, 8, 16647–16655. [Google Scholar] [CrossRef]
- Zhang, Z.; Yang, K.; Chi, C.; Yang, F.; Liu, L.; Wang, S. Space charge transport characteristic considering the non-uniform electric effect of ion mobility. IEEE Access 2020, 8, 114211–114218. [Google Scholar] [CrossRef]
- Funahashi, M. Time-of-Flight Method for Determining the Drift Mobility in Organic Semiconductors. Org. Semicond. Optoelectron. 2021, 3, 161–178. [Google Scholar]
- Montanari, G. Bringing an insulation to failure: The role of space charge. IEEE Trans. Dielectr. Electr. Insul. 2011, 18, 339. [Google Scholar] [CrossRef]
- Cheng, C.; Wu, K.; Su, R.; Wu, Y.; Dai, J. A new method for carrier mobility measurement in oil immersed cellulose paper insulation. IEEE Trans. Dielectr. Electr. Insul. 2019, 26, 308–313. [Google Scholar] [CrossRef]
- Cheng, C.; Fu, M.; Wu, K.; Ma, Y.; Hao, Y.; Chen, C. Aging effect on interface charges between oil and oil-immersed paper. IEEE Trans. Dielectr. Electr. Insul. 2021, 28, 1579–1587. [Google Scholar] [CrossRef]
- Li, J.; Zhou, F.; Min, D.; Li, S.; Xia, R. The energy distribution of trapped charges in polymers based on isothermal surface potential decay model. IEEE Trans. Dielectr. Electr. Insul. 2015, 22, 1723–1732. [Google Scholar] [CrossRef]
- Li, S.; Yan, W.; Yan, C.; Min, D.; Li, S.; Kang, W. Surface trap and carrier transport of aged and pristine oil-paper under harmonic voltage by surface potential decay. In Proceedings of the IEEE Conference on Electrical Insulation and Dielectric Phenomenon (CEIDP), Fort Worth, TX, USA, 22–25 October 2017; pp. 94–97. [Google Scholar]
- Huang, M.; Zhou, Y.; Dai, C.; Chen, W.; Lu, L.; Sha, Y. Charge Transport in Thermally and Electrically Stressed Oil-impregnated Paper Insulation. IEEE Trans. Dielectr. Electr. Insul. 2016, 23, 266–274. [Google Scholar] [CrossRef]
- IEC. Methods of Determination of Certain Dielectric Properties of Insulating Materials at Power, Audio and Radio Frequencies. IEC Standard 62021; International Electrotechnical Commission: Geneva, Switzerland, 2011. [Google Scholar]
- IEC 60641-2; Pressboard and Presspaper for Electrical Purposes—Part 2: Methods of Test. International Electrotechnical Commission: Geneva, Switzerland, 2004.
- Nakane, R.; Okubo, H.; Kato, K. HVDC electrical insulation performance based on charge activity in oil-pressboard composite insulation structures. IEEE Trans. Dielectr. Electr. Insul. 2019, 26, 576–583. [Google Scholar] [CrossRef]
Disclaimer/Publisher’s Note: The statements, opinions and data contained in all publications are solely those of the individual author(s) and contributor(s) and not of MDPI and/or the editor(s). MDPI and/or the editor(s) disclaim responsibility for any injury to people or property resulting from any ideas, methods, instructions or products referred to in the content. |
© 2024 by the authors. Licensee MDPI, Basel, Switzerland. This article is an open access article distributed under the terms and conditions of the Creative Commons Attribution (CC BY) license (https://creativecommons.org/licenses/by/4.0/).

