1. Introduction
With the continuous growth in global energy demand, the development of unconventional oil and gas resources has become one of the central challenges in the energy sector. In particular, the development of the Yanchang Formation and Member 3 reservoirs in the Weibei Oilfield of the Ordos Basin, China, is crucial to meeting this demand. This typical tight sandstone reservoir has become a focal point in the efficient development of tight oil due to its unique microscopic pore structures and complex displacement mechanisms [
1,
2]. While many scholars have conducted extensive research on tight oil reservoirs, these reservoirs still exhibit unique characteristics depending on their geographical location. For the Chang 3 reservoir in the WeiBei Oilfield, there are still geological complexities, unclear micro-pore structures, and their impact on tight oil recovery. Given this, this paper first clarifies the microscopic pore structure characteristics of tight reservoirs by completing core thin section observations and high-pressure mercury injection tests. Then, it employs water flooding experiments, oil-water two-phase relative permeability measurements, and stress sensitivity experiments to elucidate the displacement mechanism and stress sensitivity of tight reservoirs. These research results not only promote the sustainable development of unconventional oil and gas resources but also provide theoretical and practical guidance for the development of similar tight oil reservoirs, which is of significant theoretical and practical importance.
2. Geological Setting
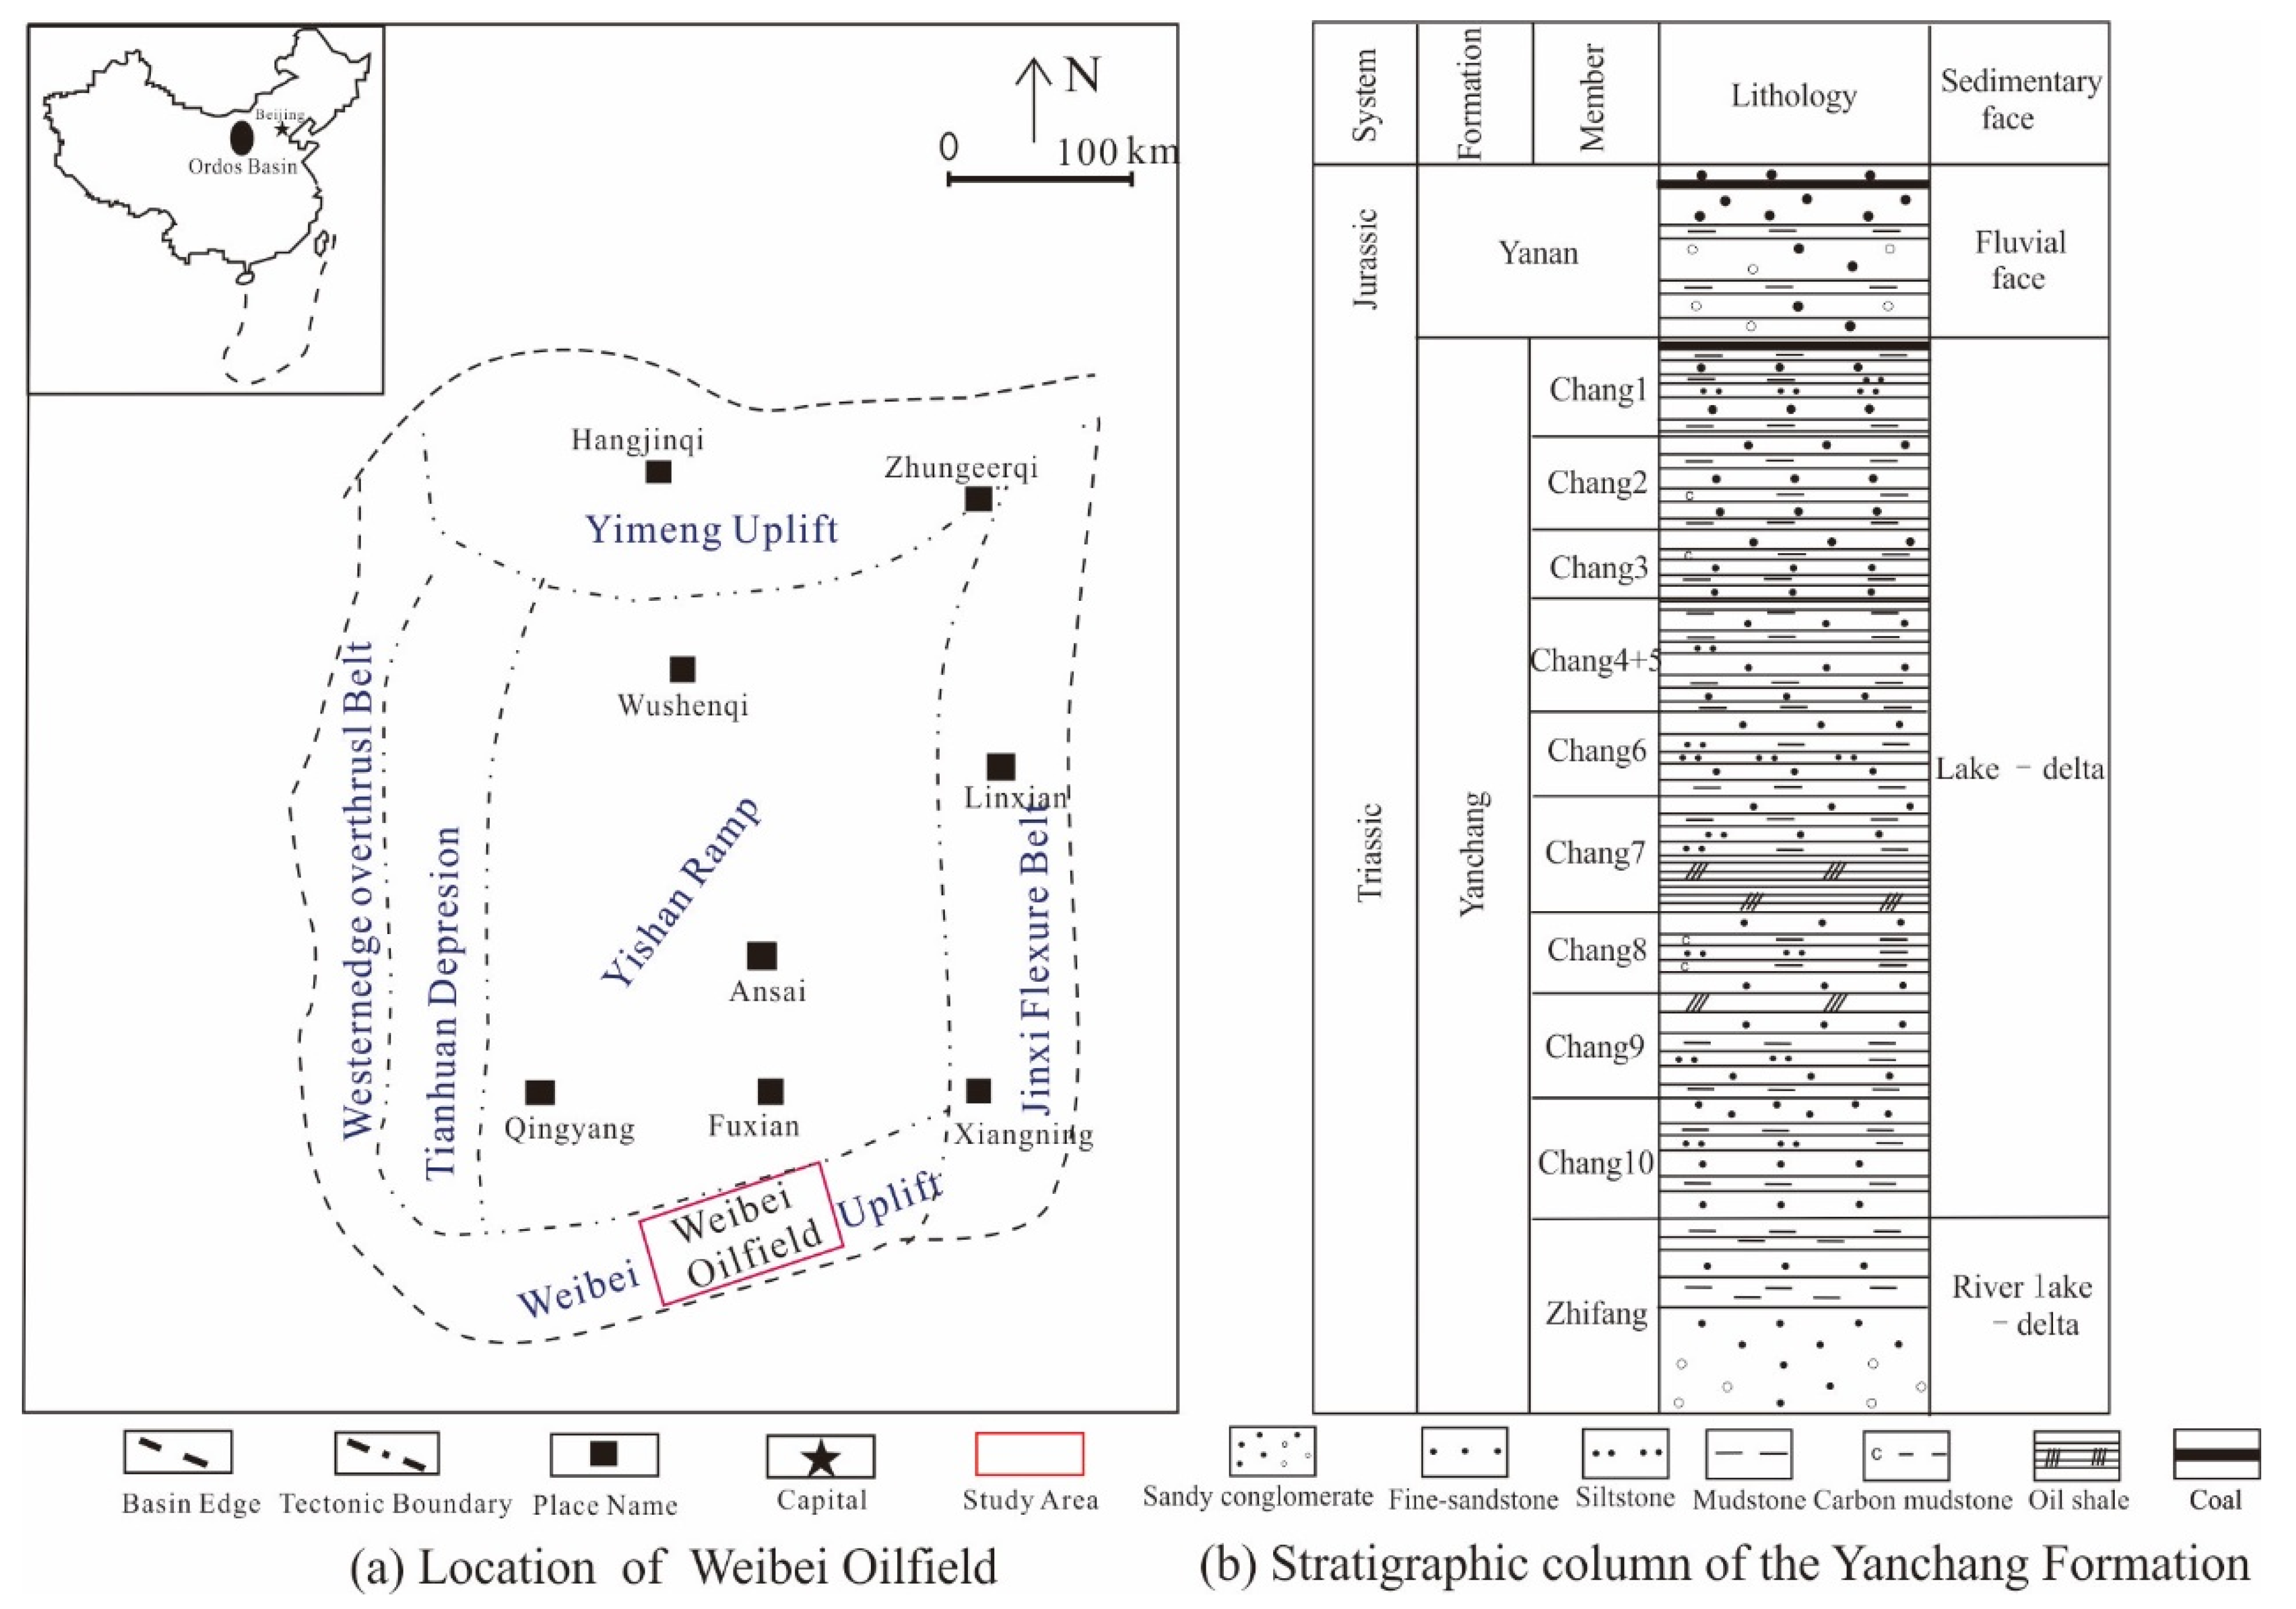
The Weibei Oilfield is located in the southeastern part of the Ordos Basin, China, at the intersection of the Weibei Uplift and the Yishan Slope (
Figure 1a). The overall geological structure exhibits a monocline with a northwest low to southeast high trend, primarily influenced by the tectonic activities associated with the Weibei Uplift Zone [
3]. In this region, although there are some small-scale faults, their displacements are relatively minor, and there are few faulted layers. The total area of the research area is approximately 2028.9 km
2, with estimated oil reserves reaching 1.46 × 10
8 t and natural gas reserves estimated at approximately 263.6 × 10
8 m
3 [
4]. Based on stratigraphic markers such as tuff, shale, and coal seams, the Upper Triassic Yanchang Formation in the study area can be subdivided from the bottom to the top into intervals Chang 10 to Chang 1 (
Figure 1b) [
5]. Among these intervals, Chang 3 is considered to be the primary oil-bearing stratum, with an average burial depth of 550 m. The Chang3 member sedimentary environment represents the subaqueous subfacies of a delta front, primarily characterized by the development of subaqueous distributary channel sand bodies within the delta front. The average thickness of these sand bodies is 6.13 m.
3. Samples and Methods
This study conducted core thin section observations, high-pressure mercury intrusion tests, water flooding experiments, oil-water phase permeability tests, and stress sensitivity experiments on the Chang 3 reservoir in the Weibei Oilfield. These investigations comprehensively explored its microscopic pore structure characteristics and displacement properties from various perspectives.
Under the conditions of room temperature at 25 °C and a relative humidity of 50%, this study utilized a Carl Zeiss metallographic microscope to observe and analyze a total of 234 thin sections of castings. This was conducted to determine parameters such as the mineral composition, pore types, particle size distribution, and surface porosity of the thin sections. The entire process strictly adhered to SY/T 5368-2000, “Rock Thin Section Identification”.
Under environmental conditions of 18 °C and 30% relative humidity, high-pressure mercury intrusion tests were conducted on 35 core samples of tight sandstone from the Chang 3 reservoir using the AutoPore IV 9505 fully automated mercury intrusion porosimetry instrument. This study aimed to obtain parameters related to the porosity, permeability, mercury intrusion curves, and pore structure characteristics of the rock samples to gain a deeper understanding of the reservoir rock properties. The experimental procedure followed the relevant standards and specifications outlined in SY/T 5346-2005, “Determination of Capillary Pressure Curve for Rocks”.
This study investigated the impact of rock core properties on fluid flow performance through consecutive water flooding and oil-water two-phase relative permeability experiments on two core samples from the Chang 3 reservoir. The research was conducted following the guidelines outlined in SY/T 5345-2007, “Measurement of Relative Permeability for Two-Phase Fluids in Rocks”.
Furthermore, reservoir stress sensitivity experiments were carried out on 16 Chang 3 reservoir samples under various confining pressure conditions. The experiments were conducted in accordance with the methodology specified in SY/T 5358-2002, “Evaluation Method for Reservoir Sensitivity Flow Experiment”.
4. Results
4.1. Microscopic Pore Structure Characteristics
From the analysis of thin sections of core samples under a microscope, it is observed that the reservoir in the Chang 3 member of the Weibei Oilfield is predominantly composed of very fine to fine-grained sandstone with well-developed sorting and contact-porosity cementation. The primary mineral components in the thin sections include quartz (55.54%), feldspar (24.09%), and debris (19.31%), followed by chlorite, bitumen, and pyrite, among others. The asphalt exists through filling or impregnating intergranular spaces, while mica exhibits localized, oriented band-like arrangements on the rock slices (
Figure 2). The major cementing materials include siliceous, argillaceous, carbonate minerals, and clay minerals. The pores in the Chang 3 interval are well-developed, with an average porosity of 7.58% and a relatively low specific surface area (0.31 μm
−1). The relative low value of the porosity shape factor (0.47) indicates a high porosity with regular shapes. The average coordination number of pore throats is 0.48, and the pore sorting coefficient is 9.98, indicating a high number of connected pore throats and strong heterogeneity in porosity. The predominant forms of pore throats are sheet-like and constricted, with occasional partially connected configurations. No evidence of cement-filled fractures was observed.
Through high-pressure mercury injection experiments on 35 samples from the Chang 3 reservoir in the study area, physical and relevant pore-throat structural parameters were obtained (
Table 1). The porosity of the samples ranges from 2.20% to 14.97%, with a mean value of 10.17%. The permeability ranges from 0.09 × 10
−3 μm
2 to 1.58 × 10
−3 μm
2, with a mean value of 0.44 × 10
−3 μm
2. The displacement pressure varies from 0.35 MPa to 6.42 MPa, with a mean value of 1.88 MPa. The maximum pore-throat radius ranges from 0.12 μm to 2.17 μm, with a mean value of 0.71 μm.
Through further analysis of the mercury injection amout/permeability contribution rate and the correlation with pore-throat radius in the Chang 3 reservoir, the morphological characteristics of pore-throat distribution are revealed. This study found that the pore-throat distribution primarily exhibits a single peak and a double peak, with the double peak being predominant, accounting for a high proportion of 74% (
Figure 3). For a single peak pore throat distribution, it generally belongs to a single pore type. According to the analysis of pore throat types in thin sections of cast thin sections, the pores in single peak samples are mainly inter-granular dissolution pores or intra-granular dissolution pores, and the pore throat sorting is good, with a sorting mean value of 0.86. In contrast, the double peak pore throat distribution reveals that the reservoir mainly develops pore spaces in two diameter ranges. Comprehensive analysis of pore distribution characteristics indicates that the pore types in double peak samples are mainly intergranular dissolution pores and intra-granular dissolution pores, with poor sorting effects and a sorting mean value of 1.44. Additionally, the physical property averages of double peak samples are inferior compared to single peak samples, indicating that in tight reservoirs with a relatively single pore type, the physical properties are better.
4.2. Water Flooding Experiment
Through water flooding experiments on two core samples taken from the Chang 3 member, the aim is to gain an in-depth understanding of fluid behavior in reservoir development and its impact on oil production efficiency. The experimental results are detailed in
Table 2,
Table 3 and
Table 4. The experimental conditions for the first sample were a temperature of 40 °C, an oil viscosity of 2.92 mPa·s, an injected water viscosity of 0.73 mPa·s, and an oil-water viscosity ratio of 4. The second sample, at a temperature of 20 °C, had an oil viscosity of 4.56 mPa·s, an injected water viscosity of 1.14 mPa·s, and the same oil-water viscosity ratio of 4.
4.3. Oil-Water Two-Phase Relative Permeability Measurement
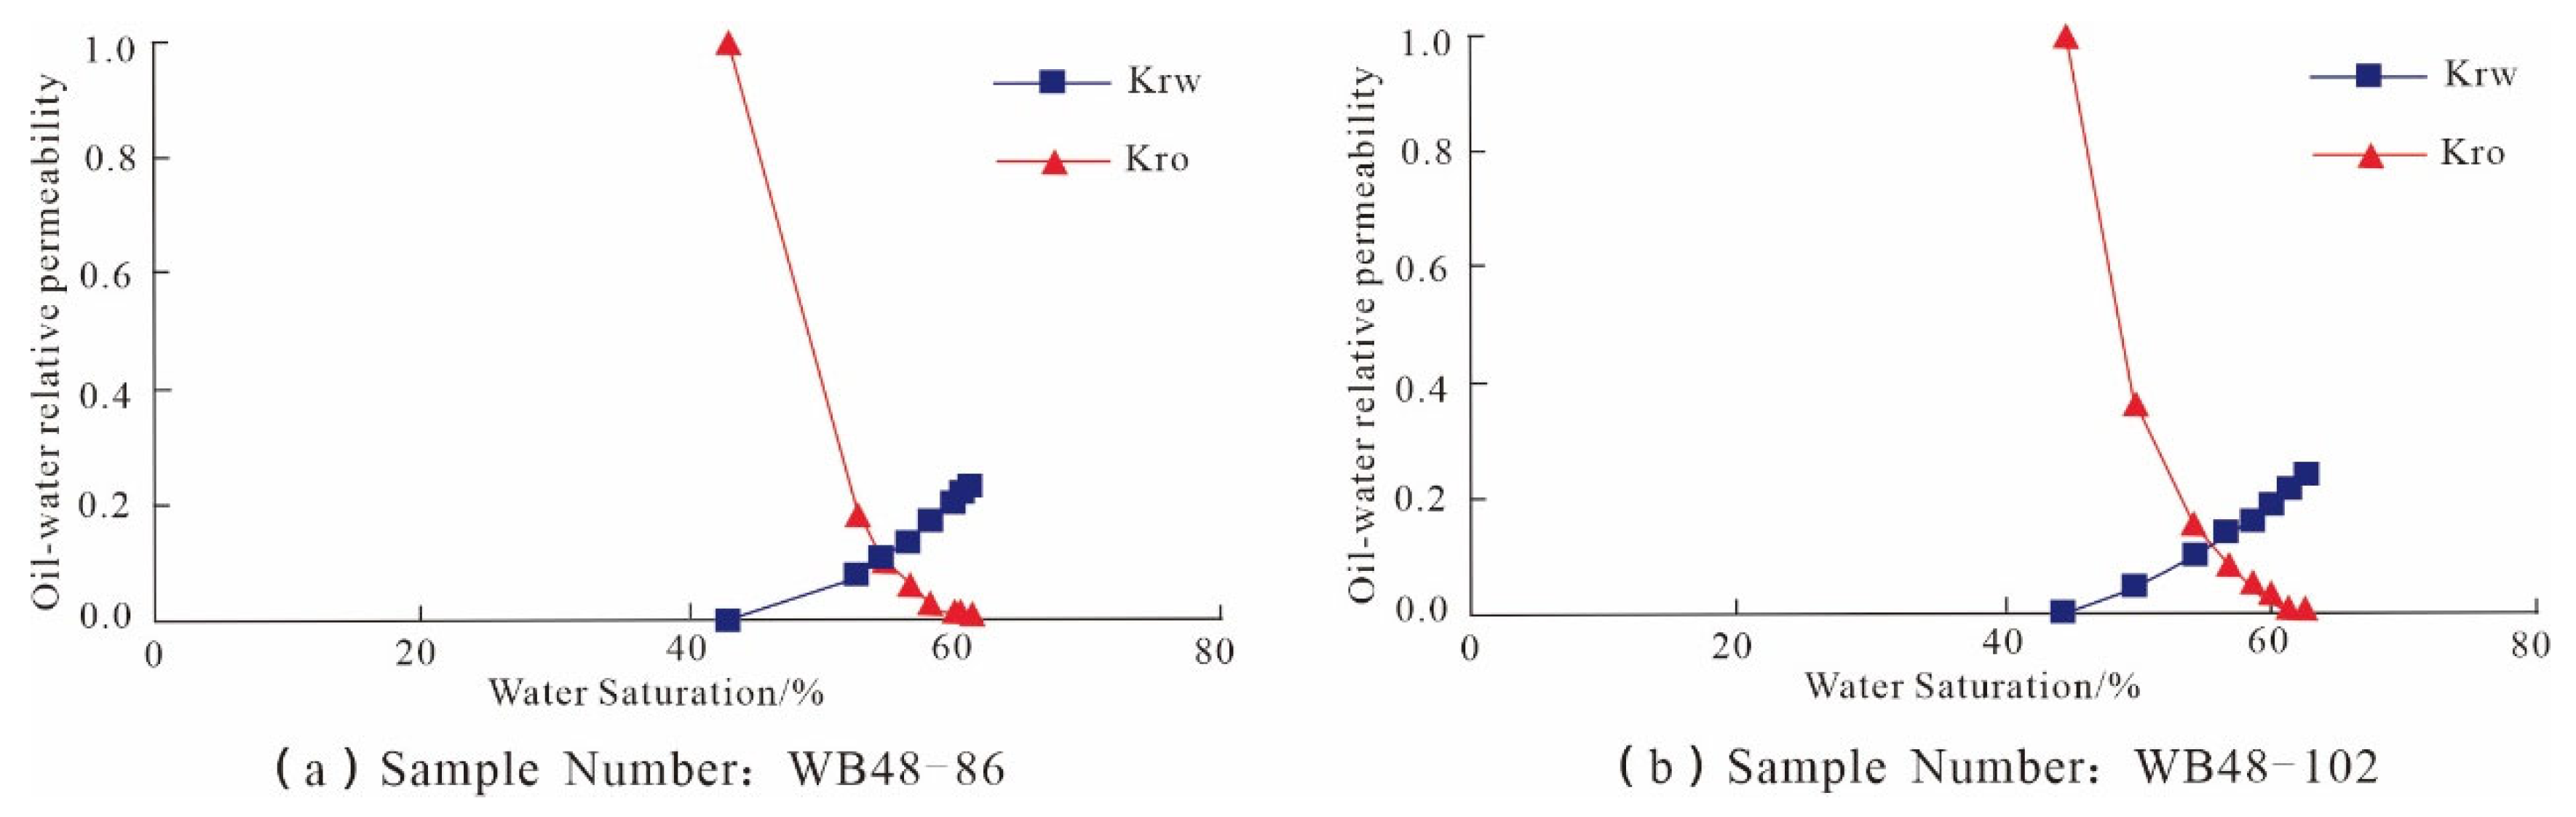
The two core samples used for the water flooding experiment underwent oil-water two-phase relative permeability measurements. Through this series of measurements, relevant data were obtained (
Table 5), and the permeability curves of both oil and water phases were plotted (
Figure 4). These measurements provide crucial experimental support and foundational data for a thorough understanding of the development potential of tight oil reservoirs.
4.4. Stress Sensitivity Experiments
When the effective stress acting on the reservoir rocks buried underground changes, the pores and throats deform, leading to a reduction in the permeability of the reservoir rocks. This phenomenon is known as reservoir stress sensitivity [
5]. In the study of reservoir stress sensitivity in the Yanchang Formation of the Weibei Oilfield, experiments were conducted to investigate the reservoir stress sensitivity under varied confining pressure conditions. The research involved net confining pressure unidirectional increase overburden porosity permeability experiments as well as net confining pressure cycling overburden porosity and permeability experiments.
4.5. Net Confining Pressure Unidirectional Increase Overburden Porosity Permeability Experiment
In the net confining pressure unidirectional increase overburden porosity permeability experiment, the confining pressure for 13 samples (
Table 6) gradually increased from 0 MPa to 50 MPa, and the variations in sample permeability were measured (
Figure 5). By calculating the permeability damage ratio under net confining pressure (
Table 7), critical information regarding changes in permeability under different pressure conditions can be obtained.
4.6. Net Confining Pressure Cyclying Overburden Porosity Permeability Experiments
In order to clearly reflect the different stress sensitivities, by plotting the cube root of the dimensionless permeability (K
i/K
0) against the logarithm of stress [
6], a linear relationship can be obtained between (K
i/K
0)
1/3 and lg(σ
i/σ
0):
where: K
0—initial hydraulic conductivity corresponding to the initial effective stress σ
0; 10
−3 μm
2; S
s—slope.
The increase in the S
s value implies an amplified influence of effective stress, indicating a stronger stress sensitivity of the core. The variation in S
s values can visually reflect the degree of stress sensitivity of the core. According to the stress sensitivity evaluation criteria (
Table 8), the experimental results in the study area were obtained (
Table 9,
Figure 6).
The analysis results indicate that the stress sensitivity of the Chang 3 member in the study area ranges from weak to strong (0.2681~0.7923), with a significant fluctuation range. The permeability of the reservoir is generally sensitive to changes in net confining pressure.
5. Discussion
5.1. Microscopic Pore Structure Classification Evaluation
Microscopic Pore Structure of Reservoirs—The combined characteristics of pores and throats are quite complex; especially for tight sandstone reservoirs. Given the current lack of clarity in the research on the impact of the microscopic pore structure on recovery rates and productivity, this study may not consider the interaction among internal factors and their influence on the final recovery rate. Only considering the output parameters of the pore and throat system, that is, only considering mercury withdrawal efficiency and mercury withdrawal saturation. Integrating the output parameters and using the comprehensive evaluation parameter E to assess the characteristics of reservoir micro-pores and throats. This method is similar to the mathematical black box theory (where one does not concern themselves with the internal functions of the system from the outside but only focuses on the system’s external functions and interfaces) [
7,
8]. For systems composed of pores and throats, the focus is not on the internal factors of the pore-throat system and their mutual influences and interactions, but solely on the output parameters of the pore-throat system. Previous studies have found that there is no significant correlation between mercury withdrawal efficiency, mercury withdrawal saturation, and reservoir physical properties or reservoir pore-throat characteristic parameters [
9]. No single factor has a significant impact on them. Therefore, based on the results parameters of mercury injection experiments (mercury withdrawal efficiency and mercury withdrawal saturation), it is proposed to use the product of mercury withdrawal saturation and mercury withdrawal efficiency as a comprehensive evaluation parameter (E) for the micro-pore structure of ultra-low permeability tight reservoirs. The mercury withdrawal saturation corresponds to the mobile resource quantity and production capacity in oil field development, while the mercury withdrawal efficiency corresponds to the ultimate recovery factor in oil field development [
10,
11]. The factors influencing these two aspects are quite complex, and only when both reach optimal matching is it considered the optimal ultra-low-permeability reservoir. The calculation formula is:
In the equation, E represents the comprehensive evaluation parameter of reservoir micro-pore structure; EW and SE denote mercury withdrawal efficiency and mercury withdrawal saturation, %.
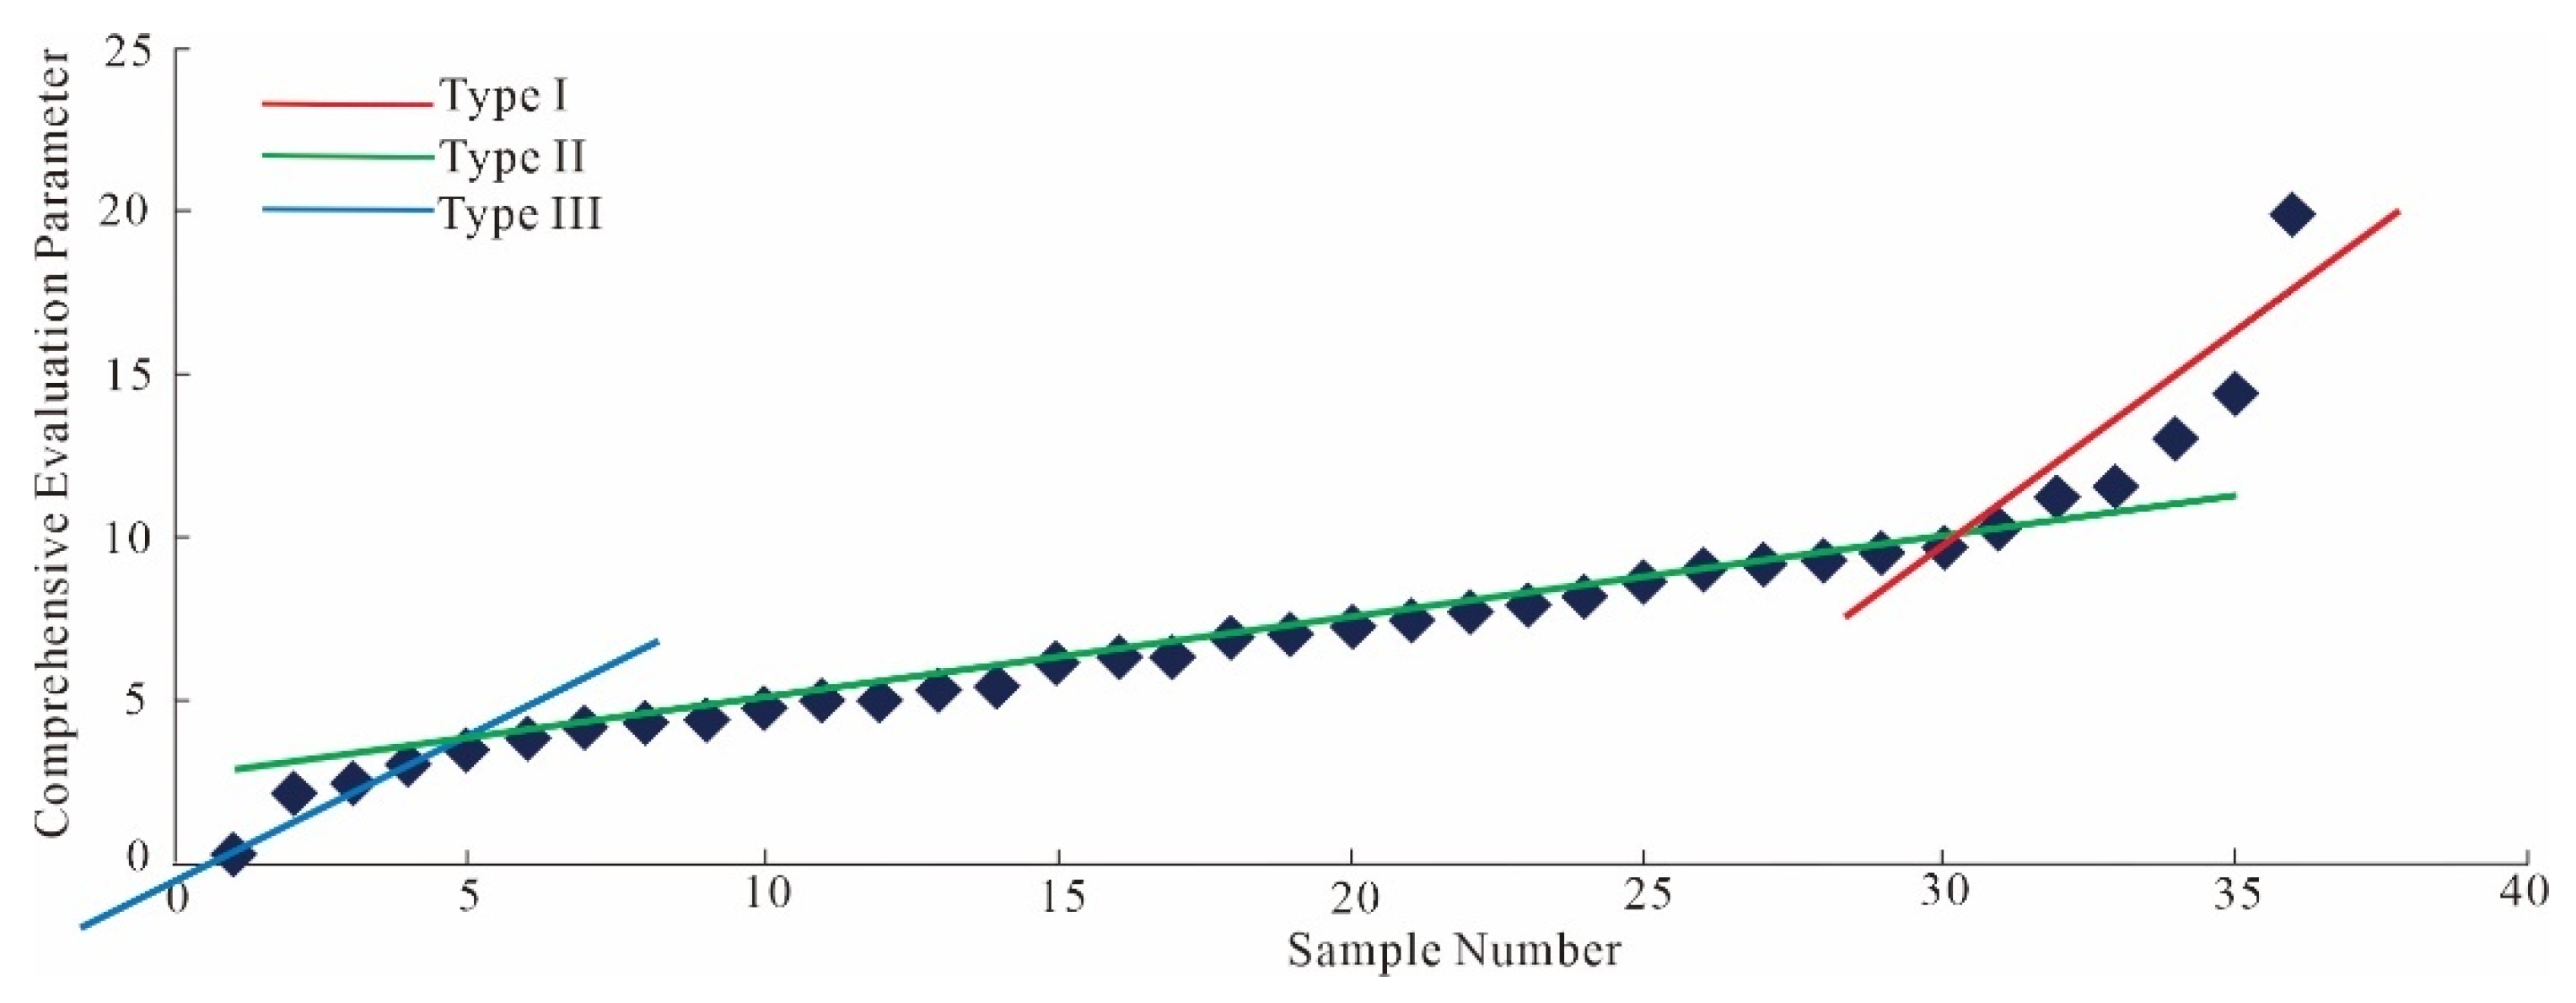
An evaluation of the microscopic pore structure of the Chang 3 reservoir revealed a distinctly three-stage distribution of E, with steep segments at both ends and a gentle segment in the middle. Based on the distribution characteristics of its scatter points, the micro-pore structure of the Chang 3 tight sandstone reservoir in the study area can be classified into three types (
Figure 7,
Table 10 and
Table 11). When E is less than 3.4990, the reservoir’s pore structure is poor, exhibiting lower E values, and it is categorized as a Type III reservoir. When E values exceed 9.6563, it demonstrates favorable pore and throat characteristics and is categorized as a Type I reservoir. The intermediate range of E, from 3.4990 to 9.6563, is classified as a Type II reservoir. The classification results for various reservoir types in the study area are shown in
Table 10, where Class II reservoirs dominate (66.68%), followed by Class I reservoirs (19.44%), with Class III reservoirs occupying the smallest share (13.88%).
5.2. Analysis of Factors Affecting Oil Recovery Efficiency
Through the analysis of basic data from the water flooding experiment on oil, it was found that the porosity of the core samples was 15.85% and 15.79%, respectively. The permeability values were 1.77 × 10
−3 μm
2 and 0.48 × 10
−3 μm
2, respectively. Additionally, the irreducible water saturation was found to be 43.22% and 45.73%, respectively. Analyzing the water flooding experiment result data (
Table 6), it is found that as the injection multiple increases, the water production rate increases and the oil displacement efficiency increases. Further analysis of the factors affecting oil displacement efficiency and their degree of influence found that the higher the injection ratio, the higher the oil displacement efficiency and water production rate (
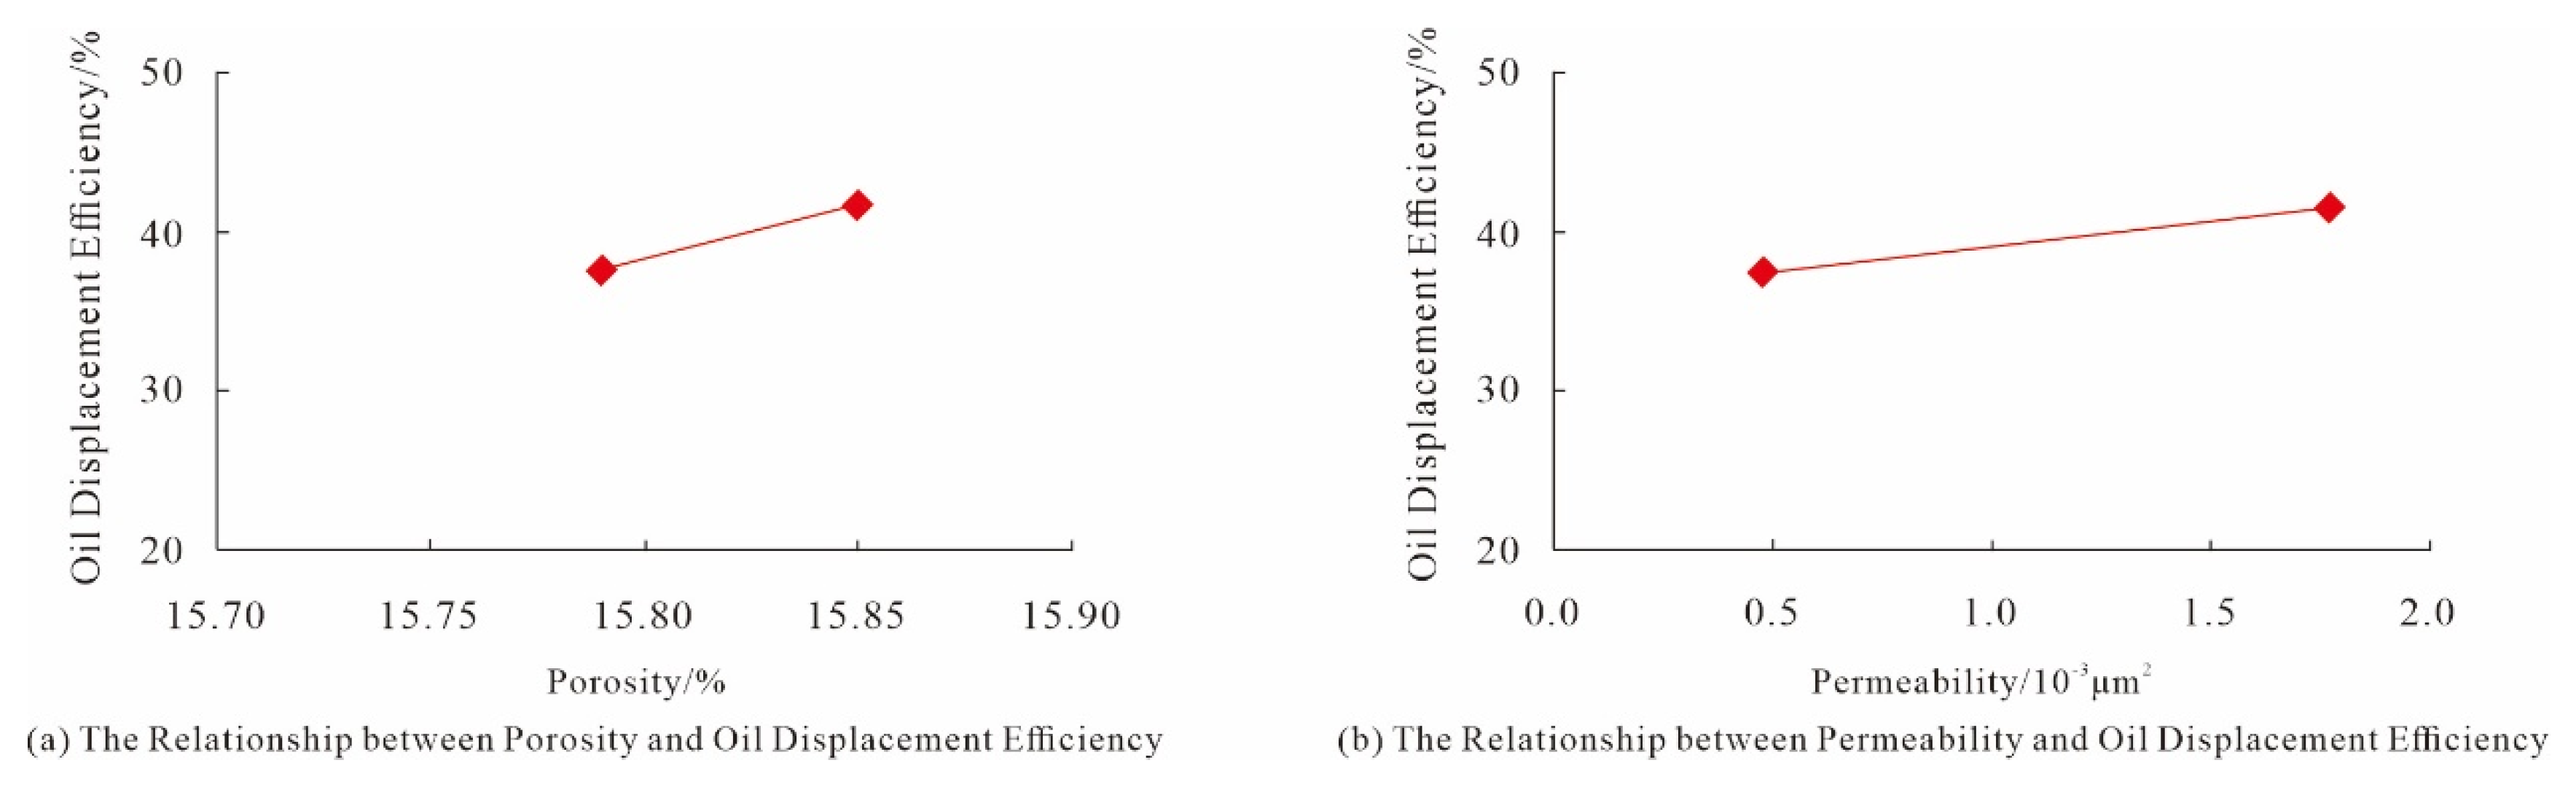
Figure 8). Research shows that when the injection ratio is within a small range (generally 0.1 to 1.5 times), as the injection ratio increases, the oil displacement efficiency and water cut increase faster, and their increase amplitude is also higher. When the injection ratio is greater than 1.5 times, if the injection ratio is further increased, the oil displacement efficiency and water content will not increase significantly. Analyzing the influence of reservoir physical properties on oil displacement efficiency (
Figure 9), it can be seen that as the reservoir physical properties of the Chang 3 reservoir improve, the oil displacement efficiency of the sample increases [
12]. Analyzing the influence of irreducible water saturation on oil displacement efficiency (
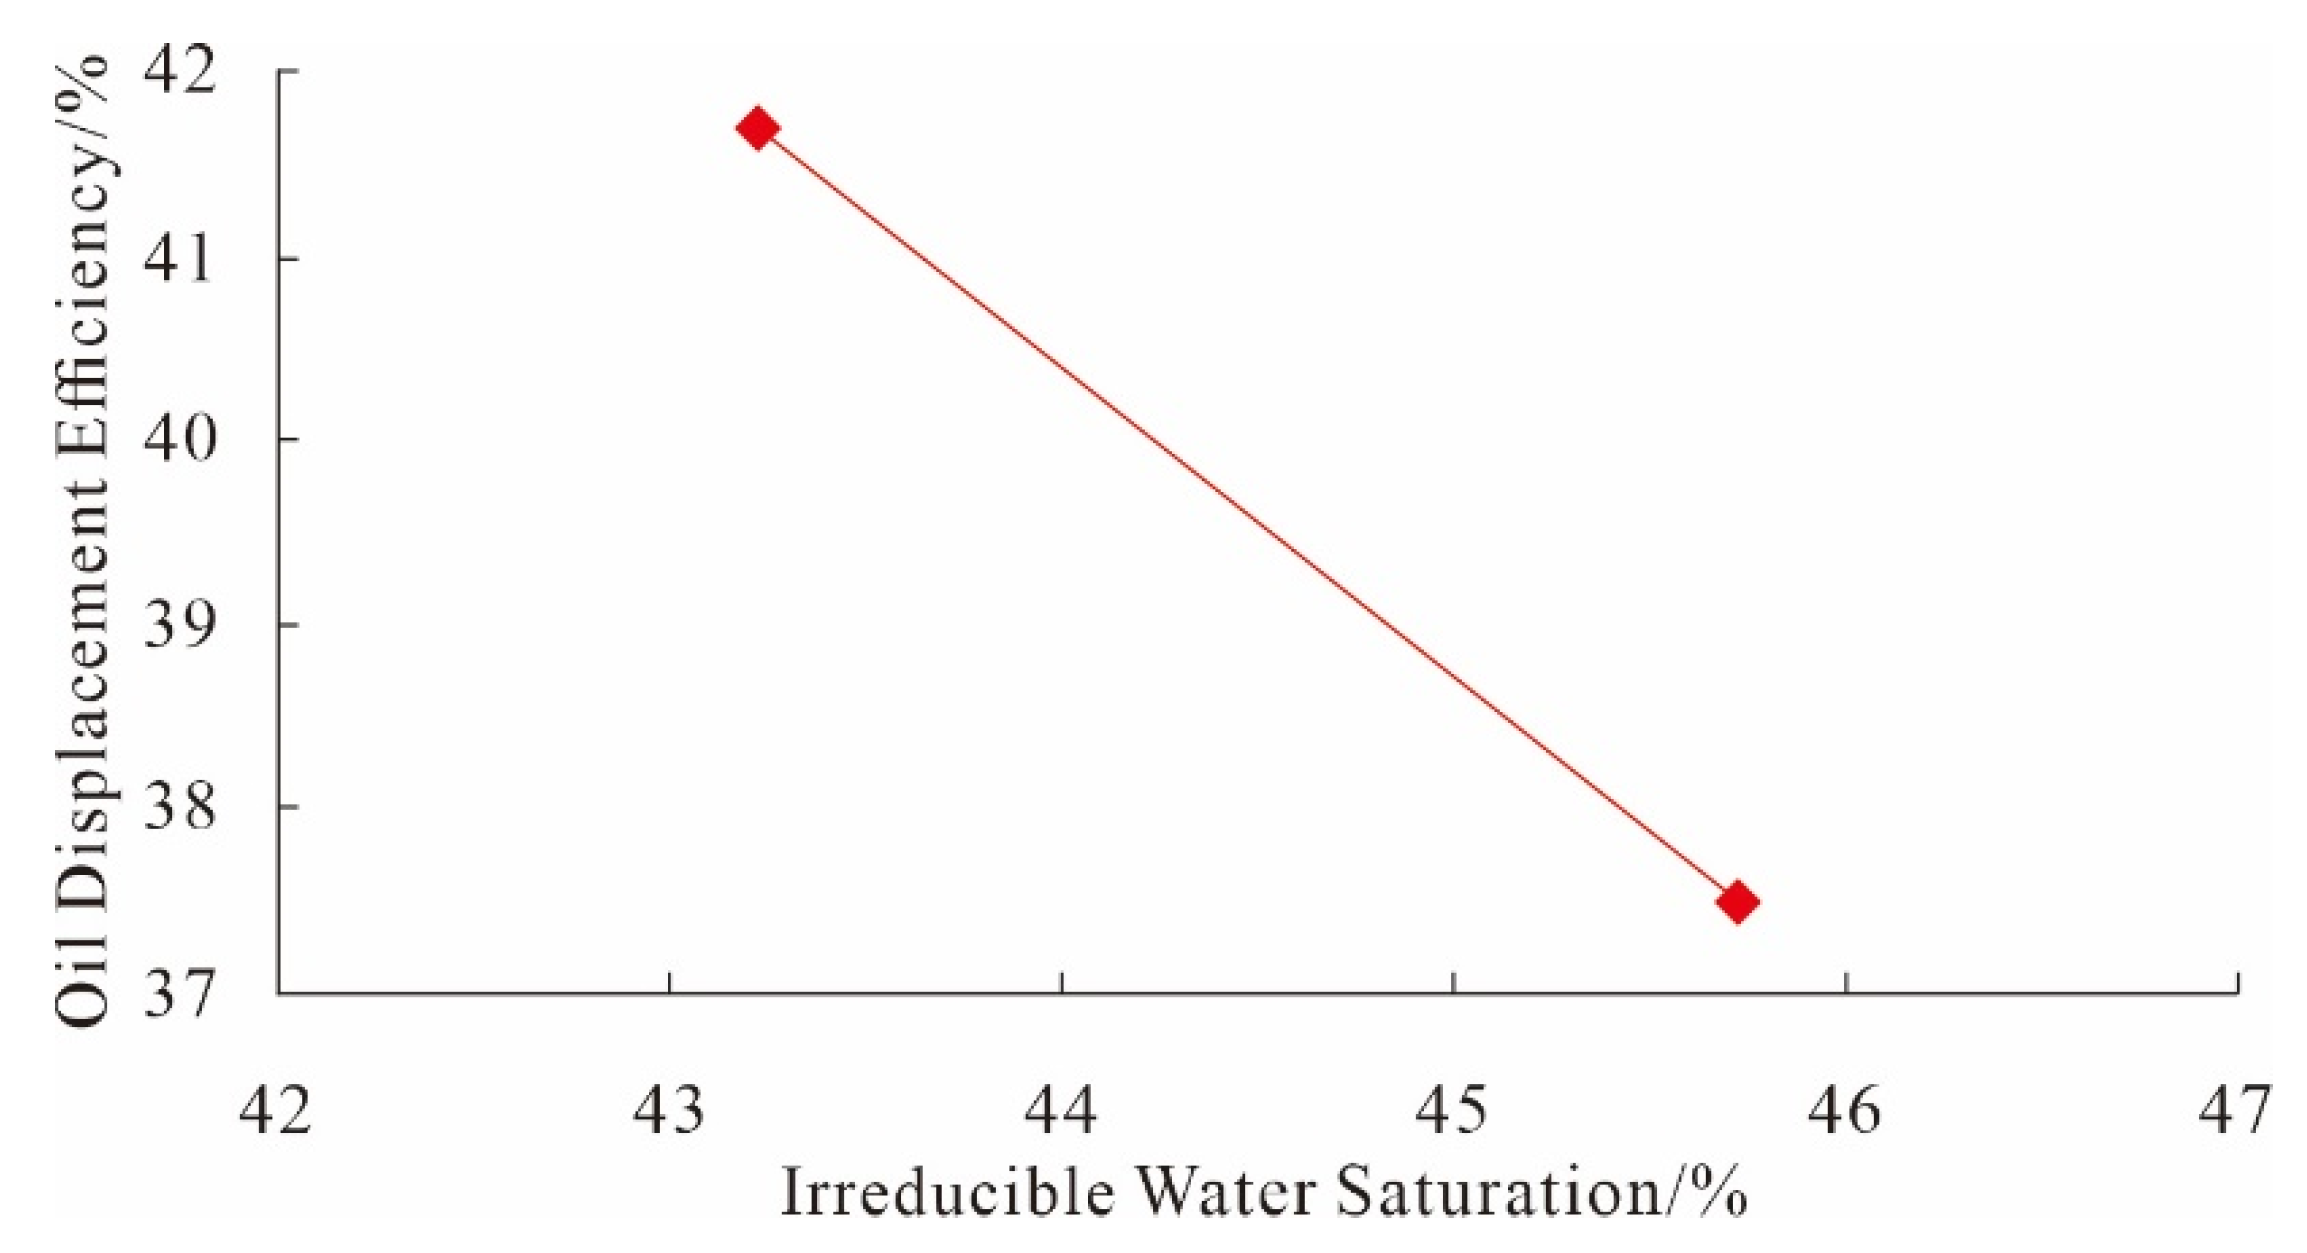
Figure 10), as the irreducible water saturation increases, the final oil displacement efficiency decreases.
As the physical properties of the Chang 3 reservoir improve, the oil displacement efficiency increases significantly. As the final injection ratio increases, the oil displacement efficiency shows an upward trend. When the injection ratio reaches 0.1~1 times, if the injection ratio continues to be increased, the oil displacement efficiency and water production rate will increase relatively little. However, as irreducible water saturation increases, the final oil displacement efficiency shows a downward trend. In general, the most significant factor affecting the final oil displacement efficiency is permeability. As the permeability increases, the final oil displacement efficiency also increases.
5.3. Analysis of Oil-Water Two-Phase Relative Permeability Curve Characteristics
The analysis of the oil-water two-phase relative permeability curve (
Figure 4) reveals three distinct stages in the study of the Chang 3 member phase permeability curve. The first stage corresponds to the irreducible water state, where water saturation increases but has not yet reached the flowing state. Therefore, the relative permeability of the water phase is zero. Simultaneously, the oil phase initially occupies all the available flow pores, resulting in the maximum relative permeability of the oil phase. As water saturation increases, the relative permeability of the oil phase decreases. The irreducible water saturation is the minimum saturation at which water begins to flow, known as its critical saturation [
13,
14]. For the Chang 3 member phase permeability experiment samples, the irreducible water saturations are 43.22% and 45.73%, with an average value of 44.48%. The second stage describes the oil-water two-phase co-flow zone. After the water saturation exceeds the irreducible water saturation, the water phase transitions into a continuous flow state, leading to a decrease in the relative permeability of the oil phase and an increase in the relative permeability of the water phase. Beyond the crossover point, known as the equality point, where the relative permeabilities of the oil and water phases are equal, the relative permeability of the water phase surpasses that of the oil phase. The equality point is the intersection of the two-phase flow curve, indicating the point at which the relative permeabilities of the oil and water phases are equivalent. The saturation distribution range of the equality point in the two-phase flow samples is between 54.9% and 56.5%, with an average value of 55.7%, reflecting a relatively high saturation at the equality point. The third stage describes the residual oil state. When the water saturation reaches the saturation point at which the oil phase stops flowing, the oil phase loses its continuous flow capability, becoming residual oil. The relative permeability of the oil phase is zero, while the relative permeability of the water phase sharply increases. The residual oil saturations are 35.55% and 38.48%, with an average value of 37.01%.
5.4. Reservoir Sensitivity Assessment
The present study investigates the stress sensitivity of the reservoir in the Yanchang Formation of the Weibei Oilfield. Overburden pore permeability experiments, net confining pressure unidirectional increase overburden porosity permeability experiments, and net confining pressure cyclying overburden porosity permeability experiments were conducted to assess the permeability changes of rocks under different pressure conditions. The stress sensitivity degree of the core was reflected by the slope value (Ss) obtained through calculating the damage ratio of permeability and establishing a linear relationship between the cubic root of dimensionless permeability (Ki/K0) and the logarithm of stress.
According to the stress sensitivity evaluation criteria, the analysis results indicate that the stress sensitivity of the reservoirs in the Chang 3 member of the study area fluctuates between weak and strong, and the permeability of the reservoirs generally exhibits a high sensitivity to variations in net confining pressure. Based on these evaluation results, it is recommended to focus on the stress sensitivity characteristics of the reservoir in reservoir development and modification measures and to adopt corresponding adjustment strategies to maximize development benefits. Furthermore, in the development plans of oil and gas reservoirs, the differential sensitivity of reservoirs to weak and strong stresses should be thoroughly considered to formulate more precise and effective development strategies [
15,
16]. For reservoir segments with weak stress sensitivity, it is advisable to moderately increase the injection-production ratio and enhance injection pressure to promote reservoir fracturing and improve pore structure, thereby increasing overall permeability. Alternatively, horizontal well development may be considered to enhance oil-water recovery efficiency and mitigate reservoir deformation. In the case of reservoir segments with strong stress sensitivity, a strategy involving a moderate reduction in the injection-production ratio, lowering production pressure, and slowing down rock deformation is recommended to mitigate the decline in permeability and maintain a relatively stable production capacity. These suggestions aim to fully consider the stress sensitivity characteristics of reservoirs and, through rational development plans, maximize recovery rates, reduce production risks, and achieve economically viable reservoir development [
17,
18,
19].
6. Conclusions
- (1)
Through core observation and high-pressure mercury injection testing, it was found that the lithology of Chang 3 members in the Weibei Oilfield is primarily composed of very fine to fine sand with a structure of fine sand. The cementation type is contact-porosity cementation. The distribution characteristics of pore throats mainly exhibit a single peak and a double peak form, with the double peak type being dominant. The pore types in double peak samples are mainly composed of intergranular dissolved pores and intragranular dissolved pores, indicating strong microscopic heterogeneity in the overall reservoir. Adopting the product of mercury withdrawal saturation and mercury withdrawal efficiency as a comprehensive evaluation parameter for the microscopic pore structure of ultra-low permeability tight reservoirs, the microscopic pore structure of the Chang 3 member reservoir in the research area is classified into three categories. Reservoir classification evaluation contributes to a more comprehensive understanding of the micro-characteristics of tight reservoirs.
- (2)
Through water flooding experiments and oil-water phase permeability tests, the displacement mechanism of the Chang 3 member reservoir was studied. The results indicate that increasing the injection ratio and improving reservoir properties both contribute to enhancing oil displacement efficiency. However, an increase in irreducible water saturation has a negative impact on oil recovery efficiency. While reservoir properties are crucial factors influencing oil efficiency, they need to be considered comprehensively in the context of irreducible water saturation to achieve optimal development results.
- (3)
Stress sensitivity experiments were conducted on the reservoir rock samples for this purpose, and the results showed that the stress sensitivity of the Chang 3 reservoir fluctuates between weak and strong. Moreover, the reservoir permeability exhibits high sensitivity to net overburden pressure changes. Therefore, in the process of reservoir development and modification, it is recommended to focus on the stress-sensitivity characteristics of the reservoir. For reservoirs with weak stress sensitivity, it is advisable to consider moderately increasing the injection-production ratio, raising injection pressure, and improving reservoir properties and pore structure through methods such as horizontal well development. Conversely, for reservoirs with strong stress sensitivity, a strategy of moderately reducing the injection-production ratio and lowering production pressure should be adopted to maintain a relatively stable productivity. These recommendations aim to fully account for the stress-sensitivity characteristics of the reservoir, maximize recovery rates, and reduce production risks through a rational development plan, ultimately achieving economically viable reservoir development.
Author Contributions
Resources, R.W.; Writing—original draft, Y.T.; Writing—review & editing, S.Y. All authors have read and agreed to the published version of the manuscript.
Funding
This study was funded by the National Natural Science Foundation of China (NSFC) Project “Study on Micro-mechanism of Nano-pore fracture Deformation and Expansion of Continental Shale Oil Reservoirs under Different Stress Systems” (No. 42302167) and the Basic Research Project of Natural Science of Shaanxi Province: Study on Deep Upper Paleozoic Tectonic Evolution and Mechanism of Combined fault-Fracture Reservoir Control in the eastern margin of Ordos Basin (No. 2023-JC-QN-0355).
Data Availability Statement
Data are contained within the article.
Conflicts of Interest
The authors declare no conflict of interest.
References
- Yang, H.; Chen, H.D.; Fu, J.H. Late Triassic Sedimentary Geology and Distribution Patterns of Oil Reservoirs in the Ordos Basin; Science Press: Beijing, China, 2012. [Google Scholar]
- Wang, X.; Zhang, F.; Li, S.; Dou, L.; Liu, Y.; Ren, X.; Chen, D.; Zhao, W. The Architectural Surfaces Characteristics of Sandy Braided River Reservoirs, Case Study in Gudong Oil Field, China. Geofluids 2021, 2021, 8821711. [Google Scholar] [CrossRef]
- Liu, H.Q.; Li, X.B.; Chen, Q.L.; Wanyan, R.; Guo, Y.R.; Liao, J.B. Analysis of Several Petroleum Geological Issues in the Yanchang Formation of the Ordos Basin; Science Press: Beijing, China, 2013. [Google Scholar]
- Xia, D.; Wu, Y.; Zou, M.; Xia, D.; Pang, W. Quality characterization of tight sandstone reservoirs in the Yanchang Formation of the Honghe oilfield, Ordos Basin, central China. Energy Geosci. 2022, 3, 444–452. [Google Scholar]
- Li, M.; Liao, J.; Wang, S.; He, Z.X.; Wang, H.W.; Wang, J.; He, H.; Zhu, Y.S. Imbibition characteristics and influencing factors of reservoirs with ultra-low permeability of Ordos Basin: A case study of third member of Triassic Yanchang Formation in Weibei Oil Field. Pet. Geol. Exp. 2022, 44, 971–980. [Google Scholar]
- Jiang, X.; Yu, G.M. Optimizing tight oil extraction from low permeability tight reservoirs: A study on stress sensitivity effects and applications in carbon capture, utilization, and storage. Front. Energy Res. 2023, 11, 1240264. [Google Scholar] [CrossRef]
- Ju, W.; Huang, P.M.; Zhong, Y.; Hu, H.H.; Liang, Y.; Liu, B.; Zhang, X.L. Experimental study of sandstone stress sensitivity under different fluids: Characteristics and mechanisms. Geoenergy Sci. Eng. 2023, 223, 211537. [Google Scholar] [CrossRef]
- Dai, Q.Q.; Luo, Q.; Zhang, C.; Lu, C.J.; Zhang, Y.Z.; Lu, S.J.; Zhao, Y. Pore structure characteristics of tight-oil sandstone reservoir based on a new parameter measured by NMR experiment: A case study of seventh member in Yanchang Formation, Ordos Basin. Acta Pet. Sin. 2016, 37, 887–897. [Google Scholar]
- Yuan, H.; Yin, S.; Dong, L.; Tan, C. Restoration of the pre-Jurassic paleogeomorphology and its control on hydrocarbon distribution in western Ordos Basin. Energy Geosci. 2023, 3, 485–494. [Google Scholar] [CrossRef]
- Gao, H.; Xie, W.; Yang, J.P.; Zhang, C.; Sun, W. Pore throat characteristics of extra-ultra low permeability sandstone reservoir based on constant-rate mercury penetration technique. Pet. Geol. Exp. 2011, 33, 206–214. [Google Scholar]
- Jia, C.Z.; Zou, C.N.; Li, J.Z.; Li, D.H.; Zheng, M. Assessment criteria, main types, basic features and resource prospects of the tight oil in China. Acta Pet. Sin. 2012, 33, 343–350. [Google Scholar]
- Askarinezhad, R. A new statistical approach to pore/throat size distribution of porous media using capillary pressure distribution concept. J. Pet. Sci. Eng. 2010, 75, 100–104. [Google Scholar] [CrossRef]
- Li, H.T.; Li, Y.; Chen, S.N.; Guo, J.; Wang, K.; Luo, H.W. Effects of chemical additives on dynamic capillary pressure during waterflooding in low permeability reservoirs. Energy Fuels 2016, 30, 7082–7093. [Google Scholar] [CrossRef]
- Zhang, H.; Papadikis, K.; Shaw, S.J. A two-dimensional study on the impact of pore space connectivity on the immiscible two-phase flow in a water-wet, water-oil system under steady state conditions. Int. J. Multiph. Flow 2022, 150, 104026. [Google Scholar] [CrossRef]
- Liu, Y.J.; Zhu, W.Y.; Li, B.B.; Yang, L.Z.; Deng, Q.J. Pore-scale study of the influence of van der Waals forces on oil-water two-phase flow behaviors in various wettability systems. Spec. Top. Rev. Porous Media 2022, 13, 55–67. [Google Scholar] [CrossRef]
- Wang, C.Q.; Tian, Z.J.; Wang, C.C.; Chen, L.; Wang, G.Q. Pore structure and oil-water two-phase seepage characteristics of tight oil reservoirs based on stress sensitivity. Spec. Oil Gas Reserv. 2023, 30, 131–138. [Google Scholar]
- Wang, X.; Liu, Y.; Hou, J.; Li, S.; Kang, Q.; Sun, S.; Ji, L.; Sun, J.; Ma, R. The relationship between synsedimentary fault activity and reservoir quality—A case study of the Ek1 formation in the Wang Guantun area, China. Interpretation 2020, 8, sm15–sm24. [Google Scholar] [CrossRef]
- Cao, L.N.; Wang, H.H.; Jiang, L.P.; Zhang, B.; Ganzer, L.; Xie, Y.C.; Luo, J.S.; Wang, X.C. A composite framework model for transient pressure dynamics in tight gas reservoirs incorporating stress sensitivity. Energies 2023, 16, 7175. [Google Scholar] [CrossRef]
- Wang, X.; Hou, J.; Li, S.; Dou, L.; Song, S.; Kang, Q.; Wang, D. Insight into the nanoscale pore structure of organic-rich shales in the Bakken Formation, USA. J. Pet. Sci. Eng. 2019, 176, 312–320. [Google Scholar] [CrossRef]
Figure 1.
Location and stratigraphic column of Weibei Oilfield.
Figure 1.
Location and stratigraphic column of Weibei Oilfield.
Figure 2.
Photograph of cast-thin section of Chang 3 reservoir rock samples.
Figure 2.
Photograph of cast-thin section of Chang 3 reservoir rock samples.
Figure 3.
Average of porosity, permeability, and sorting coefficient of single and double peak of the Chang 3 Member samples in the Weiber Oilfield.
Figure 3.
Average of porosity, permeability, and sorting coefficient of single and double peak of the Chang 3 Member samples in the Weiber Oilfield.
Figure 4.
Oil-water two-phase relative permeability curve of Chang 3 member rock samples.
Figure 4.
Oil-water two-phase relative permeability curve of Chang 3 member rock samples.
Figure 5.
Correlation between permeability percentage and net confining pressure in the experiment (sample numbers: WB47-7 and W47-19).
Figure 5.
Correlation between permeability percentage and net confining pressure in the experiment (sample numbers: WB47-7 and W47-19).
Figure 6.
Stress sensitivity curve of net confining pressure cycling overburden porosity permeability experiments.
Figure 6.
Stress sensitivity curve of net confining pressure cycling overburden porosity permeability experiments.
Figure 7.
Comprehensive evaluation parameter distribution of microscopic pore structure.
Figure 7.
Comprehensive evaluation parameter distribution of microscopic pore structure.
Figure 8.
Relationship between injection ratio and oil displacement efficiency/moisture content.
Figure 8.
Relationship between injection ratio and oil displacement efficiency/moisture content.
Figure 9.
Relationship between physical properties and oil displacement efficiency.
Figure 9.
Relationship between physical properties and oil displacement efficiency.
Figure 10.
Relationship between irreducible water saturation and oil displacement efficiency.
Figure 10.
Relationship between irreducible water saturation and oil displacement efficiency.
Table 1.
Petrophysical properties and mercury intrusion parameters of the tight sandstone samples.
Table 1.
Petrophysical properties and mercury intrusion parameters of the tight sandstone samples.
| Sample Number | Depth
(m) | φ
(%) | k
(10−3 m2) | Mercury Intrusion Parameters |
|---|
Pd
(MPa) | Pm
(MPa) | Smax
(%) | We
(%) | Sr
(%) | rmax
(μm) | rm (μm) |
|---|
| WB11-15 | 397.45 | 13.14 | 1.58 | 0.35 | 4.47 | 82.20 | 41.36 | 48.20 | 2.17 | 0.17 |
| WB2-2 | 543.81 | 14.97 | 0.58 | 1.06 | 7.84 | 100.00 | 36.47 | 63.53 | 0.70 | 0.09 |
| WB2-39 | 550.88 | 13.79 | 1.16 | 0.64 | 4.57 | 100.00 | 37.15 | 63.80 | 1.15 | 0.16 |
| WB6-5 | 299.67 | 11.90 | 0.68 | 0.88 | 9.45 | 89.40 | 25.62 | 66.50 | 0.86 | 0.08 |
| WB9-19 | 509.18 | 2.20 | 0.63 | 1.11 | 41.06 | 60.00 | 18.67 | 48.80 | 0.67 | 0.02 |
| WB2-13 | 545.45 | 12.91 | 0.52 | 1.06 | 7.84 | 100.00 | 37.15 | 61.79 | 0.69 | 0.09 |
| WB7-2 | 409.23 | 14.56 | 0.91 | 0.35 | 4.37 | 90.80 | 37.15 | 69.40 | 2.12 | 0.17 |
| WB2-8 | 544.75 | 13.08 | 0.55 | 1.06 | 8.76 | 100.00 | 37.15 | 62.85 | 0.70 | 0.08 |
| WB2-23 | 547.15 | 14.27 | 0.94 | 0.62 | 6.41 | 100.00 | 37.15 | 61.06 | 1.18 | 0.12 |
| WB2-27 | 547.71 | 13.88 | 0.82 | 0.62 | 6.34 | 100.00 | 37.15 | 61.82 | 1.18 | 0.12 |
| WB2-47 | 553.68 | 11.89 | 0.94 | 0.48 | 4.70 | 100.00 | 37.15 | 65.13 | 1.53 | 0.16 |
| WB11-4 | 394.91 | 8.93 | 0.38 | 0.75 | 8.45 | 88.20 | 33.33 | 58.80 | 1.00 | 0.09 |
| WB7-15 | 411.53 | 11.73 | 0.45 | 0.50 | 3.78 | 92.50 | 21.95 | 72.20 | 1.50 | 0.20 |
| WB2-43 | 551.75 | 5.78 | 0.33 | 5.04 | 26.22 | 100.00 | 37.15 | 52.18 | 0.15 | 0.03 |
| WB15-17 | 233.80 | 11.58 | 0.36 | 0.79 | 2.96 | 90.00 | 26.67 | 66.00 | 0.95 | 0.25 |
| WB6-52 | 306.43 | 10.66 | 0.49 | 0.70 | 7.63 | 92.80 | 18.97 | 75.20 | 1.07 | 0.10 |
| WB9-11 | 506.60 | 13.41 | 0.32 | 1.58 | 7.79 | 88.30 | 28.77 | 62.90 | 0.47 | 0.10 |
| WB2-17 | 546.12 | 3.89 | 0.34 | 6.42 | 31.93 | 100.00 | 37.15 | 56.73 | 0.12 | 0.02 |
| WB2-33 | 549.07 | 12.42 | 0.43 | 1.06 | 7.18 | 100.00 | 37.15 | 62.09 | 0.70 | 0.10 |
| WB15-34 | 236.69 | 8.36 | 0.17 | 1.27 | 5.02 | 88.00 | 29.55 | 62.00 | 0.59 | 0.15 |
| WB15-4 | 225.99 | 7.90 | 0.12 | 2.01 | 10.44 | 86.00 | 32.56 | 58.00 | 0.37 | 0.07 |
| WB15-46 | 238.37 | 7.10 | 0.13 | 2.35 | 12.33 | 83.00 | 30.12 | 58.00 | 0.32 | 0.06 |
| WB15-55 | 246.74 | 8.71 | 0.17 | 1.30 | 6.02 | 89.00 | 21.35 | 70.00 | 0.58 | 0.12 |
| WB6-18 | 301.60 | 10.90 | 0.29 | 0.88 | 12.08 | 91.20 | 23.25 | 70.00 | 0.85 | 0.06 |
| WB6-31 | 303.69 | 12.56 | 0.25 | 1.30 | 10.71 | 93.50 | 23.74 | 71.30 | 0.58 | 0.07 |
| WB6-61 | 307.41 | 9.46 | 0.18 | 1.98 | 19.42 | 86.60 | 25.17 | 64.80 | 0.38 | 0.04 |
| WB6-44 | 305.46 | 8.42 | 0.22 | 1.70 | 9.45 | 91.20 | 19.08 | 73.80 | 0.44 | 0.08 |
| WB9-27 | 511.55 | 10.31 | 0.24 | 3.02 | 24.15 | 86.70 | 39.56 | 52.40 | 0.25 | 0.03 |
| WB9-5 | 504.62 | 10.21 | 0.23 | 2.78 | 11.24 | 89.50 | 33.85 | 59.20 | 0.27 | 0.07 |
| WB11-28 | 399.68 | 7.33 | 0.12 | 3.14 | 15.20 | 87.70 | 28.05 | 63.10 | 0.24 | 0.05 |
| WB11-37 | 401.41 | 7.51 | 0.13 | 2.92 | 15.11 | 85.20 | 26.29 | 62.80 | 0.26 | 0.05 |
| WB7-27 | 414.36 | 8.67 | 0.14 | 3.37 | 14.74 | 91.30 | 15.44 | 77.20 | 0.22 | 0.05 |
| WB7-35 | 416.88 | 10.07 | 0.14 | 3.31 | 16.47 | 92.80 | 17.46 | 76.60 | 0.23 | 0.05 |
| WB7-46 | 419.51 | 7.41 | 0.29 | 4.65 | 24.27 | 90.00 | 29.89 | 63.10 | 0.16 | 0.03 |
| WB13-2 | 309.25 | 6.30 | 0.09 | 4.81 | 19.99 | 90.00 | 24.22 | 68.20 | 0.16 | 0.04 |
| Average | 10.18 | 0.44 | 1.88 | 12.24 | 91.31 | 29.80 | 63.70 | 0.71 | 0.09 |
Table 2.
Basic data of water flooding experiment samples.
Table 2.
Basic data of water flooding experiment samples.
Sample
Number | Depth | Length (cm) | Diameter (cm) | Porosity (%) | Permeability (10−3 μm2) | Irreducible Water Saturation (%) |
|---|
| WB48-86 | 528.08 | 4.34 | 2.44 | 15.85 | 1.77 | 43.22 |
| WB48-102 | 531.23 | 4.15 | 2.44 | 15.79 | 0.48 | 45.73 |
Table 3.
Water flooding experiment parameters in tight oil development.
Table 3.
Water flooding experiment parameters in tight oil development.
| Sample Number | Porosity (%) | Permeability (10−3 μm2) | Crude Oil Viscosity (mPa·s) | Injected Water Viscosity (mPa·s) | Oil-Water Viscosity Ratio | Temperature (°C) |
|---|
| WB48-86 | 15.85 | 1.77 | 2.92 | 0.73 | 4 | 40 |
| WB48-102 | 15.79 | 0.48 | 4.56 | 1.14 | 4 | 20 |
Table 4.
Water flooding oil experiment results.
Table 4.
Water flooding oil experiment results.
| Sample Number | Injection Ratio
(PV) | Oil Recovery Efficiency
(%) | Water Production Rate
(%) |
|---|
| WB48-86 | 0.1 | 16.67 | 0 |
| 0.2 | 27.78 | 33.33 |
| 0.3 | 33.33 | 71.51 |
| 0.5 | 36.11 | 92.11 |
| 0.7 | 37.78 | 95.27 |
| 1 | 38.89 | 97.90 |
| 1.5 | 40.00 | 98.74 |
| 2 | 40.56 | 99.37 |
| 3 | 41.11 | 99.68 |
| 5 | 41.67 | 99.84 |
| 7 | 41.67 | 100 |
| 10 | 41.67 | 100 |
| WB48-102 | 0.1 | 18.75 | 0 |
| 0.2 | 23.13 | 75.83 |
| 0.3 | 26.25 | 83.04 |
| 0.5 | 29.38 | 91.52 |
| 0.7 | 31.25 | 94.91 |
| 1 | 33.13 | 96.61 |
| 1.5 | 34.38 | 98.64 |
| 2 | 35.63 | 98.64 |
| 3 | 36.25 | 99.66 |
| 5 | 36.88 | 99.83 |
| 7 | 37.50 | 99.83 |
| 10 | 37.50 | 100 |
Table 5.
Oil-water two-phase relative permeability measurement results.
Table 5.
Oil-water two-phase relative permeability measurement results.
| Sample Number | Depth
(m) | Porosity (%) | Permeability (10−3 μm2) | Oil Phase Permeability (10−3 μm2) | Irreducible Water Saturation
(%) | Water Saturation at Intersection Point (%) | Residual Oil Saturation
(%) |
|---|
| WB48-86 | 528.03 | 15.85 | 1.77 | 0.713 | 43.22 | 54.9 | 38.48 |
| WB48-102 | 531.23 | 15.79 | 0.479 | 0.253 | 45.73 | 56.5 | 35.55 |
Table 6.
Physical Properties of Core Samples in Stress Sensitivity Experiments.
Table 6.
Physical Properties of Core Samples in Stress Sensitivity Experiments.
| Sample Number | Depth
(m) | Porosity
(%) | Permeability
(10−3 μm2) |
|---|
| WB47-7 | 662.97 | 13.08 | 0.531 |
| WB47-19 | 665.57 | 10.47 | 0.204 |
| WB2-5 | 395.09 | 11.95 | 0.689 |
| WB2-12 | 396.79 | 13.17 | 0.674 |
| WB2-19 | 398.07 | 9.97 | 0.777 |
| WB2-31 | 400.24 | 3.64 | 0.434 |
| WB6-3 | 299.36 | 9.90 | 0.158 |
| WB6-13 | 300.82 | 9.20 | 0.165 |
| WB6-25 | 302.56 | 9.10 | 0.145 |
| WB6-34 | 304.02 | 11.60 | 0.167 |
| WB6-48 | 305.77 | 5.70 | 0.113 |
| WB6-55 | 306.71 | 9.70 | 0.205 |
| WB6-63 | 307.63 | 7.70 | 0.116 |
Table 7.
Permeability loss rate during net confining pressure increase process.
Table 7.
Permeability loss rate during net confining pressure increase process.
| Parameters | Net Confining Pressure (MPa) | Parameter Value | Chang 3 Member |
|---|
| Permeability Loss Rate/% | 10.34 | Maximum | 52.22 |
| Minimum | 9.05 |
| Average | 34.4 |
| 50 | Maximum | 55.32 |
| Minimum | 34.13 |
| Average | 44.6 |
Table 8.
Evaluation indicators for stress sensitivity.
Table 8.
Evaluation indicators for stress sensitivity.
| Ss | Ss ≤ 0.05 | 0.05 < Ss ≤ 0.30 | 0.30 < Ss ≤ 0.50 | 0.50 < Ss ≤ 0.70 | 0.70 < Ss ≤ 1.0 | Ss > 1.0 |
|---|
| Sensitivity Level | None | Low | Medium Low | Medium High | High | Very High |
Table 9.
Results of net confining pressure cyclying overburden porosity permeability experiments.
Table 9.
Results of net confining pressure cyclying overburden porosity permeability experiments.
Depth
(m) | Sample Number | Permeability (10−3 μm2) | Maximum Permeability Damage Rate (%) | Irreversible Permeability Rate
(%) | Stress Sensitivity Coefficient
(Ss) | Sensitivity Level |
|---|
| 396.89 | WB11-13 | 0.671 | 27.27 | 18.26 | 0.2681 | Low |
| 410.00 | WB7-6 | 0.158 | 69.24 | 51.07 | 0.7923 | High |
| 453.12 | WB31-24 | 0.308 | 88 | 63 | | High |
Table 10.
Classification results of microscopic pore structure characteristics.
Table 10.
Classification results of microscopic pore structure characteristics.
| Reservoir Category | Sample Numbers | Percentage (%) |
|---|
| Type Ⅰ | 7 | 19.44 |
| Type Ⅱ | 24 | 66.68 |
| Type Ⅲ | 5 | 13.88 |
Table 11.
Distribution of physical properties and mercury injection capillary pressure results for various reservoir types.
Table 11.
Distribution of physical properties and mercury injection capillary pressure results for various reservoir types.
| Reservoir Category | Parameter Level | Porosity (%) | Permeability
(10−3 μm2) | Pore Volume (10−3 cm3) | Maximum Mercury Saturation
(%) | Residual Mercury Saturation
(%) | Mercury Desaturation Efficiency
(%) | Desaturation Saturation
(%) | Comprehensive Evaluation Parameter |
|---|
| Type Ⅰ | Maximum | 13.77 | 1.5774 | 1698.00 | 96.1429 | 86.3279 | 41.9169 | 34.4704 | 19.8058 |
| Minimum | 8.93 | 0.1135 | 410.00 | 82.2351 | 47.7647 | 3.1068 | 2.7680 | 9.6563 |
| Average | 11.65 | 0.608 | 988.86 | 89.2251 | 61.7505 | 30.9444 | 27.4747 | 12.8405 |
| Type Ⅱ | Maximum | 16.25 | 1.58 | 1867.00 | 99.9980 | 74.6876 | 46.6696 | 42.4384 | 9.3953 |
| Minimum | 6.3 | 0.227 | 104.00 | 80.1994 | 41.4118 | 20..149 | 18.8461 | 3.7973 |
| Average | 10.85 | 0.3724 | 1029.67 | 89.5899 | 63.6047 | 27.8494 | 24.8255 | 6.6070 |
| Type Ⅲ | Maximum | 10.07 | 0.633 | 1285.00 | 93.4118 | 75.9678 | 31.1808 | 25.24 | 3.4990 |
| Minimum | 2.20 | 0.125 | 279.00 | 59.6417 | 55.7072 | 16.5366 | 11.2942 | 0.0860 |
| Average | 7.79 | 0.249 | 853.4 | 83.1397 | 65.9255 | 20.8202 | 17.2143 | 2.2363 |
| Disclaimer/Publisher’s Note: The statements, opinions and data contained in all publications are solely those of the individual author(s) and contributor(s) and not of MDPI and/or the editor(s). MDPI and/or the editor(s) disclaim responsibility for any injury to people or property resulting from any ideas, methods, instructions or products referred to in the content. |
© 2024 by the authors. Licensee MDPI, Basel, Switzerland. This article is an open access article distributed under the terms and conditions of the Creative Commons Attribution (CC BY) license (https://creativecommons.org/licenses/by/4.0/).


