Abstract
With the intensification of the global commitment to renewable energy, South Korea’s rapid expansion in renewable capacity necessitates efficient operational strategies to address the inherent variability of these energy sources. Despite the implementation of policies aimed at integrating energy storage systems (ESS) with renewable generation, such as providing additional renewable energy certificates (RECs), the measures undertaken remain relatively ineffective. Thus, this study evaluates the shortcomings of existing policies and proposes an innovative operational strategy tailored to Korea’s energy landscape. The strategy is implementable immediately using existing facilities, without requiring any new equipment, and facilitates profits of up to 12.45% greater compared with those generated using the original approach. Moreover, the results are nearly as effective as an ideal scenario wherein the PV generation and system marginal price are accurately known. Additionally, the decreased economic feasibility of ESS owing to the discontinuation of subsidies is highlighted and solutions are proposed to mitigate the problem. This underscores the urgent need for improved regulatory measures and enhanced operational strategies. The proposed approach highlights the potential to considerably reduce inefficiencies and operational costs, thereby contributing to more sustainable energy management practices within Korea.
1. Introduction
Globally, attempts to mitigate greenhouse gas emissions have resulted in an increase in the number of renewable energy generation facilities. The adoption of the Paris Agreement on Climate Change in December 2015 marked a turning point, with the global renewable energy capacity reaching 1853 GW [1,2]. By 2022, this capacity increased to 3372 GW, representing an impressive 82% increase [2]. The International Energy Agency (IEA) projects that, by 2028, the global renewable energy capacity will increase by approximately 116% from the levels in 2022, reaching a staggering 7300 GW [3]. In line with global trends, South Korea has been actively boosting its renewable energy capacity to mitigate greenhouse gas emissions. From 7.4 GW in 2015, Korea’s renewable energy capacity increased to 28 GW in 2022, an approximate 278% increase [4]. According to [5], Korea’s renewable energy capacity is expected to increase by approximately 161% from its 2022 level, reaching 73 GW by 2030.
However, with the continuous increase in the capacity of renewable energy facilities, the variability and intermittency of renewable energy sources have resulted in greater uncertainty in power systems [6,7]. Energy storage systems (ESSs) have been introduced to address this problem. An ESS can effectively manage the variability and intermittency of renewable energy by charging and discharging, thereby enabling a stable power supply [8,9]. Therefore, the integrated operation of renewable energy facilities and ESS is necessary to mitigate uncertainty in the power system and increase the proportion of renewable energy. However, the high installation costs associated with ESS installations have impeded further deployment. In response to this challenge, Korea has implemented a policy that provides additional renewable energy certificates (RECs) for the installation of ESS alongside renewable energy facilities [10].
During the formulation of the policy, renewable energy curtailment increased in Korea. However, the policies were not designed meticulously, incurring high annual costs through REC without efficient utilization of ESSs. At the inception of the policy, no regulations existed for the charging and discharging times of PV-linked ESSs. Additionally, the communication and control equipment of the ESS linked to the PV generation facilities were not properly regulated. This resulted in early PV-linked ESS operators managing their ESS without considering the PV generation status or system conditions. Subsequently, Korea imposed regulations on the charging and discharging times of PV-linked ESSs. However, the communication and control equipment of PV-linked ESS still lack adequate regulation [11]. Consequently, PV-linked ESS operators continue to set and operate their ESSs with fixed charging and discharging patterns without installing communication and control equipment. However, this operational strategy fails to reflect current system conditions and market prices or the system marginal price (SMP), given the increased proportion of renewable energy [12]. Furthermore, operating ESSs with fixed charging and discharging patterns without considering variations in SMP patterns during weekdays, weekends, and holidays is inefficient for both PV-linked ESS operators and system operators. Therefore, the previously established fixed charging and discharging patterns must be improved to enhance the efficiency of ESS utilization.
This study analyzes the current operational strategies and profits of PV-linked ESS operators using real-world data. Subsequently, we propose operational strategies to enhance the operational efficiency of PV-linked ESSs. In particular, we identify operational strategies that can improve profits even in the absence of communication and control equipment and evaluate the resulting profits. By comparing these profits with current and maximum profits in an ideal scenario, we aim to validate the effectiveness of our proposed strategies. Finally, we identify key problems with the current system and proposed solutions to address them.
The remainder of this paper is organized as follows. Section 2 provides an overview of the current market system and operational status of PV-linked ESSs. Section 3 proposes operational strategies for PV-linked ESSs, followed by the validation of their effectiveness using real-world data in Section 4. Section 5 delves into the analysis of the problems with the current market system for PV-linked ESSs and offers solutions for improvement. Finally, Section 6 presents the conclusions of this study.
2. Current Market Systems and Operational Status of PV-Linked ESSs in Korea
2.1. Profit Structure and Market Systems for PV-Linked ESS Operators
As shown in Figure 1, , , and represent PV generation, ESS charging, and ESS discharging at time t, respectively. PV-linked ESS operators derive profit from two main sources: SMP and REC [13,14]. SMP profit refers to revenue from electricity sales and can be expressed using Equation (1). REC profit refers to revenue from selling RECs and can be expressed using Equation (2):
where represents the amount of electricity sold to the system at time t, which is the sum of PV generation and ESS discharging minus ESS charging at time t. represents the SMP at time t, denotes the REC weight for PV generation, represents the REC weight for ESS discharging, and represents the price per REC. The REC is issued per MWh of energy sold to the system, with weights applied to the PV generation not used for ESS charging and to the ESS discharging amount. The REC weight for PV generation ranges from 0.5 to 1.6 based on the installation location and capacity. The REC weight for ESS discharging varies with the year of entry. From 2018 to June 2020, the weight is 5; from July 2020 to December 2020, this is 4; and from January 2021 onward, this is zero.
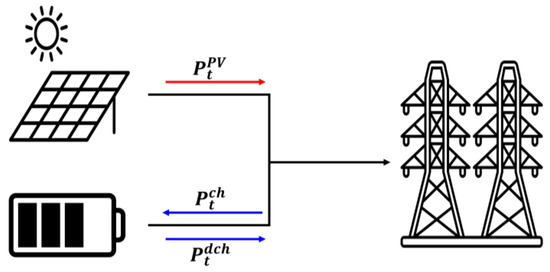
Figure 1.
Power flow diagram of a PV-linked ESS operator.
However, not all discharge from PV-linked ESSs are eligible for REC issuance. As mentioned in [8], strict regulations must be followed to qualify for REC for the discharging amounts from PV-linked ESSs, as outlined below:
- Charging and Discharging Time Regulations: These regulations govern the operating hours of ESSs. An REC will only be issued if the amount of electricity charged during the designated charging hours from the linked PV facility is discharged during the designated discharging hours. These regulations did not exist previously; however, from October 2016 to November 2023, the allowed charging hours were restricted to 10 A.M. to 4 P.M., and all other times were discharging hours. From December 2023, charging hours were changed from 6 A.M. to 3 P.M., and the designated discharging hours were changed from 4 P.M. to 11 P.M.
- Discharging Limit Regulation: The total discharging amount of the ESS linked to the PV generation must not exceed 70% of the PV capacity. If this limit is exceeded, no REC will be issued for the ESS discharge amount for that day.
- State of Charge (SoC) Limit Regulation: This regulation restricts the SoC to 80% or 90% of the battery capacity based on the ESS installation location. If this limit is violated, an REC will not be issued for the ESS discharge amount for that month.
2.2. Original ESS Operational Strategies of PV-Linked ESS Operators in Jeju
Jeju Island in Korea boasts the highest proportion of renewable energy generation and has set a goal to satisfy 100% of its power demand with renewable energy by 2030 [15,16]. This commitment to sustainability is expected to result in a significant increase in the capacity and generation of renewable energy on Jeju Island. Therefore, the enhancement of operational strategies of ESS on Jeju Island must be prioritized. Therefore, this study analyzes the real-world data of PV-linked ESS operators in Jeju. Additionally, Korea’s SMP is segmented into the mainland and Jeju Island, and this study considers the Jeju SMP.
The analysis in this section is based on real-world data collected from 12 PV-linked ESS operators installed in Jeju between January 2022 and April 2023, shedding light on the original ESS operational strategies. The findings reveal that PV-linked ESS operators in Jeju were issued one REC per PV generation in accordance with REC issuance regulations. During the analysis period, the allowed charging hours ranged from 10 A.M. to 4 P.M., whereas discharging was allowed at all other times. The PV-linked ESS operators adhered to these regulations for charging and discharging activities. However, these operators lacked communication and control equipment to monitor system and market conditions, causing them to rely on fixed charging and discharging patterns established in the past by each operator. A detailed analysis of the charging and discharging patterns is as follows.
The analysis of the charging patterns shown in Figure 2a,b revealed that PV-linked ESS operators in Jeju utilized only a portion of the PV generation for ESS charging during the designated charging hours to comply with the SoC limits. Notably, no ESS charging took place at 4 P.M., marking the end of the designated charging hours. The challenge with the current charging pattern is particularly evident when solar irradiance is low during the designated charging hours, as shown in Figure 2b. In such scenarios, although the entire PV generation can be utilized for ESS charging, only a portion is sold to the system. When PV generation is sold directly to the system, operators can earn both SMP profit and one REC. However, if the PV generation is first charged to the ESS and then sold to the system, both the SMP profit and up to five RECs can be obtained. Charging the PV generation to the ESS before selling it to the system can result in a lower SMP profit owing to the efficiency loss of the ESS. However, the increased discharging amount can result in up to four additional RECs (five RECs minus 1 REC) compared to selling the PV generation directly to the system. As shown in Figure 3, the price of four RECs is generally higher than the average SMP during the data period. Therefore, it is advantageous to maximize ESS charging. The original charging pattern, which underutilizes battery capacity, fails to maximize the profits of PV-linked ESS operators.
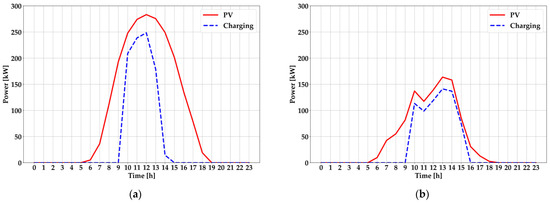
Figure 2.
(a) PV generation and charging pattern on a clear day. (b) PV generation and charging pattern on a cloudy day.
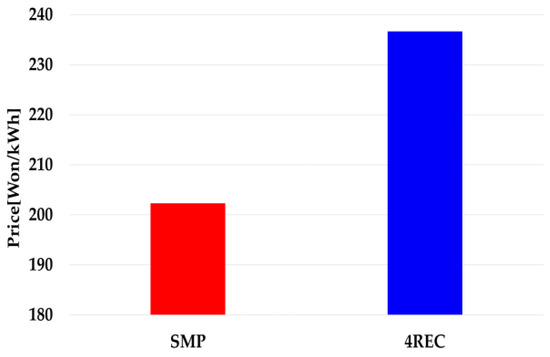
Figure 3.
Comparison of the average SMP and four REC prices during the real-world data analysis period.
During the real-world data period, we quantitatively analyzed scenarios in which additional charging of the ESS could be implemented while adhering to REC regulations for PV generation. The analysis revealed that approximately 10.41% of the total PV generation could be further charged to the linked ESS, of which approximately 43.79% occurred at 4 P.M.
The analysis of the discharging patterns revealed that the PV-linked ESS operators operated their ESSs with fixed discharging patterns while adhering to the discharging limit regulation (as shown in Figure 4). While these operators adhere to discharging limit regulations, the problem lies in the fact that these fixed patterns do not accurately reflect the current system conditions. This discrepancy results in a mismatch between the SMP and discharging patterns. Additionally, utilizing a single discharging pattern does not maximize SMP profits because SMP patterns differ between weekdays, weekends, and holidays.
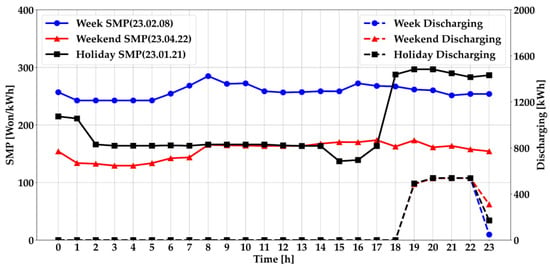
Figure 4.
SMP and discharge patterns on weekdays, weekends, and holidays.
3. Strategies for Profit Enhancement of PV-Linked ESS Operators in Korea
An abundance of studies exist on ESS operation strategies. Most of them assume an ideal scenario where communication and control equipment are installed to enable real-time monitoring of market prices for ESS operation [17,18]. However, as mentioned in the Introduction, in Korea, ESSs are often not equipped with these functions owing to the lack of proper regulation during early deployment. Therefore, it is a practical challenge to establish an operating strategy that maximizes the profit of ESS operators based on market prices in Korea. Consequently, ESS operation must rely on historical data to predict market prices and solar power generation, which introduces uncertainty. Under these circumstances, it is also difficult to directly apply optimal methodologies. One solution to this problem is to use rule-based strategies [19,20,21,22]. Rule-based strategies can be applied in uncertain scenarios to reduce computational complexity. Additionally, the results may not be significantly different from the optimal outcomes. Therefore, this section proposes a rule-based ESS operation strategy that can enhance profitability while reflecting system conditions without communication and control equipment. Furthermore, considering that charging and discharging occur separately and are subject to different regulations, the charging and discharging strategies are individually explained.
3.1. Charging Strategy
As identified in Section 2.2 and Figure 3, it is advantageous to maximize charging. Therefore, a strategy that maximizes REC issuance by charging the ESS to capacity during the designated charging hours is essential. The proposed charging strategy is as follows.
- One hundred percent of PV generation is utilized for ESS charging from the start of the designated charging hours.
- Once the battery is fully charged, the subsequent PV generation is sold to the system.
By implementing this charging strategy, the amount of PV generation utilized for ESS charging and the amount sold to the system at time t can be expressed as follows:
where denotes the battery capacity and denotes the remaining energy in battery at time t − 1. Therefore, represents the remaining battery capacity at time t. denotes the capacity of the power conversion system (PCS) capacity. Essentially, the charging amount at time t is determined as the minimum value among the remaining battery capacity, PV generation, and PCS capacity. represents the amount of PV generation sold to the system at time t. This quantity is sold to the system either when the battery is fully charged or when an amount less than the generated PV output is charged to the ESS.
3.2. Discharging Strategy
This section delves into discharging strategies that PV-linked ESS operators can employ to enhance their SMP and REC profits. First, we propose a strategy for improving REC profits, followed by a strategy for improving SMP profits.
To enhance REC profits, the discharging limit regulations must be adhered to. Therefore, the maximum allowable discharging amount for each hour must be set. However, owing to the uncertainty in predicting PV generation, determining the maximum discharging amount per hour poses challenges. As a resolution, we proposed setting the expected maximum PV generation for each hour and deducted this from 70% of the PV capacity to determine the maximum discharging amount per hour. This can be expressed as follows:
where represents the PV capacity and represents the maximum estimated PV generation at time t during the day. This value is calculated as the maximum PV generated at time t over the past year plus a certain margin as follows:
where represents the maximum PV generation at time t over the past year, and α represents the margin that accounts for the annual variability in PV generation. By setting the range of discharging amounts for each hour, as in Equation (5), PV-linked ESS operators can minimize the risk of breaching discharging limit regulations. This enables PV-linked ESS operators to enhance their REC profits.
To enhance SMP profits, sufficient energy should be discharged during peak SMP periods. With the maximum discharging amount outlined in Equation (5), devising a discharge schedule by identifying the times with the highest SMP is imperative. It is challenging to anticipate future SMP levels without communication and control systems; hence, historical SMP data from a year prior are utilized. As discussed in Section 2.2, SMP patterns vary across weekdays, weekends, and holidays, prompting the categorization of SMP historical data accordingly. Upon identifying the times with the highest SMP, the discharge schedules were established for weekdays, weekends, and holidays based on the frequency of occurrence.
4. Validation of Effectiveness
The data utilized in this study comprised real-world data for charging and discharging from January 2022 to April 2023 for 12 PV-linked ESS operators located in Jeju Island, Korea. The proposed discharging strategy leveraged historical SMP and PV generation performance data from the previous year. Consequently, an analysis of 2022 data was conducted to determine the maximum discharging amounts and schedules for each hour, which were then applied to 2023. Therefore, this study aims to validate the effectiveness of the proposed strategy by comparing existing profits, maximum profits, and profits generated by implementing the proposed strategy throughout 2023. Notably, maximum profits denote the profits generated in an ideal situation, in which PV generation and SMP forecasts are precise. For comparison, the cases are categorized as follows.
- Case 0: Original Charging Strategy + Original Discharging Strategy
- Case 1-A: Original Charging Strategy + Optimal Discharging Strategy
- Case 1-B: Optimal Charging Strategy + Optimal Discharging Strategy
- Case 2-A: Original Charging Strategy + Proposed Discharging Strategy
- Case 2-B: Proposed Charging Strategy + Proposed Discharging Strategy
For comparison, the profit of Case 0 was set as the baseline value of 100%. Subsequently, Case 1-A and Case 2-A were represented as percentages relative to the baseline value to validate the effectiveness of the proposed discharging strategy. Similarly, Case 1-B and Case 2-B were compared to validate the effectiveness of the proposed charging strategy.
4.1. Assumptions
In this study, the REC weight for ESS discharging was set to five, and the REC price was determined based on the average REC price in 2022 [23]. The REC price and the capacity of each PV and PCS are listed in Table 1 and Table 2. Additionally, the results pertaining to the existing profits of PV-linked ESS operators, referred to as Case 0, are listed in Table 3.

Table 1.
Average REC price in 2022.

Table 2.
PV and PCS capacities of each PV-Linked ESS operator.

Table 3.
Case 0 results.
4.2. Results
4.2.1. Validation of the Discharging Strategy
This section validates the effectiveness of the proposed discharging strategy. In this study, α, the margin that accounts for the variability in PV generation, was set to 2%. The values of divided by the capacity of each PV system, derived from the 2022 PV generation data, are shown in Figure 5.
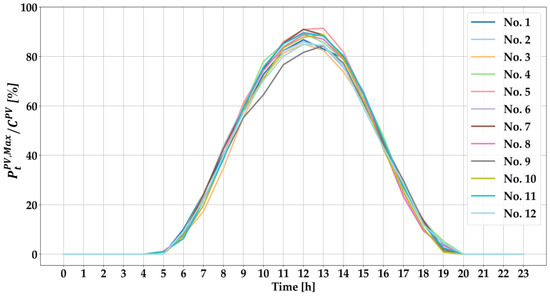
Figure 5.
for each PV-linked ESS operator.
The results of determining the discharging schedule based on the 2022 SMP data are as follows:
- Weekdays: 19 h, 18 h, 20 h, 8 h, 17 h
- Weekends: 19 h, 18 h, 17 h, 20 h, 21 h
- Holidays: 20 h, 19 h, 18 h, 23 h, 22 h
The effectiveness of the proposed discharging strategy is shown in Figure 6. In Figure 4, the original discharging pattern remained consistent regardless of weekdays, weekends, or holidays. In contrast, the proposed discharging strategy resulted in varying discharging schedules for weekdays, weekends, and holidays, aligning more closely with SMP patterns. A comparison of SMP profits reveals that the proposed discharging strategy resulted in profit increases of approximately 3.55% on weekdays, 2.50% on weekends, and 0.32% on holidays, as shown in Figure 6.
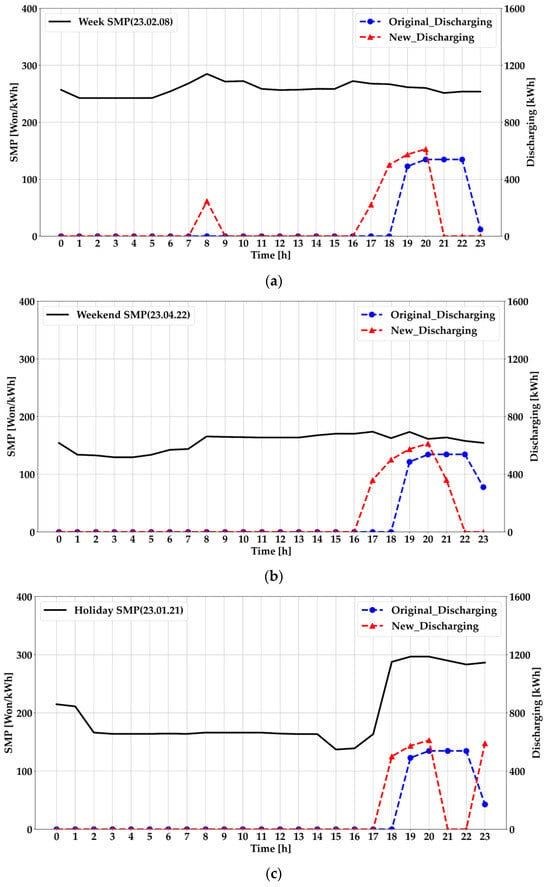
Figure 6.
(a) Comparison of weekday SMP and discharge patterns. (b) Comparison of weekend SMP and discharge patterns. (c) Comparison of holiday SMP and discharge patterns.
A comparison of the profits generated in Cases 1-A and 2-A is presented in Figure 7. Notably, operators 2, 5, and 8 previously violated the original discharging limit regulation. Upon implementing the proposed discharging strategy, they obtained RECs that had previously eluded them, resulting in a substantial increase in the REC profits in Cases 1-A and 2-A. Additionally, the consistency in REC profits between Cases 1-A and 2-A indicates that the proposed discharging strategy can maximize REC profits. However, Case 2-A showed lower SMP profits compared with Case 1-A because the discharging strategy relied on SMP data from the previous year. Consequently, the total profit in Case 2-A was approximately 8.67% higher than that of Case 0, representing approximately 99.07% of the total profit of Case 1-A. These findings validate the effectiveness of the proposed discharging strategy.
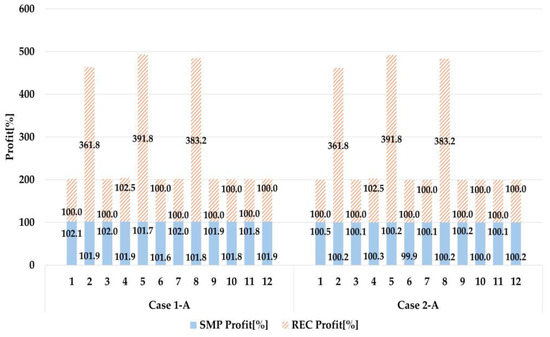
Figure 7.
Results of Case 1-A and Case 2-A.
4.2.2. Validation of the Charging Strategy
This section validates the effectiveness of the proposed charging strategy. The changes observed when implementing the proposed charging strategy compared with the original charging pattern in Figure 2 are shown in Figure 8, based on which the entire PV generation was utilized for ESS charging from 10 A.M., when charging was allowed. Charging continued until 4 P.M., maximizing the utilization of the ESS battery capacity.
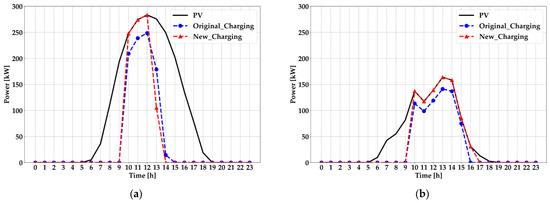
Figure 8.
(a) Comparison of charging patterns on a clear day. (b) Comparison of charging patterns on a cloudy day.
A quantitative analysis was conducted to compare the original charging amounts with the charging amounts after implementing the proposed charging strategy, and the results are shown in Figure 8a,b. The charging amounts increased by 2.39% and 21.66%, respectively. Figure 9 is a visual representation of the increase in charging amounts for No. 3 resulting from the application of the proposed charging strategy, compared with the original charging amounts, showcasing the daily charging amounts in descending order. The charging amounts in Figure 9 increased by 10.57% compared to the original charging amounts. On average (No. 1–12), the charging amounts for the PV-linked ESS operators increased by 11.84% following the application of the proposed charging strategy from January to April 2023.
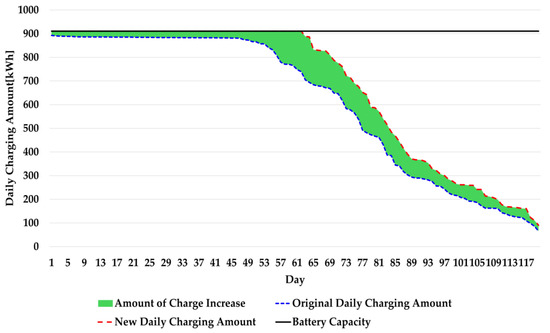
Figure 9.
Comparison of daily charging amounts in descending order and increase in charging amounts based on charging patterns for No. 3.
A comparison of the profits generated in Cases 1-B and 2-B is shown in Figure 10. In most scenarios, the SMP profits in Case 2-B decreased compared with the original strategy. This decline can be attributed to the energy loss incurred owing to the ESS efficiency during additional charging outweighing the additional SMP profit. ESS efficiency was influenced by its operating range, posing challenges in precise efficiency measurement [24]. To address this problem, the ESS efficiency was calculated by dividing the total discharging amount by the total charging amount obtained from real-world data. The results reveal an average ESS efficiency of 89.36%, resulting in an energy loss of approximately 10.64% during additional charging. On the other hand, the average SMP during the main discharging time from 5 P.M. to 8 P.M., as per the proposed discharging strategy from January to April 2023, was approximately 8.11% higher than the average SMP during the designated charging hours. In other words, the energy loss owing to the efficiency of the ESS surpassed the additional SMP profit. Therefore, in most cases, the SMP profits in Case 2-B are lower than those in Case 0. However, the increased charging increased the discharging amount, thereby increasing the REC profits. Consequently, the total profit in Case 2-B is approximately 12.45% higher than that in Case 0, representing approximately 98.93% of the total profit in Case 1-B. Additionally, the total profit in Case 2-B is approximately 3.47% higher than that in Case 2-A, validating the effectiveness of the proposed charging strategy.
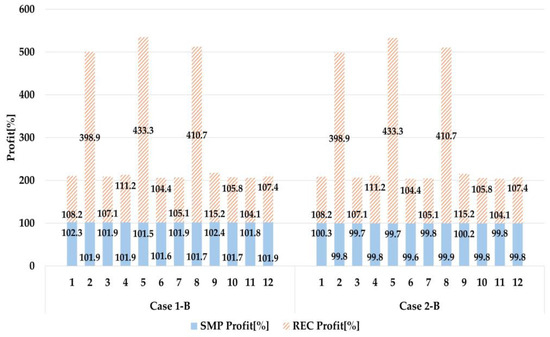
Figure 10.
Results of Case 1-B and Case 2-B.
5. Institutional Issues and Solutions for PV-Linked ESS in Korea
Since 2021, the issuance of RECs for newly installed ESSs in Korea has been halted owing to inadequate system contributions and fire hazards.
The domestic wholesale electricity market, excluding the energy market, remains operationally inadequate. Consequently, the primary source of income for ESSs installed since 2021 is arbitrage based on the difference in hourly SMP in the energy market. However, fluctuations in the SMP in the domestic wholesale electricity market cannot generate significant profits that can outweigh the losses incurred during the charging and discharging processes of the ESS. This is because the difference in the SMP revenue between Case 1-A and Case 1-B in Section 4.2 was only 0.06%, and the SMP revenue decreased with additional charging in Case 2-B. Thus, the current wholesale electricity market system in Korea renders it difficult for ESSs to secure economic feasibility. This highlights the challenging economic feasibility of ESSs in Korea, resulting in a significant decline in newly installed ESS capacity since 2021, as noted in [25]. However, Korea’s commitment to increasing renewable energy installations is expected to increase system uncertainty.
To address these problems, the Korea Power Exchange (KPX), Korea’s power system operator, has established a new low-carbon central contract market to facilitate the introduction of ESS through long-term contracts. In 2023, KPX initiated the central contract market and bidding process for a long-duration battery ESS (BESS) in Jeju for the first time [26]. However, accurately evaluating the efficiency of ESSs has proven challenging owing to unclear details regarding the estimation of introduction volumes, bidding prices, and future operational methods. Therefore, the market system must be enhanced to enable ESS operators to generate additional profits, thereby fostering new natural entries.
To address this problem, SMP that aligns with the power supply and demand conditions of the system needs to be generated. Currently, the SMP during periods of renewable energy curtailment does not significantly differ from the SMP on days without curtailment during the same time periods. Moreover, there is minimal difference in the SMP between the hours with and without curtailment on days when renewable energy curtailment occurs. This is shown in Figure 11. Therefore, even when renewable energy curtailment occurs, there is minimal change in the SMP. Therefore, the incentive for ESS to charge during renewable energy curtailment is low, which renders solving the renewable energy curtailment problem through ESS charging challenging.
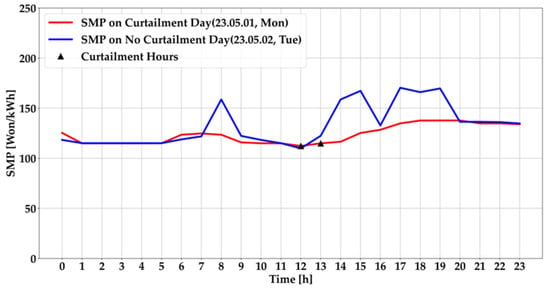
Figure 11.
SMP on Curtailment and Non-Curtailment Days, and Curtailment Hours.
One solution to this problem involves introducing negative SMP that aligns with the power supply and demand conditions of the system. Through negative SMP, with the occurrence of renewable energy curtailment, ESS operators will naturally charge during these periods to increase their profits. Additionally, the increase in profits could encourage the entry of new ESSs into the market. In fact, with the introduction of the Jeju real-time market on 1 June 2024, negative prices have started to occur. This provides a real example of negative SMP during renewable energy curtailment inducing the charging of ESS operators during those periods. Such a policy offers profit opportunities for ESS operators and promotes the entry of new ESSs into the market. Consequently, the renewable energy curtailment problem can be resolved through ESS charging. However, Jeju’s annual electricity demand is only 1% of Korea’s total annual electricity demand [27]. Moreover, there is a lack of a clear plan for introducing negative SMP in mainland areas.
Second, locational marginal price (LMP) should be introduced. According to [28], renewable energy curtailment occurs only in certain regions. The introduction of LMP would ensure that the negative prices first occur in these regions, thus prompting the installation of ESSs first in such areas. This will prioritize the deployment of ESSs in regions where required, effectively addressing the renewable energy curtailment problem.
6. Conclusions
This study comprehensively evaluated the policies and operational practices that affect PV-linked ESSs in Korea. By analyzing real-world data from Jeju, we developed enhanced operational strategies aimed at boosting profitability. These strategies demonstrated potential profit increases of up to 12.45%, aligning with current regulations and designed for immediate implementation in existing ESS facilities. Their development was particularly influenced by the recognition that many ESS operators currently lack advanced communication and control equipment, highlighting the need for pragmatic, accessible solutions. While the practical application of our findings is demonstrated through data from Jeju, the principles of the proposed strategy are intended for broader applicability across different Korean regions, each with their unique market dynamics. The introduction of negative pricing and new market structures in June 2024 presents a crucial test of the robustness and adaptability of the proposed strategy.
To further enhance the strategy, future research will aim to validate and possibly refine it within these new market frameworks. We will explore the effectiveness of the strategy based on shorter data cycles, such as monthly and seasonal patterns, to ensure it remains robust and flexible. This methodological approach aims to adapt the strategy in Jeju as well as in various regional markets as they evolve, maintaining its relevance and effectiveness in the face of market changes. The strategies proposed in this study are not only a testament to the potential for immediate improvements in operational efficiency but also serve as a blueprint for future enhancements in policy and practice. By focusing on these areas, future research can extend actionable insights that refine policy recommendations and operational strategies, thereby supporting the large-scale sustainable integration of renewable energy across Korea.
Author Contributions
Formal analysis, investigation, writing—original draft preparation, S.K. (Seungha Kim); Conceptualization, methodology, writing—review and editing, S.L.; supervision, S.K. (Sungsoo Kim). All authors have read and agreed to the published version of the manuscript.
Funding
This study was funded by the Korea Agency for Infrastructure Technology Advancement (KAIA) grant funded by the Ministry of Land, Infrastructure, and Transport (Grant number: RS-2022-00143582), the Korea Institute of Energy Technology Evaluation and Planning (KETEP), and the Ministry of Trade, Industry, and Energy (MOTIE) of the Republic of Korea (Grant number: 20193710100061).
Data Availability Statement
The data used in this study include the market participation strategies of actual Korean renewable energy and ESS operators, which are sensitive as they pertain to the revenue and business strategies of the operators. Therefore, they are not publicly available. Data can be requested from the corresponding author and will be provided after appropriate review.
Conflicts of Interest
The authors declare no conflicts of interest.
References
- United Nations Climate Change. COP 21. Available online: https://unfccc.int/event/cop-21 (accessed on 23 July 2024).
- International Renewable Energy Agency (IRENA). Renewable Capacity Statistics 2023. Available online: https://www.irena.org/Publications/2023/Mar/Renewable-capacity-statistics-2023 (accessed on 10 May 2024).
- International Energy Agency (IEA). Renewables 2023. Available online: https://www.iea.org/reports/renewables-2023 (accessed on 10 May 2024).
- Electric Power Statistics Information System(EPSIS). Generation Capacity by Fuel in Korea. Available online: https://epsis.kpx.or.kr/epsisnew/selectEkpoBftChart.do?menuId=020100&locale=eng (accessed on 10 May 2024).
- Ministry of Trade Industry and Energy. 10th Basic Plan for Electricity Supply and Demand (2022–2036). Available online: https://www.kier.re.kr/resources/download/tpp/policy_230113_data.pdf (accessed on 10 May 2024).
- Wang, W.; Yuan, B.; Sun, Q.; Wennersten, R. Application of energy storage in integrated energy systems—A solution to fluctuation and uncertainty of renewable energy. J. Energy Storage 2022, 52, 104812. [Google Scholar] [CrossRef]
- Koh, L.H.; Wang, P.; Choo, F.H.; Tseng, K.-J.; Gao, Z.; Püttgen, H.B. Operational Adequacy Studies of a PV-Based and Energy Storage Stand-Alone Microgrid. IEEE Trans. Power Syst. 2015, 30, 892–900. [Google Scholar] [CrossRef]
- Awad, A.S.A.; EL-Fouly, T.H.M.; Salama, M.M.A. Optimal ESS allocation for benefit maximization in distribution networks. IEEE Trans. Smart Grid 2017, 8, 1668–1678. [Google Scholar] [CrossRef]
- Ranaweera, I.; Midtgård, O.M. Optimization of operational cost for a grid-supporting PV system with battery storage. Renew. Energy 2016, 88, 262–272. [Google Scholar] [CrossRef]
- Korea Energy Corporation Renewable Energy Center. Regulations on the Issuance of Renewable Energy Certificates (RECs) and the Operation of the Trading Market. Available online: https://www.knrec.or.kr/biz/pds/related/view.do?no=803 (accessed on 2 August 2024).
- Korea Ministry of Government Legislation. Guidelines for the Management and Operation of the Renewable Portfolio Standard (RPS) and Fuel Blending Mandate System. Available online: https://www.law.go.kr/LSW//admRulLsInfoP.do?admRulId=2044168&efYd=0 (accessed on 2 August 2024).
- Joachim, S.; Mills, A.D.; Wiser, R.H. Impacts of High Variable Renewable Energy Futures on Wholesale Electricity Prices, and on Electric-Sector Decision Making. Lawrence Berkeley National Laboratory 2018. Available online: https://emp.lbl.gov/publications/impacts-high-variable-renewable (accessed on 2 August 2024).
- Ko, W.; Kim, M.K. Operation Strategy for Maximizing Revenue of an Energy Storage System With a Photovoltaic Power Plant Considering the Incentive for Forecast Accuracy in South Korea. IEEE Access 2021, 9, 71184–71193. [Google Scholar] [CrossRef]
- Lee, H.G.; Kim, G.G.; Bhang, B.G.; Kim, D.K.; Park, N.; Ahn, H.K. Design algorithm for optimum capacity of ESS connected with PVs under the RPS program. IEEE Access 2018, 6, 45899–45906. [Google Scholar] [CrossRef]
- Korea Electric Power Corporation (KEPCO). Korea Electric Power Statistics (2022). Available online: https://home.kepco.co.kr/kepco/KO/ntcob/ntcobView.do?pageIndex=1&boardSeq=21062112&boardCd=BRD_000099&menuCd=FN05030103&parnScrpSeq=0&categoryCdGroup=®DateGroup2= (accessed on 10 May 2024).
- Jeju Provincial Government. CFI 2030. Available online: https://www.jeju.go.kr/cfi/intro/purpose.htm (accessed on 10 May 2024).
- Yoo, Y.; Jang, G.; Jung, S. A Study on Sizing of Substation for PV With Optimized Operation of BESS. IEEE Access 2020, 8, 214577–214585. [Google Scholar] [CrossRef]
- Abdeltawab, H.; Mohamed, Y.A. Energy Storage Planning for Profitability Maximization by Power Trading and Ancillary Services Participation. IEEE Syst. J. 2022, 16, 1909–1920. [Google Scholar] [CrossRef]
- Chaudhari, K.; Ukil, A.; Kumar, K.N.; Manandhar, U.; Kollimalla, S.K. Hybrid optimization for economic deployment of ESS in PV-integrated EV charging stations. IEEE Trans. Ind. Inform. 2017, 14, 106–116. [Google Scholar] [CrossRef]
- Roy, A.; Auger, F.; Olivier, J.C.; Auvity, B.; Schaeffer, E.; Bourguet, S. Energy management of microgrids: From a mixed-integer linear programming problem to a rule-based real-time algorithm. In Proceedings of the IECON 2021—47th Annual Conference of the IEEE Industrial Electronics Society, Toronto, ON, Canada, 13–16 October 2021; pp. 1–6. [Google Scholar] [CrossRef]
- Jung, S.; Kang, H.; Lee, M.; Hong, T. An optimal scheduling model of an energy storage system with a photovoltaic system in residential buildings considering the economic and environmental aspects. Energy Build. 2020, 209, 109701. [Google Scholar] [CrossRef]
- Jamal, S.; Pasupuleti, J.; Ekanayake, J. A rule-based energy management system for hybrid renewable energy sources with battery bank optimized by genetic algorithm optimization. Sci. Rep. 2024, 14, 4865. [Google Scholar] [CrossRef] [PubMed]
- Renewable One-Stop Business Information Integration Portal. Average REC Price for 2022. Available online: https://onerec.kmos.kr/portal/rec/selectRecReport_tradePerformanceList.do?key=1971 (accessed on 10 May 2024).
- Do, I.; Lee, S. Optimal scheduling model of a battery energy storage system in the unit commitment problem using special ordered set. Energies 2022, 15, 3079. [Google Scholar] [CrossRef]
- Ministry of Trade Industry and Energy. ESS Industry Development Strategy. Available online: https://www.motie.go.kr/kor/article/ATCL3f49a5a8c/168025/view (accessed on 10 May 2024).
- Korea Power Exchange (KPX). Jeju Long Term BESS Central Contract Market Competitive Tender Results for 2023. Available online: https://www.kpx.or.kr/board.es?mid=a10501010000&bid=0042&list_no=71185&act=view (accessed on 10 May 2024).
- Korea Power Exchange (KPX). Maximum Load Forecast (Jeju). Available online: https://new.kpx.or.kr/maxloadForecastJeju.es?mid=a10404020000 (accessed on 30 June 2024).
- Korea Power Exchange (KPX). Number of Land-Based Solar Curtailments by Time and Region. Available online: https://www.data.go.kr/data/15127381/fileData.do (accessed on 26 June 2024).
Disclaimer/Publisher’s Note: The statements, opinions and data contained in all publications are solely those of the individual author(s) and contributor(s) and not of MDPI and/or the editor(s). MDPI and/or the editor(s) disclaim responsibility for any injury to people or property resulting from any ideas, methods, instructions or products referred to in the content. |
© 2024 by the authors. Licensee MDPI, Basel, Switzerland. This article is an open access article distributed under the terms and conditions of the Creative Commons Attribution (CC BY) license (https://creativecommons.org/licenses/by/4.0/).