Source-Storage-Load Flexible Scheduling Strategy Considering Characteristics Complementary of Hydrogen Storage System and Flexible Carbon Capture System
Abstract
1. Introduction
1.1. Research Background
1.2. Literature Survey
1.3. Research Focus and Organization
- (1)
- The research results of some scholars have transformed thermal power units by adding carbon capture equipment, which alleviates the peaking cost during load valley periods. However, carbon capture units cannot achieve optimal carbon capture levels during load peak periods. The first key problem is in identifying how carbon capture units can cooperate with the time-shift characteristics of HSS, and how to jointly tap the low-carbon characteristics to maximize the potential of RE consumption.
- (2)
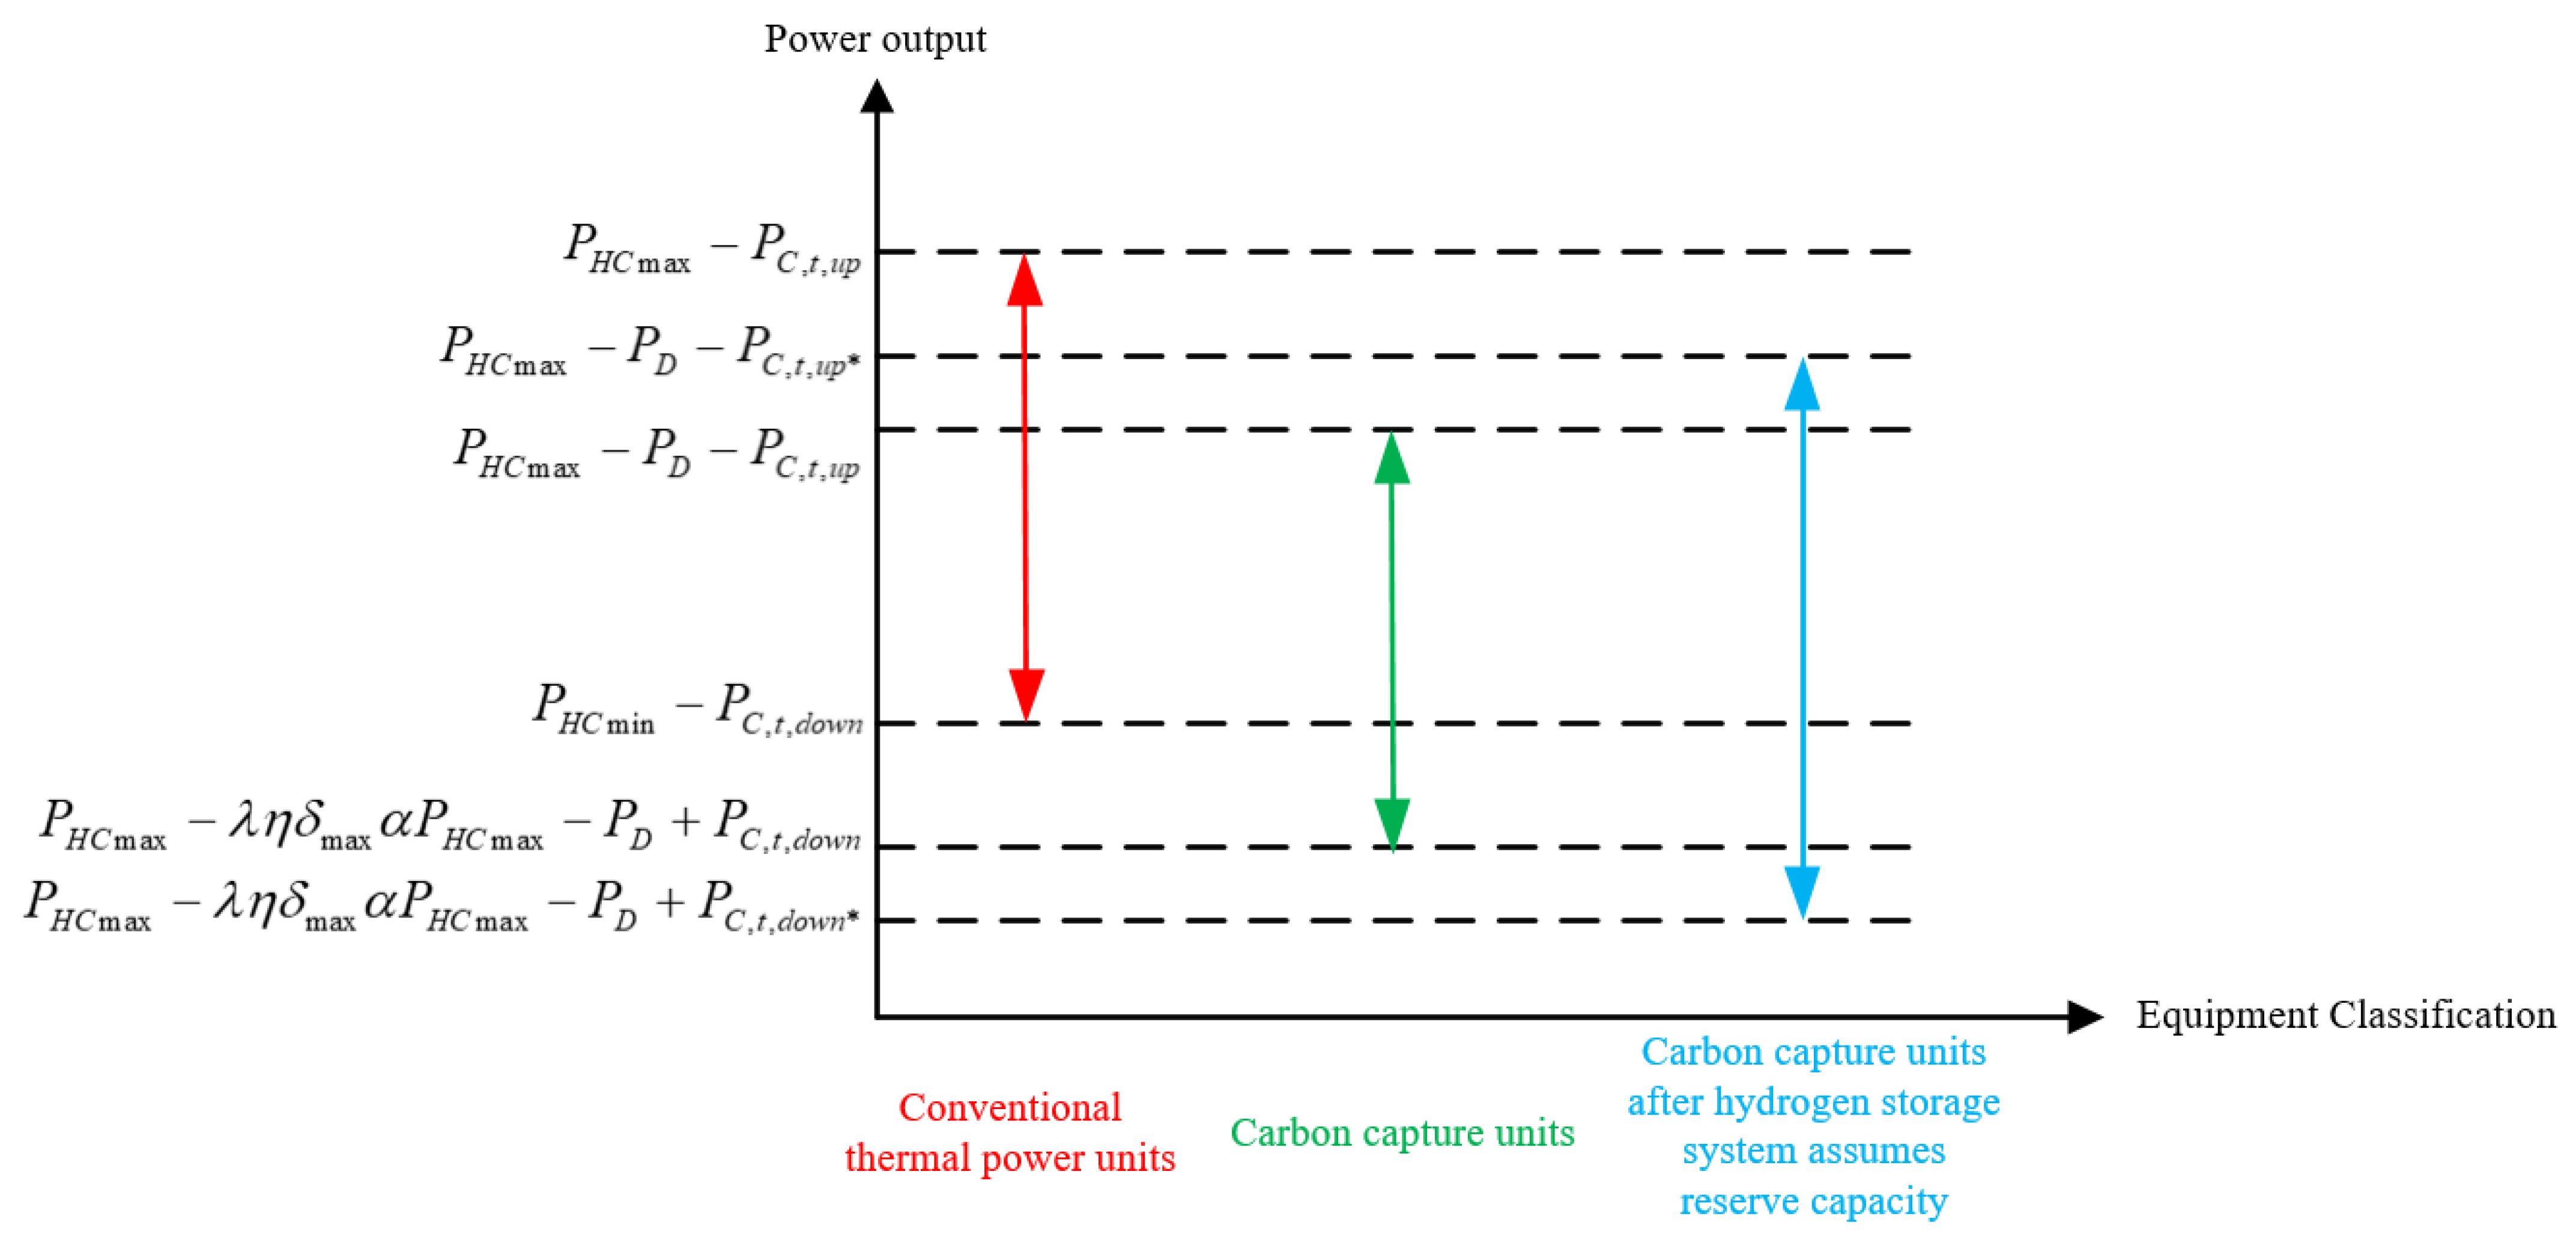
- The spinning reserve allocation plan needs to be restudied in depth with FCCS after considering the equivalent spinning reserve characteristics of HSS. Both FCCS and HSS can be used for energy time-shifting and partial spinning reserve capacity. Therefore, there is an urgent need for an in-depth study of the limitations in their operation modes, as well as their advantages and complementary characteristics.
- (3)
- In low-carbon economic scheduling, the impact of scheduling results have not been fully explored after the coordinated operation of source, storage, and load. The impact of DSR on low-carbon optimal economic dispatch needs to be considered.
2. Operating Mechanisms and Models of HSS, FCCS and DSR Considering Spinning Reserve and Time-Shift Characteristics
2.1. Operating Mechanisms and Models of HSS Considering Spinning Reserve and Time-Shift Characteristics
2.1.1. Operating Mechanisms of HSS Considering Spinning Reserve and Time-Shift Characteristics
- (1)
- Time-shift characterization of HSS
- (2)
- Equivalent spinning reserve characterization of HSS
2.1.2. Operating Models of HSS
- (1)
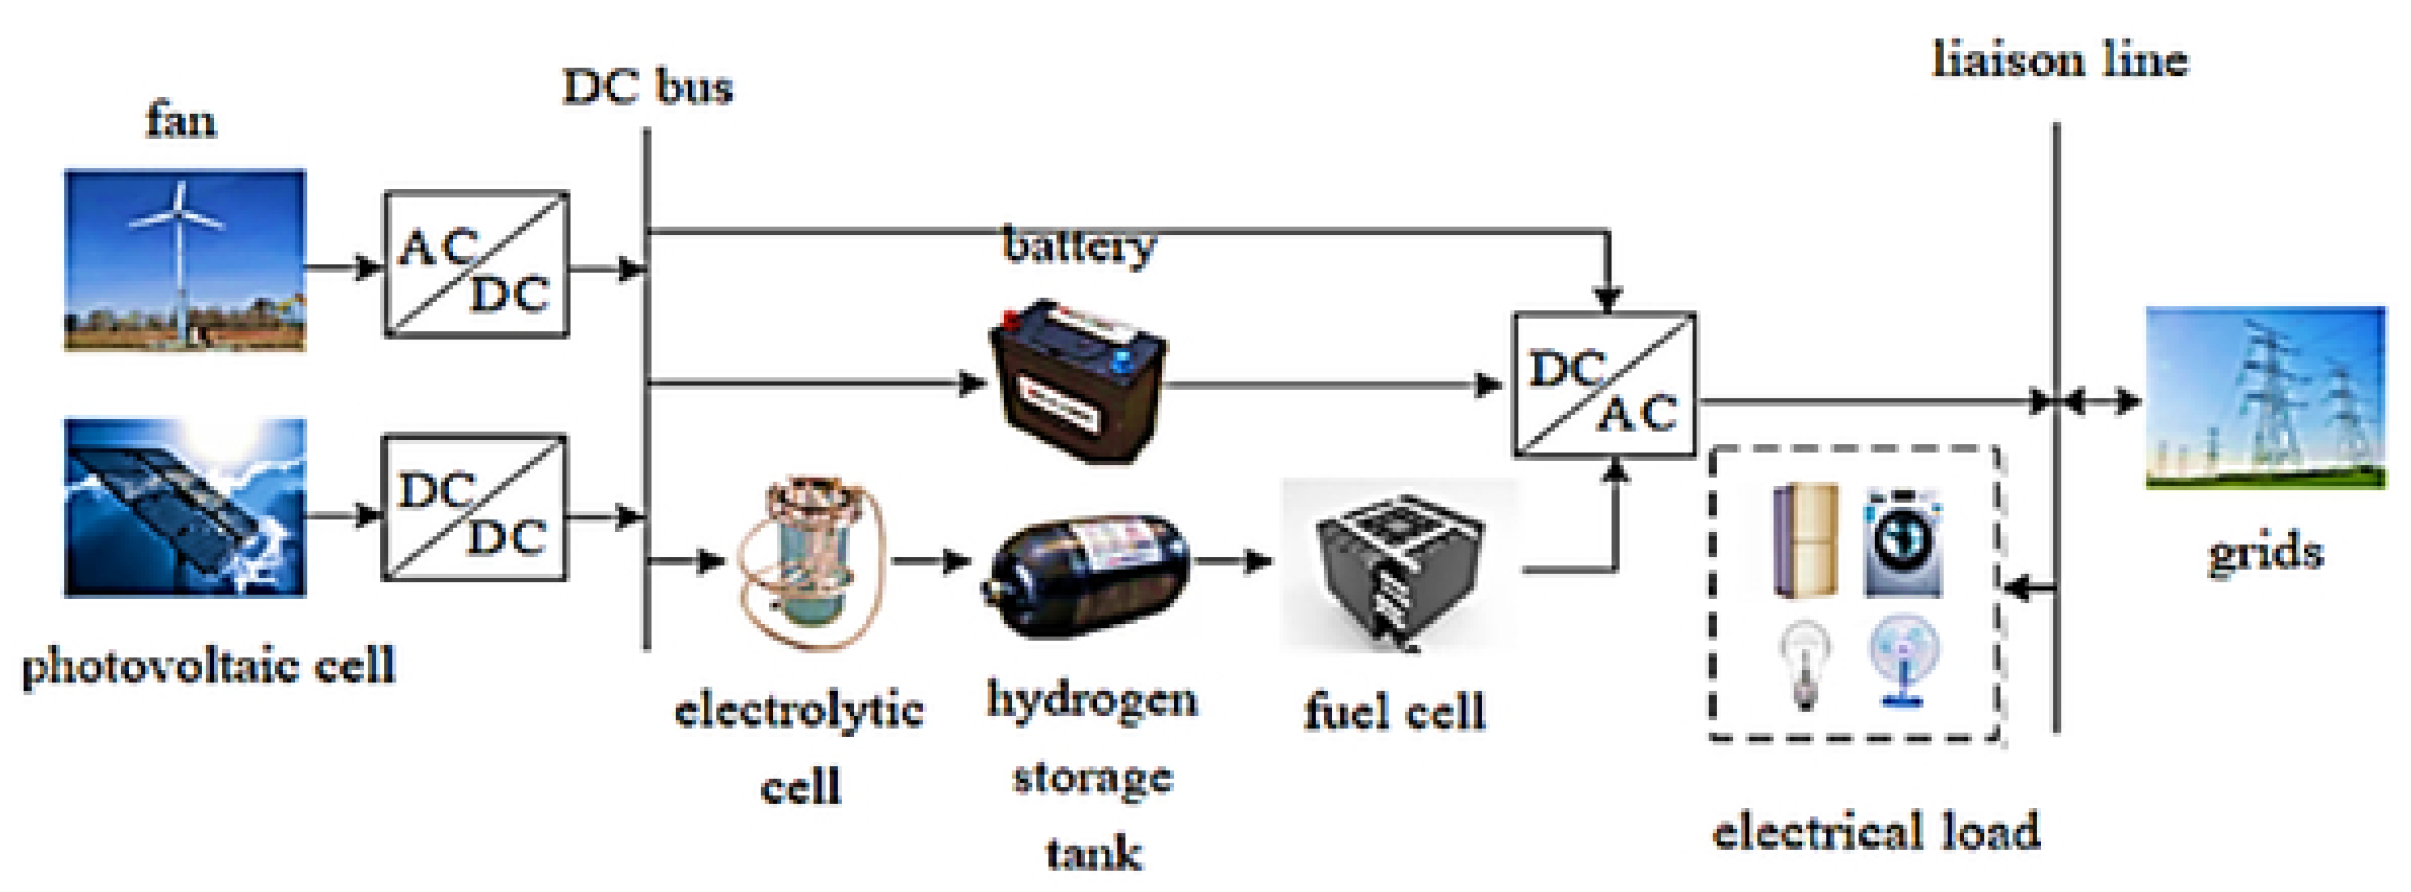
- Hydrogen capacity constraints for the HST:where EHSS,0 and EHSS,T represent the initial and final HST hydrogen capacity, respectively; and EHSS,min and EHSS,max represent the minimum and maximum HST hydrogen capacity limits, respectively.
- (2)
- Operating power constraints for the EC and FC:where Pel,tmax represents the maximum input power of the EC; Pfc,tmax represents the maximum output power of the FC; and Pel,N and Pfc,N represent the rated powers of the EC and FC, respectively. The minimum technical output of the EC is 10% of the rated power.
2.2. Operating Mechanisms and Models of FCCS Considering Spinning Reserve and Time-Shift Characteristics
2.2.1. Operating Mechanisms of FCCS Considering Spinning Reserve and Time-Shift Characteristics
2.2.2. Operating Models of FCCS
2.3. Operating Mechanisms and Models of DSR
3. The Characteristics Complementary Framework of FCCS and HSS
3.1. The Characteristics Complementary Framework of FCCS and HSS
3.2. The Coordinated Operation Characteristics of FCCS and HSS
3.2.1. The Spinning Reserve Characteristics of FCCS
3.2.2. The Equivalent Spinning Reserve Characteristics of FCCS Coupled with HSS
3.2.3. The Time-Shift Characteristics of FCCS Coupled with HSS
- (1)
- FCCS improve RE consumption in load valley periods through the liquid storage tanks to ease the peak pressure of HSS.
- (2)
- When FCCS reach the lower output limit during the load valley period, the phenomenon of power abandonment still occurs. HSS can consume the remaining electricity and replace the high-cost carbon capture unit output with energy storage output during the load peak period, so as to improve the operation economy.
4. Source-Storage-Load Flexible Scheduling Strategies Considering the Coordination of Spinning Reserve and Time-Shift Characteristics for HSS and FCCS
4.1. Objective Function
4.2. Constraints
- (1)
- Conventional unit operation constraint:where Pthn,max and Pthn,min represent the maximum and minimum output limits, respectively.
- (2)
- RE output constraint:where Pre,tpre represents the forecasted RE generation; and Pre,t represents the actual grid-connected power from RE sources.
- (3)
- Power grid balance constraint:where PJn,t represents the net output power; and PDSR,t represents load power after demand side response.
- (4)
- System reserve constraint:where p{} is the confidence expression; and σ is the confidence coefficient required by the system reserve constraint.
- (5)
- Other constraints
5. Case Study
5.1. The Parameter
- (1)
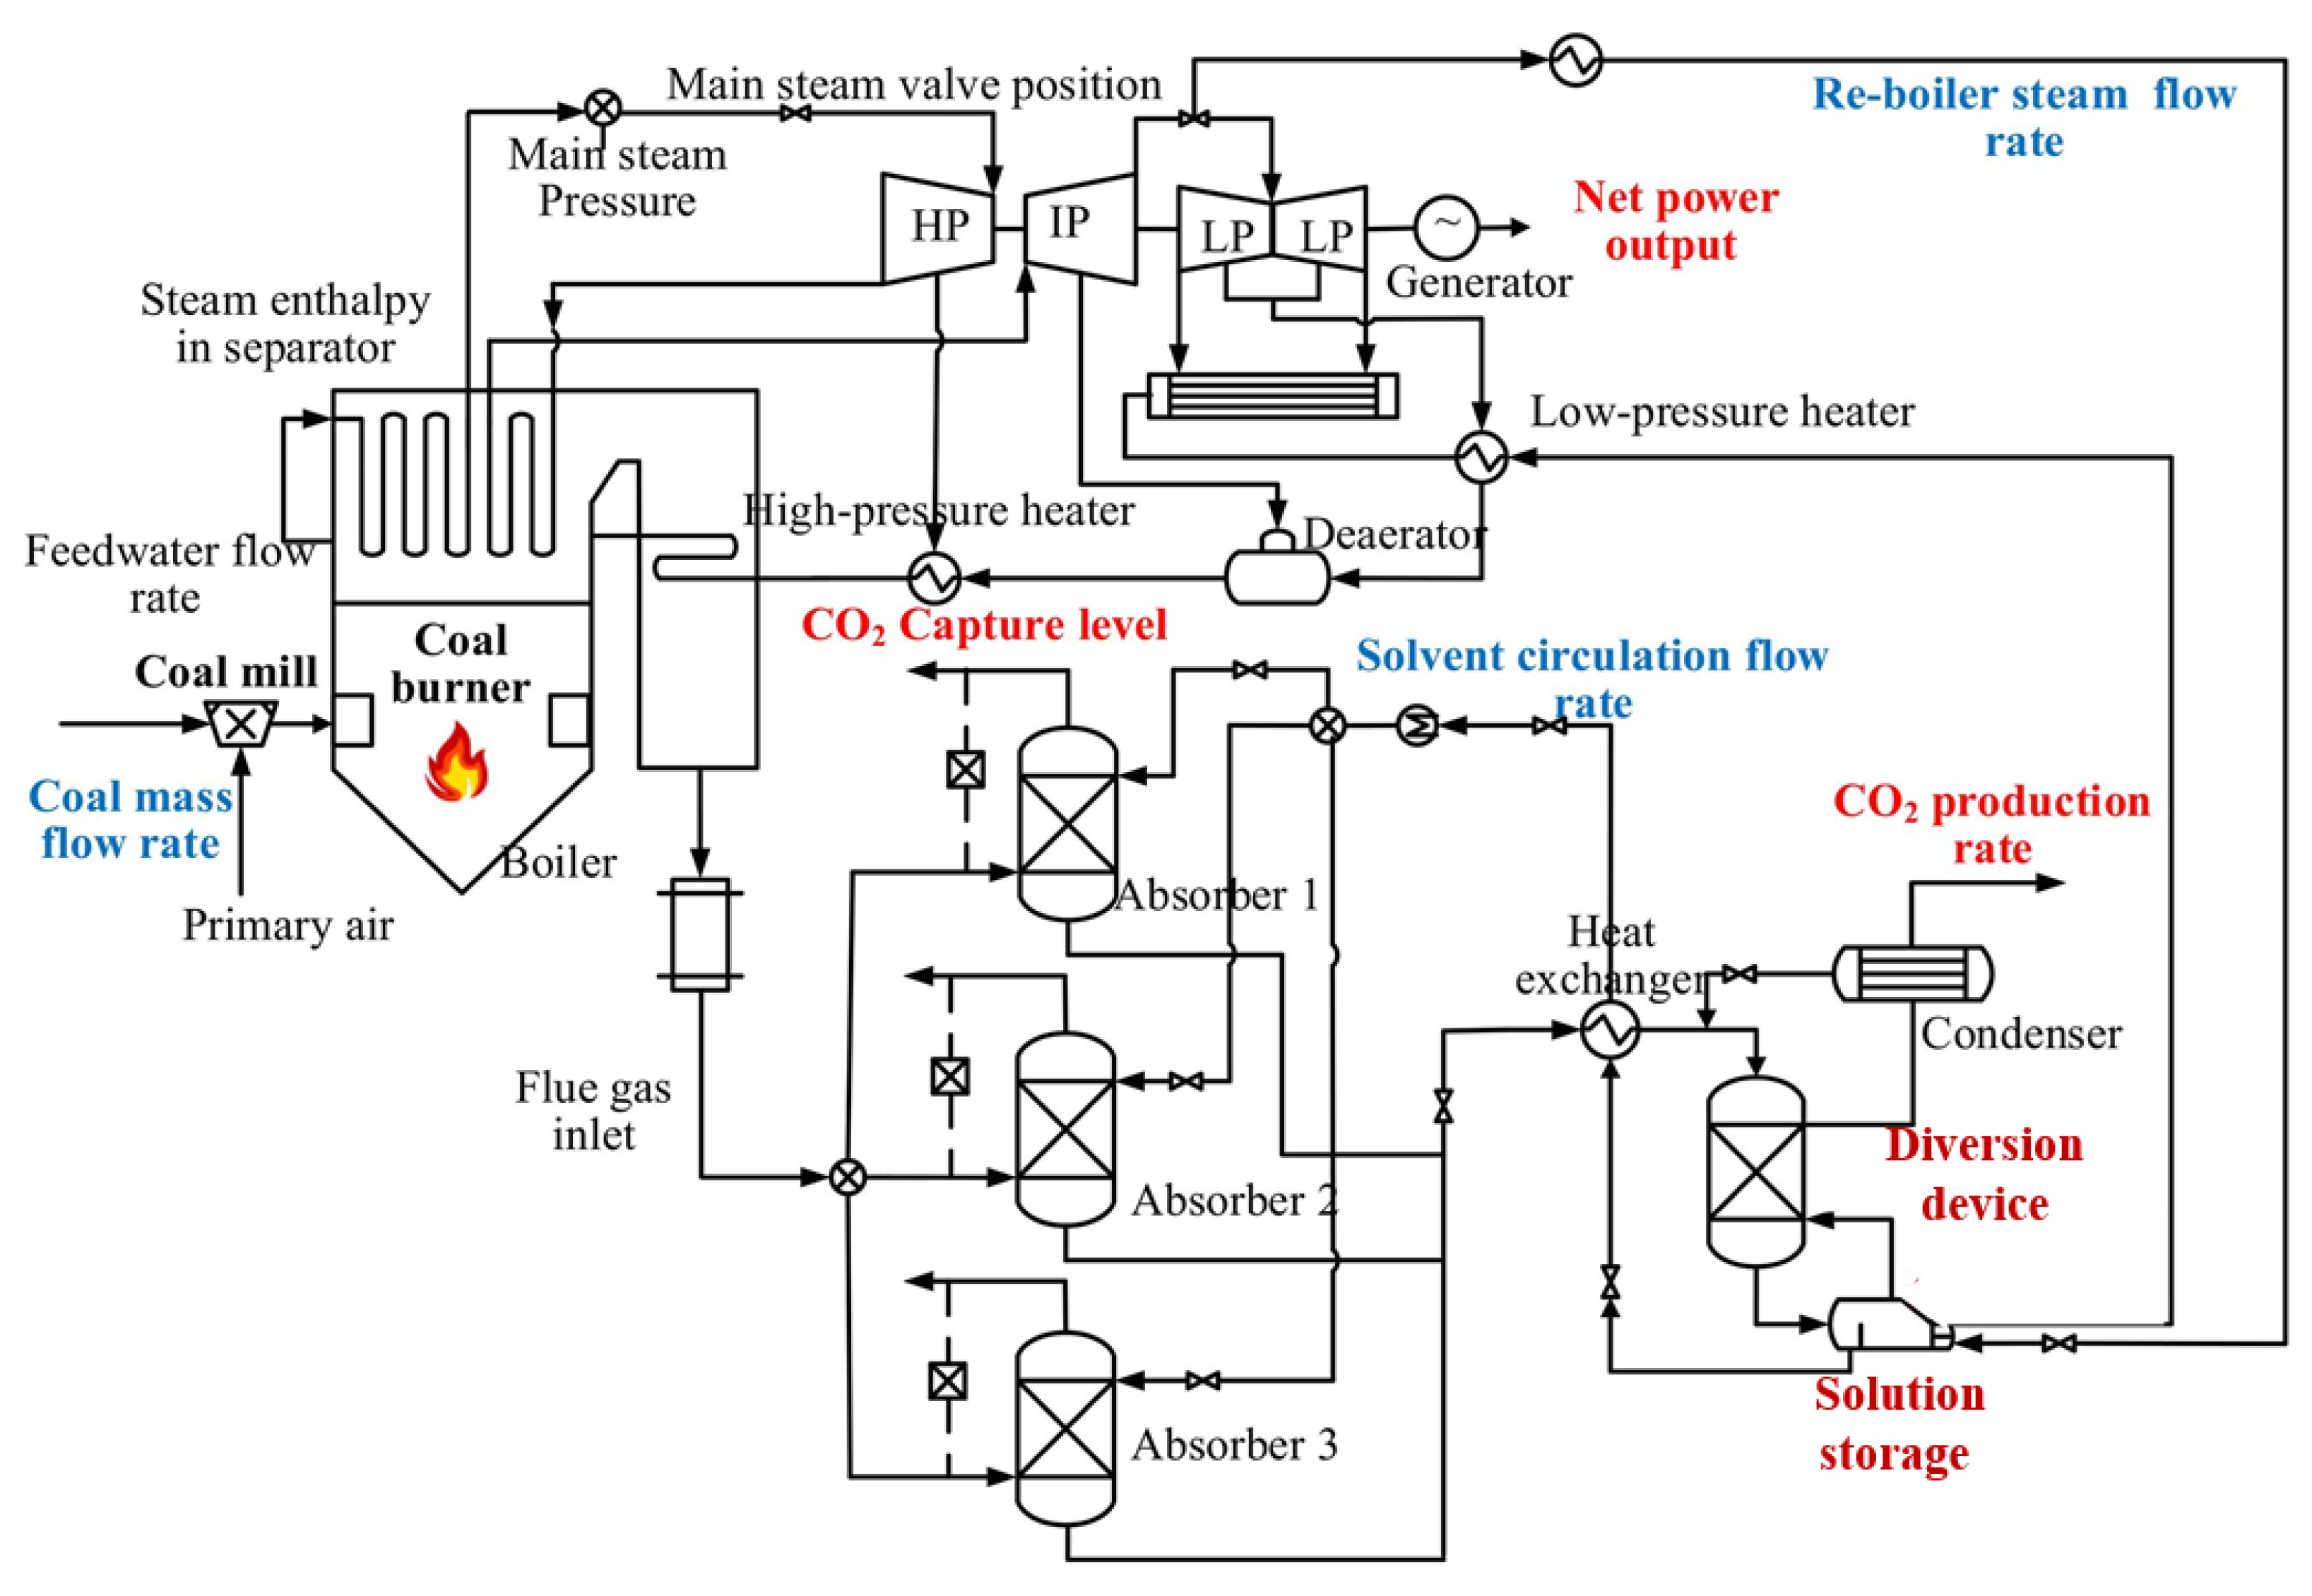
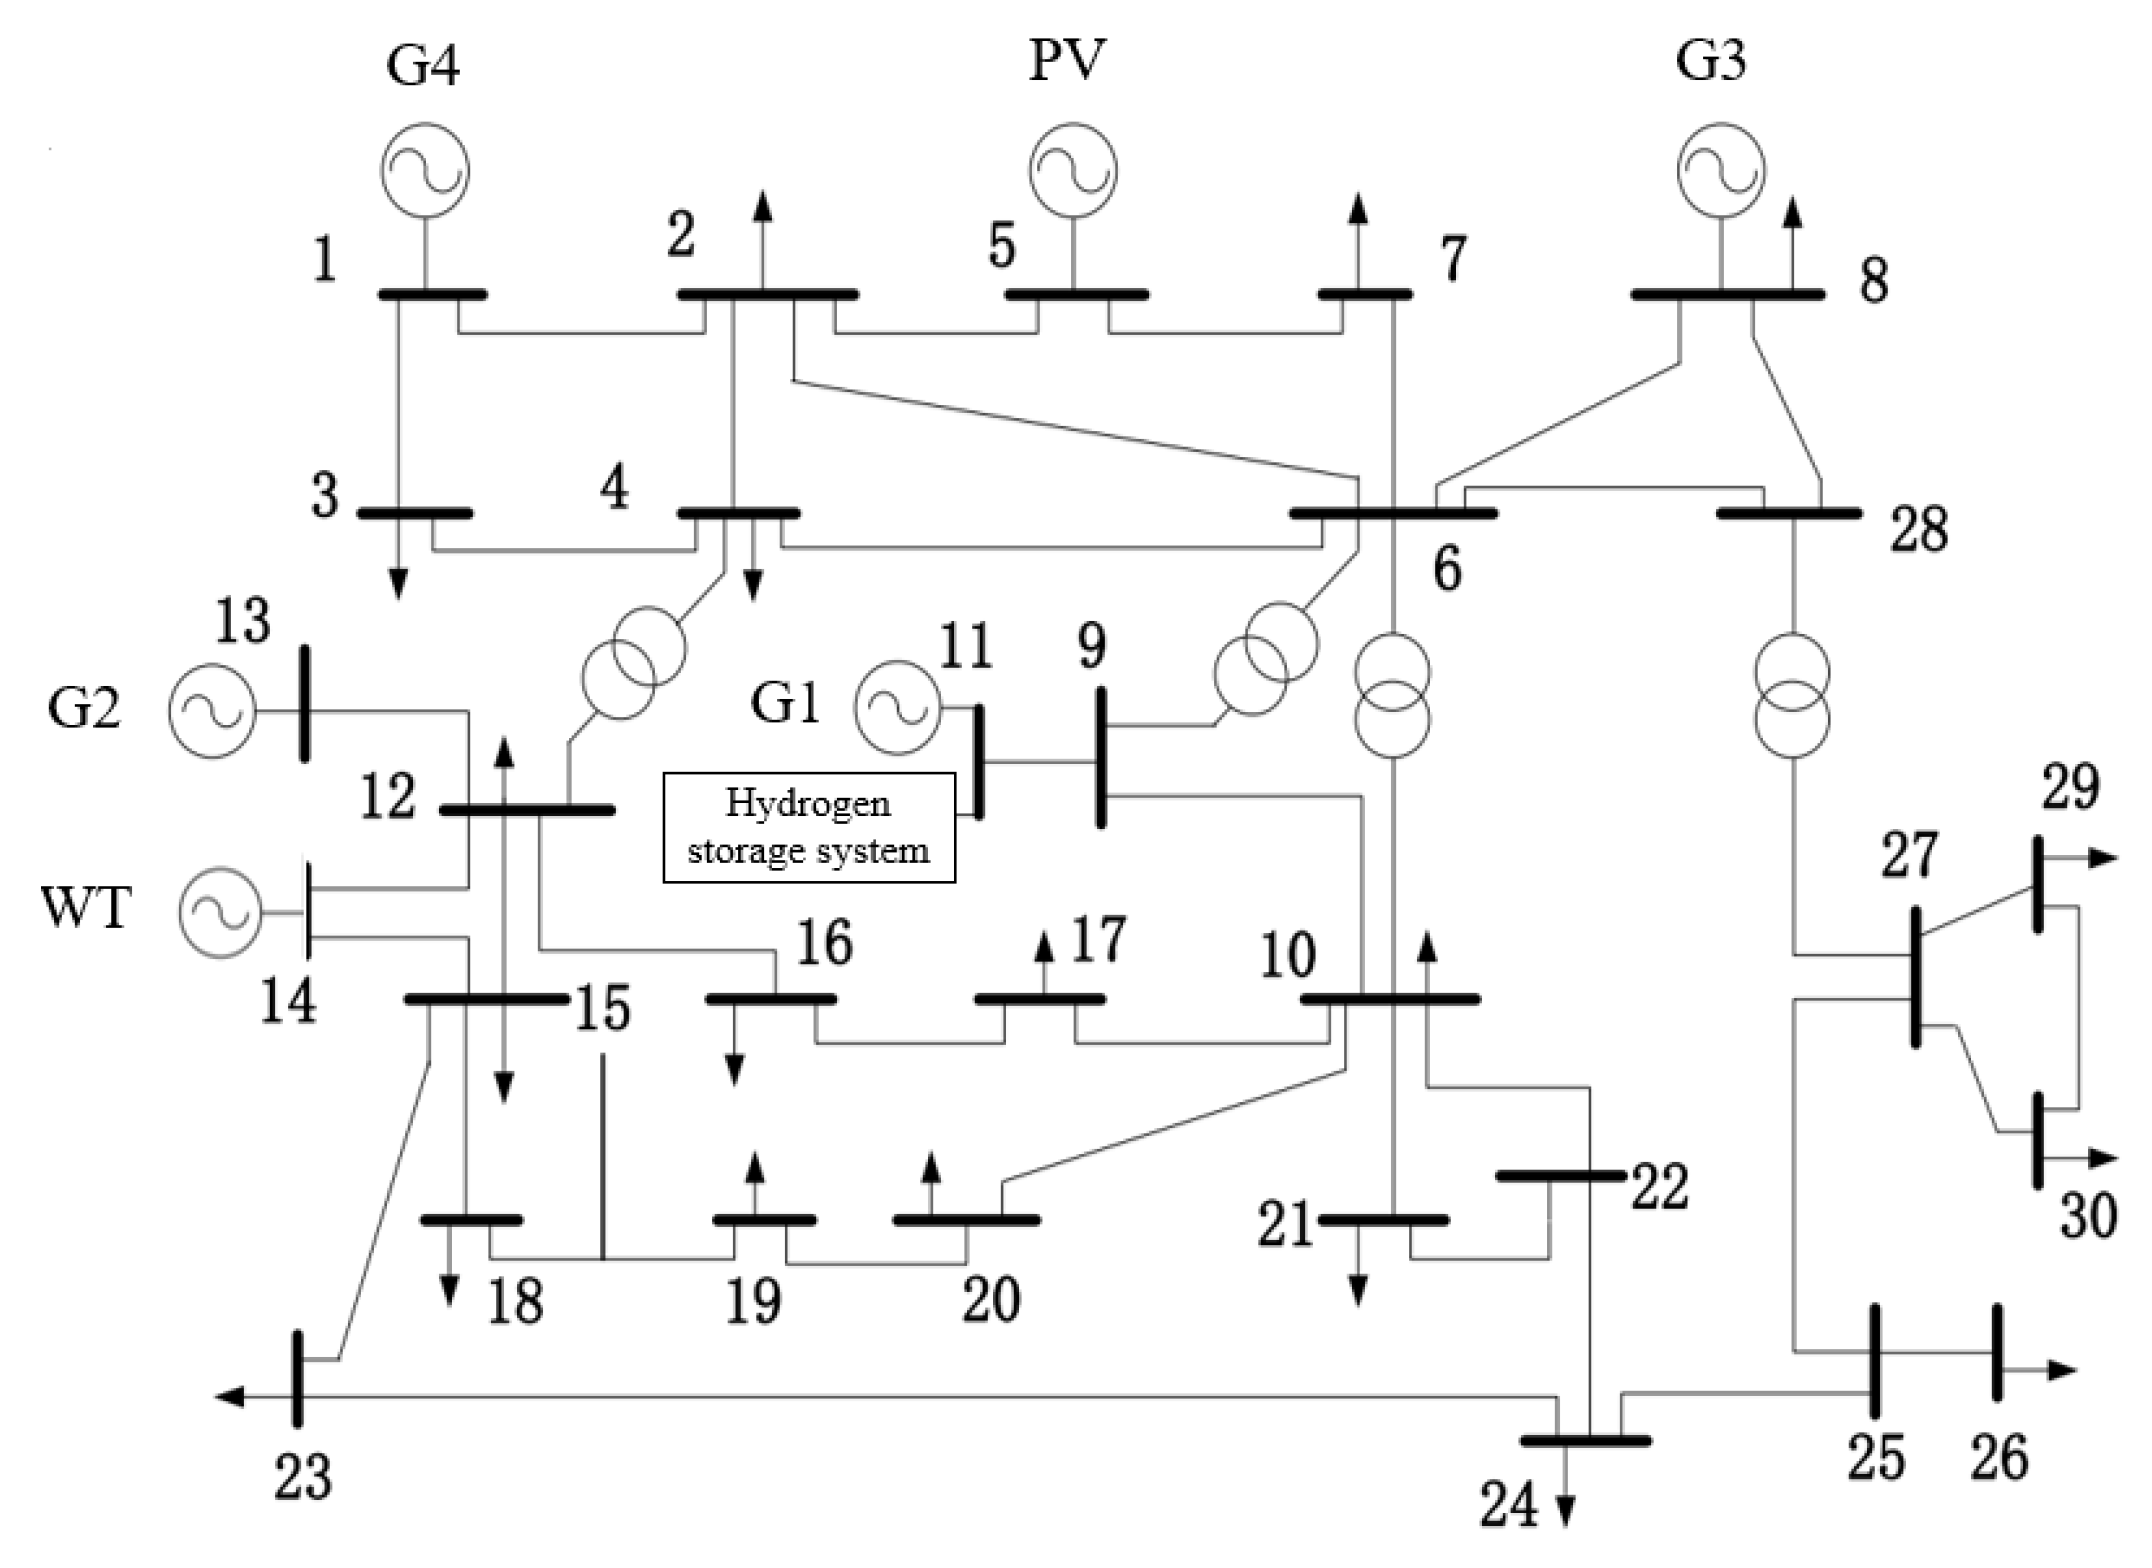
- This study investigates the synergistic operation effect of carbon capture and hydrogen storage systems, so the conventional unit is decarbonized at node 11, and the HSS is set up for synergistic operation with it.
- (2)
- Because the installed capacity of the PV and WT is relatively large, they are set up at the remote nodes 5 and 14, and the parameters are from the actual measurement at the energy base of the Hami region in Xinjiang, China.
- (3)
- The parameters of G2, G3, and G4 are derived from the measured energy bases in Hami area, Xinjiang, China.
- (1)
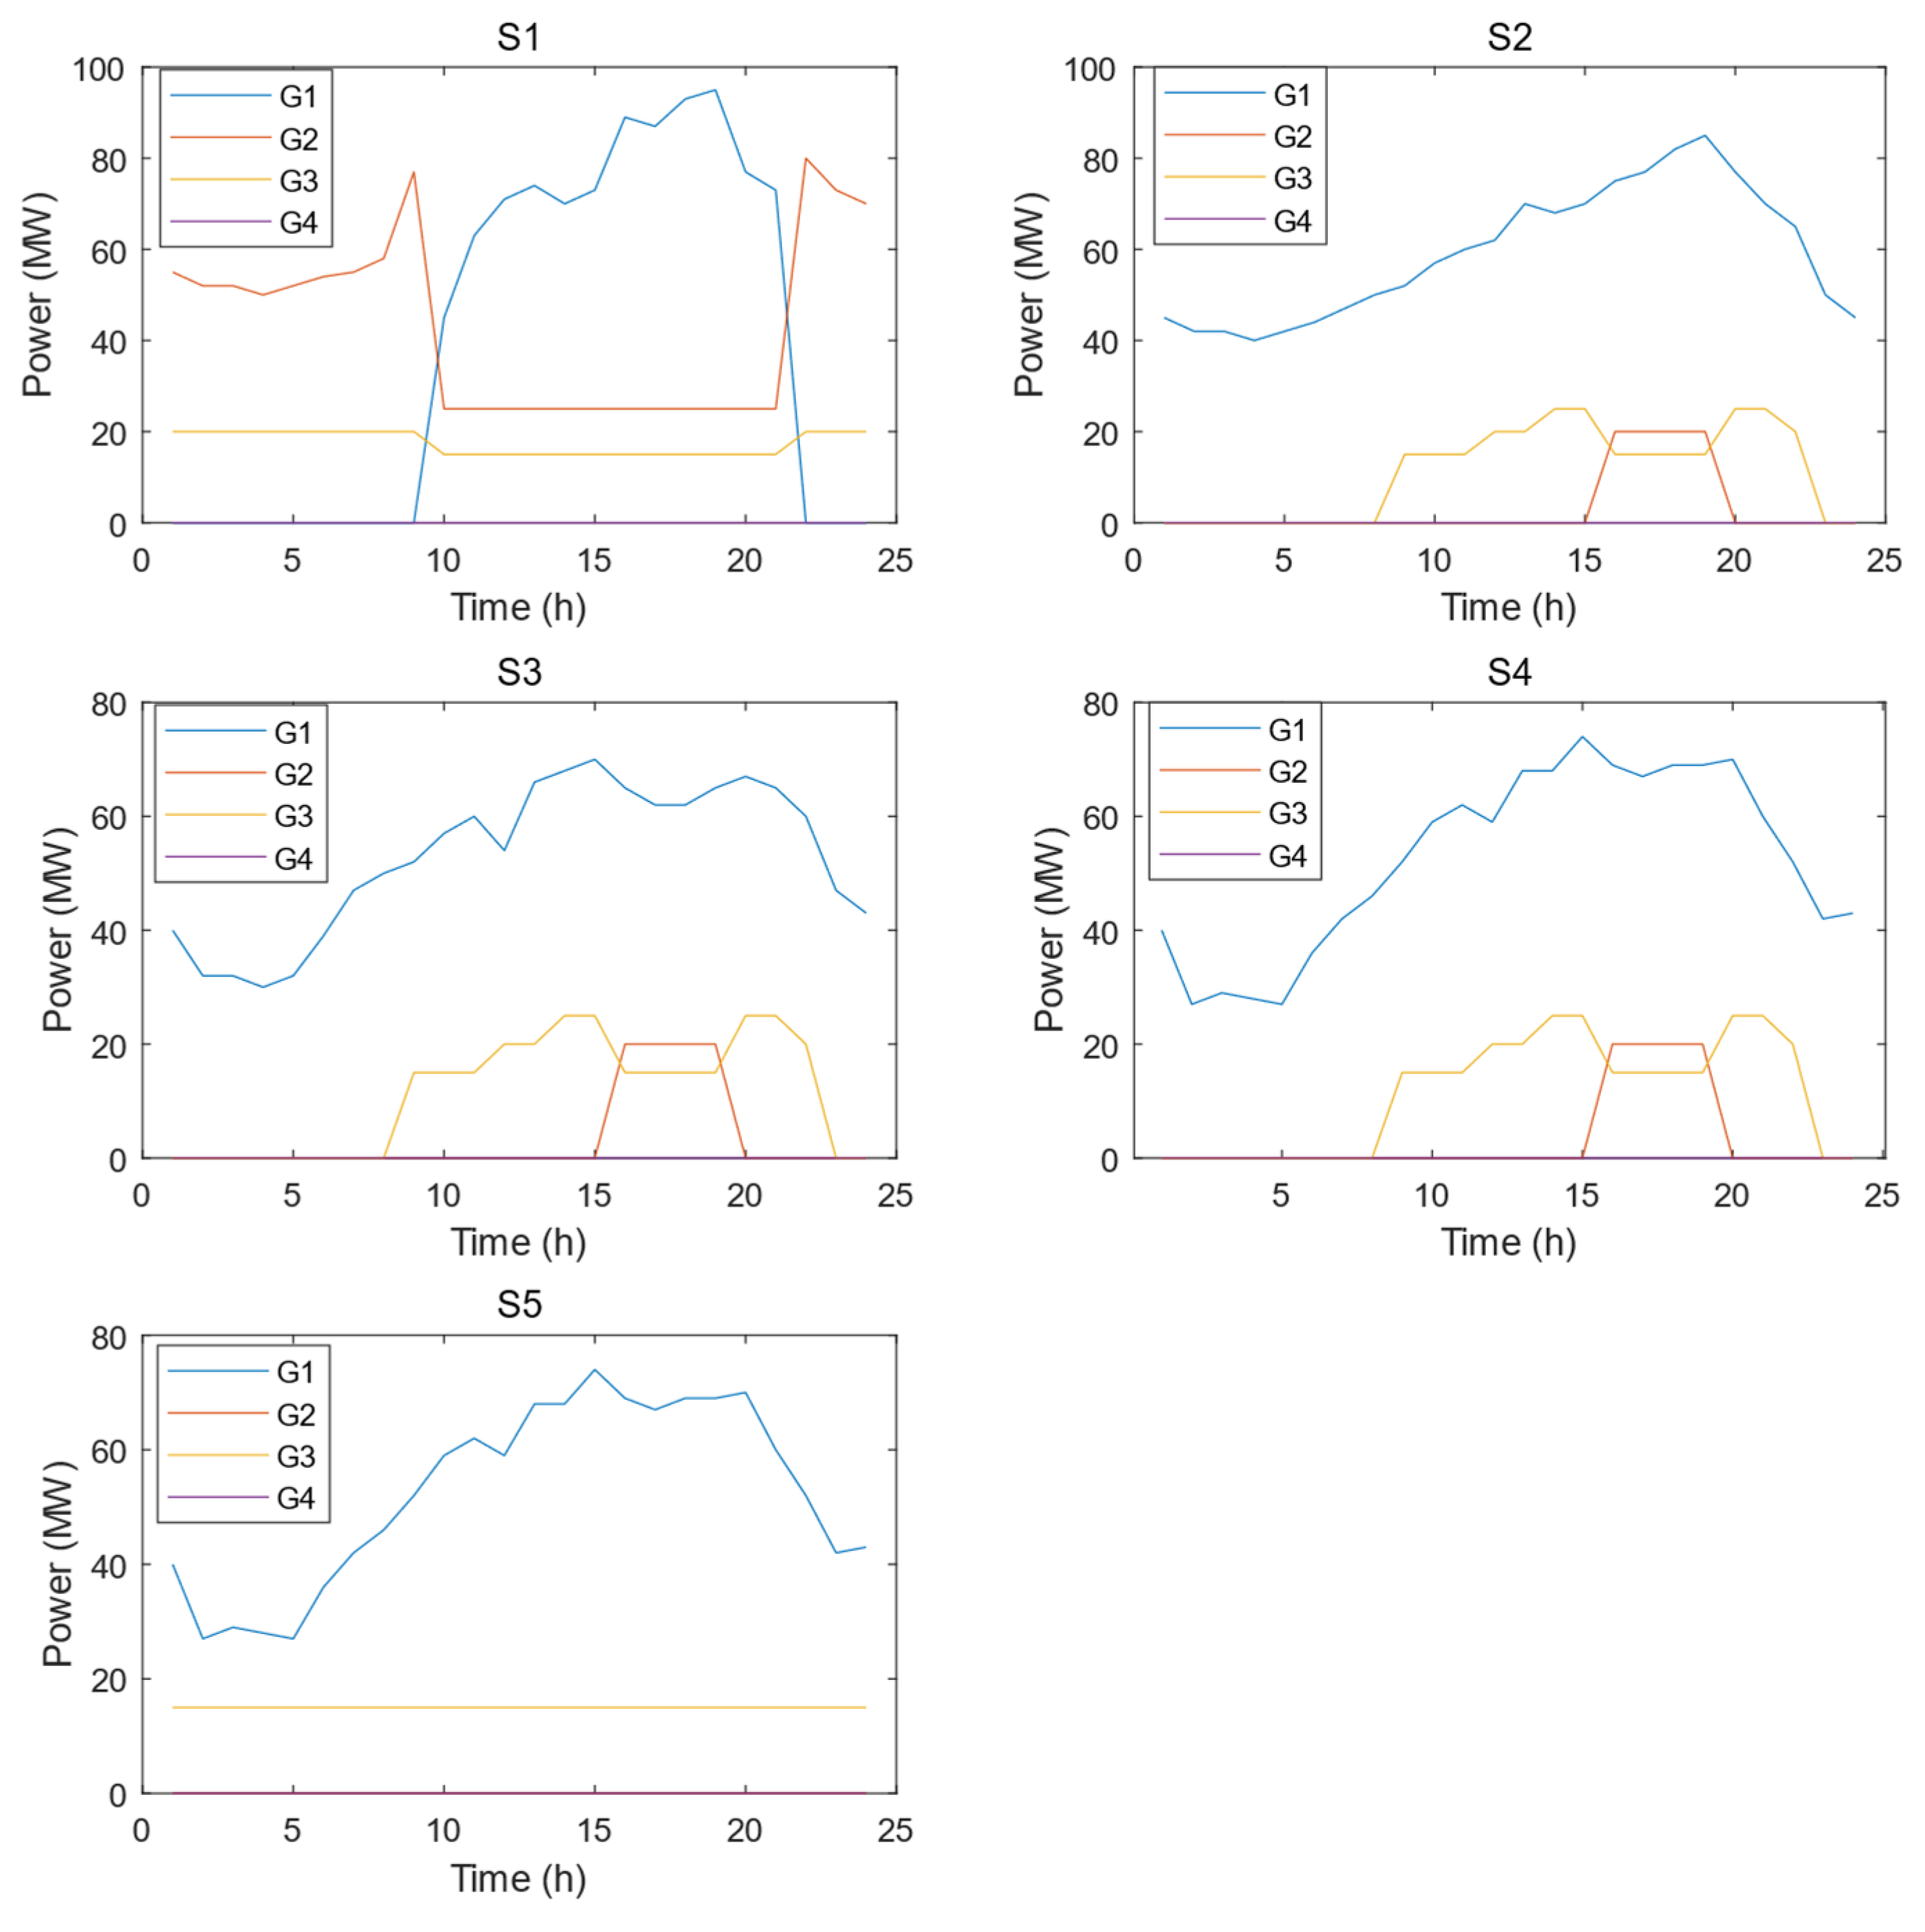
- S1: FCCS, HSS, and DSR are not considered.
- (2)
- S2: The flexible carbon capture system is considered on the basis of S1.
- (3)
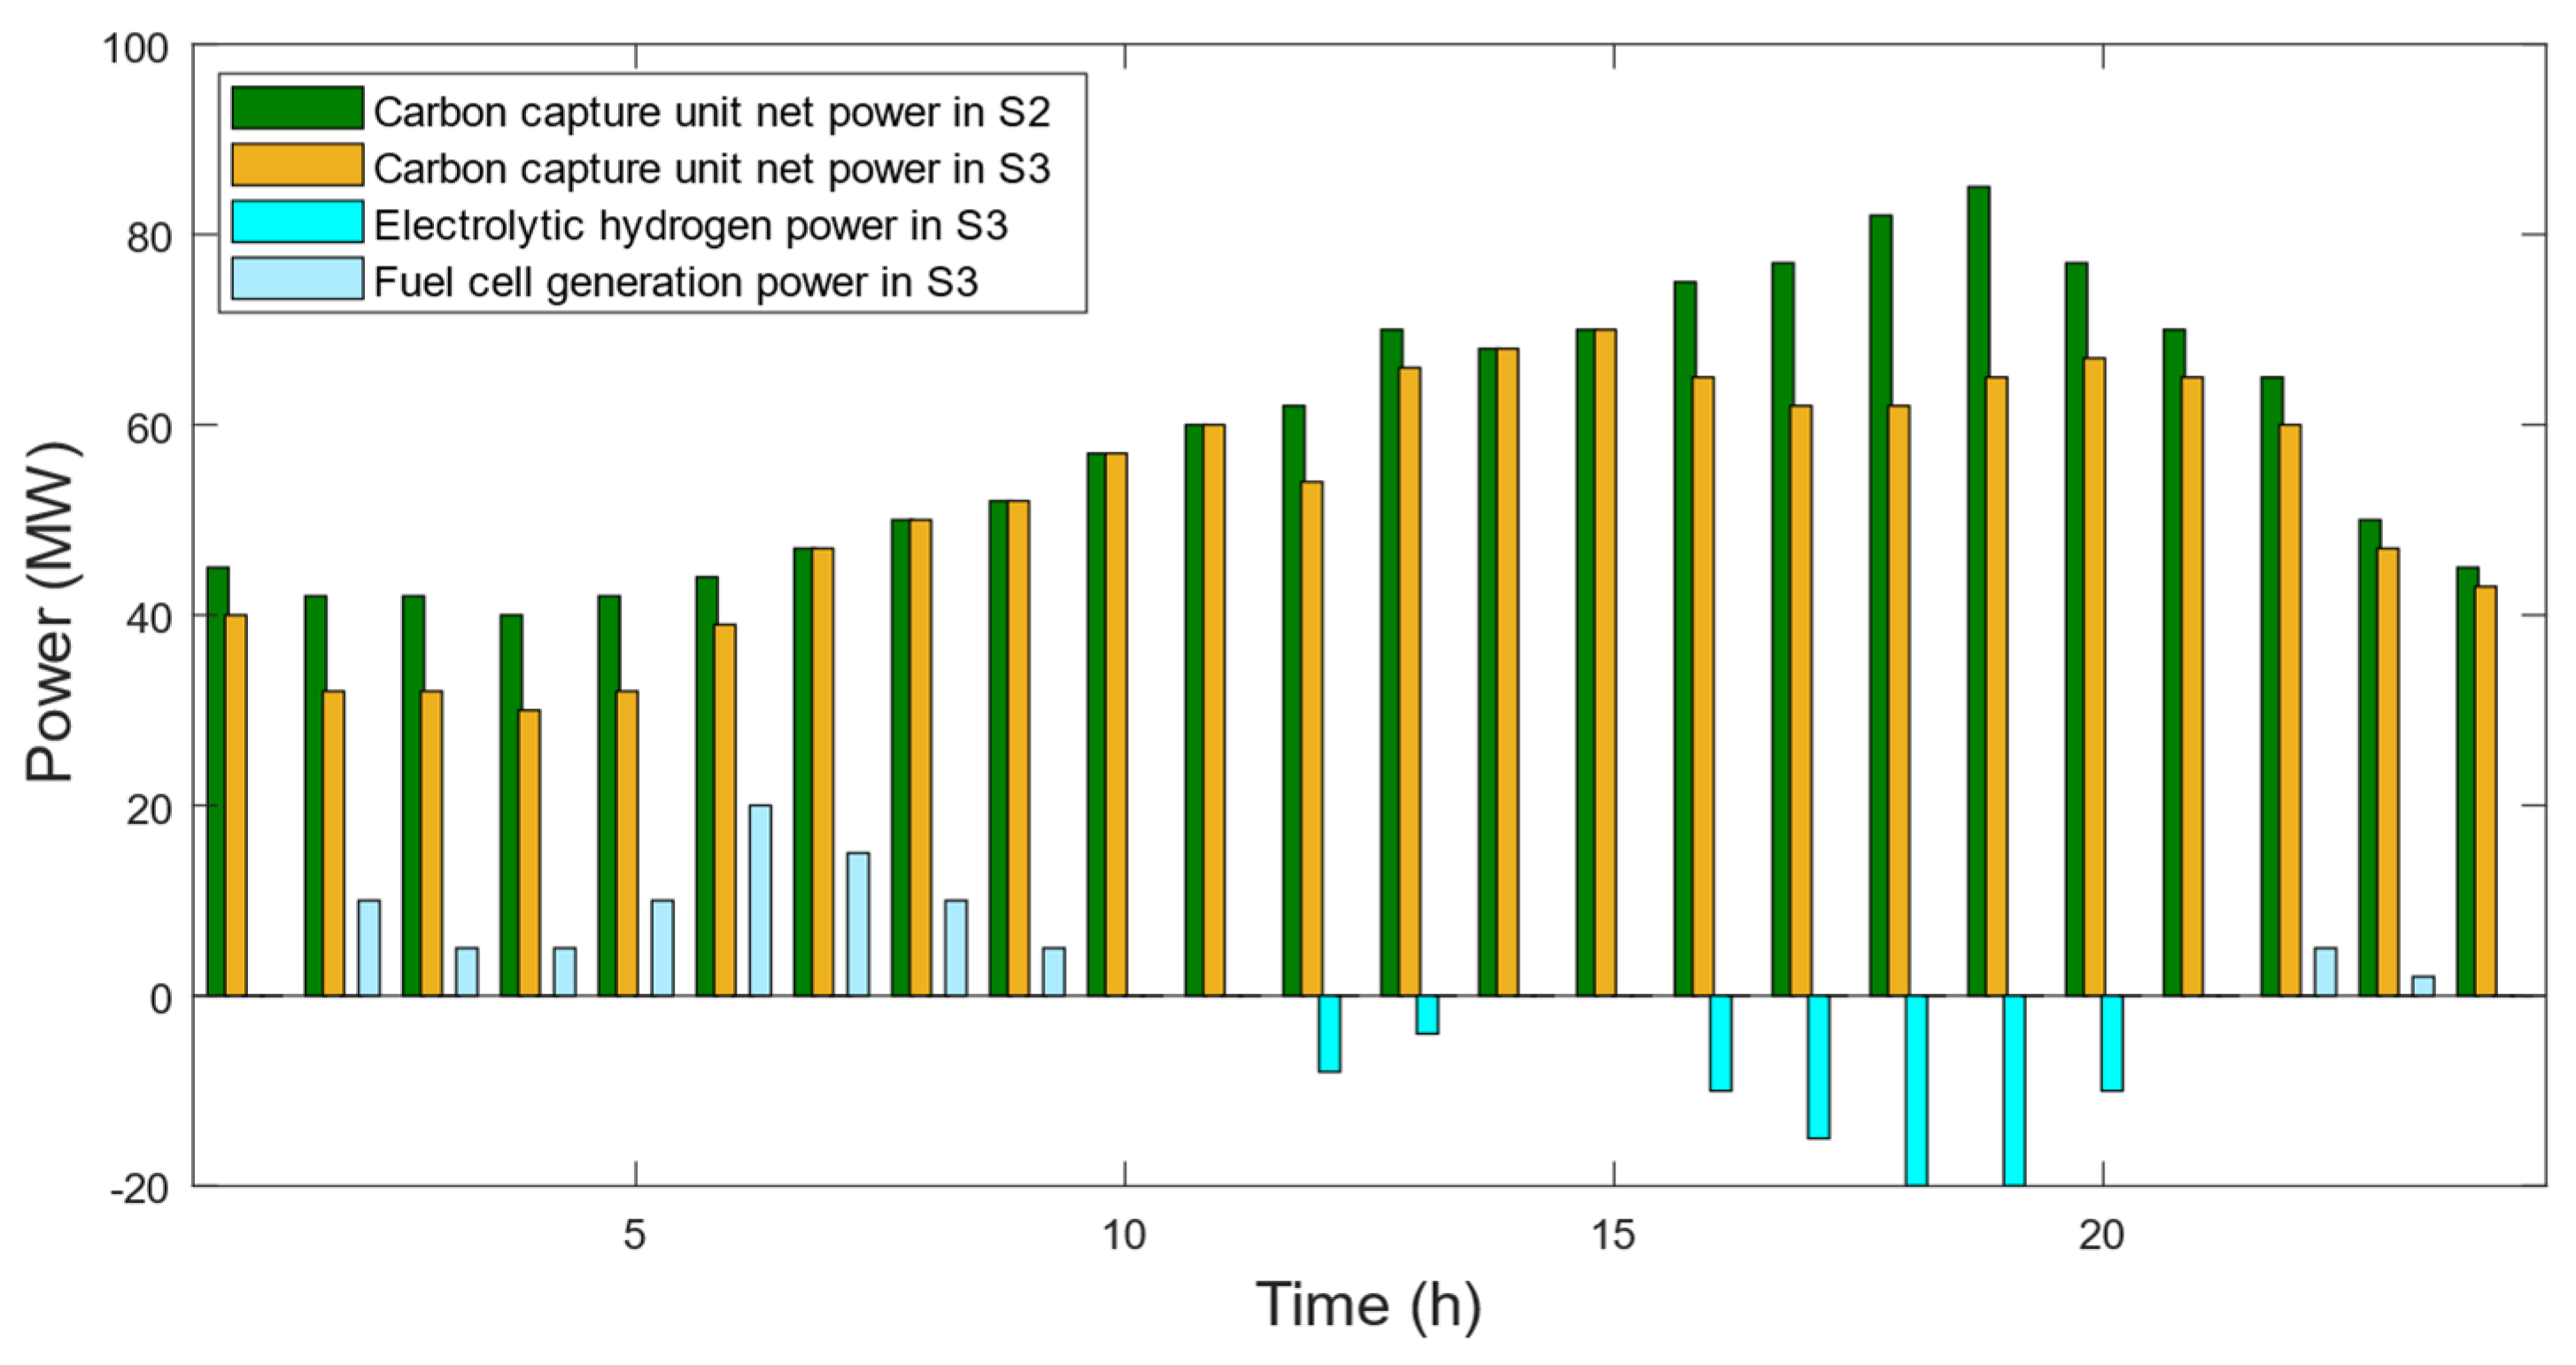
- S3: The hydrogen storage system is considered on the basis of S2, but only its energy time-shift characteristics are considered.
- (4)
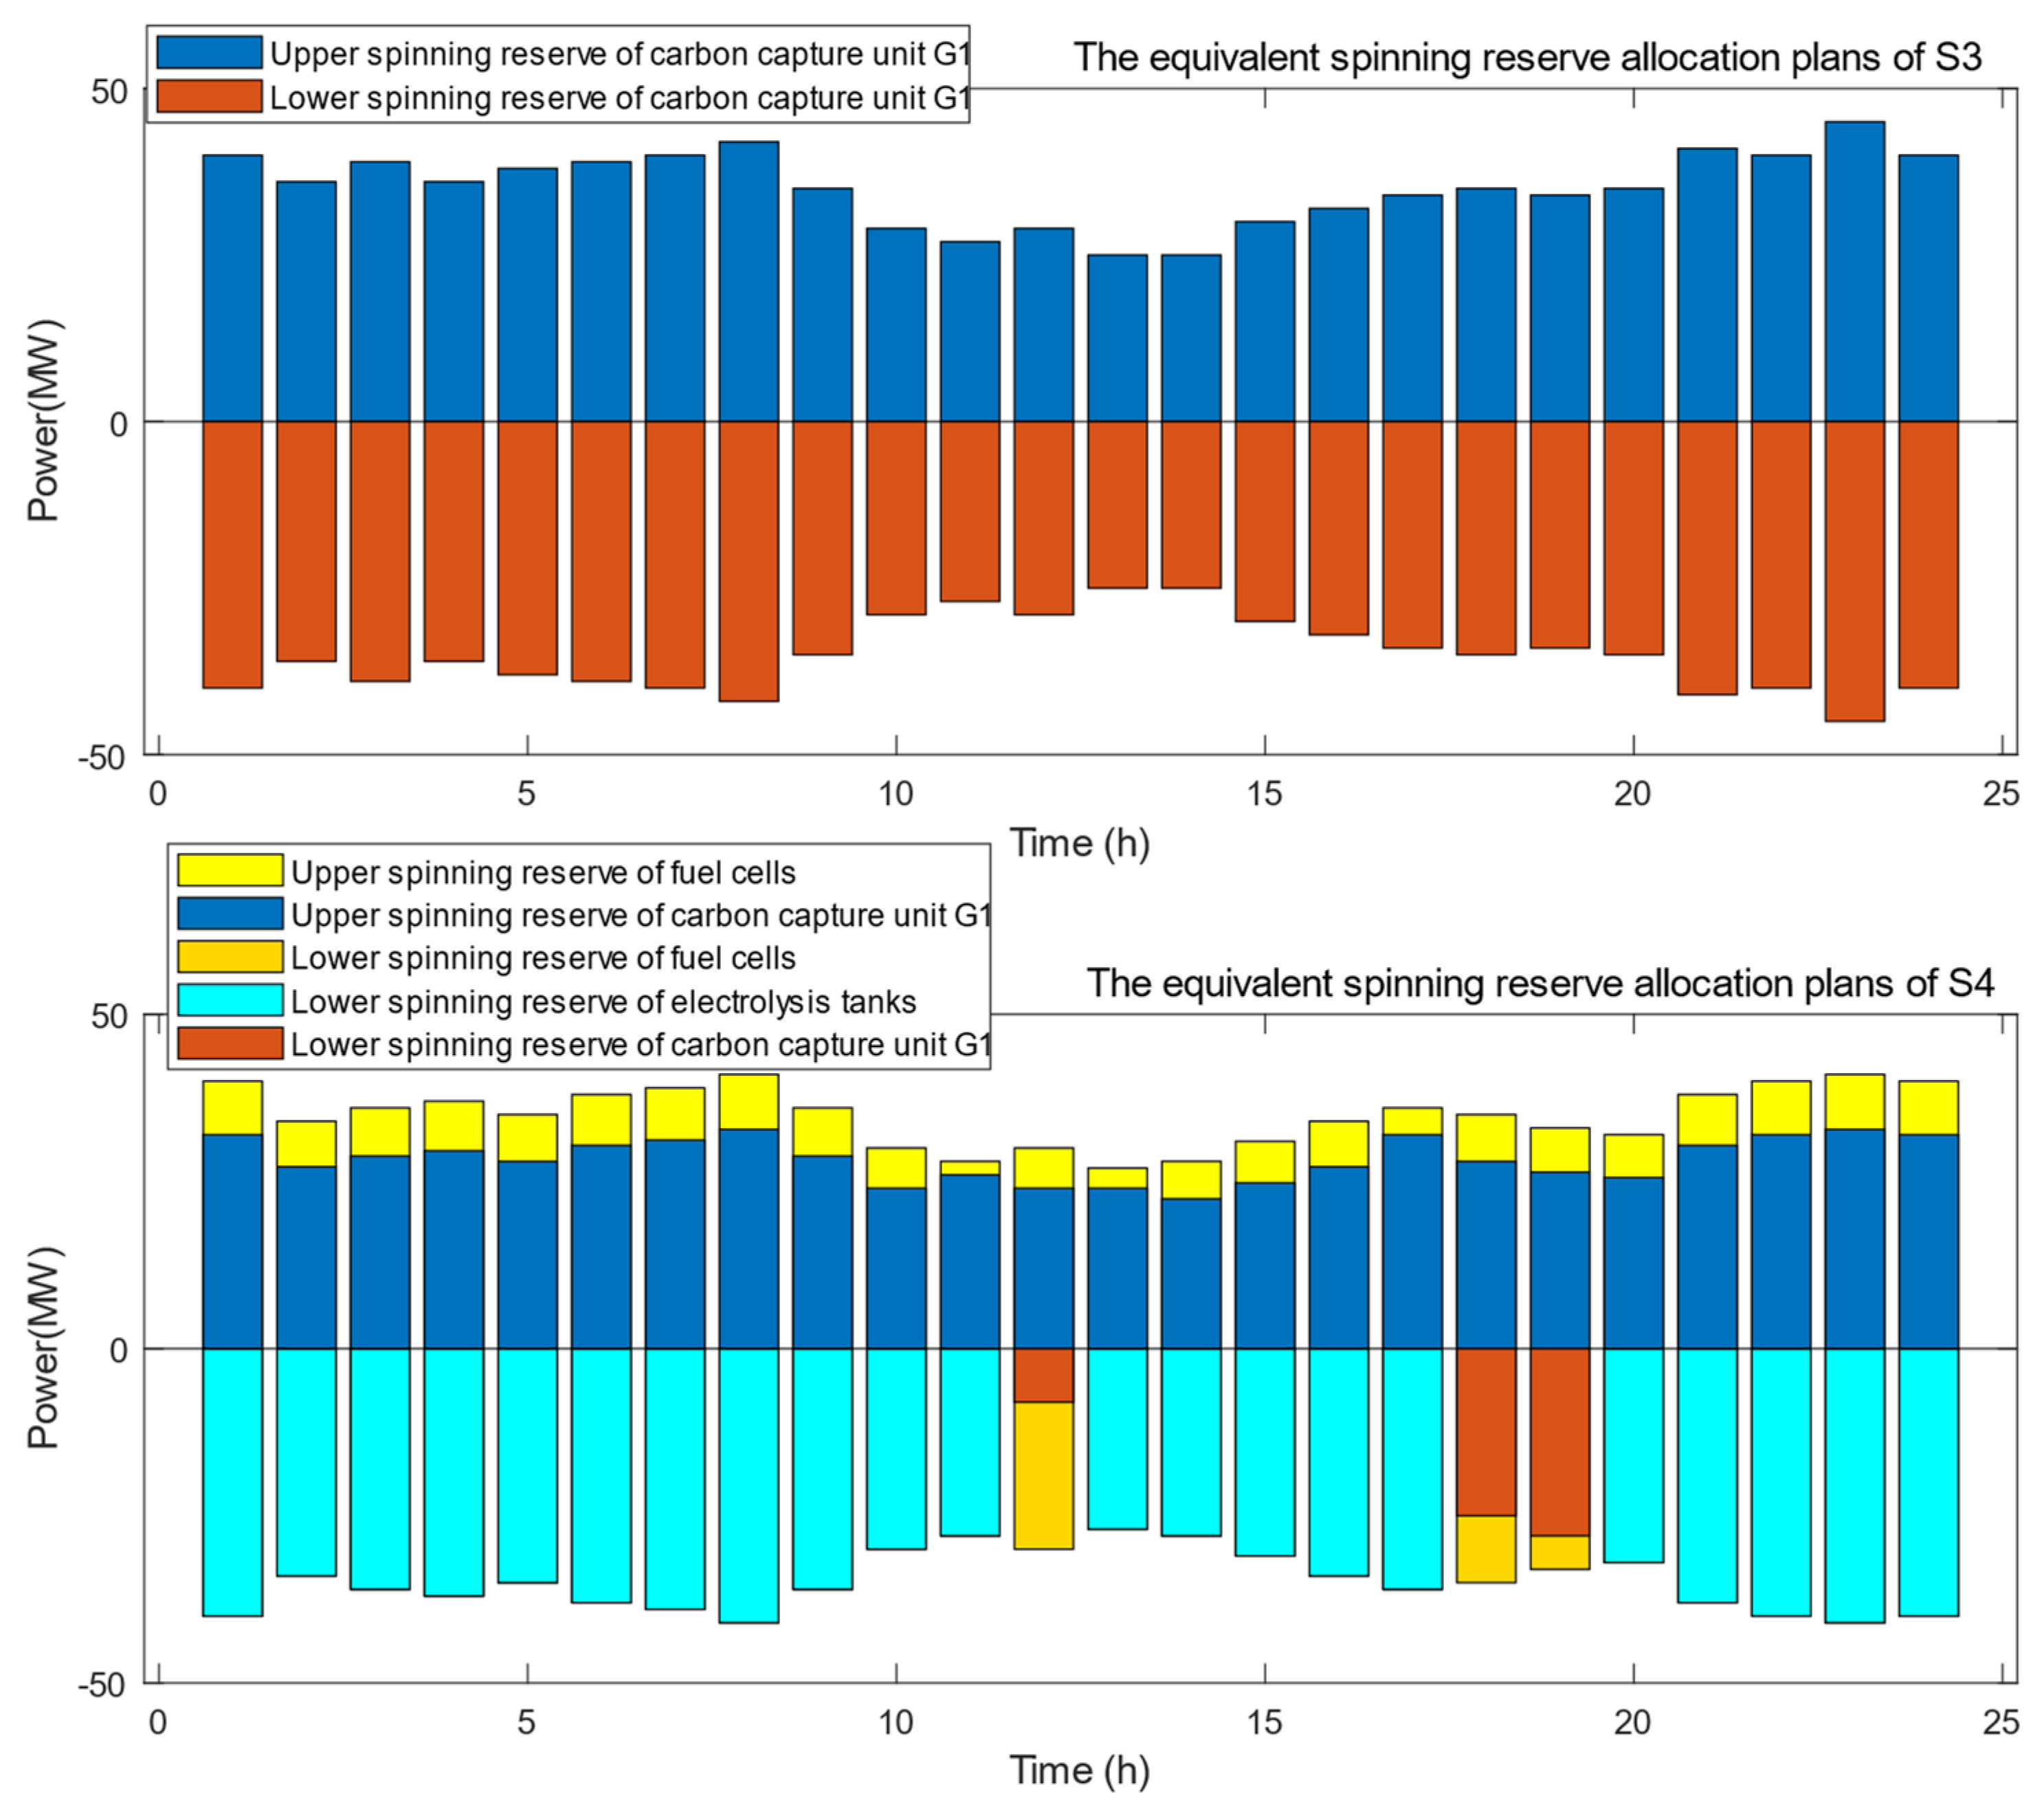
- S4: The equivalent spinning reserve characteristics of HSS are considered on the basis of S3.
- (5)
- S5: The load DSR is considered on the basis of S4.
5.2. Comparison Results of Optimal Economic Scheduling Model under Different Scenarios
5.2.1. Comparative Analysis of Conventional Units Output under Different Scenarios
5.2.2. Comparative Analysis of Power Generation from HSS under Different Scenarios
5.2.3. Comparative Analysis of Scheduling Results under Different Scenarios
5.3. Coordinated Operation Characteristics Analysis of FCCS and HSS
5.3.1. The Equivalent Spinning Reserve Characteristics Analysis of FCCS and HSS under Different Scenarios
5.3.2. Time-Shift Characteristics Analysis of FCCS and HSS under Different Scenarios
5.4. Comparison Results for a High Percentage of RE Penetration Rate
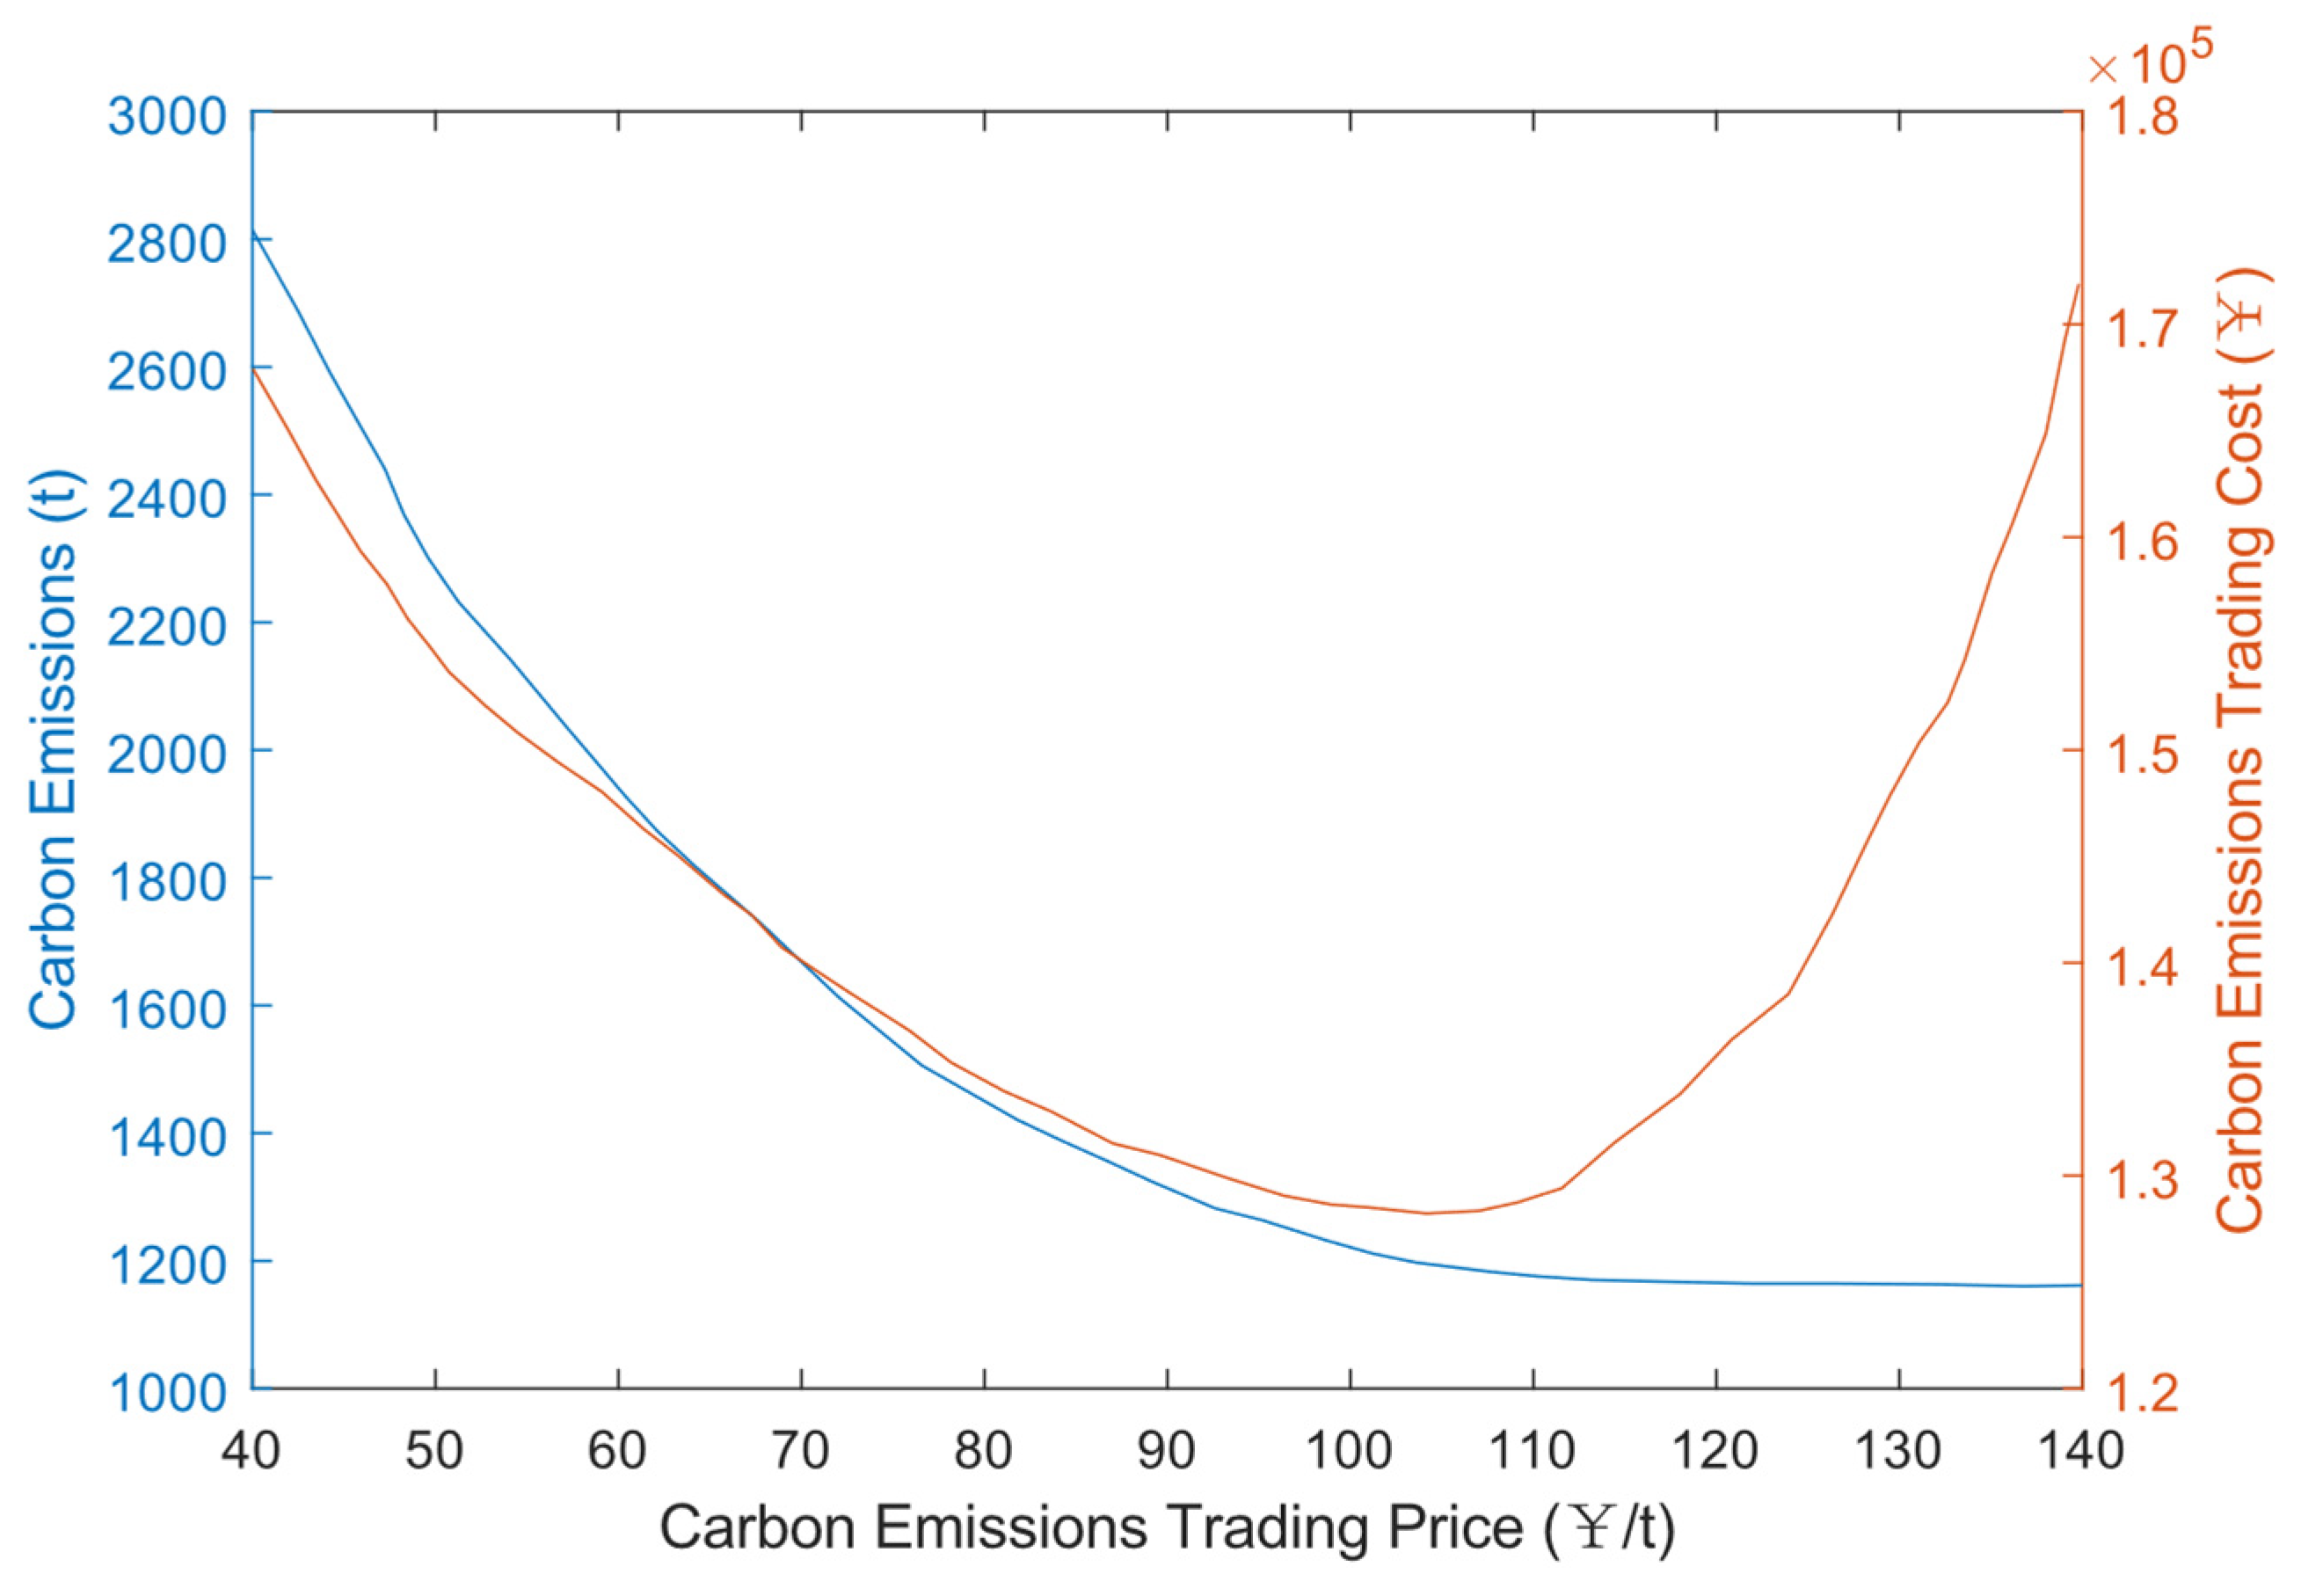
5.5. Impact Analysis of Carbon Emissions Trading Price on Carbon Emissions and Scheduling Results
5.6. Other Index Sensitivity Analysis of Source-Storage-Load Flexible Scheduling Strategy under Different Scenarios
6. Conclusions and Future Work
6.1. Conclusions
- The introduction of the source-side carbon capture unit (S2) reduces the carbon dioxide emissions in the traditional scenario system by 1425 t. Meanwhile, due to the storage tank, carbon capture and carbon emissions can be decoupled and operated, and the new energy grid-connected quantity increases by 90.4 MWh, while the total cost is reduced by 11.44%.
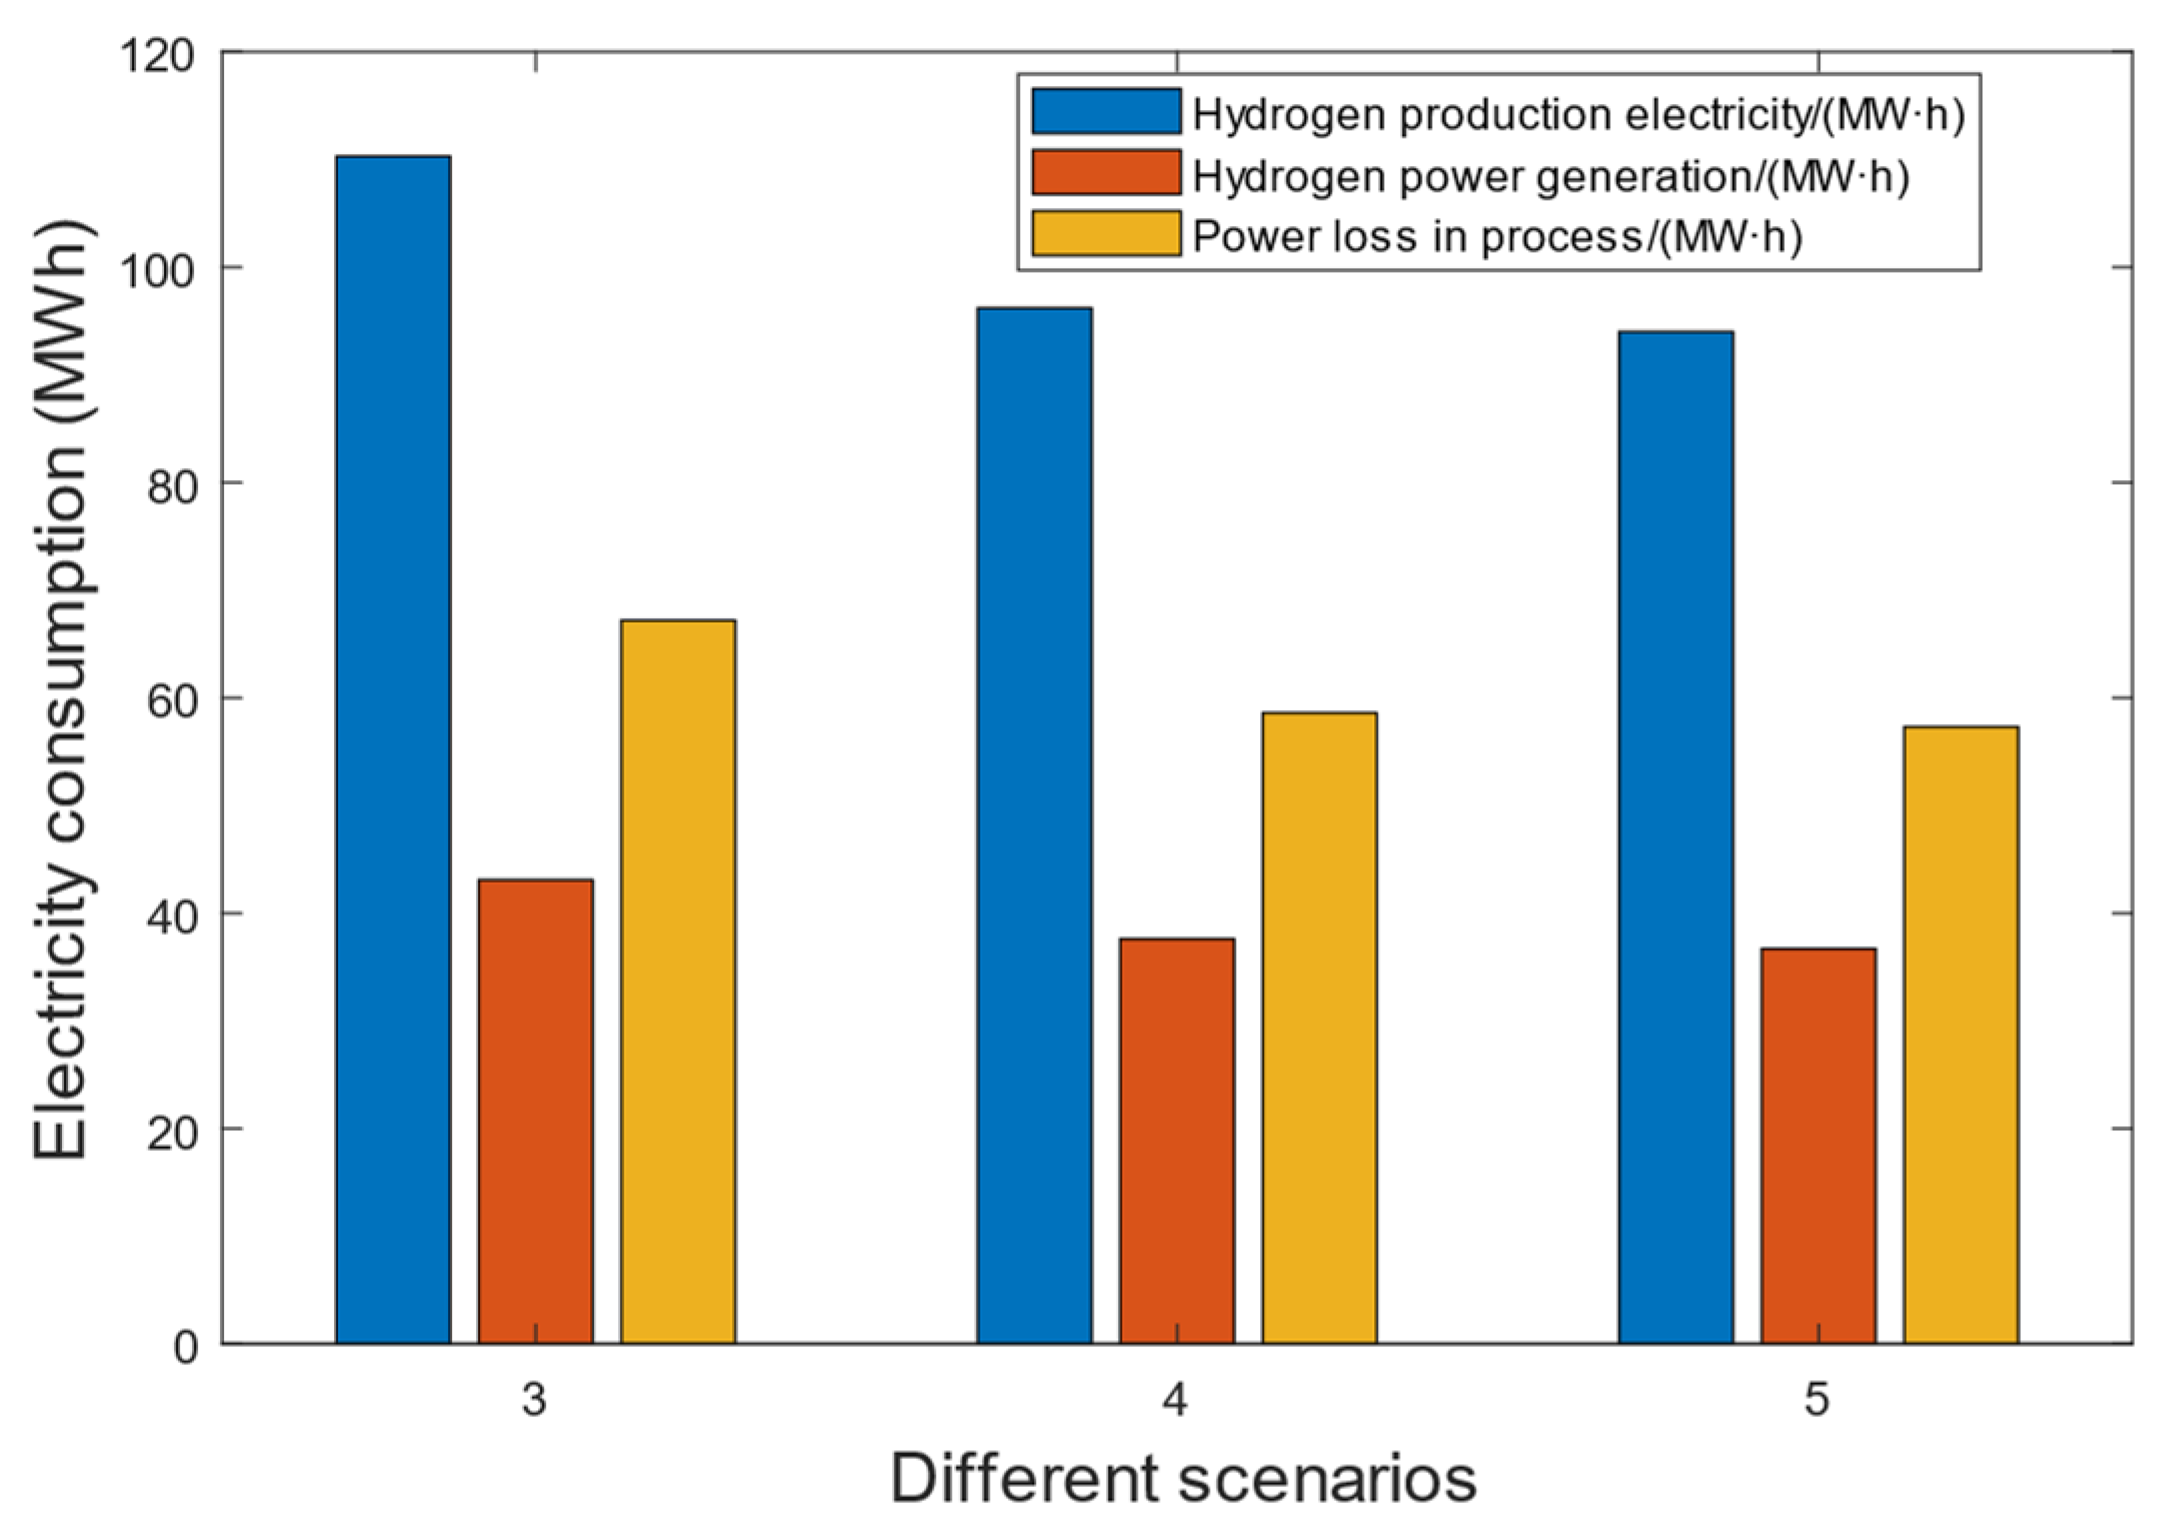
- The coordinated operation of the carbon capture unit with a hydrogen storage system increases the range of regulation of the carbon capture unit for spinning reserve requirements. It also reduces the power loss in the hydrogen storage energy time-shift by 29.22%. The efficiency of energy utilization is improved, and the amount of renewable energy forgone is significantly reduced by 96.3 MWh. In addition, the reserve cost of the hydrogen energy storage system is lower than that of the thermal power unit. Compared with S3, the reserve cost is reduced by 16.78%, and the total cost is reduced by $5317.30.
- The coordinated scheduling of source, load, and storage after considering the demand response mechanism can further improve the low-carbon and economic operation of the system. Simultaneously, with the increasing scale of RE installations, source-load-storage cooperative scheduling has more advantages in terms of economy and RE consumption.
- In addition, when the CST price is maintained at 110 ¥/t, the total carbon emission cost of the system is minimized. The CST price can be used as a weight to balance the economic and low-carbon features of the system, in order to maintain a low-carbon economy and sustainable operation of the system.
6.2. Limitations and Future Work
- This study does not consider the impact of hydrogen storage efficiency improvement on the optimal scheduling results after upgrading the hydrogen storage technology. Hydrogen production technology and FC power generation technology may make significant breakthroughs in HSS. Future work can focus on a simulation analysis of the optimal scheduling results after hydrogen storage system efficiency is improved.
- This study has not explored the optimal capacity allocation for HSS. The next step is to study the optimal capacity calculation method of HSS under the optimal economic scheduling model, and analyze the impact of different installed capacities of hydrogen storage on the scheduling results [32].
- This study takes the lowest operating cost as the objective function, and does not consider the influence of investment cost and expected return in the range of the entire life cycle cost. The next step is to analyze the optimal economic scheduling results with maximizing the revenue from “wind-solar-thermal-storage” bundled operations [33].
Author Contributions
Funding
Data Availability Statement
Conflicts of Interest
Nomenclature
| HSS | hydrogen storage systems | ΔPL,t and Δct | the power and tariff changes after the implementation of DSR |
| FCCS | flexible carbon capture systems | PHC,max and PHC,min | the maximum and minimum output power for conventional thermal part of carbon capture units |
| DSR | demand side response | δmax | the maximum flue gas diversion ratio |
| RE | renewable energy | UC,t | the FCCS start-stop state |
| EC | electrolytic cell | PC,t,up and PC,t,down | the FCCS maximum and minimum reserve capacity |
| HST | hydrogen storage tank | RC,up and RC,down | the FCCS maximum and minimum climbing rates |
| FC | fuel cell | Δt | the scheduling time interval |
| Pel,t and PelH,t | input and output power of the EC | PeL,t,up and PeL,t,down | the EC maximum and minimum reserve capacity |
| ηel | EC efficiency | φC,t | the EC start-stop state |
| EHSS,t | HST energy stored | Pfc,t,up and Pfc,t,down | the FC maximum and minimum reserve capacity |
| PfcH,t and Pfc,t | the FC input and output power | ψC,t | the FC start-stop state |
| ηfc | the FC efficiency | PC,t,up* and PC,t,down* | the maximum and minimum reserve capacity of carbon capture units after the reserve of hydrogen storage |
| EHSS,0 and EHSS,T | the initial and final HST hydrogen capacity | ΔPJ1, ΔPJ2 and ΔPJ3 | the net output adjustment ranges of conventional units, FCCS, and FCCS after the reserve of HSS under the spinning reserve demand |
| EHSS,min and EHSS,max | the minimum and maximum HST hydrogen capacity limits | T | the scheduling cycle |
| Pel,tmax | the maximum input power of the EC | N | the number of conventional units |
| Pfc,tmax | the maximum output power of the FC | Pthn,t | the electricity generated by the n-th conventional unit at time t |
| Pel,N and Pfc,N | the rated power of the EC and FC | ccoal | the price of coal per unit weight |
| PFC,t | the FCCS total power in the flexible operation mode | anP2thn,t+ bnPthn,t+ cn | the coal consumption function |
| PJC,t | the FCCS net output power | Un, | the n-th unit start-stop status |
| Pr,t | the FCCS operating power consumption | csn | the start-stop cost |
| PD | fixed consumption of the carbon storage system | M | the equipment collection of providing spinning reserve capacity |
| λ | the unit set CO2 captured power | cupk and cdownk | the maximum and minimum reserve cost factors for the k-th equipment |
| EJC,t | the captured CO2 capacity | Pk,t,up and Pk,t,down | the maximum and minimum reserve provided by the k-th equipment at time t |
| η | the CO2 captured efficiency | cct | carbon trading prices |
| δt | the flue gas split ratio at time t | Etotal | total carbon emissions |
| EC,t | the FCCS captured CO2 capacity | α | the carbon trading quota |
| EV,t | the CO2 capacity supplied by the storage tank | csc | the MEA solvent cost factor |
| α | the emission factor required by the emission policy | ηsc | the MEA solvent operating loss factor |
| Vv,t | the MEA solution volume | cel and cfc | the coefficients of operation and maintenance costs for EC and FC |
| MV and MCO2 | the MEA solution and CO2 molar mass | Prq,t | the RE abandoned power |
| θ | the MEA resolution | cr | the RE abandoned cost coefficient |
| ρV and δV | the MEA solution concentration and density | τ | he price growth |
| PDSR,P, PDSR,F and PDSR,V | the load power in peak, flat, and valley hours after the implementation of DSR | d | the interval of the step carbon emission cost |
| PL,P, PL,F and PL,V | the peak, flat and valley power before the implementation of DSR | x | the scheduling plan |
| K | the elasticity matrix of tariff demand | and | the optimal solutions of a single sub-objective function |
| ΔcP, ΔcF and ΔcV | the tariff changes in peak, flat, and valley hours before and after the implementation of DSR | Pthn,max and Pthn,min | the maximum and minimum output limits |
| cA | the fixed tariff before DSR | Pre,tpre | the forecasted RE generation |
| P, F and V | the load period in the peak, flat and valley hours | Pre,t | the actual grid-connected power from RE source |
| kP,P, kF,F and kV,V | the coefficient of self-elasticity | PDSR,t | load power after demand side response |
| PL,t and cA,t | the power and tariff before the implementation of DSR | σ | the confidence coefficient required by the system reserve constraint |
References
- Mostafaeipour, A.; Bidokhti, A.; Fakhrzad, M.-B.; Sadegheih, A.; Mehrjerdi, Y.Z. A new model for the use of renewable electricity to reduce carbon dioxide emissions. Energy 2022, 238, 121602. [Google Scholar] [CrossRef]
- National Energy Administration. National Energy Bureau Releases 2023 National Electric Power Industry Statistics [EB/OL]. Available online: http://www.nea.gov.cn/2023-01/18/c_1310691509.htm (accessed on 18 January 2023).
- Mallapaty, S. How China could be carbon neutral by mid-century. Nature 2020, 586, 482–483. [Google Scholar] [CrossRef]
- Huang, W.; Zhang, B.; Ge, L.; He, J.; Liao, W.; Ma, P. Day-ahead optimal scheduling strategy for electrolytic water to hydrogen production in zero-carbon parks type microgrid for optimal utilization of electrolyzer. Energy Storage 2023, 68, 107653. [Google Scholar] [CrossRef]
- Shafiullah, G.; Oo, A.M.; Ali, A.S.; Wolfs, P. Potential challenges of integrating large-scale wind energy into the power grid—A review. Renew. Sustain. Energy Rev. 2013, 20, 306–321. [Google Scholar] [CrossRef]
- Abdilahi, A.M.; Mustafa, M.W.; Abujarad, S.Y.; Mustapha, M. Harnessing flexibility potential of flexible carbon capture power plants for future low carbon power systems. Renew. Sustain. Energy Rev. 2018, 81, 3101–3110. [Google Scholar] [CrossRef]
- Wilberforce, T.; Baroutaji, A.; Soudan, B.; Al-Alami, A.H.; Olabi, A.G. Outlook of carbon capture technology and challenges. Sci. Total Environ. 2019, 657, 56–72. [Google Scholar] [CrossRef] [PubMed]
- Ji, Z.; Kang, C.; Chen, Q.; Xia, Q.; Jiang, C.; Chen, Z.; Xin, J. Low-carbon power system dispatch incorporating carbon capture power plants. IEEE Trans. Power Syst. 2013, 28, 4615–4623. [Google Scholar] [CrossRef]
- Cui, Y.; Zeng, P.; Hui, X. Low-carbon economic dispatch considering the integrated flexible operation mode of carbon capture power plant. Power Syst. Technol. 2021, 45, 1877–1886. [Google Scholar]
- Ouyang, T.; Xie, S.; Pan, M.; Qin, P. Peak-shaving scheme for coal-fired power plant integrating flexible carbon capture and wastewater treatment. Energy Convers. Manag. 2022, 256, 115377. [Google Scholar] [CrossRef]
- Wang, S.; Wang, S.; Zhao, Q.; Dong, S.; Li, H. Optimal dispatch of integrated energy station considering carbon capture and hydrogen demand. Energy 2023, 269, 126981. [Google Scholar] [CrossRef]
- He, L.; Lu, Z.; Zhang, J.; Geng, L.; Zhao, H.; Li, X. Low-carbon economic dis patch for electricity and natural gas systems considering carbon capture systems and power-to-gas. Appl. Energy 2018, 224, 357–370. [Google Scholar] [CrossRef]
- Deng, J.; Jiang, F.; Wang, W.; He, G.; Zhang, X.; Liu, K. Low-carbon optimized operation of integrated energy system considering electric heating flexible load and hydrogen energy refined modeling. Power Syst. Technol. 2022, 46, 1692–1704. [Google Scholar]
- He, K.; Zeng, L.; Yang, J.; Gong, Y.; Zhang, Z.; Chen, K. Optimization strategy for low-carbon economy of integrated energy system considering carbon capture-two stage power-to-gas hydrogen coupling. Energies 2024, 17, 3205. [Google Scholar] [CrossRef]
- Wang, S.B.; Kong, L.G.; Cai, G.W.; Yan, H.; Han, Z.; Liu, C.; Wan, Y.; Yang, S.; Wang, X. Current status, challenges, and prospects of key application technologies for hydrogen storage in power system. China J. Electr. Eng. 2023, 43, 6660–6680. [Google Scholar] [CrossRef]
- Zsiborács, H.; Pintér, G.; Baranyai, N.H.; Vincze, A. Production of hydrogen and methanol from mixed plastic waste: Potential for the European Union. MRS Energy Sustain. 2024, 1, 192–204. [Google Scholar] [CrossRef]
- Wu, C.; Williams, P.T. Hydrogen from waste plastics by way of pyrolysis-gasification. Proc. Inst. Civ. Eng.-Waste Resour. Manag. 2014, 167, 35–46. [Google Scholar] [CrossRef]
- Yue, M.; Lambert, H.; Pahon, E.; Roche, R.; Jemei, S.; Hissel, D. Hydrogen energy systems: A critical review of technologies, applications, trends and challenges. Renew. Sustain. Energy Rev. 2021, 146, 111180. [Google Scholar] [CrossRef]
- Wang, W.; Jiang, F.; Zhang, X.; Li, Z.; Guo, Q.; He, G. Low-carbon and flexible dispatch of high-proportion wind-photovoltaic multi-energy system with comprehensive utilization of large-scale hydrogen energy. Power Syst. Technol. 2023, 48, 197–211. [Google Scholar] [CrossRef]
- Wang, J.; Yin, X.; Liu, Y.; Cai, W. Optimal design of combined operations of wind power-pumped storage-hydrogen energy storage based on deep learning. Electr. Power Syst. Res. 2023, 218, 109216. [Google Scholar] [CrossRef]
- Ahmad, M.S.; Ali, M.S.; Abd, R.N. Hydrogen energy vision 2060: Hydrogen as energy carrier in Malaysian primary energy mix–developing P2G case. Energy Strategy Rev. 2023, 35, 100632. [Google Scholar] [CrossRef]
- Yang, J.; Zeng, L.; He, K.; Gong, Y.; Zhang, Z.; Chen, K. Optimization of the joint operation of an electricity-heat-hydrogen-gas multi-energy system containing hybrid energy storage and power-to-gas-combined heat and power. Energies 2024, 17, 3144. [Google Scholar] [CrossRef]
- Nguyen, D.H.; Chapman, A.; Tsuji, T. Assessing the Optimal Contributions of Renewable and Carbon Capture and Storage toward Carbon Neutrality by 2050. Sustainability 2023, 15, 13447. [Google Scholar] [CrossRef]
- Pan, L.; Xu, X.; Liu, J.; Hu, W. Adaptive robust scheduling of a hydro/photovoltaic/pumped-storage hybrid system in day-ahead electricity and hydrogen markets. Sustain. Cities Soc. 2023, 95, 104571. [Google Scholar] [CrossRef]
- Bie, Z.; Hu, G.; Xie, H.; Li, G. Optimal dispatch for wind power integrated systems considering demand response. Autom. Electr. Power Syst. 2014, 38, 115–120+159. [Google Scholar]
- Hui, H.; Junyi, T.; Yifan, W. Long-time-scale charging and discharging scheduling of electric vehicles under joint price and incentive demand response. Autom. Electr. Power Syst. 2022, 46, 46–55. [Google Scholar]
- Bao, Y.; Wang, B.; Li, Y.; Yang, S. Rolling dispatch model considering wind penetration and multi-scale demand response resources. Proc. CSEE 2016, 36, 4589–4599. [Google Scholar]
- Duan, P.; Feng, M.; Zhao, B.; Xue, Q.; Li, K.; Chen, J. Operational Optimization of Regional Integrated Energy Systems with Heat Pumps and Hydrogen Renewable Energy under Integrated Demand Response. Sustainability 2024, 16, 1217. [Google Scholar] [CrossRef]
- Huang, W.; Luo, J.; Ge, L.; He, J.; He, Z.; Wang, X. Consider a generalized economic dispatch strategy combining flexible carbon capture power plants and pumped storage. China J. Electr. Eng. 2023, 44, 1430–1446. [Google Scholar]
- Sánchez-Sáinz, H.; García-Vázquez, C.A.; Llorens Iborra, F.; Fernández-Ramírez, L.M. Methodology for the Optimal Design of a Hybrid Charging Station of Electric and Fuel Cell Vehicles Supplied by Renewable Energies and an Energy Storage System. Sustainability 2019, 11, 5743. [Google Scholar] [CrossRef]
- IEEE Committee. Power Systems Test Case Archive [EB/OL]. Available online: http://labs.ece.uw.edu/pstca (accessed on 25 January 2024).
- Cui, Y.; An, N.; Fu, X.; Zhao, Y.; Zhong, W. Low-carbon economic dispatch of power system considering joint peak shaving of generalized energy storage and carbon capture equipment. Electr. Power Autom. Equip. 2023, 43, 40–48. [Google Scholar]
- Wang, S.C.; Sun, W.Q. Capacity Value Assessment for a Combined Power Plant System of New Energy and Energy Storage Based on Robust Scheduling Rules. Sustainability 2023, 15, 15327. [Google Scholar] [CrossRef]



| Time | Load Status | Tariff |
|---|---|---|
| 11:00–14:00, 17:00–19:00 | Peak | 0.186 ($/kWh) |
| 08:00–11:00, 14:00–17:00, 19:00–22:00 | Flat | 0.124 ($/kWh) |
| 0:00–08:00, 22:00–24:00 | Valley | 0.072 ($/kWh) |
| Parameters | Values |
|---|---|
| EC efficiency ηel/% | 65 |
| FC efficiency ηfc/% | 60 |
| Minimum capacity limit of HSS in HST EHSS,min/MWh | 30 |
| Maximum capacity limit of HSS in HST EHSS,max/MWh | 170 |
| Maintenance cost for EC cel/($/MWh) | 5 |
| Maintenance cost for FC cfc/($/MWh) | 25 |
| HST capacity/MWh | 250 |
| EC capacity/MWh | 60 |
| FC output power/MW | 30 |
| Units | G1 | G2 | G3 | G4 | |
|---|---|---|---|---|---|
| Maximum limit output/MW | 180 | 80 | 50 | 30 | |
| Minimum limit output/MW | 45 | 20 | 15 | 10 | |
| Coefficients of coal consumption function | an | 0.04 | 0.18 | 0.63 | 0.9 |
| bn | 20 | 18.2 | 10.7 | 32.8 | |
| cn | 386 | 366 | 348 | 331 | |
| Climbing speed/(MW/min) | 3.7 | 1.8 | 1 | 0.7 | |
| Carbon emission intensity/(t/MWh) | 0.99 | 0.98 | 0.96 | 1.13 | |
| Parameters | Values | Parameters | Values |
|---|---|---|---|
| Power consumption per unit of CO2 captured λ/(MWh/t) | 0.287 | Density of MEA solution δV/(g/mol) | 1.01 |
| Carbon capture efficiency η/% | 88 | Concentration of MEA solution ρV/% | 30 |
| Carbon emission factor per unit of generation power α | 30 | Regeneration tower resolution θ/(mol) | 0.24 |
| Price of coal per unit weight ccoal/($/t) | 127 | Molar mass of MEA solution MV | 61.08 |
| Carbon trading quota α | 0.7 | Molar mass of CO2 MCO2 | 44 |
| Carbon trading price cct ($/t) | 15.4 | Output power of FC/MW | 30 |
| RE abandoned cost coefficient ($/kWh) | 0.06 | Upper reserve cost of EC ($/MW) | 0 |
| Maximum reserve cost ($/MW) | 16.8 | Lower reserve cost of EC ($/MW) | 4 |
| Minimum reserve cost ($/MW) | 17 | Upper reserve cost of FC ($/MW) | 14.7 |
| Lower reserve cost of FC ($/MW) | 0 |
| Different Scenarios | S3 | S4 | S5 |
|---|---|---|---|
| Hydrogen production electricity/(MW·h) | 110.3 | 96.2 | 94 |
| Hydrogen power generation/(MW·h) | 43.1 | 37.6 | 36.7 |
| Power loss in process/(MW·h) | 67.2 | 58.6 | 57.3 |
| Cost Index | Different Scenarios | ||||
|---|---|---|---|---|---|
| S1 | S2 | S3 | S4 | S5 | |
| Thermal power unit generation cost F1 ($) | 108,237.6 | 114,234.9 | 110,386.7 | 109,524.5 | 110,826.7 |
| Thermal power unit start-stop cost F2 ($) | 3311.6 | 3487.2 | 3457.9 | 3341.7 | 2507.4 |
| Spinning reserve cost F3 ($) | 28,075.7 | 29,384.1 | 29,001.9 | 24,136.9 | 23,098.7 |
| Thermal power unit carbon trading cost F4 ($) | 10,247 | −13,254.7 | −11,368 | −10,157.6 | −13,985.6 |
| Carbon capture unit solution loss cost F5 ($) | 0 | 2863.1 | 2786.4 | 2725.9 | 2887.5 |
| Hydrogen storage operation and maintenance cost F6 ($) | 0 | 0 | 1509 | 1134 | 1257 |
| Total electricity loss cost F7 ($) | 11,258.6 | 5984.7 | 4236.8 | 3988.1 | 3876.5 |
| Carbon emission (t) | 2556 | 1131 | 1108 | 1121 | 1059 |
| RE abandoned electricity (MWh) | 186.7 | 96.3 | 0 | 0 | 0 |
| Total cost ($) | 161,130.5 | 142,699.3 | 140,010.7 | 134,693.5 | 130,468.2 |
| Different RE Penetration Rates | Different Scenarios | |||||
|---|---|---|---|---|---|---|
| S1 | S2 | S3 | S4 | S5 | ||
| 50% | Total cost ($) | 161,130.5 | 142,699.3 | 140,010.7 | 134,693.5 | 130,468.2 |
| RE consumption (MWh) | 2432.8 | 2926.7 | 2975.8 | 2998.7 | 3021.1 | |
| 55% | Total cost ($) | 163,458.7 | 141,358.9 | 138,857.6 | 132,367.9 | 128,123.7 |
| RE consumption (MWh) | 2432.8 | 3061.1 | 3126.9 | 3157.2 | 3198.6 | |
| 60% | Total cost ($) | 165,741.5 | 140,069.8 | 137,736.9 | 130,158.9 | 126,108.9 |
| RE consumption (MWh) | 2432.8 | 3199.8 | 3287.4 | 3308.7 | 3357.4 | |
| 65% | Total cost ($) | 169,057.9 | 140,786.8 | 138,258.8 | 128,842.7 | 125,075.9 |
| RE consumption (MWh) | 2432.8 | 3241.7 | 3324.1 | 3427.4 | 3458.9 | |
| 70% | Total cost ($) | 171,032 | 141,864.8 | 139,348.5 | 127,815.8 | 124,358.8 |
| RE consumption (MWh) | 2432.8 | 3241.7 | 3324.1 | 3598.4 | 3621.1 | |
| Models | Comparison Results | |||
|---|---|---|---|---|
| CET Cost/¥ | Carbon Emissions/t | System Operation Cost/¥ | Total Cost/¥ | |
| Model 1 | - | 2556 | 837,564.2 | 837,564.2 |
| Model 2 | 116,490 | 1059 | 796,787.4 | 913,277.4 |
| Index | Different Scenarios | ||||
|---|---|---|---|---|---|
| S1 | S2 | S3 | S4 | S5 | |
| EENS (MWh) | 7.44 | 7.76 | 8.01 | 7.56 | 7.24 |
| THD (%) | 0.58 | 0.61 | 0.64 | 0.64 | 0.66 |
| Aggregated voltage deviation rate (%) | 1.13 | 1.19 | 1.24 | 1.23 | 1.23 |
| Load balance rate (%) | 98.24 | 99.61 | 99.68 | 99.62 | 98.76 |
Disclaimer/Publisher’s Note: The statements, opinions and data contained in all publications are solely those of the individual author(s) and contributor(s) and not of MDPI and/or the editor(s). MDPI and/or the editor(s) disclaim responsibility for any injury to people or property resulting from any ideas, methods, instructions or products referred to in the content. |
© 2024 by the authors. Licensee MDPI, Basel, Switzerland. This article is an open access article distributed under the terms and conditions of the Creative Commons Attribution (CC BY) license (https://creativecommons.org/licenses/by/4.0/).
Share and Cite
Zhao, L.; Wang, Z.; Yi, H.; Li, Y.; Wang, X.; Xiao, Y.; Hu, Z.; Zhou, H.; Zhang, X. Source-Storage-Load Flexible Scheduling Strategy Considering Characteristics Complementary of Hydrogen Storage System and Flexible Carbon Capture System. Energies 2024, 17, 3894. https://doi.org/10.3390/en17163894
Zhao L, Wang Z, Yi H, Li Y, Wang X, Xiao Y, Hu Z, Zhou H, Zhang X. Source-Storage-Load Flexible Scheduling Strategy Considering Characteristics Complementary of Hydrogen Storage System and Flexible Carbon Capture System. Energies. 2024; 17(16):3894. https://doi.org/10.3390/en17163894
Chicago/Turabian StyleZhao, Lang, Zhidong Wang, Haiqiong Yi, Yizheng Li, Xueying Wang, Yunpeng Xiao, Zhiyun Hu, Honglian Zhou, and Xinhua Zhang. 2024. "Source-Storage-Load Flexible Scheduling Strategy Considering Characteristics Complementary of Hydrogen Storage System and Flexible Carbon Capture System" Energies 17, no. 16: 3894. https://doi.org/10.3390/en17163894
APA StyleZhao, L., Wang, Z., Yi, H., Li, Y., Wang, X., Xiao, Y., Hu, Z., Zhou, H., & Zhang, X. (2024). Source-Storage-Load Flexible Scheduling Strategy Considering Characteristics Complementary of Hydrogen Storage System and Flexible Carbon Capture System. Energies, 17(16), 3894. https://doi.org/10.3390/en17163894


