Abstract
A large proportion of building energy consumption in tropical countries like Thailand primarily comes from air conditioning systems used to maintain the comfort level of building occupants. This paper aims to evaluate the performance of an alternative cooling system based on the evaporative principle in terms of thermal characteristics and energy consumption. A simulation model using computational fluid dynamics (CFD) software ANSYS version 16.0 and an actual experimental setup at the laboratory level were built to verify the results of the proposed cooling system. Additionally, factors that influence performance, such as components of the building envelope and the building’s orientation, are considered. This research aims to demonstrate the impact of building envelope material and building characteristics on the energy usage in air conditioning systems and to propose an energy-efficient cooling system. The results demonstrate that the proposed cooling system can reduce the temperature inside the building. However, the characteristics of the building also affect the energy performance. Thus, the proposed cooling system, in combination with an efficient envelope material, can achieve energy savings of around 35–43%. Therefore, a combination of the proposed cooling system and optimal building design can ensure comfort for building occupants while saving energy.
1. Introduction
The global demand for electricity keeps increasing. With economic expansion and industrial development, electric power has become an indispensable factor in ensuring the efficient operation of businesses and industries. Electric power production primarily requires fuel. Currently, limited resources such as coal, natural gas, and oil are predominantly used for energy generation, with renewable energy also being utilized to a certain extent [1]. As shown in Figure 1, the average temperature in Thailand from 2017 to 2020 tended to be higher, approximately 38 °C, making the weather generally sultry. Thailand has a tropical climate and is located in Southeast Asia. Due to the high temperatures, there is an increasing demand for electricity for air conditioners. Generally, the demand for electricity is highest from March to May and lowest from November to December. In other words, these months correspond to the summer and winter seasons, respectively.
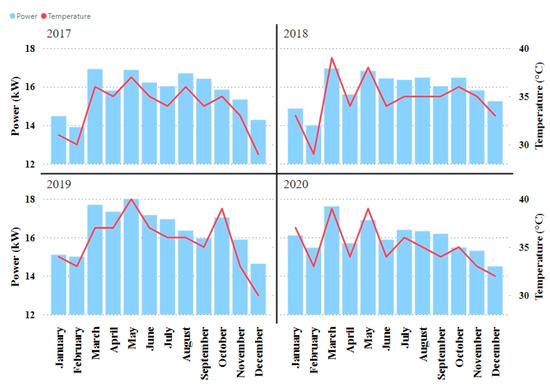
Figure 1.
Relationship between the temperature and peak power demand.
When considering household electricity consumption, air conditioning has become a crucial component in households due to the high temperatures. Figure 2 shows the proportion of household electricity consumption, which was published by the development project of the Department of Alternative Energy Development and Efficiency [2]. The proportion in Figure 2 shows that the air conditioning load accounts for the highest proportion of usage, making up 65% of the total household electricity consumption.
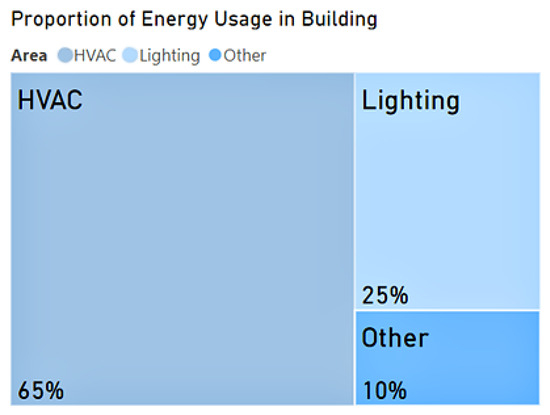
Figure 2.
Proportion of household electricity consumption.
Heating, ventilation, and air conditioning (HVAC) systems are one of the main systems in buildings that require a significant amount of energy depending on the concentration of the room size and number of residents [3]. Control algorithms for HVAC systems have been used to control various functional areas, such as dynamic zones, and to control multi-zone air conditioning systems to ensure efficient operation of air conditioning systems. It is crucial to save up to 20% of the energy in hot and humid conditions when HVAC systems account for more than 40% of the net energy consumption of a building [4]. Therefore, it is necessary to devise ways to reduce the overall power consumption of energy-intensive systems to achieve simultaneous energy efficiency and thermal comfort. The quality of air affects residents’ happiness, breathing comfort, and air purity. Table 1 lists the standard values of air quality. According to the data in Table 1, the condition of human comfort in this study focuses on temperature and relative humidity. Thus, both conditions must be comparable to the standard values [5].

Table 1.
Parameters and standards of air quality.
Evaporative c systems (ECSs) are one of the HVAC types that are used to adjust the environment when the ambient air is uncomfortable. The process reduces the ambient temperature using water. The temperature of the water in the system is lower than that of the air, so the water heats up by latent heat and evaporation. Once the state changes from water to steam, the heat is absorbed, and the temperature reduces [6]. The optimal continuous operating mode for air conditioning systems using the transient computational fluid dynamics (CFD) approach for the simulation and analysis of evaporative cooling systems is used to reduce the temperature [7]. For instance, evaporative air conditioning systems are used to increase the performance of the condenser [8]. Generally, there are two types of evaporative air conditioning systems: direct water evaporative cooling systems (DECSs) and indirect water evaporative cooling system (IECSs), with evaporative air conditioning systems being developed as two-stage evaporative air conditioning systems. The performance of the system is suitable for dry-to-moderate zones [9]. Additionally, evaporative air conditioning systems are used in the agricultural sector; for example, the introduction of evaporative air conditioning systems into orchid greenhouses helps maintain the optimum temperature for orchid growth. The system saves more energy than conventional air conditioners [10]. Consequently, evaporative air conditioning systems are increasingly being used in agricultural greenhouses [11] and in industrial sectors, such as the introduction of evaporative air conditioning systems for the heat transfer of large appliances [12]. Moreover, in the household sector, evaporative air conditioning systems are used both inside and outside houses. The literature indicates that energy management in air conditioning systems can significantly reduce the total energy consumption.
The building envelope material is a crucial factor that can significantly reduce the overall energy consumption of a building. Previously, non-transparent materials have been selected to aid in heat transfer into a building [13]. Additionally, the impact of constructing double brick walls on the thermal efficiency of building facades in Malaysia was also studied. The Sunway Hotel located in the heritage city of Georgetown in Penang was selected as a case study. The first measurement used a systematic calculation of the wall heat transfer (U value), and the overall thermal transfer value (OTTV) was calculated [14]. Past studies have attempted to reduce the thermal conductivity of concrete blocks by mixing them with bio-based local materials, such as sawdust and treated palm fibers [15]. An experimental analysis determined the thermal conductivity, compressive strength, and density of concrete mixed with sawdust and palm fibers. Moreover, a design study focused on the control of heat gain from solar radiation [16]. Since the building envelope acts as a link between the outdoor climate and the temperature inside the building, a highly efficient building envelope must be developed [17]. The ability of the building envelope to reduce latent heat was investigated in several studies [18,19]. The heat transfer and humidity of the building envelope must be considered [20,21]. Other factors affecting the heat transfer of a building include windows and sunshades. Studies have demonstrated that the window type and tightness are vital factors influencing the energy efficiency of air conditioning systems [22]. Moreover, integrated calculations for empirical physical correlation analysis have been performed to assess the thermal comfort in buildings reflecting energy consumption [23,24].
This study applies the concept of reducing energy consumption in a household. It primarily focuses on reducing the electrical energy consumption of air conditioners because air conditioners consume the highest proportion of energy in households. In the experiment, a closed-system model was designed. An evaporative cooling system (ECS) was used to measure the temperature and relative humidity. The ECS could control the temperature that changed in the simulation room. Simultaneously, a ventilation fan was used to control the relative humidity in the simulation room. Moreover, the experiment focused on the influence of wall materials, the direction in which the experimental model was oriented, and the type of roof on the observed parameters. Both the simulation and experimentation were operated under the conditions of improving resident comfort and energy saving.
The contributions of this study are as follows:
- This study carried out an integration of an ECS with various building envelope materials, with an actual experimental setup in a laboratory being built to evaluated the actual performance.
- The experiments considered various study cases to cover as many real-life scenarios as possible, which were carried out to investigate the effects of the building material of both the wall and roof as well as the direction in which the building is oriented.
- This research provides an assessment of energy saving while maintaining thermal comfort in residential buildings in tropical climates.
2. Computational Fluid Dynamics Simulation
The thermal transfer and air flow in the building was simulated in a CFD program. The ANSYS software version 16.0 was used to simulate the airflow in the room. A room with dimensions of 1 m on each side and a height of 3 m was constructed as a case study. The simulation focused on the effect of air and temperature under the operation of fans in the ECS. Two scenarios were used as case studies, both observed under the conditions of varying the number of operated fans from one fan to three fans. The parameters of airflow inside the building and the average temperature were the focus of the studies.
Scenario 1: Temperature outside the building is higher than inside the building.
In this scenario, three fans were considered and operated with a ventilation fan installed outside the building. The characteristics of the temperature under the operation of fans are shown in Figure 3.
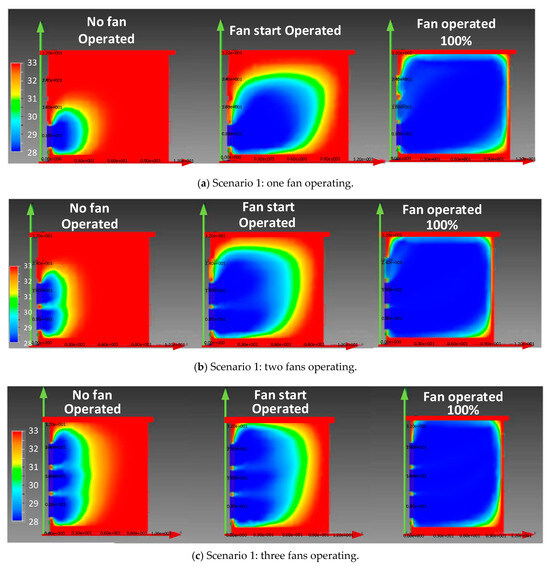
Figure 3.
Building temperature displayed as cross-section views.
First, Figure 3a presents the results from the CFD program when considering the case of one fan operating in scenario 1, which displays a cross-section of the building. The red color in the cross-section corresponds to the area where the temperature was high, and the blue color corresponds to the low-temperature area. Figure 3a shows that the highest temperature area in the observed building occurred at the chamber wall. However, when one fan started operating, the building temperature decreased. Additionally, the case where the cross-section of the building is displayed in blue represents when the fan was operating at 100%, indicating a lower temperature inside the building. In other words, it is comfortable for a person residing in the environment.
Second, two fans were operated, and the cross-section results are shown in Figure 3b. The results show that the temperature was high on the chamber wall of the building, and it reduced when the fans operated, which can be seen by the blue color being more dispersed than in the previous case.
In the last case of scenario 1, the system depicts the operation of three fans, and the simulation results are displayed in Figure 3c. In Figure 3c, the area in red is smaller than in the other cases, indicating that the building temperature in this case was lower than in the previous cases. Although the temperature was lower, the highest temperature was still on the chamber wall. Moreover, when three fans started operating, the temperature was lowered faster compared to the two previous cases.
When considering the characteristics of the temperature distribution in the cross-section views, the effect of the temperature on other parts of the building was analyzed, and the results are listed in Table 2. The table lists the temperatures of the different parts of the building, which consisted of the roof, wall, floor, and air. Three cases of fan operation were observed, similar to the previous case.

Table 2.
Temperature when fans were installed and operated in the system of scenario 1.
When considering the data in Table 2, it is clear that the temperature was highest at the roof and wall of the building. This was because sunlight directly illuminated the roof and wall throughout the day. However, when a single fan was installed in the observed building, the temperature decreased from 35 °C to 28.449 °C in the roof area, and it decreased from 35 °C to 28 °C at the wall. Concurrently, when two and three fans were operated, the temperature was reduced more than in the case of a single fan operating.
When comparing the average temperatures among the three cases, it was found that the installation and operation of three fans was the most effective for temperature reduction, as the fans could reduce the temperature of any area, including the roof, wall, and floor.
Scenario 2: Temperature outside the building is lower than the temperature inside the building.
This scenario considers three fans operated with an exhaust fan and a ventilation fan. The operation of these fans was stopped because the temperature met the conditions where the outside temperature of the building was lower than that inside the building. The temperature distribution in the observed building was analyzed, similar to scenario 1.
The parameters of the temperature distribution in the observed building and the number of operating fans were considered. Since the temperature outside was lower than that inside the building, the temperature inside the building was high. This is illustrated in Figure 4, where the red color is spread throughout the building. Compared to Figure 3, it can be seen that the red color displayed in Figure 4 is more prominent, indicating higher heat levels than in the previous case. This can be attributed to the influence of the environmental temperature.
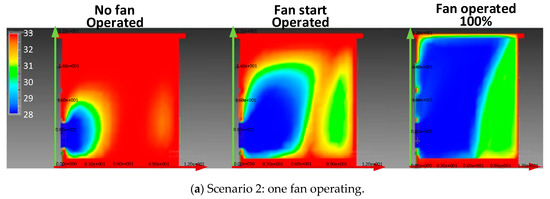
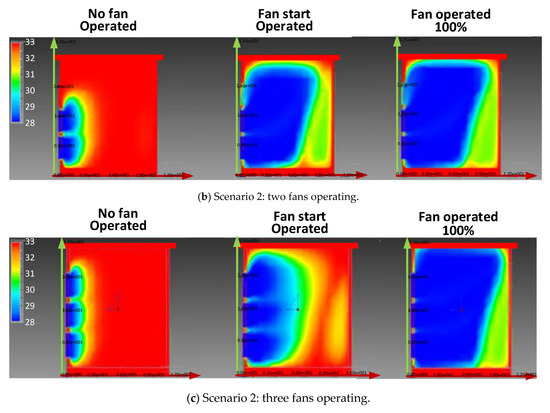
Figure 4.
Building temperature displayed in cross-sectional views.
When considering the fan operating cases, Figure 4a shows the characteristics of the temperature when a single fan was operated. The results show that it efficiently reduced the building’s temperature. Furthermore, the effect of the temperature could be improved by increasing the number of operating fans, as shown in Figure 4b,c. The characteristics of both figures show that the blue color was more spread when the number of operating fans was increased from two to three.
The temperatures of all parts of the building were considered using the data presented in Table 3. When considering the data in the case of one fan operating, it is clear that the temperature was the highest at the roof and wall. This was because sunlight directly shone on the roof and wall, similar to scenario 1. The temperature of the other parts of the building could be reduced when a single fan was operating. For example, the temperatures at the roof and wall when a single fan was operating were reduced to 28.9 °C and 28.0 °C, respectively. Meanwhile, when two and three fans were operating in the observed building, the temperature further decreased, indicating that operating three fans in the building was better at reducing the temperature than operating two fans.

Table 3.
Temperature when fans were installed and operated in the system of scenario 2.
When considering the average temperature shown in Table 3, it can be concluded that after operating the fans, the temperature decreased; however, the highest temperature still occurred at the wall of the building. The reason for the high temperature was the previously mentioned weakness.
The results of observing both scenarios demonstrate that installing and operating fans can reduce the temperature of a building through air exchange. Therefore, the building is cooled through air transfer. Operating multiple fans can reduce the temperature faster due to quicker air exchange, thus cooling the building more rapidly. In addition to the number of fans operating, environmental conditions also affect the manner in which the building temperature is reduced. Owing to temperature changes from high to low, scenario 2, in which the temperature outside was lower than that inside the building, enabled heat transfer from inside the building to the outside. However, because the initial temperature of the building in scenario 2 was high, the result of installing the fans reduced the temperature by approximately 4 °C, which is higher than in scenario 1. This section considered the characteristics of wind, pressure, and the temperature of the building. The next section presents an experimental model to replicate a room with an ECS at the laboratory level to evaluate the performance of the ECS under different building envelope materials.
3. Experimental Model
A closed-system experimental model was designed to investigate the temperature and relative humidity based on the ECS. The temperature was controlled by the temperature difference (ΔT). The relative humidity was controlled by a ventilation fan to ensure the relative humidity threshold was not exceeded (30–60% of air quality). The experiment observed 16 study cases and focused on three factors: (1) wall material, (2) building direction, and (3) roof type. The wall materials comprised smart board and plastwood, which are a synthetic fiber cement and PVC foam board, respectively. Four directions (north, south, east, and west) were observed as the factors of the building direction (experimental model direction). Finally, the roof type was observed as either an uninsulated roof or an insulated roof.
3.1. A Closed-System Design of an Experimental Model
According to the experimental model based on a closed system, the roof and wall parts should be independently designed for convenience in terms of changing the observed materials. A component of the model is displayed in Figure 5. The experimental structure shown in Figure 5a is divided into two parts: a square room part (number 1) and a roof part (number 2). Sensors were installed in the right and left walls of the square room part. The front wall of the square room had the ECS installed, as shown in Figure 5b. Meanwhile, the back wall of the room had two ventilation fans installed, as shown in Figure 5c. The roof part, which was independent of the structural part, was designed with a 45-degree tilt angle. Moreover, because the roof of a building is the most affected by heat radiation from the sun, it should have an air vent through which air can flow to reduce the heat.
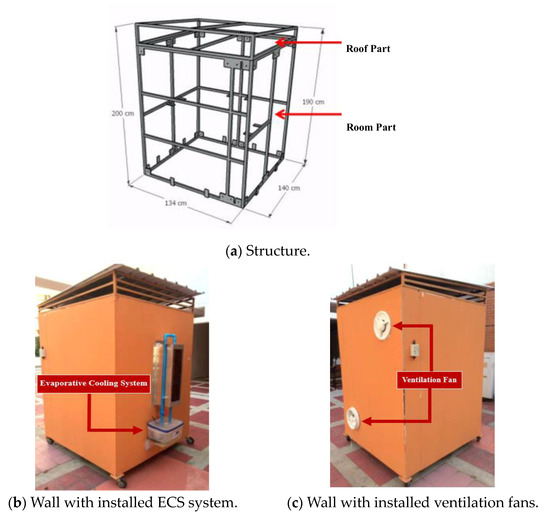
Figure 5.
Components of the experimental model.
When considering the inside of the experimental model, an air ventilation circuit system is displayed in Figure 6. The circuit was installed in the experimental model, and the equipment details are as follows:
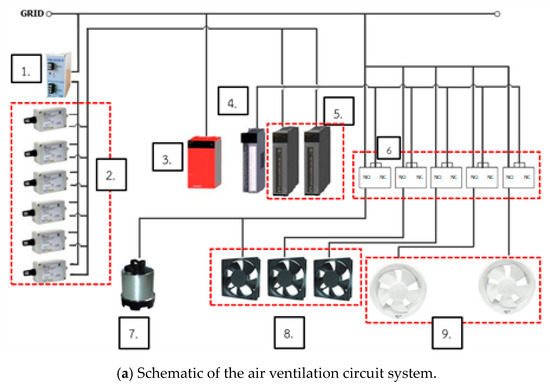
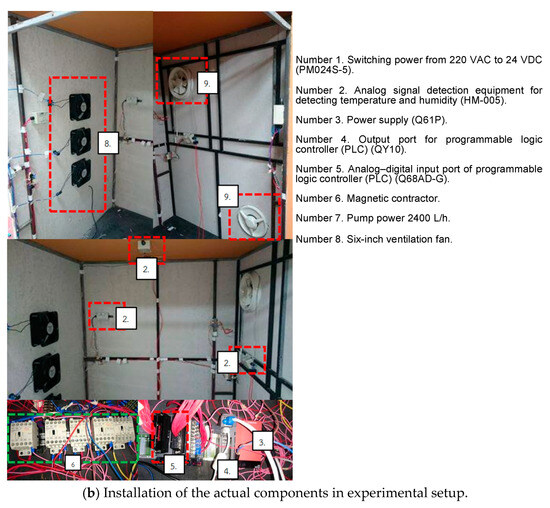
Figure 6.
Proposed air ventilation circuit system.
For the accuracy of the measurement device, the humidity and temperature selected in this case study was HM-005. The sensor had a temperature range of 0–100 °C with an accuracy of ±1 °C (0–60 °C) and a humidity range of 0–100% with an accuracy of <±3% RH (0–80% RH) °C.
3.2. Results of the Experimental Model
Once the experimental model was designed and developed, the parameters of the wall material and roof type were investigated under the direction of the model variable. The materials of the wall and roof types were as follows:
- Wall materials: smart board and plastwood.
- Roof types: uninsulated and insulated roofs.
The study cases were considered when the investigated parameters were varied. The investigation was observed in terms of the temperature, relative humidity, power, and energy. The investigation period was 2 h per study case, and the results were as follows:
3.2.1. Study Case 1: The Direction of the Building Was Oriented toward the North
The influence of wall material and roof type on the observed parameters is demonstrated in Figure 7, Figure 8, Figure 9 and Figure 10. The x-axis of all these figures represents time (minutes), and the y-axis of Figure 7, Figure 8, Figure 9 and Figure 10 represents the temperature (°C), relative humidity (%), power (W), and energy (Wh), respectively.
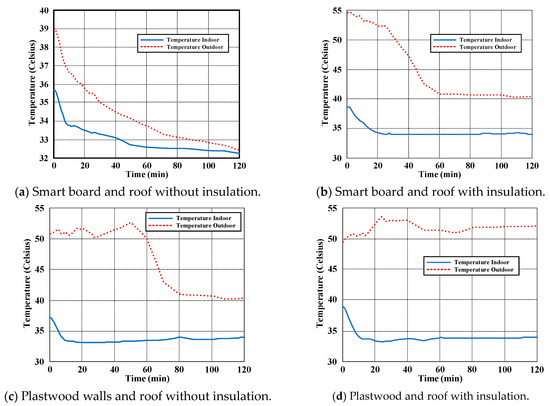
Figure 7.
Characteristics of the temperature with the building facing north.
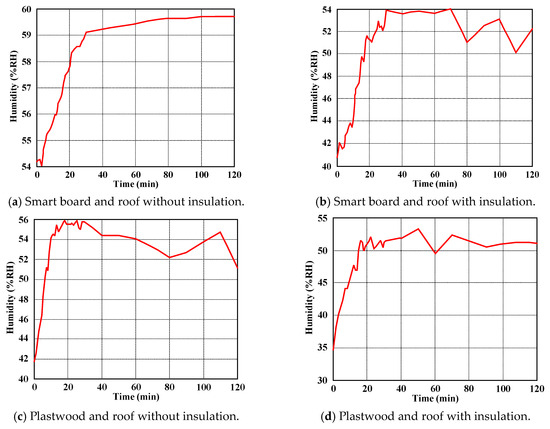
Figure 8.
Characteristics of relative humidity with the building facing north.
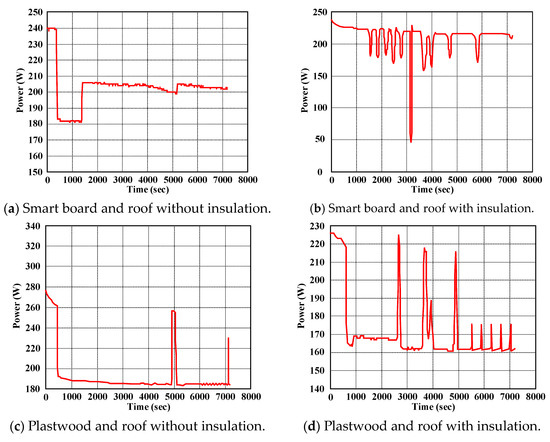
Figure 9.
Characteristics of power with the building facing north.
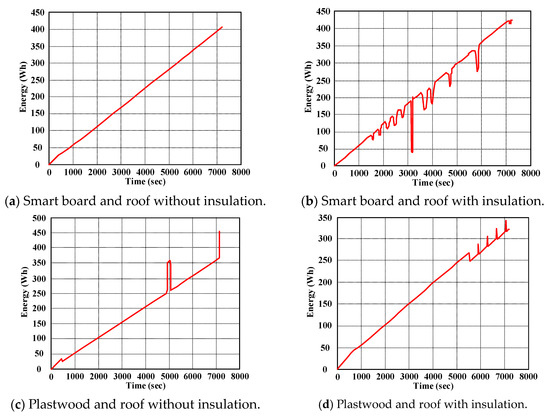
Figure 10.
Characteristics of energy with the building facing north.
When considering the characteristics of the temperature, the temperature based on the model of the smartboard wall without an insulated roof and with a varied building direction is shown in Figure 7. Figure 7a illustrates the indoor and outdoor temperatures when the building faced north. The results show that both the indoor and outdoor temperatures were significantly different initially. However, when the closed system was changed to an open system, both temperatures reduced to a similar value after 2 h. The graph in Figure 7a shows that when the system status changed, the temperature decreased from 35.6 °C to 32.4 °C (approximately 3.2 °C). The reason for the temperature reduction was the transition from liquid to steam, which absorbed heat from the environment. When the heat was absorbed by the liquid, it resulted in cooling the building over time. Meanwhile, when the building roof was insulated, Figure 7b shows that when the system changed to an open state, the initial temperature difference between the indoor and outdoor temperatures was high. A few hours later, the temperatures converged to a new stable state, with the temperature difference being approximately 7 °C. Similarly, when the wall material was changed from smartboard to plastwood and the roof type was varied, the temperature characteristics displayed in Figure 7c,d show that the temperature decreased when the system state changed to open. Insulating the roof caused the indoor temperature to be higher than the roof without insulation. However, the temperature at the new stable state for both cases was comparable.
The results shown in Figure 7 conclude that the temperature difference (between the indoor and outdoor temperatures) was low when the building walls were made of smartboard and the roof was without insulation. In contrast, the other cases exhibited a high temperature difference. The trend of the temperature showed a decrease (temperature at the new stable state was approximately 32.4 °C), even when the wall material and roof type were varied.
This section considers the relative humidity observed under the same system conditions. The characteristics of the relative humidity when the building had smartboard walls and variable roof types are shown in Figure 8a,b. Meanwhile, the characteristics of the relative humidity for the building with plastwood walls and variable roof types are displayed in Figure 8c,d.
Figure 8 shows the characteristics of the relative humidity when the direction of the building was varied. Figure 8a shows the relative humidity in study case 1, which was based on the model of a smartboard wall without an insulated roof and with the building facing north. The relative humidity in this study case was approximately 54%. Half an hour later, it increased to 59.8%; however, the value did not exceed the threshold (30–60%). The increase was due to the influence of the ECS system. As the water flowed through the cooling pad in the ECS system and changed state from water to steam, the relative humidity rose. However, when the relative humidity nearly exceeded the threshold, the ventilation of the observed system operated to eliminate the steam from the system. This resulted in the relative humidity being controlled so that it did not exceed the specified value. As shown in Figure 8b, where the roof was insulated, the relative humidity increased, and it was limited by the ECS system when it was close to the threshold.
Furthermore, the characteristics of the relative humidity in the case of the building with plastwood walls were observed, with the variable parameter being the roof type. The characteristics in Figure 8c,d show that the ECS system also efficiently controlled the relative humidity, even when the roof type varied. Therefore, the characteristics in Figure 8 could be found even when the system state changed to open, as the airflow removed the heat. This resulted in a higher relative humidity. However, since the relative humidity remained within the comfortable range, the ECS system ensured that it did not exceed 60%.
Subsequently, the power characteristics are shown in Figure 9. When considering Figure 9a, where the building had smartboard walls and a roof without insulation, a high temperature occurred in the observed system (as shown in Figure 7). Initially, three ventilation fans were operated, causing the power consumption to be extremely high. Later, when the temperature decreased, the ventilation fans were stopped, reducing the power consumption. However, the ECS was used to control the temperature, maintaining the power at approximately 205 W for the optimal temperature.
The influence of the wall material and roof type on the power is displayed in Figure 9b–d. The results show the same behavior as in Figure 9a, where the power was high at first due to the high temperature of the building, necessitating the operation of all ventilation fans. Subsequently, the ECS system dictated the operation of the ventilation fans to maintain an optimal temperature (the temperature at which humans feel comfortable). Consequently, the power consumption in all cases converged towards the level required to maintain the optimal temperature.
P = VIcosθ
Equation (1) expresses the effect of the voltage (V) and current (I) on the power (P). When cosθ is the power factor, it can be concluded that the power increases when the load increases and decreases when the load decreases.
Energy is the last observed parameter considered in study case 1. The characteristics of these cases are shown in Figure 10a–d under the same conditions as the previous parameters. Accordingly, the energy consumption increased even when the wall material and roof type changed.
Therefore, the characteristics of these four observed parameters can be concluded as follows: the ECS system efficiently controls both the temperature and relative humidity even when the building structure is varied. Accordingly, the environment inside the building is comfortable for humans. In addition, the control of the temperature and relative humidity affects the operation of the ventilation fans. Thus, the power and energy consumption depend on the usage of ventilation fans.
3.2.2. Study Case 2: The Direction of the Building Was Oriented toward the South
This case investigated the experimental model when the direction of the building was oriented toward the south. The wall material and roof type were varied. The characteristics of the observed parameters (temperature, relative humidity, power, and energy) are shown in Figure 11, Figure 12, Figure 13 and Figure 14.
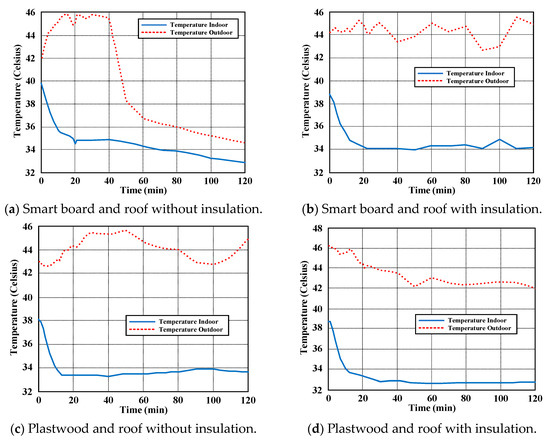
Figure 11.
Characteristics of temperature with the building facing south.
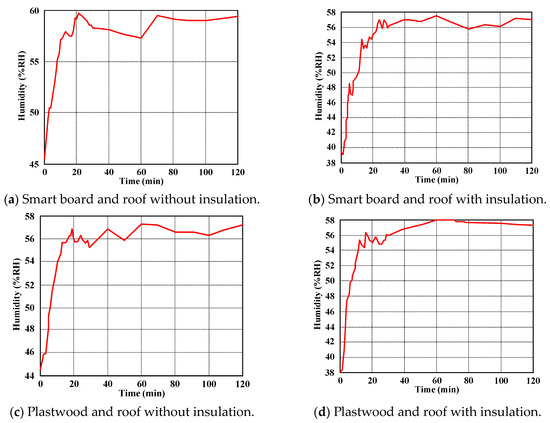
Figure 12.
Characteristics of relative humidity with the building facing south.
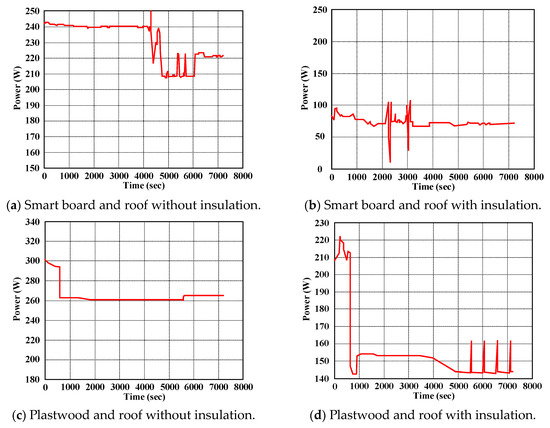
Figure 13.
Characteristics of power with the building facing south.
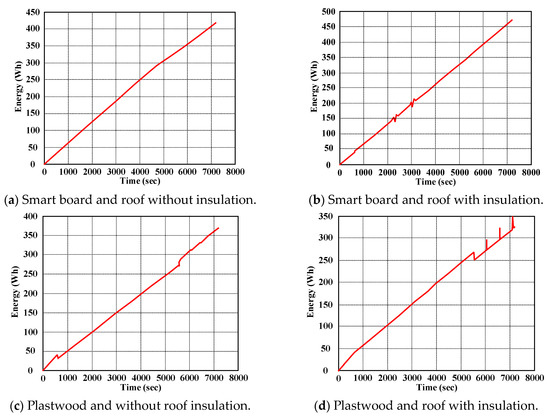
Figure 14.
Characteristics of energy with the building facing south.
First, let us consider the characteristics of the temperature, as shown in Figure 11a. It can be seen that when the building model was oriented toward the south, the temperature difference (ΔT) between the indoor and outdoor environments was high. However, when the system changed from a closed system to an open system, the difference between the two temperatures reduced. Finally, 2 h later, the indoor temperature was reduced by approximately 4 °C, while the outdoor temperature could be reduced by approximately 12 °C. On the other hand, the characteristics in Figure 11b–d show that the temperature difference in the new stable state had a large gap when the roof was insulated or when the wall was changed to plastwood. Therefore, the smartboard material could decrease the outdoor temperature more than plastwood. Moreover, installing insulation in the roof could isolate the temperature between the indoor and outdoor environments, affecting the heat transfer. Thus, a high outdoor temperature did not influence the indoor temperature, keeping the environment inside the building comfortable.
The relative humidity when the wall material and roof type were changed is shown in Figure 12a–d. Considering the relative humidity characteristics shown in Figure 12, they are similar to the characteristics shown in Figure 8, in which the relative humidity suddenly increased when the system changed state from closed to open. This increase was caused by the outside air stream entering the building. However, the threshold of the relative humidity was set at 50–60%, so the ECS system controlled the relative humidity when it almost exceeded the threshold. Subsequently, the relative humidity decreased and maintained a value of approximately 50–60%. Changing the wall material and roof type did not affect the relative humidity in the new stable state, which was due to the control of the ECS system.
Furthermore, when compared with the relative humidity when the building was oriented toward the north, it can be seen that the temperature varied in the time domain. However, owing to the relative humidity being controlled by the ECS system, the relative humidity when the direction of the building was changed from north to south maintained a similar value.
The third characteristic investigated was the power, as displayed in Figure 13. When the experimental building had smartboard walls, the power was initially high when the system operated in the open state. Since the indoor temperature was high, the ventilation fans were operated. Once all the ventilation fans were operating, the temperature reduced, and the ventilation fans stopped. Consequently, the power decreased. However, when the temperature was unstable, the ECS system maintained the temperature by controlling the operation of the ventilation fans. Thus, the ventilation fans alternately operated in the on and off state, and the power fluctuated, as displayed in Figure 13a.
Moreover, when considering the characteristics shown in Figure 13b–d, it is clear that the power fluctuated in the time domain due to the operation of the ventilation fans. On the other hand, when compared to the power shown in Figure 9, the direction of the building influenced the power characteristics; however, the value of the power was independent.
The last parameter investigated in study case 2 was the energy, as displayed in Figure 14. As shown in Figure 14a, when the building model was the same as in the previous study case but oriented toward the south, the characteristics of the energy were related to the power. More specifically, the ventilation fans operated, causing the power to increase. Concurrently, the energy increased. The characteristics of the energy when the wall material and roof type were changed in these cases are displayed in Figure 14b–d. The results reveal that changing the structure did not affect the energy characteristics.
Moreover, when considering the influence of the building direction by comparing the energy characteristics displayed in Figure 10, it was found that a variation in the building direction did not impact the energy. The energy exhibited an increasing trend, and the energy signal occasionally spiked when the power spiked. Thus, the energy depends on the power.
3.2.3. Study Case 3: The Direction of the Building Was Oriented toward the East
The previous study cases examined the model with the building oriented toward the north and south, respectively. In this study case, four parameters were observed when the building was oriented toward the east and when the wall material and roof type were varied. The characteristics of the four parameters are displayed in Figure 15, Figure 16, Figure 17 and Figure 18.
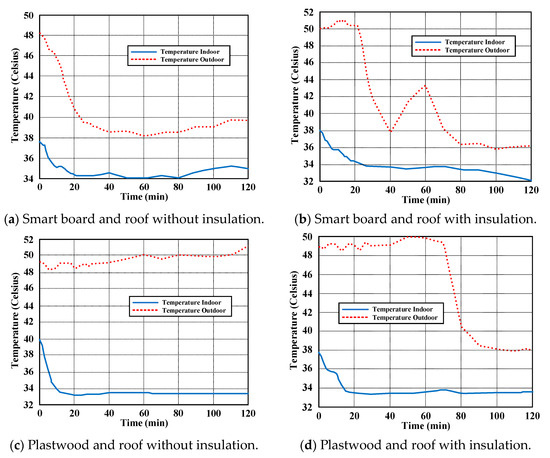
Figure 15.
Characteristics of temperature with the building facing east.
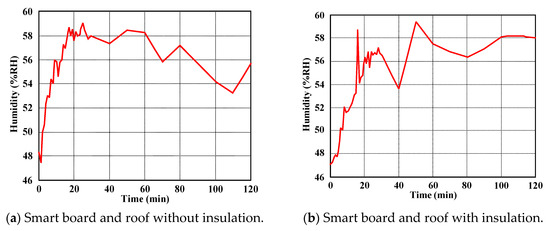
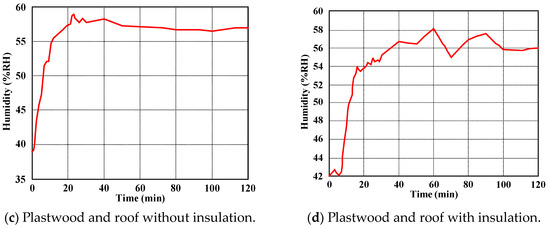
Figure 16.
Characteristics of relative humidity with the building facing east.
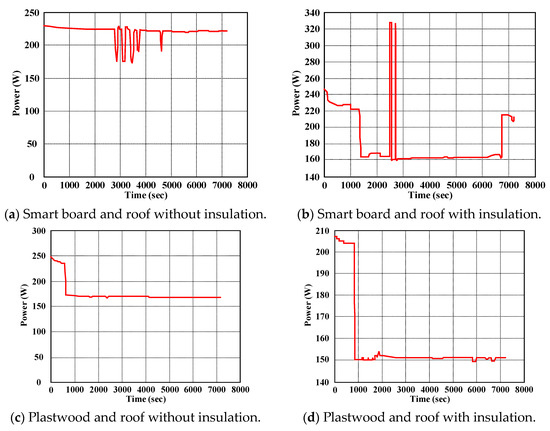
Figure 17.
Characteristics of power with the building facing east.
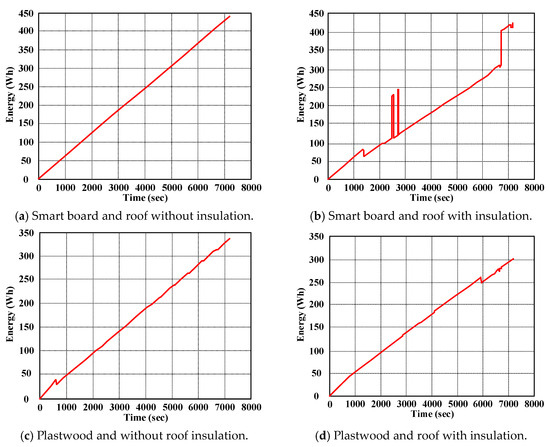
Figure 18.
Characteristics of energy with the building facing east.
The characteristics in Figure 15 show that the indoor and outdoor temperatures varied over time. The characteristics when the wall material changed from smartboard to plastwood are displayed in Figure 15a,b. Similarly, the characteristics when the roof was changed from no insulation to insulated are displayed in Figure 15c,d. The results from observing these figures found that when the system changed to an open system and 2 h passed, the temperature difference in these cases was approximately 5–20 °C.
When compared to the temperature characteristics in the cases where the building was oriented toward the north and south, respectively, it was found that even when the building direction was variable, the temperature difference in the case of a smartboard wall without insulation was lower than in the other cases. Moreover, because the building direction is related to the airflow, which can accumulate heat, the temperature difference in the cases of the building being oriented toward the east with an insulated roof had a small gap.
The characteristics of the relative humidity are shown in Figure 16. The relative humidity was investigated under the same conditions as in Figure 16. As observed in Figure 16a–d, when the wall material and roof type were varied, the relative humidity exhibited an increasing trend. The relative humidity increased due to the open system and the exchange of indoor–outdoor air streams, which resulted in an increased stream. Subsequently, the relative humidity also increased. However, the relative humidity was set at 50–60%, so the ECS system operated when the relative humidity was close to the set value and maintained the relative humidity within the determined range.
Furthermore, when comparing these characteristics of the relative humidity to those in the cases where the building was oriented toward the north and south, respectively, it was found that the characteristics were similar. The relative humidity suddenly increased at first and then stabilized at approximately 50–60%. Therefore, the material of the wall did not impact the relative humidity.
The third parameter considered in study case 3 was the power, which is displayed in Figure 17. Figure 17a–d show the power characteristics recorded from the experimental model when the structure (wall material and roof type) was changed. When the structure varied, the power consumption obviously changed.
As seen in Figure 17a, when the model was oriented toward the east with smartboard walls and a roof without insulation, the power was maintained at approximately 230 W. The power pulsed due to the ventilation fan turning on and off. However, when the building also had a smartboard wall with an insulated roof, the power consumption was lower than in the case with a roof without insulation. Thus, the characteristics displayed in Figure 17a,b imply that insulation in the roof influenced the temperature and therefore directly affected the power usage.
On the other hand, when the wall material was changed to plastwood, as displayed in Figure 17c,d, it can be seen that the power characteristics were the same as in the previous case with an insulated roof, which was lower than the case without an insulated roof.
The last parameter considered in study case 3 was the energy. The energy recorded in the experimental model was under the same conditions as in the previous study cases. The energy was observed when the wall material and the roof type were varied, as displayed in Figure 18.
When the four characteristics in Figure 18a–d were considered, it can be seen that the energy increased as the time increased. This was a result of the power consumption of the load, which includes the ventilation fans. However, an instantaneous change in power (power pulse), as displayed in Figure 18, affected the energy.
3.2.4. Study Case 4: The Direction of the Building Was Oriented toward the West
The influence of the wall material and roof type on the observed parameters was considered in this study case. The model was based on the same conditions as the previous study case, and the building was located facing west. The characteristics of the observed parameters (temperature, relative humidity, power, and energy) are displayed in Figure 19, Figure 20, Figure 21 and Figure 22, respectively.
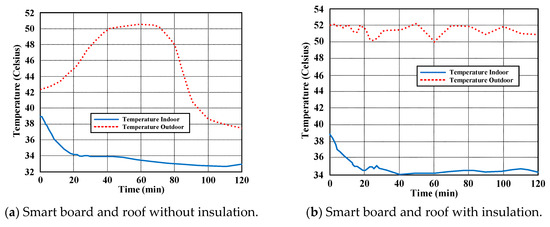
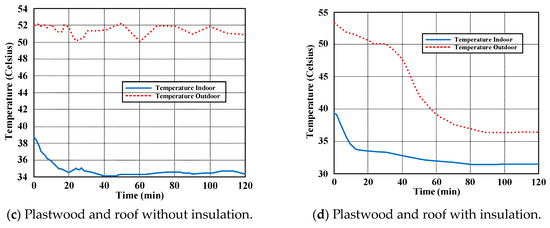
Figure 19.
Characteristics of temperature with the building facing west.
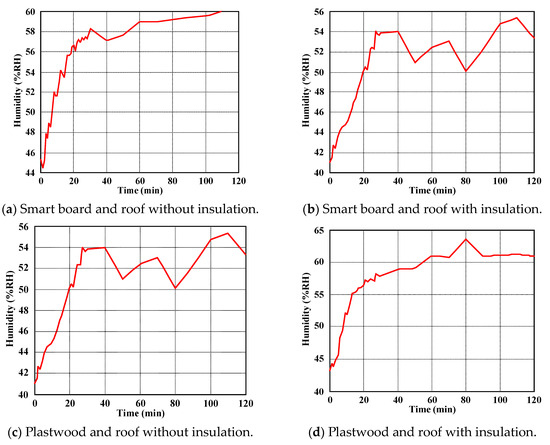
Figure 20.
Characteristics of relative humidity with the building facing west.
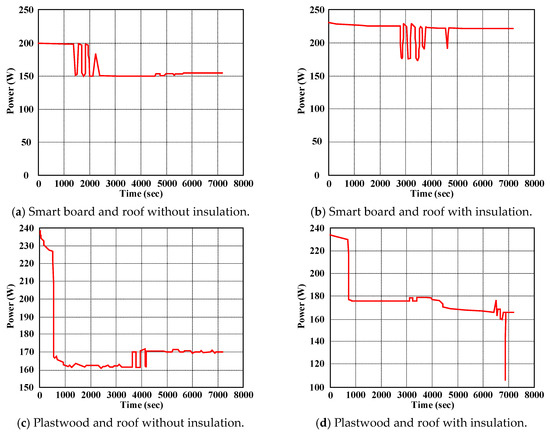
Figure 21.
Characteristics of power with the building facing west.
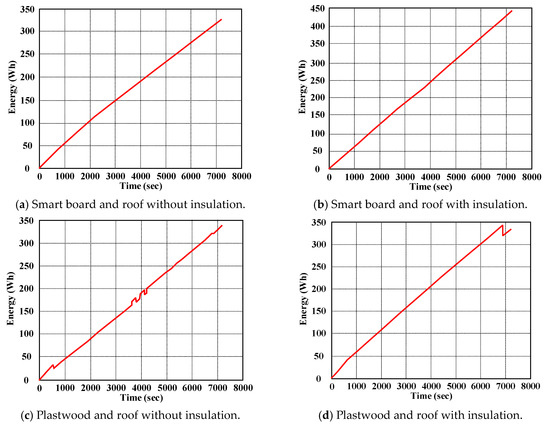
Figure 22.
Characteristics of energy with the building facing west.
First, the temperature, which varied with the wall material and roof type, is displayed in Figure 19a–d. The results reveal that the trend of the indoor temperature decreased owing to the influence of the airflow and heat cooling. Simultaneously, the outdoor temperature also changed over time. The temperature difference was high in the case of a smart board with an insulated roof and plastwood with a roof without insulation. Meanwhile, the gap was low in the case of a smart board with a roof without insulation and plastwood with an insulated roof. These four characteristics verify that the wall material and roof type affect the temperature.
In addition, the influence of the building direction on the temperature was considered by comparing the characteristics of the temperature to the previous study cases. The results found that the direction of the building had a direct impact on the temperature. The reason was that the building direction is related to the airflow, which affects the heat accumulation and cooling.
Subsequently, relative humidity was considered. The characteristics of the relative humidity are displayed in Figure 20, which varied according to the wall material and roof type. The results show that the relative humidity suddenly increased when the observed system changed state from closed to open. However, since the threshold relative humidity was limited to 50–60%, when the relative humidity was close to this value, the ECS system operated to control and maintain the relative humidity close to 50–60%. Due to the control of the ECS system, the variables of the wall material and roof type did not affect the relative humidity.
Figure 21 shows the power consumption when the conditions of the wall material and roof type changed. The results indicate that when the system was open, the power consumption increased because the indoor temperature was high and the ventilation fans were operating. Later, when the indoor temperature decreased, the ventilation fans stopped operating, and consequently, the power consumption was reduced. Moreover, as seen from Figure 21, the variables of the wall material and roof type influenced the power consumption, primarily due to heat accumulation and heat transfer. This resulted in a reduced temperature, making the environment inside the building comfortable.
Finally, the energy consumption was considered. The characteristics of the energy consumption when the wall material and roof type varied were similar to the previous case. Figure 22 shows that energy consumption increased over time, as occurred in the previous case. The energy consumption increased due to the total power consumption from when the system turned on until two hours later.
Upon observing the characteristics of the four study cases, the average values of the observed parameters were considered using the data presented in Table 4, Table 5, Table 6 and Table 7.

Table 4.
Average values of temperature recorded from study cases.

Table 5.
Average values of relative humidity recorded from study cases.

Table 6.
Average values of power recorded from study cases.

Table 7.
Average values of energy recorded from study cases.
The following are the definitions in the tables below:
S w/o In is the case of smart board walls and a roof without insulation.
S w In is the case of smart board walls and a roof with insulation.
P w/o In is the case of plastwood walls and a roof without insulation.
P w In is the case of plastwood walls and a roof with insulation.
Next, when considering the relative humidity in Table 5, the relative humidity of all the study cases maintained a value of approximately 50–60% owing to the control of the ECS system, which corresponds to comfortable living conditions for humans (shown in Table 1).
Moreover, the power and energy displayed in Table 6 and Table 7 were also considered. The data show that the power in all the study cases had a value in the range of 160–240 W. However, the direction of the building was a significant factor that affected the temperature. Thus, the ventilation fans operated when the temperature was high. Simultaneously, they were off when the temperature was low. As a result, the power in the study cases swinged from high to low and low to high. Owing to the same reason, Table 7 displays that the energy usage of the building oriented toward the western direction was the lowest when compared to the others. The direction of the building was related to the air flow. Heat could be accumulated, and the energy, which depends on the operation of the ventilation fans, also changed. In addition to the direction of building, as seen from the data in Table 7, the structure of the building (material of the wall and roof type) also affected the energy. The results show that an optimal building configuration with an efficient envelope material combined with an ECS can achieve energy savings ranging from 35–43%.
Therefore, four conclusions can be drawn. First, the direction of the building model directly affected the temperature due to air flow. Second, the change in the temperature impacted the power and energy. The reason for this was due to the usage of the ventilation fans to reduce the temperature. Third, the relative humidity did not depend on the direction of the building, but it was controlled by the ECS system. Lastly, the structure of the building (wall material and roof type) was a significant factor that affected the temperature. The difference in the temperature was higher when the wall was made of plastwood material. Similarly, the indoor temperature in the case of the building with an insulated roof was independent from the outdoor temperature. Thus, even when the outdoor temperature was high, the temperature inside the building was low and comfortable. Therefore, the conclusions drawn in this section can be used in building optimization. Thus, when these factors are considered in building design, the living environment in the building can be made comfortable while saving energy.
4. Conclusions
This paper considered a building envelope material suitable for use with an ECS system. The experimentation was conducted through a simulation in a CFD program and an experimental setup. In the CFD simulation, the number of ventilation fans and the environmental temperature conditions were varied. The simulation results found that temperature is a significant factor that directly affects airflow, causing the room temperature to continue decreasing as ventilation fans operate until equilibrium in terms of heat transfer is achieved.
The experimental setup was designed to change the envelope material between plastwood and smartboard. The study focused on the temperature, building direction, relative humidity, power, and energy. The obtained results from the setup can be observed as follows:
- Temperature: The plastwood wall accumulated more heat than the smartboard wall, so this should be considered when designing a building. Furthermore, the roof type was also related. The building with an insulated roof had a lower temperature than the building with an uninsulated roof. Thus, a plastwood wall with no insulated roof is suitable for buildings located in winter zones. Meanwhile, a smartboard wall with an insulated roof should be used for buildings in tropical zones.
- Power and energy: Although the installation of ventilation fans could convectively transfer heat, it affected the power and energy consumption. The power depended on the operation of the ventilation fans, while the energy depended on the usage of the fans.
- Relative humidity: Due to the airflow, the relative humidity changed. However, the results showed that the ECS efficiently controlled the relative humidity, maintaining it within the specified value (50–60%).
In conclusion, the results from the simulation and experimental setup indicate that the envelope material and direction significantly impact the building energy performance of the ECS. Thus, the selection of suitable materials and the building’s direction can reduce the building temperature and provide indirect benefits by decreasing the cooling load of air conditioning. In the future, shading and façades will be included in the study to further reduce the building temperature.
Author Contributions
S.Y.: conceptualization and funding acquisition; S.T.: formal analysis and performing the experiments; P.S.: investigation and analyzing the data; P.L.: visualization and writing the original paper; S.A.: designing the experiment and reviewing and editing; C.P.: contributing resources and project management. All authors have read and agreed to the published version of the manuscript.
Funding
This research was funded by King Mongkut’s Institute of Technology Ladkrabang Research Fund, Thailand, grant number 2567-02-01-024.
Data Availability Statement
Data is contained within the article.
Conflicts of Interest
The authors declare no conflicts of interest.
References
- Energy Policy and Planning Office (EPPO), Ministry of Energy. Energy Statistics of Thailand 2021; Energy Policy and Planning Office (EPPO), Ministry of Energy: Bangkok, Thailand, 2021; pp. 95–110.
- Department of Alternative Energy Development and Efficiency (DEDP). Published Manual Study and Development Project to Create a Prototype of an Energy-Saving Building for the Government Sector; Department of Alternative Energy Development and Efficiency (DEDP): Bangkok, Thailand, 2018; pp. 5–9.
- Li, J.; Platt, G.; Poulton, G.; Wall, J.; James, G. Dynamic Zone Modelling for HVAC System Control. Int. J. Model. Identif. Control 2010, 9, 5–14. [Google Scholar] [CrossRef]
- Mossolly, M.; Ghali, K.; Ghaddar, N. Optimal control strategy for a multi-zone air conditioning system using a genetic algorithm. Energy 2009, 34, 58–66. [Google Scholar] [CrossRef]
- ANSI/ASHRAE Standard 55; Thermal Environmental Conditions for Human Occupancy. ASHRAE: Peachtree Corners, GA, USA, 1992.
- Britto, J.J.J.; Vasanthanathan, A. Performance evaluation of window air conditioner by incorporating evaporative cooling system on the condenser. In Proceedings of the International Conference on the Energy Efficient Technologies for Sustainability (ICEETS), Nagercoi, India, 10–12 April 2013. [Google Scholar]
- Yu, Y.H.; Yeh, C.H.; Chen, Y.K.; Lai, P.H.; Chen, P.Y.; Lien, C.Y. A Practical Survey of Evaporative Cooling System for Orchids Greenhouse. In Proceedings of the Second International Conference on Robot, Vision and Signal Processing, Kitakyushu, Japan, 10–12 December 2013. [Google Scholar]
- Xiaofang, S.; Wei, Z.L.; Shichang, H. Dynamic Performance of Indoor Environment and Energy Consumption of Air Conditioning System under Intermittent Mod. Sci. Energy Procedia 2019, 158, 3821–3826. [Google Scholar]
- Mohammad, G.R.; Christopher, D. Performance assessment of desiccant air conditioning system in an institutional building in subtropical climate. Energy Procedia 2017, 110, 486–491. [Google Scholar]
- Shi, W.; Yang, H.; Ma, X.; Liu, X. Techno-economic evaluation and environmental benefit of hybrid evaporative cooling system in hot-humid regions. Sustain. Cities Soc. 2023, 97, 104735. [Google Scholar] [CrossRef]
- Hemraj; Sukesha. Power estimation and automation of greenhouse using wireless sensor network. In Proceedings of the 2014 5th International Conference—Confluence The Next Generation Information Technology Summit (Confluence), Noida, India, 25–26 September 2014. [Google Scholar]
- Zhenguo, L.; Lin, R.; Longyao, T. Heat transfer characteristics of spray evaporative cooling system for large electrical machines. In Proceedings of the 18th International Conference on the Electrical Machines and Systems (ICEMS), Pattaya, Thailand, 25–28 October 2015. [Google Scholar]
- Yanna, G.; Xi, M.; Xinyu, S.; Ziyun, W.; Enshen, L.; Weijun, G. Optimization on non-transparent envelopes of the typical office rooms with air-conditioning under intermittent operation. Sol. Energy 2020, 201, 798–809. [Google Scholar]
- Muhammad, H.A.N.; Ahmad, S.H. Thermal performance of double brick wall construction on the building envelope of high-rise hotel in Malaysia. J. Build. Eng. 2020, 31, 101389. [Google Scholar]
- Richard, O.; George, Y.O.; Jo, D.; Samuel, K. Minimizing heat transmission loads and improving energy efficiency of building envelopes in sub-Saharan Africa using bio-based composite materials. Sci. Afr. 2020, 8, e00358. [Google Scholar]
- Ruey, L.H.; Wen, M.S.; Kuo, T.H. Evaluation and mapping of building overheating risk and air conditioning use due to the urban heat island effect. Appl. Energy 2020, 264, 114725. [Google Scholar]
- Haksung, L.; Akihito, O.; Myong, H.L.; Wanghee, C. A fundamental study of intelligent building envelope systems capable of passive dehumidification and solar heat collection utilizing renewable energy. Energy Build. 2019, 195, 139–148. [Google Scholar]
- Yu, H.L.; Min, D.L.; Kang, T.T.; Ming, J.D.; Hirofumi, I. Multi-objective optimization design of green building envelopes and air conditioning systems for energy conservation and CO2 emission reduction. Sustain. Cities Soc. 2021, 64, 102555. [Google Scholar]
- Shuanghua, C.; Xin, L.; Bing, Y. Heat and moisture transfer of building envelopes under dynamic and steady-state operation mode of indoor air conditioning. J. Build. Eng. 2021, 44, 102683. [Google Scholar]
- Kamil, T.; Milos, P.; Rupert, W. Energy performance of five different building envelope structures using a modified Guarded Hot Box apparatus- Comparative analysis. Energy Build. 2019, 195, 116–125. [Google Scholar]
- Hong, X.L.; Yan, L.; Boya, J.; Limao, Z.; Xianguo, W.; Jingyi, L. Energy performance optimisation of building envelope retrofit through integrated orthogonal arrays with data envelopment analysis. Renew. Energy 2020, 149, 1414–1423. [Google Scholar]
- Raad, Z.H.; Amjad, A.; Asaad, A.; Manar, K.J.; Marjan, G.; Khairul, S.M.S. Effect of different building envelope materials on thermal comfort and air-conditioning energy savings: A case study in Basra city, Iraq. J. Energy Storage 2021, 34, 101975. [Google Scholar]
- Yuxing, W.; Chunyu, W. Design optimization of office building envelope based on quantum genetic algorithm for energy conservation. J. Build. Eng. 2021, 35, 102048. [Google Scholar]
- Pushpendra, K.; Singh, R.; Shailendra, K.S. An experimental evaluation of thermal behavior of the building envelope using macroencapsulated PCM for energy savings. Renew. Energy 2020, 149, 1300–1313. [Google Scholar]
Disclaimer/Publisher’s Note: The statements, opinions and data contained in all publications are solely those of the individual author(s) and contributor(s) and not of MDPI and/or the editor(s). MDPI and/or the editor(s) disclaim responsibility for any injury to people or property resulting from any ideas, methods, instructions or products referred to in the content. |
© 2024 by the authors. Licensee MDPI, Basel, Switzerland. This article is an open access article distributed under the terms and conditions of the Creative Commons Attribution (CC BY) license (https://creativecommons.org/licenses/by/4.0/).