Article

The Impact of Replacing Synchronous Generators with Renewable-Energy Technologies on the Transient Stability of the Mangystau Power System: An Introduction to Flexible Automatic Dosage of Exposures

1
Department of Renewable and Alternative Sources of Energy, Almaty University of Power Engineering and Telecommunications Named after G. Daukeyev, Almaty 050013, Kazakhstan
2
Department of Electronic Engineering, Almaty University of Power Engineering and Telecommunications Named after G. Daukeyev, Almaty 050013, Kazakhstan
3
Department of Electric Power Engineering, L.N. Gumilev Eurasian National Research University, Astana 010000, Kazakhstan
*
Author to whom correspondence should be addressed.
Energies 2024, 17(10), 2314; https://doi.org/10.3390/en17102314
Submission received: 26 January 2024 / Revised: 28 March 2024 / Accepted: 13 April 2024 / Published: 11 May 2024
(This article belongs to the Section A: Sustainable Energy)

Abstract

:
Since the creation of the first parallel electrical power systems around the world, the rotor angle stability of synchronously operating generators has been one of the most crucial and challenging problems. In modern electricity networks, including in Kazakhstan, where renewable energy technologies are rapidly emerging, the issue of stability takes on even greater importance due to the technical shortcomings of inverter-based generation. In this framework, an analysis of rotor angle transient stability was carried out when replacing existing synchronous generators with doubly fed induction generators under a certain pre-emergency mode. A critical proportion of active power generation by DFIG units was identified at which transient stability can still be maintained due to the sufficient stored kinetic energy of the synchronous machines remaining in operation. In addition, two simple solutions were investigated to improve transient stability, such as an increased time of the automatic reclosure operation and the use of special load-shedding automation. Finally, this paper proposes a novel type of flexible smart-grid automation that is capable of monitoring the main operating parameters and issuing control actions depending on inertia, the availability of wind resources, and the load of the system as a whole. For this analysis, a real power system from the Mangystau region in Kazakhstan was considered, and the PowerWorld software 23 was used.

1. Introduction

The problem of climate change causes more and more concern among people every year. The main cause of climate change is greenhouse gas emissions, which have been increasing since the industrial revolution. According to the Intergovernmental Panel on Climate Change [1], the bulk of the contributions to global warming come from CO2 emissions from fossil fuel combustion and methane. Furthermore, the largest amounts of greenhouse gas emissions come from the electricity and heat sectors, accounting for approximately 16 GtCO2 in 2019 [2].
The global trend in energy development is moving towards the rapid decommissioning of coal-fired power plants and greater integration of renewable energy sources into electrical networks. Kazakhstan has also been actively involved in the Paris Agreement since 2016, reaching impressive recent achievements and launching new initiatives in the sphere of tacking climate change [3]. According to the Ministry of Energy of the Republic of Kazakhstan [4], at the end of 2022, 130 renewable energy stations operated in the Republic with a cumulative installed capacity of 2400 MW. The volume of electricity generated accounted for 5.11 billion kWh, which was 4.53% of the total electricity production. In just the last year, 12 renewable energy power plants were commissioned with a total installed capacity of 385 MW, and in 2023, the region planned to implement an additional 15 facilities with a capacity of 276 MW.
While renewable energy penetration is associated with positive effects on environmental issues, it is fraught with difficulties that need to be addressed. One of those significant technical disadvantages is the lack of rotating inertia since they are mainly connected to the grid via electronic power inverters [5]. When, for instance, wind turbines supersede massive-rotation synchronous generators operating prevalently in coal plants, it will cause huge danger in terms of grid frequency and rotor angle stability. Makolo et al. [6] investigated the impact of inertia on the grid frequency and claimed that an increased penetration of low-inertia technologies will lead to a considerable frequency drop and an increased rate of change of frequency (RoCoF). One of the examples of this is the blackout in South Australia in 2016 [7], when the frequency dropped under 47 Hz. A similar emergency occurred in 2018, when the Queensland and South Australia systems were eventually separated [8]. Considering these blackouts, Wu et al. [9,10] investigated an adaptive-under-frequency load-shedding scheme which predicts, in real time, the amount of load that must be disconnected.
The focus of this paper is on the impact of reduced inertia, induced by high wind energy penetration, on the grid rotor angle transient stability in the Mangystau region, Kazakhstan. The loss of the inertial capacity of the system means changes in the parameters in the rotor swing equation [5], and therefore changes in the conditions for the transient stability of parallel operation in power plants and electrically connected systems. The loss of synchronism (transient stability violation) is identified as the most dangerous operation mode since it is accompanied by deep voltage fluctuations at the nodal points of the electrical network [11,12], which ultimately lead to the shutdown of auxiliary units of thermal and/or nuclear power plants [13].
A significant amount of research has been performed surrounding the rotor angle stability problem with the penetration of inverter-connected renewable energy. Naik et al. [14] investigated the role of inertia in the critical clearing time of a transmission line three-phase short circuit using the potential energy boundary surface method. Liu et al. [15] applied the center of inertia method and described the transient behavior of a doubly fed induction generator (DFIG) and its contribution in terms of active and reactive power to the short circuit. He et al. [16] explored inverter-based generation (IBG) and proposed a sufficient transient stability criterion using a “delta-power-frequency” model, which allowed them to discover new mechanisms of dynamic behavior different from those of conventional synchronous generators. The notion that the aggregated inertia constant in high-renewable-energy systems becomes time-variant because of the high volatility of the power dispatch was researched and concluded by Ulbig [17]. This, in turn, appears to inevitably amplify the grid instability of power systems.
Collados-Rodriguez [18,19] analyzed transient stability and steady-state stability limits with the implementation of voltage source converters (VSCs) while reducing the installed capacity of synchronous generators, and evaluated the minimum amount of synchronous generation that provides the grid with stability. Vittal [20] investigated an interesting relationship between wind generation reactive power control and the rotor angle stability of the synchronous generators in the system. It turns out that voltage and reactive power control is supposed to ease the reactive power burden and voltage issues of synchronous generators. This fact was also proven in [21], wherein the authors compared the impact of different DFIG control techniques on the power systems’ small-signal and transient stability and concluded that DFIGs with a voltage control mode can enhance the synchronous generators’ rotor angle stability situation compared to those with a “power-factor” control mode. Tina [22] investigated potential solutions, such as utilizing a static var compensator (SVC) or static synchronous compensator (STATCOM) and building a new transmission line, to improve the rotor angle and frequency stability with high DFIG penetration.
All of the above studies considered a three-phase short circuit and its subsequent elimination without involving the operation of automatic reclosing. However, in the Unified Power System of the Soviet Union, of which the Unified Power System of Kazakhstan was a part until 1991, the standardization of transient stability was carried out by specifying a list of disturbances under which transient stability should not be violated.
In this work, we will consider the real scheme of the Mangystau electrical network. In addition, real parameters of generators, transformers, and power lines will be considered. Thus, the inertial constants that will appear in this model and analysis of transient processes will be related to the nominal parameters of power-plant generators. This makes it possible to determine the limiting fraction of replaceable synchronous generation at which a violation of transient stability is not observed. In addition, all 220 kV power lines are equipped with an automatic reclosure scheme. Therefore, in this work, we will consider a scenario where the intersystem transmission line is turned off by the action of the protection and turned back on by the still-existing short circuit. This is the most severe emergency mode, in which, according to regulatory rules, transient stability must be ensured.
However, it is not sufficient to identify the maximum physically feasible amount of replaceable synchronous generation. The problem is that the power system becomes much more vulnerable to contingencies when a significant amount of synchronous generation is superseded by inverter-based DFIG technology. This problem can be solved by implementing smart-grid solutions. With the development of power electronics and converter industry, it is possible to obtain precise measurements through wide-area measurement system (WAMS) technology and build new emergency control systems using wide-area control systems (WACSs) [23,24,25,26].
Hence, the adverse influence of reduced inertia can be addressed by implementing a novel Flexible Automatic Dosage of Exposures. This automation obtains measurements from the WAMS and issues appropriate control actions such as adjusting the line auto-reclose timing, adjusting the amount of load shedding in the Mangystau region, and employing generation limitation in surplus regions (the Unified Power System of Kazakhstan).
The main contributions of this paper can be summarized as follows:
(a)
This is the first attempt to analyze the impact of the replacement of synchronous generation on rotor angle transient stability using a real power system in the Mangystau region, Kazakhstan.
(b)
This is the first attempt to consider a more severe emergency mode that is applicable in practice while exploiting the power system.
(c)
Based on actions taken to analyze the impact of the replacement, this study proposes a method for identifying the maximum allowable amount of synchronous generation that can be replaced with renewable energy technologies to still have a transiently stable power system.
(d)
Increasing the auto-reclose delay time mitigates the exposure of the synchronous generators to the considered emergency mode and increases the transient stability.
(e)
The application of special load-shedding automation succeeds in avoiding the loss of synchronism with high renewable energy penetration.
(f)
This paper provides an appropriate smart-grid solution by implementing the Flexible Automatic Dosage of Exposures, which enhances the power system’s stability with a high penetration of non-inertial generation.
These contributions are achieved by executing the following tasks:
(1)
Modeling a real diagram of the Mangystau power system.
(2)
Linking the inertial constant to the nominal parameters of existing synchronous generators of the Mangistau energy system.
(3)
Setting the fault using a three-phase short circuit on the 220 kV intersystem transmission line with subsequent tripping action via relay protection and automatic reclosure action. In this case, the line is switched on for an unresolved short circuit, and the line is switched off again by the action of the protection.
(4)
Identifying the maximum possible share of DFIG generation that can replace synchronous generators.
(5)
Identifying the influence of the automatic-reclosure response time delay on a faulted line, as a means of enhancing the transient stability of the power system with high DFIG integration.
(6)
Identifying the influence of the magnitude of load shedding as a means of improving transient stability under the conditions of high DFIG integration.
(7)
Providing an algorithm by which the Flexible Automatic Dosage of Exposures works.
This simulation process is carried out using the PowerWorld Simulator 23.

2. Theoretical Philosophy of Transient Stability and Equal Area Criterion

Let us consider a generic diagram with one generator connected to a large system with a single-machine infinite bus (SMIB). Figure 1 shows the circuits of a synchronous generator connected to the SMIB in pre-emergency, emergency, and post-emergency modes. It is supposed that the generator is generating a certain amount of active power P. The equivalent reactance of the network, through which the generator is delivering the active power, is identified as follows:
X = x d + x t + x l 1 = x l 2 2 ,
where x d is the transient reactance of the generator, which is inside the generator itself; x t is the reactance of the transformer; x l 1 = x l 2 is the reactance of transmission line 1, which is identical to line 2.
The relationship between power P, the absolute values of E´ and V, and the angle δ between them can be defined using the phasor diagram shown in Figure 2. On the diagram, there are active and reactive components of the current (Ia and Ir). The current itself is derived from the power that the generator dispatches. Correspondingly, lengthwise (Ir·X) and transverse (Ia·X) components of the voltage drop (I·X) are shown. The electromotive force E´ and voltage V are represented in phase values. The equation follows from the diagram:
I a · X = E · s i n ( δ )
Multiplying both sides of the equation by 3·V/X, we obtain
3 V · I a = 3 E · V x · sin δ = E L L · V L L x · sin δ
where E L L and V L L are line-to-line values.
Knowing that the three-phase power P = 3·Vphase Ia, the following equation is derived:
P = E L L · V L L X   s i n ( δ )
Equation (4) is called the angular characteristic of a generator. Using this formula, it is possible to draw an angular characteristic diagram for each of the three modes shown in Figure 3. This figure elucidates the change in angular characteristics and angle δ between the electromotive force of the generator and voltage of the SMIB.
Thus, the angular characteristic (I) corresponds to the pre-emergency mode, when all power lines are turned on and no accident occurs. Angle δ from Formula (4) corresponds to point 1 in Figure 3. Consequently, the value of the difference in the angle between the generator and the SMIB in the pre-emergency mode is equal to δ1. Further, when a three-phase short circuit occurs, due to a considerable voltage drop and power output decrease, the circuit and angular characteristics take the form corresponding to (II). At the same time, the electrical power supplied by the generator is significantly reduced, and the turbine power has not yet had time to decrease during the transient process. As a result, the turbine begins to accelerate the generator rotor, which leads to an increase in its relative angle. The increase in the angle value continues until the moment when the short circuit is eliminated by the action of the protection. At the moment when the damaged line is disconnected, the circuit and angular characteristics take the form corresponding to (III), since one line is disconnected and the equivalent impedance is increased, which leads to a decrease in the angular characteristic. At point 4, as can be seen from the figure, the electrical power exceeds the turbine power. This, in turn, leads to sharp decelerating of the generator rotor. However, the rotor angle still increases up to point 5. At this moment, automatic reclosure occurs for an unresolved short circuit. The process for points 1–5 is repeated at points 5–9. Point 9 is the moment when all of the stored kinetic energy has dissipated, and the generator is pulled into synchronous operation with the power system. The rotor angle goes to the value indicated at point 1’. However, if point 9 crosses the critical value of the rotor deflection angle (δcrit), then the synchronous machine will fall out of synchronism with the power system and an asynchronous mode would arise. The condition for maintaining transient stability is that the total decelerating areas (S3 and S4) must be greater than the total acceleration areas (S1 and S2). The formula for meeting this condition is derived from Figure 3 through the integration of functions between an appropriate range of angles:
δ 1 δ 3 P m e c h P 2 max sin δ d δ + δ 5 δ 7 P m e c h P 2 max sin δ d δ δ 3 δ 5 P 3 max sin δ P m e c h d δ + δ 7 δ 9 P 3 max sin δ P m e c h d δ
In a case when the generator is very close to the short circuit, its supplied electrical power is equal to zero. From the swing Equation (5), it is possible to derive the value of the maximum deviation of the rotor angle with a known and constant tripping time of the damaged section for the scenario when automatic reclosure is not used. The swing equation has the following form:
H π f 0 d 2 δ d t 2 = P m e c h a n i c a l P e l e c t r o m a g n e t i c
where H is the inertia constant (seconds); f 0 is the nominal frequency of 50 Hz; P m e c h a n i c a l is the mechanical power output of the turbine; P e l e c t r o m a g n e t i c is the electromagnetic power output of the generator; δ is the electrical voltage angle relative to the SMIB.
When the three-phase short circuit occurs near the generator, its electrical power output becomes almost zero. Therefore, the swing equation takes the following form:
H π f 0 d 2 δ d t 2 = P m e c h a n i c a l
or
d 2 δ d t 2 = π f 0 H   P m e c h a n i c a l
Integrating both sides will give
d δ d t = π f 0 H   P m e c h a n i c a l   0 t d t = π f 0 H   P m e c h a n i c a l · t
Integrating the obtained equation again, we obtain
δ max = π f 0 2 H P m e c h t 2 + δ 0
From Equation (10), it is clear that with a constant initial relative angle and power output in the pre-emergency mode, as well as a constant short-circuit tripping time, the value of the maximum deviation of the relative angle depends inversely on the inertial constant. In other words, the lower the inertial constant of the generator/system is, the higher the maximum angle deviation during the transient process will be. However, in this work, it is not possible to calculate relative angles using Equation (10) due to the system having several synchronous machines, and the emergency operation process is very complex. To calculate the stability of multi-machine systems with complex transient processes, the method of numerical integration of the rotor motion equation is used [5,10,27]. Modern software such as DigSilent PowerFactory 15.1, ETAP 22, PSSE 22, PowerWorld Simulator 23, etc. allow the execution of stability calculations in systems of any complexity.
To assess transient stability, the transient stability index is used, determined using the following formula [28]:
T S I = 360 ρ max 360 + ρ max 100
where ρ max is the maximum deviation of the rotor angle relative to the base machine (equivalent to the Kazakhstan system on Substation 4). A system is considered dynamically stable if the transient stability index is greater than zero.

3. Materials and Methods

3.1. Configuration of the Mangystau Energy System

Main components of the system:
The electrical power system under study consists of three main coal-fired power plants: Stations 1, 2, and 3.
There are 110 kV Open Switchgears at Station 1 and 2, while Station 3 has both 110 and 220 kV Open Switchgears.
The given transmission network is connected to the rest of the Unified Power System of Kazakhstan through two 220 kV lines between Station 3 and Substation 4. All of the generators in Stations 1, 2, and 3 rotate in synchronism with the aggregated Unified Power System. Substation 4 is the slack bus.
Figure 4 shows a single-line diagram of the Mangystau power system. This diagram was built based on the map of the Unified Power System of Kazakhstan, which is publicly available on the website of the system operator [29]. In addition, all missing rating data and resistance and dynamic characteristics of the generators, transformers, and power lines (power lines) were taken from the reference book for designing electrical power systems.
Composition of turbogenerators:
Table 1 shows the composition of turbogenerators for Stations 1, 2, and 3 with their nominal apparent capacities, moments of inertia, and transient and synchronous reactance values.

3.2. Aggregation and Calculation of Network Parameters of the Mangystau System

The equivalent inertia is the sum of all inertial constants reduced to one common basis. The resistances of all generators are collected in parallel into one equivalent. The details of dynamic aggregation have been described in detail in [30]. Thus, in this work, the Station 1 and Station 2 generators are presented as one equivalent in order to simplify the circuit. At Station 3, each generator block is modeled separately, since they are the most powerful and largest, have the largest inertial constants, and are in close proximity to the short-circuit point.
A. 
Calculation of the inertia of the turbogenerators
The moments of inertia for the synchronous generators are given in Table 1. However, for this analysis, it is necessary to convert each moment of inertia into a per-unit inertia constant [5]:
H = W k S n o m c
where W k is the stored kinetic energy of rotating motion (Joules); S n o m is the rated apparent power of the generator (Volt·Amps).
The kinetic energy is determined according to Newton’s second law of rotating motion:
W k = 1 2 J ω 2
where ω = 2 π f is the angular velocity; f is the nominal network frequency, 50 Hz.
In order to determine the dependence of maintaining transient stability in relation to the rated power of the system, it is necessary to bring all of the inertial constants of all turbogenerators under one basis. The basis is taken equal to Sb = 100 MVA, which allows all calculations to be carried out in relative units:
H S b = 100 M V A = H S n o m S n o m S b c
The equivalent inertial constant is obtained by adding all of the inertias of the turbogenerators connected to the power system:
H = H i c
where i is the turbogenerator index.
B. 
Calculation of the system element reactance values
  • Generator reactance
The values of transition and synchronous resistance in relative units are taken from the reference data for the generator. Transient reactance is taken to analyze the transient processes. Synchronous resistance is used to calculate the normal conditions and steady-state short-circuit current after saturation of the generator magnetic system. For each of these parameters, resistances are calculated using the formulas below:
x g = x d x d S b S n o m
Transformer reactance:
x t = x t % 100 S b S n o m
The x t % value is calculated from the short-circuit voltage (%), which is indicated in the transformer data sheet. For a two-winding transformer,
x t % = u K %
Power line inductive resistance:
x l = x s p l S b U b 2
where x s p is the wire-specific reactance (Ohm/km); l is the line length (km); Sb is the base power (MVA); and Ub is the base voltage, which is selected for a specific section of the network (kV).
The equivalent resistance of the system is calculated by connecting all generators connected to the network in parallel, connecting the transformers and power lines in series and parallel, and converting the equivalent star to delta, and vice versa. The equivalent circuit conversion formulas are presented in [5].
Table 2 shows the results of the calculations of equivalent generator resistances and inertial constants. Inertial constants are given under a common basis. When decommissioning a specific generator unit, its inertial constants will be subtracted from the total. Table 3 and Table 4 present the electrical parameters of the connecting power lines and transformers.

3.3. Setting the Pre-Emergency Mode

The task of the pre-emergency mode is to solve the problem of power flows throughout the entire circuit. To do this, it is necessary to set load on the nodes, determine the active power of the generators and terminal voltage, and determine the slack bus. Substation 4 220 kV is considered as a slack bus with a voltage of 1 per unit and an angle equal to 0 degrees. Table 5 and Table 6 show the operating data for the loads and generators.

3.4. Actions and Assumptions for Achieving the Goal

The following are included in our analyses:
The replacement of the dynamic model of the generators, from a synchronous machine model to a default WTG3 model, as shown in Figure 5 [31]. In this case, the inertial constant of the replaced stations becomes equal to zero.
The sequence for replacing the synchronous generators, as shown in Figure 6—Station 2 (250 MW generation, H = 11.5 s), Station 1 (75 MW generation, H = 1.998 s), and G-3 Station 3 (20 MW generation, H = 2.604 s).
Simulation and analysis of the rotor angle behavior of the synchronous generators remaining in operation during a three-phase short circuit on the Station 3 220 kV–Substation 4 220 kV lines and its automatic reclosure.
Transient stability analysis, carried out using PowerWorld software 23.
In addition, three main assumptions are made:
The intermittency of power generation from the DFIGs is neglected. In other words, all DFIG technologies are equipped with storage systems.
The location of DFIG stations is neglected due to the fact that there are no real projects for the implementation of wind power plants of such relatively high power. The replacement of stations based on synchronous machines using DFIG technologies is carried out exactly at the location of the replaced stations.
The work of automatic excitation control (AEC) and primary frequency control via governors is neglected in the dynamic simulation.
Our focus is only on the generators’ rotor angle transient stability.
Figure 6 shows the output of active power from the DFIGs and synchronous generators and equivalent inertia of the Mangystau part of the power system in relation to the share of DFIG technology integration. Thus, with 0% wind integration, 475 MW is released from the stations with synchronous machines and the Unified Power System. Station 2 supplies 250 MW and when it is replaced by DFIG technology, it turns out that 250 MW is generated from the DFIGs, and 225 MW is generated from the synchronous machines (53% of the generation is from renewable energy sources). This reduces the equivalent inertial constant since Station 2 had an inertia of 11.5 s. At 73% of generation from renewable energy sources, 130 MW is supplied from synchronous machines and the Unified Power System (20 MW each from G-1 and G-2 thermal power plants and 90 MW from the Unified Power System).
Thus, implementing these actions, it is possible to accurately simulate the transient processes with the already-calculated initial parameters shown in Table 2, Table 3 and Table 4. By replacing the model of generators with WT3G, the inertias automatically become zero as well as their rotor angles. The rotor angle oscillations of the remaining generators will change correspondingly to the amount of inertia remaining in the power system.

4. Results

Simulations of changes in the electrical and electromechanical parameters of the system during the transient process were performed in accordance with the tasks listed in Section 3. Since the major focus of this paper is the rotor angle stability, only the rotor angle oscillation simulations are shown and analyzed. Additionally, the rotor angle values of every generator are relative to the Unified Power System equivalent located at Substation 4.
Table 7 describes the schedule of actions taken to implement the simulations of transient processes at each scenario. The first two actions are identical in every scenario.
Below are descriptions of each scenario:
(1)
A total of 0% generation from DFIGs—the base scenario in which the generators of each station are synchronous. Equivalent inertia: 22.26 s.
(2)
A total of 53% generation from DFIGs—the replacement of synchronous generators at Station 2. In this scenario, the rotor angle of the equivalent generator of Station 2 becomes zero since DFIGs do not have rotor angle physically. Therefore, those generators replaced by DFIGs are ignored. Equivalent inertia: 10.76 s.
(3)
A total of 68% generation from DFIGs—the replacement of synchronous generators at Station 1. The remaining synchronous machines are G-1, G-2, and G-3 at Station 3. Equivalent inertia: 8.76 s.
(4)
A total of 73% generation from DFIGs—the replacement of one synchronous generator at Station 3 (G-3). In this scenario, the system is supported by only two Station 3 synchronous generators (G-1 and G-2). Equivalent inertia: 6.16 s.
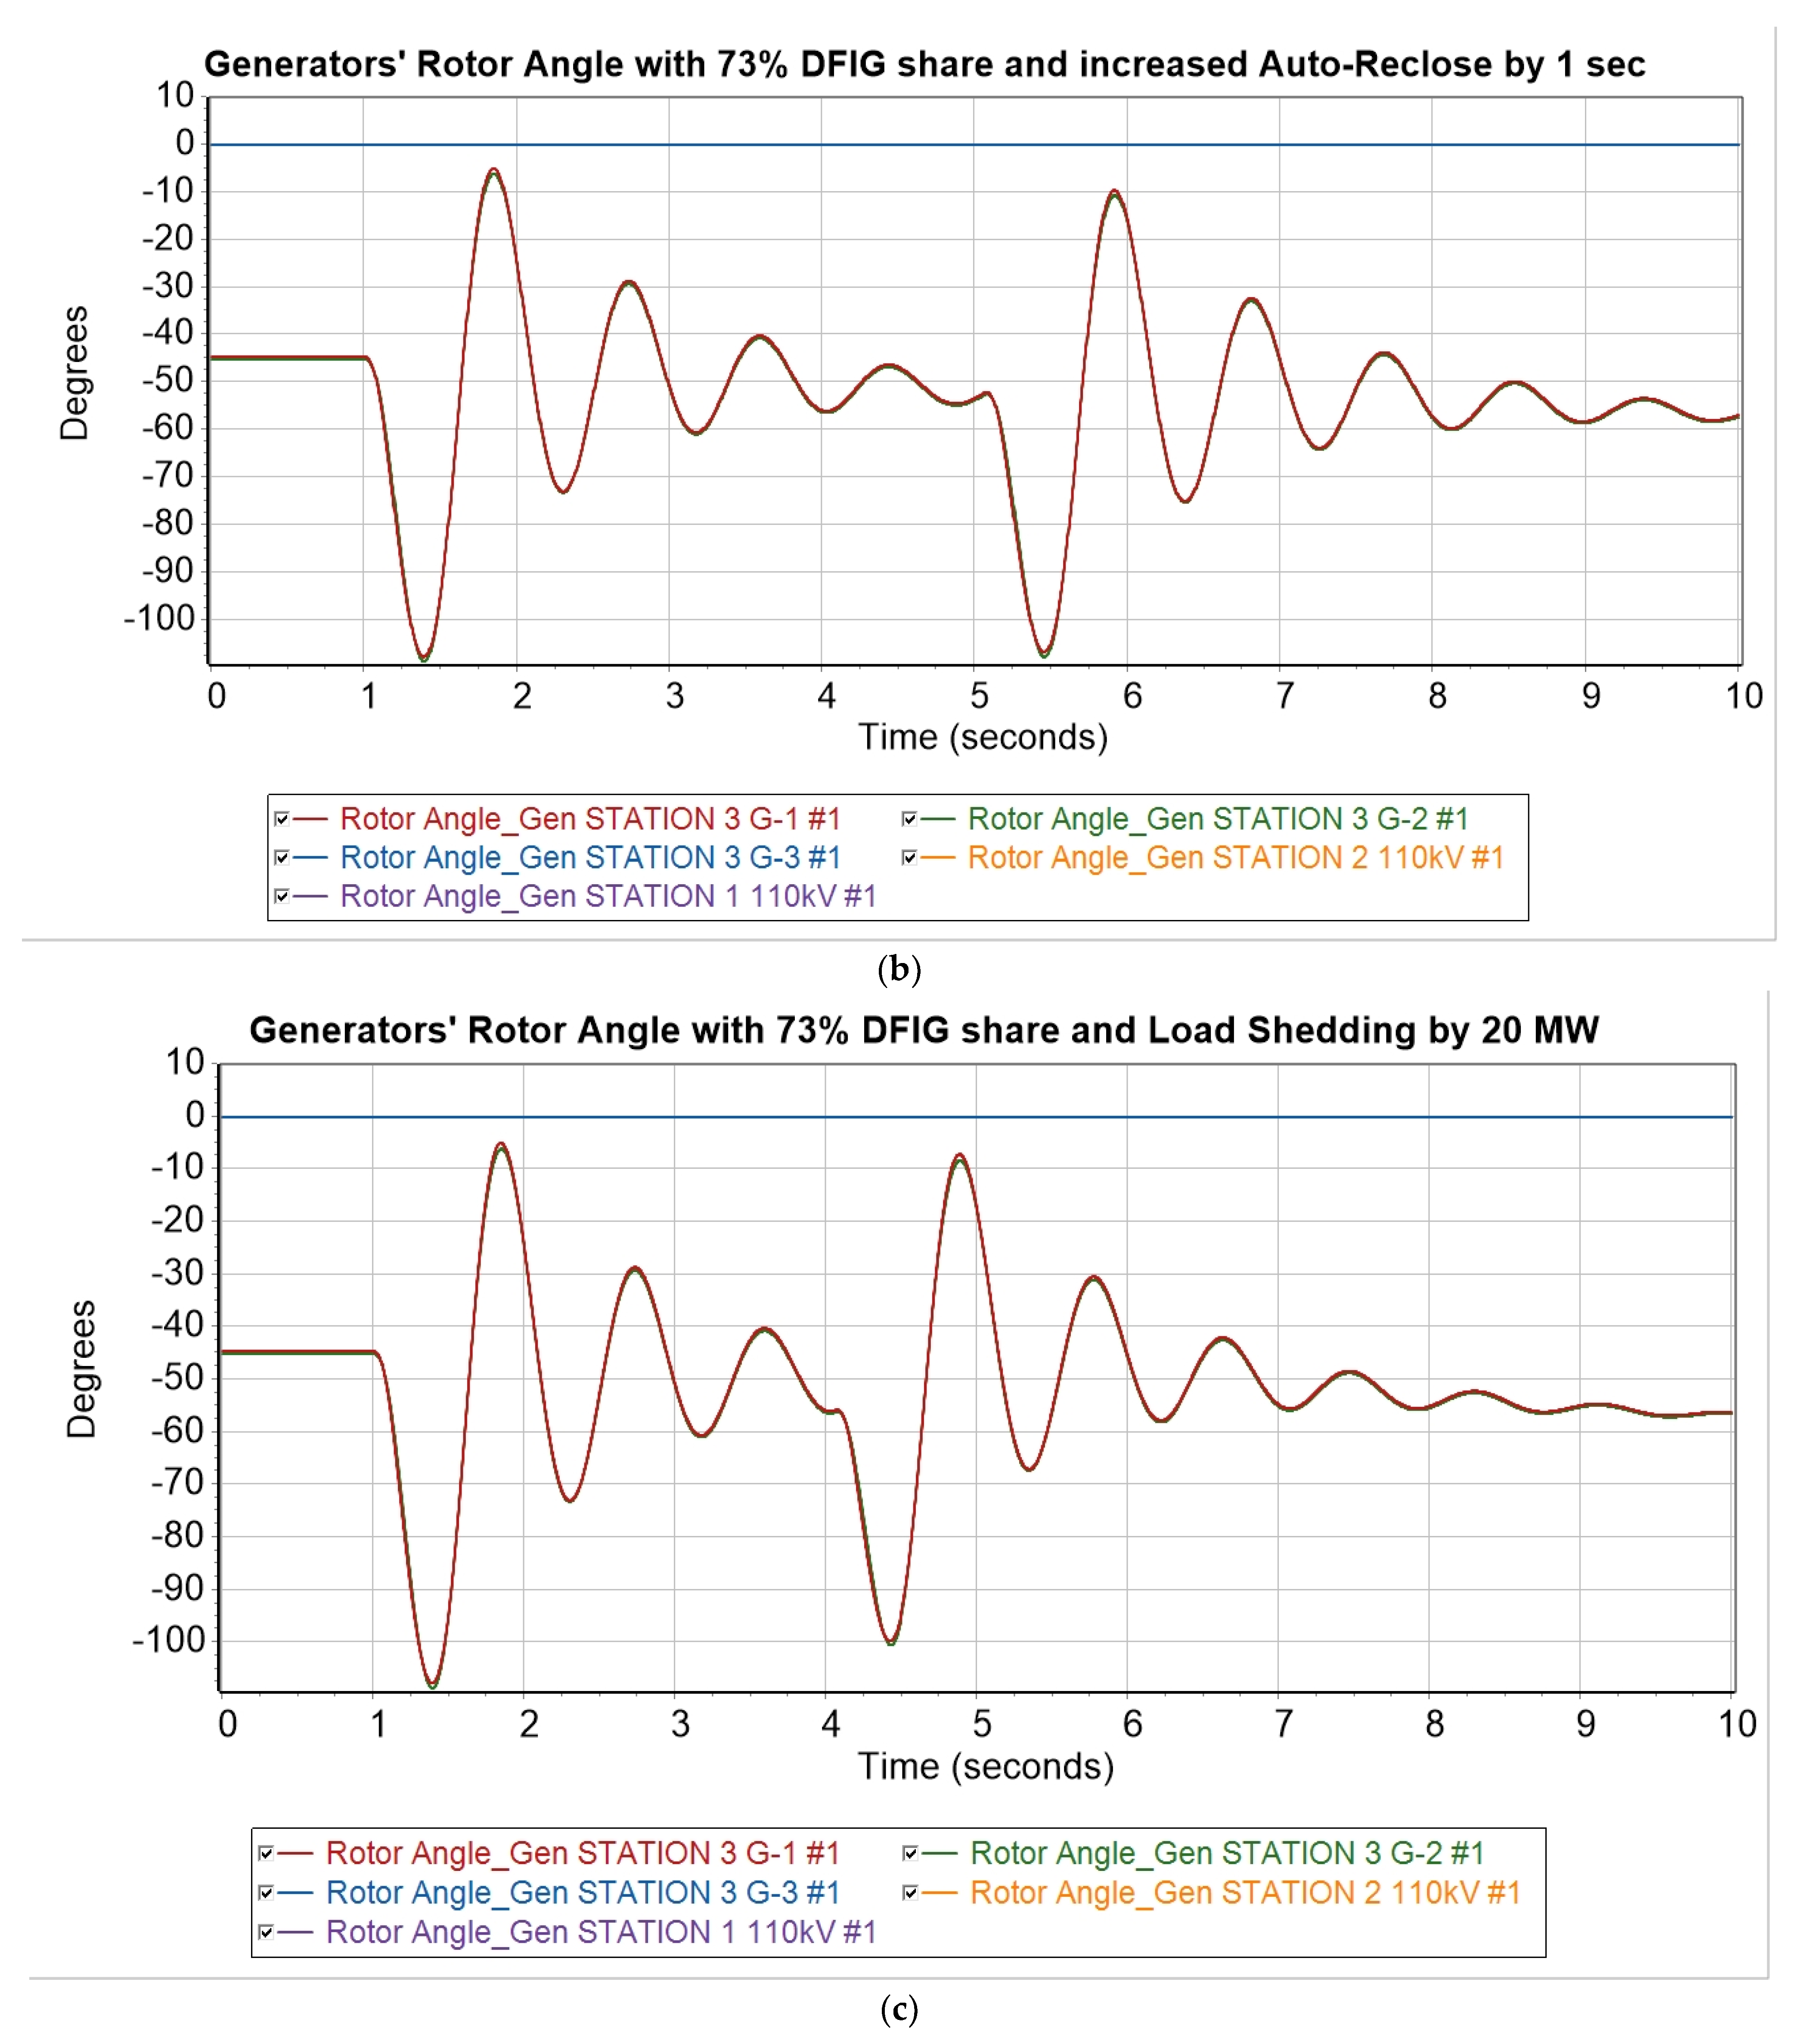
(5)
A total of 73% generation from DFIGs and an increase in the automatic reclosure time by 1 s—a scenario similar to scenario 4.
(6)
A total of 73% generation from DFIGs with a disconnection of 20 MW of load on Substation 2—a scenario similar to scenario 4, but with part of the load disconnected via special load-shedding automation (SLSA) as a means of preventing instability.
Scenarios 1–3
From Figure 7, Figure 8 and Figure 9, the transient stability is maintained up to a generation share of 68% from DFIGs. The deviation of the relative angles of the rotors of synchronous generators is maintained within the permissible values so that the generators do not fall out of synchronism. Nevertheless, the deviation values of the rotor angle of each generator, especially those located at Station 3, increase substantially as the share of DFIG generation enlarges accordingly. For instance, the highest rotor angle deviation of G-1,2,3 at Station 3 with a 0% DFIG share is around −62 degrees. When the share of DFIG generation becomes 53%, the highest deviation point becomes approximately −90 degrees. Under a 68% DFIG share, when Station 1 and 2 are fully superseded by wind generation, the highest rotor angle deviation is concentrated around −120 degrees, and this is, probably, the stability limit point.
Scenario 4
With a 73% generation from DFIGs, the Mangystau system becomes dynamically unstable to a three-phase short circuit with a failed automatic reclosure. From Figure 10, it is clear that when such a severe emergency occurs, the synchronous generators G-1 and G-2 remaining in operation are physically unable to maintain stability in the system and fall out of synchronism. The relative angle of the rotors exceeds a critical value, and then it is no longer possible to return to the original state. Interestingly, during the first cycle of the short circuit (before the automatic reclosure operation), the generators are able to maintain synchronism. However, at 4.06 s, when the auto-reclose scheme closed the circuit breakers of the line to create a stable three-phase short circuit, the generators could not endure such a severe emergency mode and again fell out of synchronism.
It is worth noting that even if the transient stability is maintained at 53% and 68% wind generation, the transient stability index gradually weakens as the equivalent inertial constant decreases. This can be seen in Figure 11, where with a 0% DFIG share, all five synchronous machines shown have a high transient stability index value (above 70%). However, with the gradual replacement of generators with DFIG technologies, the remaining synchronous machines in operation lose a certain percentage of their stability index values. This is because with reduced equivalent inertia, the maximum rotor deflection angle increases (see Equation (10)). So, for example, in scenario 4, when the two synchronous machines remaining in operation (G-1 and G-2) fall out of synchronism, the relative rotor angle exceeds the critical value and goes on to infinity until the emergency automation operates. In this regard, the stability index of these generators reaches a negative value of almost 100%.
Scenarios 5–6
If the delay time of the automatic reclosure operation is increased, the power system tends to have more time to return to a normal steady state before undergoing the following emergency mode. Thus, the increased reclosure operating time has a positive effect on the transient stability.
Figure 12b shows the rotor angle deviation under scenario 4 with the auto-reclose time delay increased by 1 s. With a 73% DFIG generation share, G-1 and G-2 at Station 3 obtain the ability to maintain synchronism. The highest angle deviation is around −120 degrees, which is close to that of the 68% DFIG share state. Therefore, it can be concluded that increasing the auto-reclose time delay will enhance the ability of the remaining synchronous generators to stabilize after such an emergency mode with high DFIG penetration.
As regards load shedding, this action reduces the power supplied by synchronous generators by an amount equivalent to the load that is switched off. From Equation (10), the lower the released active power of the generator, the smaller the maximum rotor deflection angle relative to a large power system. Figure 12c describes the rotor angle deviation with the 73% DFIG generation share and 20 MW load shed. The auto-reclose scheme works at 4.06 s. It is seen from the figure that the load shedding allows the generators to maintain transient stability. Thus, special automatic load shedding can improve transient stability in the power system.
Figure 13 describes the dependence of the transient stability index and the operating time of the automatic restart. Initially, the operating time was 3 s after the line trip. By increasing the time delay by 0.5 s, the stability index increased to 40%.
Figure 14 illustrates the dependence of the transient stability index in relation to the magnitude of the disconnected load. Thus, starting from the switched load value of 20 MW, the transient stability index sharply increases to 50%, which means that the conditions required for maintaining dynamic stability in the power system are met.

5. Flexible Automatic Dosage of Exposures Algorithm

As described in the Results section, a high penetration of DFIG generation has a detrimental effect on the transient stability of the power system. Nevertheless, both an increased timing of the auto-reclose scheme and the special load shedding automation can enhance the transient stability of the Mangystau power system.
Thus, it is possible to build a system that can manipulate these two enhancement solutions to make the system more flexible, environmentally friendly, and stable.
The Flexible Automatic Dosage of Exposures (FADE) must use SCADA and WAMS measuring techniques. With the advance of telecommunication systems, it can influence the system through WACS techniques. All of the measurements, signals, and control exposures must be sent using the IEC 60870-5-104 protocol.
The FADE scheme takes under control several input regime parameters:
The state of the synchronous generators—switched on/off via SCADA systems. Owing to the commutation state of the generators, it can derive the equivalent amount of inertia in the power system using Equation (15). For instance, with 73% of the synchronous generators replaced by DFIGs, there are only G-1 and G-2 remaining at Station 3. The total equivalent inertia is 6.16 s. However, if G-2 is switched off for repairment, the amount of inertia reduces by around 3 s. Thus, the power system deteriorates in terms of transient stability. In other words, with the control of inertia, we have the dynamic state of the power system with respect to the transient stability.
The power output of the synchronous generators. With, for example, little wind power (because of weather conditions), the amount of power output from the synchronous generators increases in order to meet the frequency constraints. However, with a high power output, the power system might be much closer to the transient stability limit (Equation (10)). In other words, the power system would breach the stability limit and fall out of synchronism. It is assumed that G-1 and G-2 have a uniform power output.
Having obtained these inputs, it is possible to choose the timing of the auto-reclose scheme combined with the load-shedding parameters. Figure 15 describes the organizational structure of the Flexible Automatic Dosage of Exposures. It is proposed that the algorithm is fulfilled in the Central Dispatching Point of the Mangystau power system. It receives the remote measuring (RM) and commutation state of the circuit breakers (RS). It is crucial to state that the auto-reclose timing is set in advance based on the inertia and power output of the synchronous generators. The rest of the control exposures are triggered by the open state of one of the Station 3–Substation 4 220 kV lines, together with the closed contacts of the relay protection operation and automatic reclosure start.
The FADE algorithm implements control exposures, which include the following:
Auto-reclose timing (t1, t2, etc.), which is sent to the auto-reclose scheme inside the protection and automation cabinet of the two 220 kV transmission lines between Station 3 and Substation 4.
Load shedding (LS1, LS2, etc.), which is implemented at load nodes with no generation.
Generation limitation, which is sent to the surplus Unified Power System of Kazakhstan. This control exposure is executed only if the load shedding has already been operated.
Network division. This option is necessary if it is obvious that transient stability is not maintained. This network division separates the Mangystau power system from the Unified Power System of Kazakhstan.
Moreover, when network division occurs, the Mangystau power system becomes isolated and needs to regulate its frequency. Therefore, the FADE scheme must order the implementation of the Fast Frequency Response and Virtual Inertia Response for battery storage facilities that utilize DFIGs. As for the synchronous generation, the FADE scheme implements a simple Primary Frequency Response if the generators have a certain amount of power reserve.
Table 8 and Table 9 present the Flexible Automatic Dosage of Exposures parameters. Thus, the amount of control exposures explicitly depends on the total power system inertia and the power output of the synchronous generators. These control exposures are chosen with the purpose of maintaining transient stability after the three-phase short circuit and operation of the auto-reclose scheme. With an increase in the power output of G-1 and G-2, the auto-reclose timing is increased. A load-shedding control exposure is implemented when the remaining synchronous generators dispatch higher than a certain amount of power. The higher the power output, the higher the load-shedding amount. If either G-1 or G-2 dispatch more than 100 MW, it is not possible to maintain transient stability. Therefore, the network division control exposure is activated and the auto-reclose scheme is blocked.
Should one of those generators be switched off for repairment or other reasons, the total inertia would be reduced by around 3 s. Hence, the FADE scheme becomes stricter (Table 9).
Nevertheless, the FADE scheme allows the power system to integrate 73% DFIG generation while phasing out 725 MW of the coal-fired stations’ installed capacity.

6. Conclusions

1.
According to the research papers mentioned in the Introduction section, the transient stability of synchronous generators is dependent on many factors:
The nature of contingencies—e.g., a one, two, or three-phase short circuit, the presence of an auto-reclose scheme, a stable or unstable short circuit, etc.;
The location of the short circuit on the line and its distance from a generator.
The fault elimination time and circuit breakers’ tripping time;
The voltage control devices of the generators involving those coming from renewable energy sources, and the availability of excitation-boost devices;
The pre-emergency mode—the amount of power generated from each synchronous generator (Equation (10)), the voltages at each node, and the power flow through the interconnection line;
The infrastructure of the facility—e.g., the availability of parallel transmission lines and their quantity.
According to the results of scenarios 1–4, in the steady-state mode analyzed in this paper, the share of power generation from wind units should not exceed 68% or 325 MW out of the total active power generation. From the analyses of scenarios 1–3, transient stability can be maintained according to the physical abilities of the remaining synchronous generators. Thus, only the generators at Station 1 and 2 can be physically replaced by DFIG technology. In scenario 4, there was the last generator (G-3 at Station 3, with an inertia of 2.604 s) replaced by a DFIG. This action entailed the loss of synchronism of the two synchronous generators remaining in operation, since the reduced equivalent inertia was not enough to overcome the stable three-phase short circuit and the line’s automatic reclosure.
Even though the DFIG share of 68% in this studied mode is a boundary condition for maintaining stability, this is not guaranteed. In other words, if we consider many modes, when the active power generation of the synchronous generators changes, the marginal share of power generation from DFIGs changes accordingly. For example, with a greater power generation from G-1, G-2, and G-3 at Station 3, the transient stability may be violated, even at 53% power generation from DFIGs. Therefore, these facts lead us to the conclusion that the project of replacing synchronous generators must be investigated carefully and consider a lot of possible modes. Moreover, once the coal-fired stations are replaced, the planning system inevitably must be modified and become more flexible.
2.
Scenarios 5 and 6, analyzed in the Results section, have proved the notion that increasing the auto-reclose delay time and utilizing special load-shedding automation could be successful strategies to enhance the stability of the Mangystau power system. Both methods prevented the system from falling out of synchronism with a 73% share of DFIG generation (or with the replacement of G-3 at Station 3). In addition, these two strategies are extremely simple and free from investments since they have already been implemented. Nevertheless, the load-shedding strategy is fraught with more consumers being disconnected from the grid, which could deteriorate the quality of business and production in other sectors.
3.
A new Flexible Automatic Dosage of Exposures algorithm has been proposed in this paper. This algorithm offers a promising solution to address the difficulties associated with superseding coal-fired synchronous generation with doubly fed induction generators in the Mangystau power system. By manipulating the auto-reclose timing and load-shedding parameters, FADE presents the capability to ameliorate transient stability, thereby providing the system with heightened flexibility, environmental sustainability, and operational reliability.
Leveraging sophisticated SCADA and WAMS technologies, alongside advancements in telecommunication systems, FADE obtains the input regime parameters. They, in turn, encompass the operational status of the synchronous generators and their power outputs. Such comprehensive data inputs facilitate FADE’s calibration of control exposures, involving the auto-reclose timing, load-shedding allocation, generation limitation, and potential network division scenarios.
In recapitulation, the FADE scheme embodies a scientific and adaptive operation for addressing transient stability within power systems grappling with heightened DFIG penetration. Its implementation not only underscores a pathway towards resilience and stability within the Mangystau region’s power system but also provides broader insights into mitigating similar challenges faced globally.

Author Contributions

Conceptualization, Y.A.; methodology, K.T. and K.B.; software, Y.A.; validation, S.S. and Y.A.; formal analysis, A.Z. and K.T.; investigation, Y.A. and K.T.; resources, Y.A. and A.Z.; data curation, Y.A. and A.Z.; writing—original draft preparation, Y.A., S.S., K.T. and A.Z.; writing—review and editing, K.B., Y.A. and A.Z.; visualization, Y.A. and K.T.; supervision, A.Z.; project administration, A.Z., S.S. and K.T.; funding acquisition, Y.A. and K.B. All authors have read and agreed to the published version of the manuscript.

Funding

This research was funded by the Almaty University of Power Engineering and Telecommunications, named after G. Daukeyev.

Data Availability Statement

Data are contained within the article.

Acknowledgments

This work received financial support from the Almaty University of Power Engineering and Telecommunications, named after G. Daukeyev, and was performed at the Institute of Energy and Green Technologies, which is gratefully acknowledged by the authors.

Conflicts of Interest

The authors confirm that they have no conflicts of interest with respect to the work described in this manuscript.

References

  1. Intergovernmental Panel on Climate Change (IPCC). Climate Change 2022. Mitigation of Climate Change; IPCC: Geneva, Switzerland, 2022. [Google Scholar]
  2. Ritchie, H.; Roser, M.; Rosado, P. CO2 and Greenhouse Gas Emissions. 2020. Available online: https://ourworldindata.org/co2-and-greenhouse-gas-emissions (accessed on 12 December 2023).
  3. Government of Kazakhstan (GOV.KZ). Kazakh Prime-Minister Askar Mamin Took Part in the UN Climate Change Conference (COP26) in Glasgow, Reaffirming the Country’s Commitment to the Global Climate Change Agenda. 2021. Available online: https://www.gov.kz/memleket/entities/mfa-zagreb/press/news/details/278599?lang=en#:~:text=Kazakhstan%20signed%20the%20Paris%20Agreement%20on%20November%204%2C%202016 (accessed on 6 December 2016).
  4. Ministry of Energy of Republic of Kazakhstan. Development of Renewable Energy Sources. 2023. Available online: https://www.gov.kz/memleket/entities/energo/activities/4910?lang=en (accessed on 6 December 2016).
  5. Glover, D.; Overbye, T.; Sarma, M. Power System Analysis and Design, 6th ed.; Cengage Learning: Boston, MA, USA, 2015. [Google Scholar]
  6. Makolo, P.; Zamora, R.; Lie, T. The role of inertia for grid flexibility under high penetration of variable renewables—A review of challenges and solutions. Renew. Sustain. Energy Rev. 2021, 147, 111223. [Google Scholar] [CrossRef]
  7. Australian Energy Market Operator (AEMO). Black System South Australia. 28 September 2016; AEMO: Melbourne, Australia, 2017. [Google Scholar]
  8. Australian Energy Market Operator (AEMO). Final Report–Queensland and South Australia System Separation on 25 August 2018; AEMO: Melbourne, Australia, 2019. [Google Scholar]
  9. Wu, X.; Dai, J.; Tang, Y.; Xue, F. Adaptive under-frequency load shedding scheme forpower systems with high wind power penetrationconsidering operating regions. IET Gener. Trans. Dist. 2022, 16, 4400–4416. [Google Scholar] [CrossRef]
  10. Miller, N.W. Keeping It Together: Transient Stability in a World of Wind and Solar Generation. IEEE Power Energy Mag. 2015, 13, 31–39. [Google Scholar] [CrossRef]
  11. Papadopoulos, P.N.; Milanovic, J.V. Probabilistic Framework for Transient Stability Assessment of Power Systems with High Penetration of Renewable Generation. IEEE Trans. Power Syst. 2017, 32, 3078–3088. [Google Scholar] [CrossRef]
  12. Kawabe, K.; Tanaka, K. Impact of Dynamic Behavior of Photovoltaic Power Generation Systems on Short-Term Voltage Stability. Power Syst. IEEE Trans. 2015, 30, 3416–3424. [Google Scholar] [CrossRef]
  13. Ovcharenko, N. Avtomatika Elekricheskih Stancyi i Elektroenergeticheskih Sistem [Automation of Electrical Stations and Power Systems]; NC ENAS: Moscow, Russia, 2000; 503p, ISBN 5-93196-020-1. [Google Scholar]
  14. Naik, P.; Nair, N.; Swain, A. Impact of reduced inertia on transient stability of networks with asynchronous generation. Int. Trans. Electr. Energy Syst. 2015, 26, 175–191. [Google Scholar] [CrossRef]
  15. Liu, S.; Li, G.; Zhou, M. Power System Transient Stability Analysis with Integration of DFIGs Based on Center of Inertia. CSEE J. Power Energy Syst. 2016, 2, 20–29. [Google Scholar] [CrossRef]
  16. He, C.; He, X.; Geng, H.; Sun, H.; Xu, S. Transient Stability of Low-Inertia Power Systems with Inverter-Based Generation. IEEE Trans. Energy Convers. 2022, 37, 2903–2912. [Google Scholar] [CrossRef]
  17. Ulbig, A.; Theodor, S.; Andersson, G. Impact of Low Rotational Inertia on Power System Stability and Operation. IFAC Proc. Vol. 2014, 47, 7290–7297. [Google Scholar] [CrossRef]
  18. Collados-Rodriguez, C.; Cheah-Mane, M.; Prieto-Araujo, E.; Gomis-Bellmunt, O. Stability Analysis of Systems with High VSC Penetration: Where is the Limit? IEEE Trans. Power Deliv. 2020, 35, 2021–2031. [Google Scholar] [CrossRef]
  19. Collados-Rodriguez, C.; Cheah-Mane, M.; Prieto-Araujo, E.; Gomis-Bellmunt, O. Stability and operation limits of power systems with high penetration of power electronics. Int. J. Electr. Power Energy Syst. 2022, 138, 107728. [Google Scholar] [CrossRef]
  20. Vittal, E.; O’Malley, M.; Keane, A. Rotor Angle Stability with High Penetrations of Wind Generation. IEEE Trans. Power Syst. 2012, 27, 353–362. [Google Scholar] [CrossRef]
  21. Edrah, M.; Lo, K.; Anaya-Lara, O. Impacts of High Penetration of DFIG Wind Turbines on Rotor Angle Stability of Power Systems. IEEE Trans. Sustain. Energy 2015, 6, 759–766. [Google Scholar] [CrossRef]
  22. Tina, G.; Maione, G.; Licciardello, S. Evaluation of Technical Solutions to Improve Transient Stability in Power Systems with Wind Power Generation. Energies 2022, 15, 7055. [Google Scholar] [CrossRef]
  23. Wu, X.; Xu, A.; Zhao, J.; Deng, H.; Xu, P. Review on transient stability prediction methods based on real time wide-area phasor measurements. In Proceedings of the 4th International Conference Electric Utility Deregulation Restructuring Power Technologies (DRPT), Weihai, China, 6–9 July 2011; pp. 320–326. [Google Scholar] [CrossRef]
  24. Min, D.; Kim, S.J.; Seo, S.; Moon, Y.H.; Sun, K.; Chow, J.H.; Hur, K. Computing safety margins of a generation rejection scheme: A framework for online implementation. IEEE Trans. Smart Grid 2018, 9, 2337–2346. [Google Scholar] [CrossRef]
  25. Suprême, H.; Dessaint, L.A.; Kamwa, I.; Heniche-Oussédik, A. Development of new predictors based on the concept of center of power for transient and dynamic instability detection. IEEE Trans. Smart Grid 2018, 9, 3605–3615. [Google Scholar] [CrossRef]
  26. Paul, A.; Kamwa, I.; Joos, G. PMU signals responses-based RAS for instability mitigation through on_the _y identi_cation and shedding of the run-away generators. IEEE Trans. Power Syst. 2020, 35, 1707–1717. [Google Scholar] [CrossRef]
  27. Schmietendorf, K.; Peinke, J.; Friedrich, R.; Kamps, O. Selforganized synchronization and voltage stability in networks of synchronous machines. Eur. Phys. J. Spec. Top. 2014, 2592, 2577–2592. [Google Scholar] [CrossRef]
  28. Shi, L.; Dai, S.; Ni, Y.; Yao, L.; Bazargan, M. Transient stability of power systems with high penetration of DFIG based wind farms. In Proceedings of the 2009 IEEE Power & Energy Society General Meeting, Calgary, AB, Canada, 26–30 July 2009; pp. 1–6. [Google Scholar]
  29. JSC “Kazakhstan Electricity Grid Operating Company” (KEGOC). National Power System. 2023. Available online: https://www.kegoc.kz/en/electric-power/natsionalnaya-energosistema/ (accessed on 9 July 2004).
  30. Zimmerman, R.D.; Murillo-Sanchez, C.E.; Thomas, R.J. MATPOWER: Steady-State Operations, Planning, and Analysis Tools for Power Systems Research and Education. IEEE Trans. Power Syst. 2011, 26, 12–19. [Google Scholar] [CrossRef]
  31. PowerWorld Corporation. Machine Model WT3G1. 2023. Available online: https://www.powerworld.com/WebHelp/Content/TransientModels_HTML/Machine%20Model%20WT3G1.htm?tocpath=Transient%20Stability%20Add-On%20(TS)%7CTransient%20Models%7CGenerator%7CMachine%7C_____48 (accessed on 17 March 2023).
Figure 1. The generator circuit connected to the SMIB via a transformer and two transmission lines.
Energies 17 02314 g001
Figure 2. Phasor diagram of voltages and currents for a one-generator power system.
Energies 17 02314 g002
Figure 3. Angular characteristics of the generator under the three-phase short circuit and an unsuccessful automatic reclosure.
Energies 17 02314 g003
Figure 4. Single-line diagram of the Mangystau energy system with parameters of transmission lines and transformers.
Energies 17 02314 g004
Figure 5. Machine model scheme of a DFIG.
Energies 17 02314 g005
Figure 6. Share of DFIG penetration with respect to the active power dispatch and system inertia.
Energies 17 02314 g006
Figure 7. Relative angles of the rotors of synchronous generators relative to the base machine in scenario 1—0% DFIG generation.
Energies 17 02314 g007
Figure 8. Relative angles of the rotors of synchronous generators relative to the base machine in scenario 2—53% DFIG generation.
Energies 17 02314 g008
Figure 9. Relative angles of the rotors of synchronous generators relative to the base machine in scenario 3—68% DFIG generation.
Energies 17 02314 g009
Figure 10. Relative angles of the rotors of synchronous generators relative to the base machine in scenario 4—73% DFIG generation.
Energies 17 02314 g010
Figure 11. Transient stability index of each synchronous generator with increasing DFIG penetration.
Energies 17 02314 g011
Figure 12. Relative rotor angles of synchronous generators G-1 and G-2 at Station 3 with 73% generation from DFIGs: (a) with no action taken; (b) with increasing the auto-reclose time delay; (c) with a disconnection of 20 MW at Substation 2 from the special load-shedding automation.
Energies 17 02314 g012aEnergies 17 02314 g012b
Figure 13. TSI of G-1 and G-2 with 73% DFIG penetration with respect to the auto-reclose time.
Energies 17 02314 g013
Figure 14. TSI of G-1 and G-2 with 73% DFIG penetration with respect to the value of load shedding.
Energies 17 02314 g014
Figure 15. Organizational structure of FADE inputs and control exposures.
Energies 17 02314 g015
Table 1. Composition of turbogenerators at the studied power plants.
Station NameGeneratorNominal Capacity
(MVA)
Moment of Inertia
(kg m2)
Transient Reactance (pu)Synchronous Reactance
(pu)
Station 1
75 MW
G-14013500.2312.458
G-24013500.2312.458
G-34013500.2312.458
Station 2
630 MW
G-17524000.2912.043
G-27524000.2912.043
G-37524000.2912.043
G-412532500.2781.91
G-57524000.2912.043
G-67524000.2912.043
G-878.7524000.3021.91
G-978.7524000.3021.91
G-1012532500.2781.91
Station 3
625 MW
G-123562500.321.9
G-224162500.342
G-325952800.32.32
Table 2. Results of calculations of the equivalent reactance values and inertias of the generators.
Generator/StationTransient Reactance per Unit (pu)Synchronous Reactance per Unit (pu)Equivalent Inertial Constant (s) at Sbasis = 100 MVA
Station 1j0.3267j2.3071.998
Station 2j0.0544j0.2711.5
G-1 Station 3j0.136j0.8073.083
G-2 Station 3j0.141j0.8293.081
G-3 Station 3j0.116j0.8972.604
Unified Power Systemj0.13j0.91325
Table 3. Transmission line impedances per unit.
“From” Bus Name“To” Bus NameCircuitNominal Operating Voltage (kV)Impedance per Unit (Sbase = 100 MVA)
Station 1 110 kVStation 2 110 kV11100.023 + j0.0415
Station 1 110 kVStation 2 110 kV21100.023 + j0.0415
Station 2 110 kVSubstation 311100.007 + j0.026
Station 2 110 kVSubstation 321100.007 + j0.026
Substation 3Station 3 110 kV11100.007 + j0.027
Substation 3Station 3 110 kV21100.007 + j0.027
Station 2 110 kVStation 3 110 kV1110j0.0005
Station 2 110 kVSubstation 111100.089 + j0.222
Station 2 110 kVSubstation 121100.089 + j0.222
Substation 1Substation 211100.102 + j0.192
Substation 1Substation 221100.102 + j0.192
Station 3 220 kVSubstation 212200.033 + j0.106
Station 3 220 kVSubstation 222200.033 + j0.106
Station 3 220 kVSubstation 412200.073 + j0.322
Station 3 220 kVSubstation 422200.073 + j0.322
Table 4. Transformer reactance values per unit.
“From” Bus Name“To” Bus NameOperating Name of Autotransformer (AT)Reactance per Unit
Station 3 110 kVStation 3 220 kVAT-1j0.0489
Station 2 110 kVStation 3 220 kVAT-2j0.049
Substation 2 220 kVSubstation 2 110 kVAT-1j0.0428
Substation 2 220 kVSubstation 2 110 kVAT-2j0.0428
G-1 Station 3 110 kVAT-1j0.0419
G-2Station 3 220 kVAT-2j0.0488
G-3 Station 3 220 kVAT-3j0.04797
Table 5. Load schedules in the power system.
Bus NameActive Load (MW)Reactive Load (MVar)
Station 1 110 kV2010
Station 2 110 kV10048
Substation 3 110 kV10048
Station 3 220 kV3540
Substation 1 110 kV10062
Substation 2 110 kV8039
Substation 4 220 kV3119
Total Load466266
Table 6. Generation schedules and terminal voltage levels of the generators.
GeneratorActive Power Dispatch (MW)Voltage (per Unit)
Station 1751.05
Station 22501.09
G-1 Station 3201.09
G-2 Station 3201.09
G-3 Station 3201.09
Unified Power System901
Total Generation475
Table 7. Schedules of exposures for the dynamic simulations.
ScenarioActionTime (s)Location
Scenario 1–4Apply a three-phase short circuit1Line 1 220 kV at Station 3–Substation 4, 0.5% away from Station 3
Open the circuit breakers1.06At both sides of the faulted line
Close the circuit breakers via the auto-reclose scheme4.06
Open the circuit breakers4.12
Scenario 5Close the circuit breakers via the auto-reclose scheme5.06
Open the circuit breakers5.12
Scenario 6Close the circuit breakers via the auto-reclose scheme4.06
Open the circuit breakers4.12
Reduce the load by 20 MW4.2Substation 2
Bus 110 kV
Table 8. FADE parameters when both synchronous generators are operating.
H (s)P (MW)T (s)LS (MW)ND
6.16403.50-
604.50
805.50
10020
12040
140640
16080
180120
200200
220--+
240
To achieve higher power outputs from G-1 and G-2, network division is implemented.
Table 9. FADE parameters when one synchronous generator is in repairment.
H (s)P (MW)T (s)LS (MW)ND
3.16204.560-
3080
405.560
50100
606.580
70100
80150
90--+
To achieve higher power outputs from G-1 or G-2, network division is implemented.
Disclaimer/Publisher’s Note: The statements, opinions and data contained in all publications are solely those of the individual author(s) and contributor(s) and not of MDPI and/or the editor(s). MDPI and/or the editor(s) disclaim responsibility for any injury to people or property resulting from any ideas, methods, instructions or products referred to in the content.

