Article

Towards Green IT: Assessing the Environmental Impact of Public Administration

1
Faculdade de Ciências e Tecnologia, Universidade do Algarve, 8005-139 Faro, Portugal
2
Escola Superior de Ciências Empresariais, Instituto Politécnico de Setúbal, 2910-470 Setúbal, Portugal
*
Author to whom correspondence should be addressed.
Energies 2024, 17(1), 57; https://doi.org/10.3390/en17010057
Submission received: 18 September 2023 / Revised: 7 December 2023 / Accepted: 18 December 2023 / Published: 21 December 2023
(This article belongs to the Section C: Energy Economics and Policy)

Abstract

:
The Public Administration (PA) in Portugal is impacted by the constant acceleration and evolution of Information and Communication Technologies (ICT), where the Portuguese State, transposing European Union directives, has legislated and encouraged their use as instruments of added value for the PA. Establishing rigorous and sustainable governance is crucial, ensuring that the organization’s strategic objectives are aligned with ICT and, preferably, with Green IT practices. In this context, it is necessary to be able to estimate and subsequently evaluate the impact of strategic and operational choices on improving environmental quality. For such, this article presents a framework developed to optimize ICT management practices and indicators that, in this environmental area, support the forecasting and assessment of the impact of the choices made in the search for technologically advanced solutions in the Barreiro municipality. These choices enable, among other things, a reduction in energy consumption, implying a reduction in financial costs, resulting in environmental benefits, such as a reduction in CO2 emissions into the atmosphere or less deforestation. The results presented, obtained in a real-world context, make it possible to assess the progress of alignment with Green IT in this area, as well as the overall result.

1. Introduction

Society faces environmental challenges arising from the excessive use of natural resources, and one sector in particular, the ICT industry, is responsible for a total sector footprint estimated in 2007 at 830 million tons of CO2—representing around 2% of total emissions from human activity that year [1]. The share of Information and Communication Technologies (ICT) in Greenhouse Gas (GHG) emissions was expected to increase to 6% by 2020 [1]. However, this is expected to be more than offset by the “enabling effect” of ICT on the carbon efficiency of other sectors, such as transport, buildings, energy, and industry: any increases in GHG emissions from ICT are expected to be five times greater than the emissions saved by ICT elsewhere [1].
It is crucial to keep the focus on this issue to find solutions in line with Green IT, to promote environmental sustainability in line with the European Union (EU) [1], which has set three strategic objectives on climate change and energy, to be achieved by 2020: a 20% reduction in greenhouse gas emissions; 20% of energy from renewable sources; and a 20% increase in energy efficiency.
It was hoped, however, that these figures would be offset by the facilitating effect of ICT on the carbon efficiency of other sectors, where the aim would be to harness the potential of ICT to reduce GHGs, to which end virtualization, sensing, and digital transformation would be some of the ways of achieving the goal [1].
The current economic and financial context, both national and international, requires organizations to have a rigorous and demanding strategic vision to respond to challenges and anticipate and minimize risk [2].
Portuguese public services are now faced with the demands of today’s pace of life and the increasingly demanding aspirations of citizens and customers. To promote general economic development and meet collective needs, the Portuguese state, based on European Union directives, has legislated to encourage and use modern technologies as an instrument of added value in public administration [3].
Given this context, to control the use of Information Technology (IT) resources effectively and efficiently, IT governance, which encompasses a structure of processes, policies, standards, and procedures that organizations use to manage and control the use of IT resources in a holistic and systemic [4] and scalable way, could be a solution.
IT governance mainly aims to align ICT with the organization’s strategic objectives, minimizing risks [5], optimizing investments, and adapting ICT initiatives to business needs [6]. This effective alignment facilitates the realization of strategies and objectives, while strategically it can enable the environmental impact of ICT to be reduced through energy savings.
For IT governance to be effective, it is essential to adapt its structure to the specific needs of each organization, ensuring flexibility to adjust to the changing needs of strategic objectives and emerging technologies. Investing in employee training is crucial to ensure that they have the necessary skills to deal with information technologies safely and effectively, while being aware of the risks associated with the use of ICT and being able to take measures to protect the organization and citizens’ data [7].
With this in mind and to contribute to the national targets of the National Energy and Climate Plan 2030 (PNEC 2030) [8] for GHG reduction, the municipality of Barreiro, Portugal, opted to adopt a process of integrated governance to outline assertive strategies to effectively contribute to reducing energy consumption, reducing CO2 into the atmosphere and reducing the amount of materials to be recycled.
In this sense, and after assessing the needs of the local authority, a multidisciplinary and aggregating framework [9] was developed, incorporating the various governance strategies of the local authority, to optimize ICT management practices.
The framework developed was validated in the Barreiro municipality, Portugal, in a real context and made it possible to estimate and evaluate the impact of strategic and operational choices on the environment, particularly regarding energy consumption, in line with Green IT. The results obtained were supported by quantitative and qualitative indicators, based on four vectors—ICT, Financial, Environmental, and Social—specific to the framework, the weightings of which were outlined by the municipality. Of the four vectors, this article focuses only on the Environmental vector.
In this way, it was possible to evaluate and compare the contribution of environmental results to the promotion of Green IT at the start of the project, as well as in more advanced phases, which will be presented in this article.
The article is structured in six sections: Section 1, the introduction, presents the background to the problem and the aim of the article; Section 2 presents the literature review, which includes the theoretical foundations of the supporting theme; the methods and materials used are described in Section 3; the results of the environmental aspect of the framework, which includes the best ICT practices, aligned with Green IT and supported by international standards and frameworks, to optimize the practices instituted in organizations, mainly in the Local Administration (LA) under study, is presented in Section 4; Section 5 presents the discussion of the environmental results achieved, Finally, Section 6 presents some conclusions highlighting the advantages or consequences of using the framework and its contributions to the community. The article ends with a bibliographical presentation.

2. Theoretical Framework

Of particular note is the coverage of the International Organization for Standardization (ISO) standards, Information Technology Infrastructure Library V4 (ITIL) [10], and Control Objectives for Information and Related Technology (COBIT) [11], which are the most widely implemented from an IT governance perspective [12], in terms of good practices and standards for the management of IT services, as well as for the control and governance of IT-related processes. The ITIL and COBIT standards are summarized in [13]. These references are based on good practices and successful experiences from other organizations, allowing the organization that adopts them to benefit from years of learning and evolution in the market. It should also be noted that the benchmarks are extremely valuable if they are properly adapted to your business model or, in the case of public sectors, to your processes.
Other references could have been evaluated, such as the Project Management Body of Knowledge (PmBOK) [14] for standardizing good project management practices or the Capability Maturity Model Integration (CMMI) [15] to ensure the reduction in failures and risks in the quality of projects, or others; however, they did not fit the context, nor the needs assessed in the local authority.
However, the standards evaluated do not consider the reality of the Portuguese Public Administration (PA) and LA, and the latter, mainly, despite its own revenues, also depends on financial transfers from the central PA. This reality means that one of the essential factors is to quantify, for example, the financial costs, not addressed in this article, or the environmental alignment with Green IT, which triggered the identification of gaps and the proposal of good practices for the qualification and quantification of indicators that allow, among others, to establish energy-saving rules, quantify the environmental footprint, alignment with Green IT, costs of implementing a particular technology or service, as well as assessing whether or not a particular option affects productivity in the organization.
This article can be considered a complement to the context and several indicators, including the other vectors that make up the FACIIL support tool, a work published by the authors in [9,13,16,17]. Briefly, it is relevant in this context to consider that the virtualization of infrastructure, with the replacement of physical servers by multiple virtual servers [18] and the replacement of personal computers with thin clients [19], the replacement of Cathodic Ray Tube (CRT) monitors with Thin Film Transistor (TFT) monitors, the replacement of desktop printers by multifunction devices, and the replacement of paper by digital, will be more environmentally friendly and energy-efficient ICT solutions, which can contribute to the reduction in CO2 emissions, less deforestation, improvement of the environmental footprint and in alignment with Green IT.
This is in line with the growing interest in the importance of environmental sustainability in all sectors, as it can help organizations achieve significant benefits through sustainable working practices [20].
This article reports part of a framework that solves constraints and facilitates the use of identified opportunities, aligned with the strategic objectives of organizations, digital transformation and digitalization processes, integrated governance, and with special emphasis on alignment with Green IT.
As theoretical support for the alternative options presented, and for the objective of environmental sustainability through Green IT options, as well as the results, a brief framework of three pertinent themes in this context is below, digital transformation, IT governance, and Green IT.

2.1. Digital Transformation

Digital transformation presents a new driving force for green development and can significantly reduce companies’ pollution emissions [21]. They are increasingly being driven to carry out digital transformation, which is expected to expand in the future [22], and automation to maintain its competitive position. This accentuates the relationship between man and machine, increasing the degree of automation of processes [23].
From the author’s perspective, digital transformation is not just about computerizing a production system. It involves exploring these systems to develop, maintain, or improve skills that a company needs or masters. Keeping this idea in mind is important when a company is thinking about taking a step towards digital transformation [24].
Digital transformation should not be seen as a simple adoption of technology, but rather as a strategic, business-driven process, to improve operational efficiency and increase the organization’s innovation and competitiveness. In addition to the digitalization of processes, it is often necessary to re-engineer processes, create and optimize flows [25], acquire new skills, and adopt innovative business practices, as can be seen in the following quote.
The conception of digital transformation is related to the adoption of business processes and practices to respond to digital trends [26]. In the public sector, this kind of radical transformation of services into platforms, smart products, and customer needs can be seen quickly: the transition from paper-based government to digital government [27].

2.2. Governance IT

IT governance is a relevant part of the three pillars of governance management: Governance, Risk, and Compliance, a structure aimed at improving the performance, decision-making, and resilience of companies. IT governance encompasses a framework of relational processes, policies, standards, and procedures [5,12] that organizations use to manage and control the use of IT resources effectively and efficiently [28]. Each of these instruments has a function and, when implemented, should positively affect the organization [12].
The primary goal of IT governance is to ensure that IT is aligned with the organization’s strategic goals [29], minimizing risk, optimizing IT investments, and aligning IT initiatives with business needs so that strategies and objectives are achieved [5].
IT governance is a holistic approach that encompasses the entire organization, including top management, IT staff, and other relevant stakeholders. It involves clearly defining roles and responsibilities, adopting consistent policies and procedures across the organization, managing risks, and establishing metrics and performance indicators to gauge their success [28]. It is especially important in organizations that rely heavily on IT for their business processes. Alignment of organizational and individual objectives is potentially more difficult in the public sector due to the limited ability to establish market-linked incentives [30].
For IT governance to be effective, it is important that its structure is tailored to the specific needs of each organization and has enough flexibility to adjust to changing business needs and emerging technologies. A successful strategic vision for the adoption of IT governance practices in the PA, in Portugal, requires considering public-sector goals and objectives aligned with IT strategies, following international best practices, and security and data privacy standards, to ensure the protection of citizens’ sensitive data, in compliance with the General Data Protection Regulation (GDPR) [28].
Investing in employee empowerment and training is crucial to ensure they have the necessary skills to deal with information technology [31], securely and effectively, as well as being aware of the risks associated with the use of ICT and being able to take the necessary measures to protect the organization and citizens’ data. Organizations can adopt existing governance frameworks, such as COBIT or ITIL, or both, or they can develop their own custom IT governance frameworks.

2.3. Green IT

The growing demand for energy resources and the growing concern about climate change have driven the search for more sustainable solutions in the information technology sector.
The environmental impact of ICT can be classified into direct and indirect effects according to [32,33]. Direct effects refer to the environmental impact of extracting raw materials needed to produce the ICT, manufacturing process, transportation, use, and disposal. This is related to Green IT. Indirect effects refer to the positive impact of the use of ICT on the environmental sustainability of business and economic processes. This effect concerns Green IS. The author also mentions these effects [34] as worrisome for researchers who look to ICT as a driving solution for environmental sustainability.
As can be seen, some authors, when referring to environmental impact and sustainability, use different terminologies, specifically Green IT and Green IS. In the case of this article, an aggregating term Green IT will be used, which will relate environmental issues with the energy efficiency of IT.
In this context, Green IT emerges as an approach to promote sustainability in the IT sector, aiming to reduce the carbon footprint of ICT activities and promote more sustainable practices in the use of resources, helping to reduce the amount of carbon emissions into the atmosphere [7,35].
Society’s growing dependence on ICT has generated a significant increase in energy and resource consumption, especially in the data center sector. This high consumption not only harms the environment [36,37,38], but it also results in higher operating costs for organizations and may even impair competitiveness in the market due to its contribution to greenhouse gas emissions and global environmental degradation due to ICT lifecycles.
The adoption of Green IT practices can bring several benefits, such as reducing energy consumption and operating costs, improving the organization’s image, and promoting environmental awareness among employees. However, the implementation of these practices can also present some challenges, such as resistance to change, a lack of technical expertise in Green IT, and the absence of government incentives.
On the contrary, and according to the authors [39], in developing countries, such as Malaysia, although the adoption of Green IT is a necessity, and despite the numerous government incentives that have been made available for the adoption of IT, there is still a low adoption rate. In developed countries, Green IT has been adopted as a strategic initiative considered for the development of sustainable business practices, through the balance of an organization’s economic and environmental performance.
The concept of Green IT emerged from a worldwide movement, in response to the growing concern with the preservation of the environment and the promotion of social and environmental responsibility in the technology sector. The ideals of this movement focus on a set of measures and initiatives that aim to reduce the negative environmental impact of ICT, contribute to climate change mitigation, and promote environmental sustainability in the ICT sector [40].
To ensure the quality, safety, efficiency, and effectiveness of products, services, and management systems in various areas, it was important to consider ISO standards, in particular ISO/IEC 20000-1:2018 [41], ISO/IEC 27000:2018 [42], ISO/IEC 27001:2022 [43], ISO/IEC 27002:2022 [44], ISO/IEC 27005:2022 [45], ISO/IEC 27013:2021 [46], ISO 31000:2018 [47], ISO/IEC 38500:2015 [48], ISO/IEC TS 38501:2015 [49], ISO/IEC TR 38502:2017 [50], ISO/IEC 55000:2014 [51], ISO/IEC 55001:2014 [52], and ISO/IEC 55002:2018 [53].
Existing systems such as ITIL were also considered [10], and COBIT [11], as part of the initial design of the framework at each stage of the process. These international standards establish guidelines, processes, and procedures to achieve these goals. Thus, it is considered that the incorporation of these standards can contribute to the success of the project.

3. Methods and Materials

The PA currently operates by taking advantage of the facilities of ICT, allowing processes to flow electronically between central, regional, and local administrations. This results in greater speed since the ease of sending, receiving, and handling documents is considerably improved. It translates into greater speed, streamlining of processes, and facilitation of coordinated actions between the various stakeholders.

3.1. Object of Study

The object of study fell on the local authority of Barreiro, Portugal, in which, based on the premises described, it was sought to harmonize this reality with the strategic objectives of the municipality, at the same time in alignment with ICT. The study considered the challenges and opportunities identified in the municipality of Barreiro, seeking an approach to optimize ICT management practices that were easy to implement, fast, integrated, and progressive, and which provided environmental sustainability and aligned with Green IT.

3.2. Description of the Methodological Design

The methodological design is intended to provide a comprehensive overview of the steps and processes involved, including how the study might be conducted. Figure 1 shows the various stages and processes, as well as responsibilities, in a continuous improvement cycle.
In the specific case of the Barreiro municipality, this began with an internal audit, to become familiar with the ICT infrastructure and existing assets, which would allow the identification of risks, constraints, and opportunities for improvement in the diagnostic phase. The municipality’s strategic objectives were also considered and incorporated, together with a SWOT analysis. This was followed by the search for solutions in the market and the evaluation of the standards referred to in Section 2. Theoretical Framework, where it was found that they did not respond to the needs of the municipality, to quantify, for example, the financial costs, not addressed in this article, or the environmental alignment with Green IT. Therefore, the process of identifying the gaps and proposing good practices for the qualification and quantification of the indicators that demonstrated the needs identified by the municipality began. To support these indicators and quantification of values, it was necessary to develop a tool, in this case the FACIIL framework, a qualitative component of continuous improvement, as well as the calculation tool, which allows the evaluation of the quantitative component of decision support. In the environmental aspect, the indicators used were energy consumption, carbon footprint, amount of recycling, climate change, and deforestation, as well as the alignment of this aspect with Green IT.
After the strategic implementation of the tools, a data analysis was carried out. If the results did not meet the agency’s expectations, the framework cycle was restarted. New strategic alternatives were applied, followed by a new quantitative assessment. This process was repeated until the data were in line with the municipality’s expectations.
The method that we recommend in this article frames the results that will be presented in the following section. The method presupposes the application of successive phases that are included in its qualitative aspect: analysis, diagnosis, planning, study of alternatives in design, communications, security, innovation, optimization, and evaluation, alluding to a Plan, Do, Check, and Act (PDCA) cycle. Considering that throughout the nine phases of the framework, the methodology can be considered identical, as it is planned, done, verified, and acted, this cycle can be followed as many times as necessary until a good optimization is achieved or if there are strategic or regulatory changes. On the quantitative side, the framework presents a set of indicators in each of the vectors that support it, and in this article, only the Environmental vector will be treated.
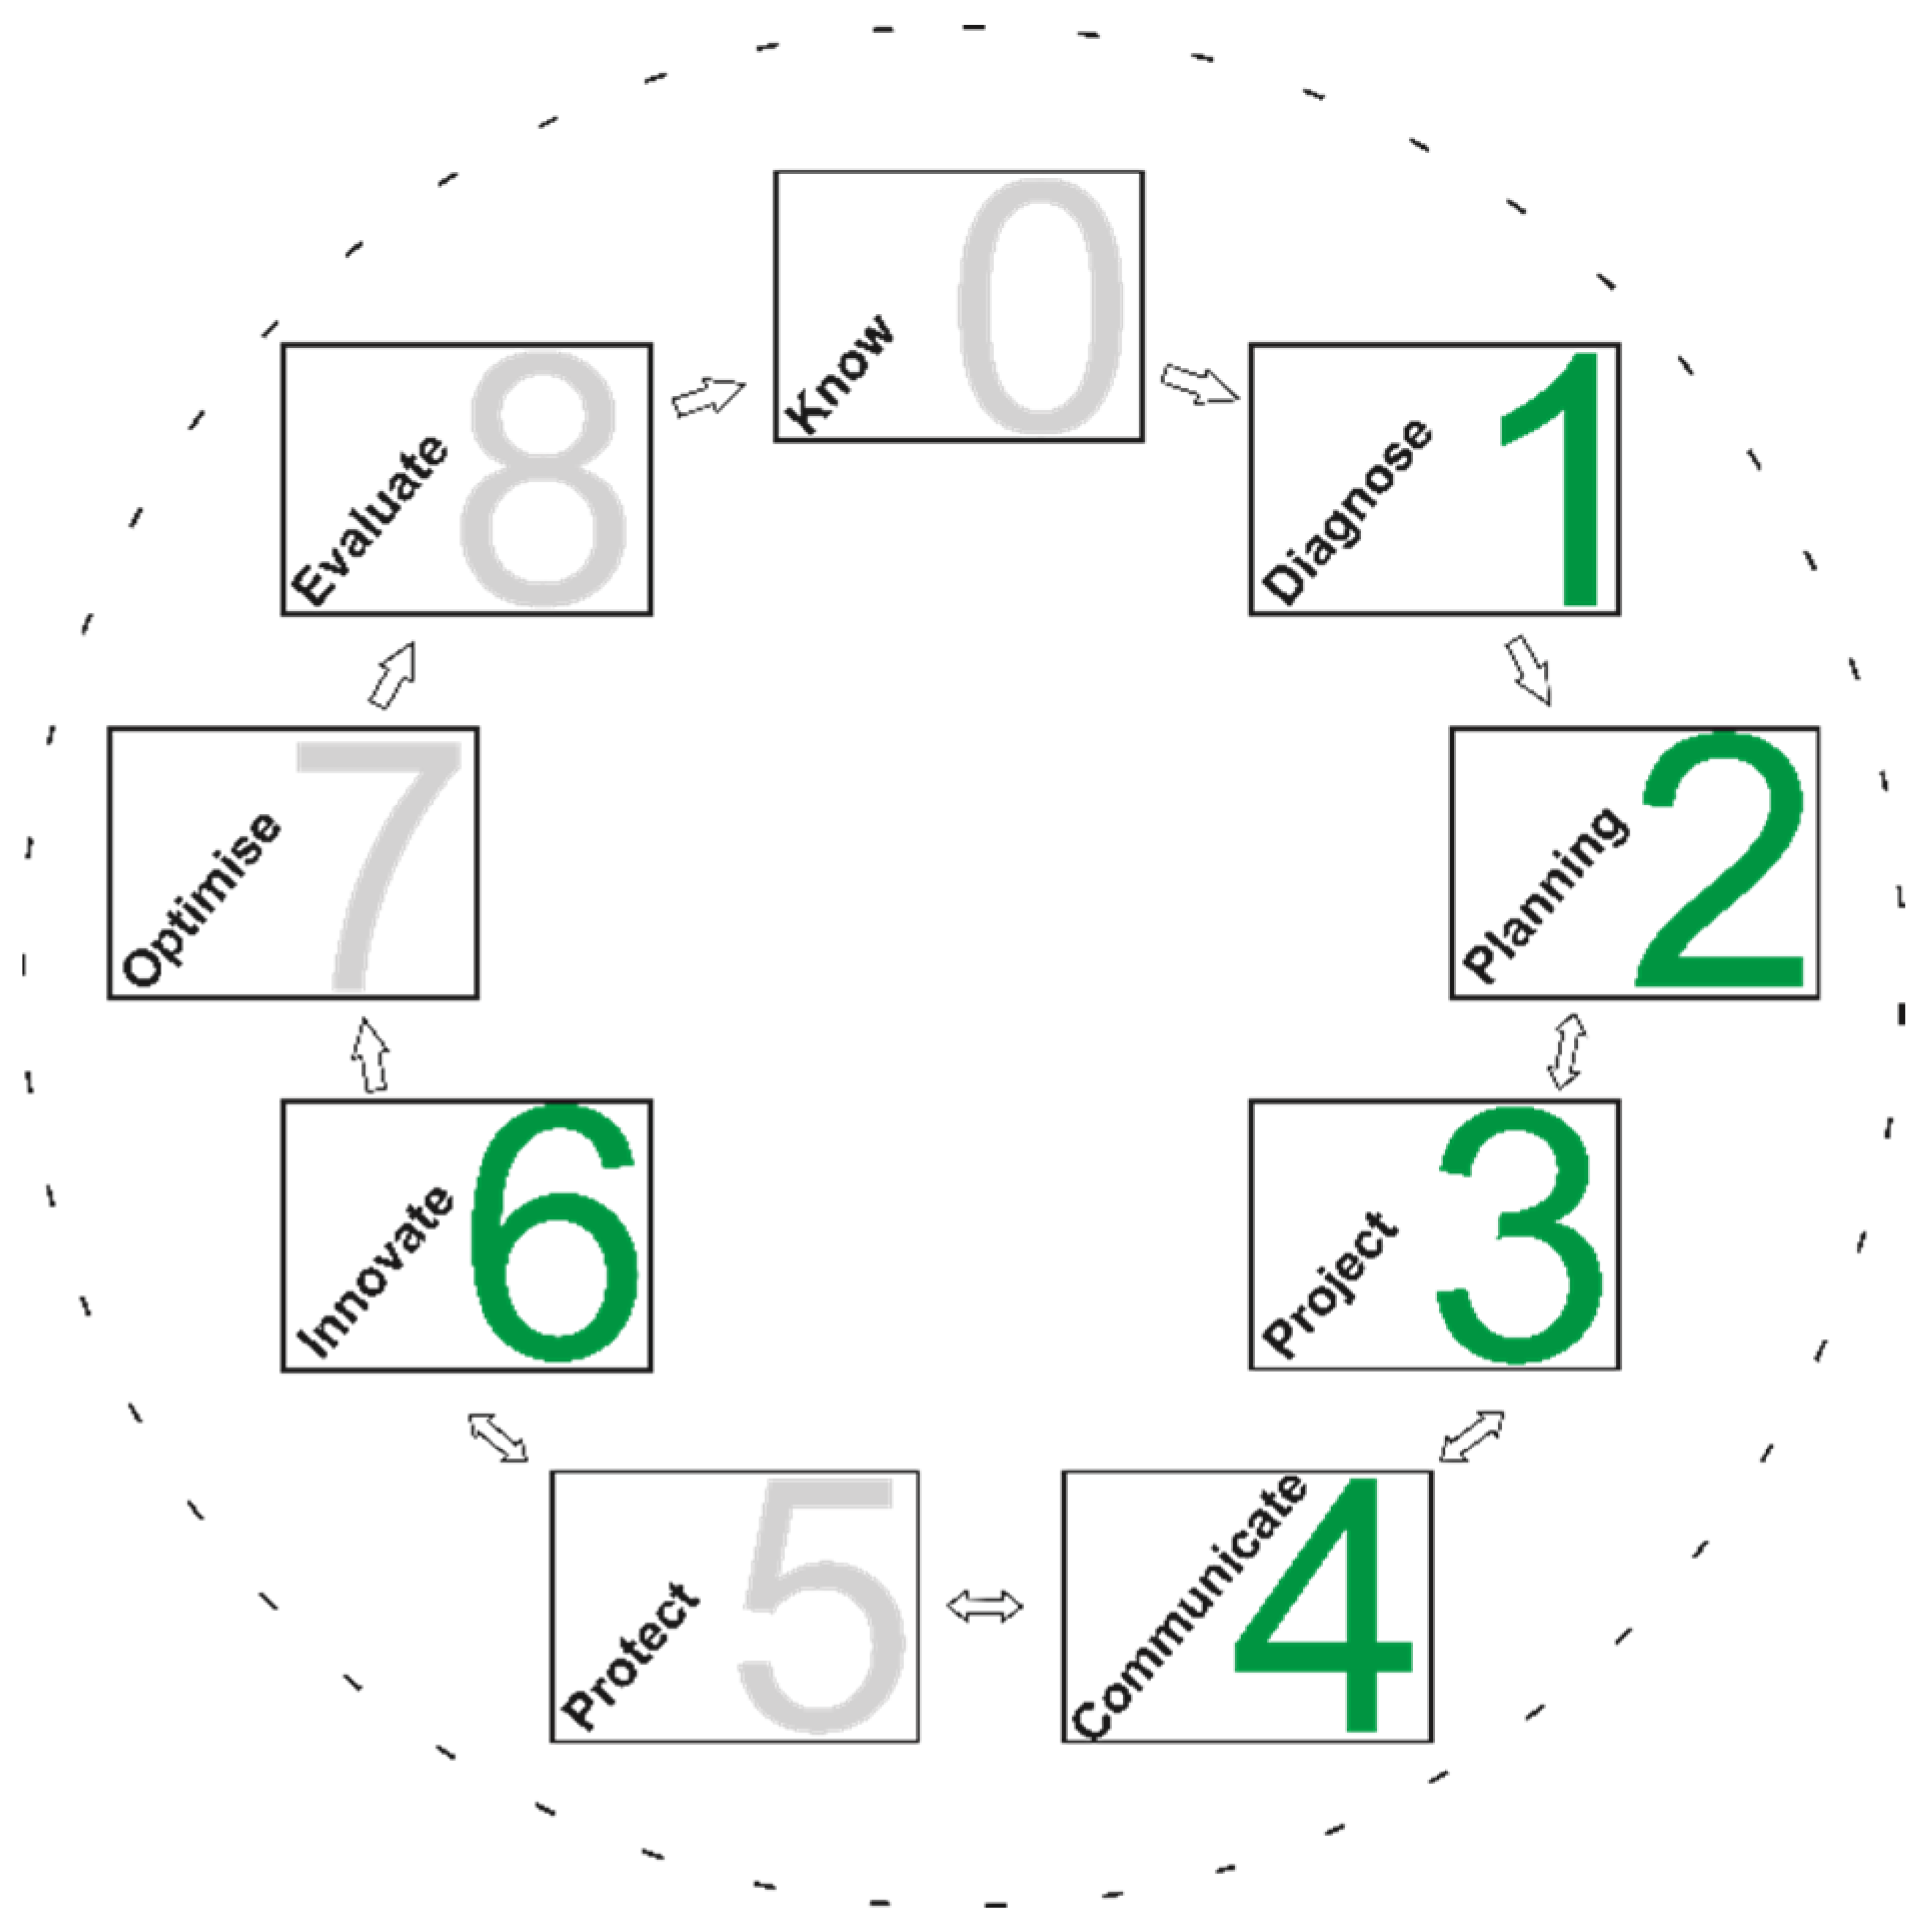
Figure 2 shows the phases of the framework, starting with phase zero, with the identification of the problem, followed by eight more phases, in a governance model that allows the identification of good practices that align with the strategic objectives of the activity.
Phases 1, 2, 3, 4, and 6 are highlighted in green as the phases where there is greater alignment with Green IT. The model will be iterative from phase 2 to phase 6, going through all phases until phase 8, where, based on the elements collected, evaluation, and opinion, there may be a need to repeat the entire cycle, optimizing processes. It should be noted that in the application of the model, choices are made, and, in the corresponding qualitative component, greater weights are attributed to greater sustainability.
On the environmental side, in Phase 0—Knowing, it is essential to collect information on the infrastructure and assets from the organization, and if this does not exist, an internal audit should be carried out to gain an understanding of them so that in Phase 1—Diagnosing, all the information collected can be analyzed, checking what is already being measured and at what level, identifying constraints and opportunities for improvement.
In the case presented, the analytical accounting of the organization does not allow a finer granularity, for example, energy consumption, so the data that can be worked with and that consider the reference values of the equipment were used.
In Phase 2—Plan, the inputs from the previous phase will be included, and the municipality’s strategic objectives will be incorporated. If necessary, a SWOT analysis may also be used to help analyze the internal and external environment. The environmental impact must be assessed, and what can cause the greatest impact must be analyzed to prioritize and reduce it.
Phase 3—Design should take as inputs what resulted from the previous phase and design a solution that contemplates an improvement in the environmental footprint and greater alignment with Green IT. Phase 4—Communicating has to do with the improvement of communications between buildings and the study of maintaining telephone exchanges and telephone cords or passing the exchanges to the telecommunications operator and cordless telephones, again aiming at environmental improvement. Phase 5—Protect encompasses the protection of infrastructure and active equipment, mitigating negligence and exposures, using security policies. In Phase 6—Innovate, the aim is to innovate processes, using the provision of online services to minimize the number of trips to the service counters, which implies less fuel costs and a reduction in CO2 emissions. Phase 7—Optimize will have as inputs the work done up to this stage, and what is intended is the optimization of processes that lead to the improvement of the quality of information, greater speed in the response, and optimization of services to the citizen. Finally, Phase 8—Evaluate is intended to be an internal and external evaluation of the work carried out to bind the opinions, criticisms, and proposals for improvement that may arise from it.
In any of these phases, the tool is supported by a set of indicators that in the first stage reflect the current state (analysis), and in the second stage allow the choice of alternatives, which were considered based on the estimation of the impact of different strategies, which contribute to the overall objective of the institution [7].
These indicators are made available by the calculation tool, developed with the FACIIL framework, and presented below.
  • The Energy Consumption indicator, which considers the consumption of IT equipment and calculates the energy consumption per hour and year, is weighted to verify its contribution to the alignment with Green IT.
CoEa = Annual Energy Consumption
NE = Number of equipments
FA = Power supply in W·h
H = Daily hours considered (10)
D = Days of the month considered (22)
M = Months considered (12)
C o E a = N E · F A · H · D · M
The result of the annual energy consumption indicator is given by the previous calculation formula, multiplying the amount of equipment by the power of the power supply, per hour, times the number of daily hours considered, in this case it was 10, multiplied by the number of monthly working days considered, in this case it was 22, multiplied by the number of annual months, twelve.
  • For the carbon footprint, the CO2 emissions indicator is available, where, based on the annual energy consumption and the value made available by the electricity supplier [54] CO2 g/kW·h, calculates the emission of grams of CO2 into the atmosphere in a year. Each organization or country must consider its CO2 g/kW·h value adequate.
ECO2 = CO2 emissions
GCO2 = Grams of CO2 per kW·h
CoE = Energy consumption kW·h/year
E C O 2 = G C O 2 · C o E
The result of the annual CO2 emissions indicator is given by the previous calculation formula, multiplying the number of grams of CO2 per kW·h by the annual energy consumption.
  • Recycling has a Material for recycling indicator, where the number of pieces of equipment is counted by their weight.
MR = Material for recycling
NE = Number of equipment
PE = Weight of equipment in kg
M R = N E 1 · P E 1 + N E 2 · P E 2 + N E n · P E n
The result of the material for the recycling indicator is calculated by multiplying the number of identical pieces of equipment by their weight. If there are several types of equipment, multiply and then add up all the portions, according to the previous calculation formula.
  • The value of climate change is provided by a Global Warming indicator that calculates the ratio of CO2 emissions, previously calculated, by the value of 1000 Gt, which corresponds to 0.4 degrees centigrade, provided by [55].
GA = Global warming
ECO2 = CO2 emissions in grams per year
CO2 = 1000 Gt
G A = E C O 2 C O 2 · 0.4 ° C
The result of the global warming indicator is calculated by multiplying the ratio of CO2 emissions over 1000 Gt of CO2 by the value of 0.4 °C.
  • The indicator for deforestation is Paper Reduction/Deforestation, which is based on the ratio of the annual expenditure of reams of sheets of paper by the number of reams obtained by each tree, a value made available by [56]. It tells us the number of trees felled annually for our paper expenses.
UPA = Annual paper usage
Process = average A4 sheets
NPA = Number of cases*year
Req = Average Requirements A4 sheets*year + copies
U P A = P r o c e s s · N P A + R e q
NAA = Number of trees/year
N A A = U P A / 500 20
The result of the paper reduction/deforestation indicator is calculated by the ratio of annual paper use per 500 (the number of sheets in a ream of paper) divided by 20 (the average number of reams obtained by each tree). This indicator is used to demonstrate the evaluation of digital transformation results.
The results of the indicators used are intended to evaluate the results according to the strategic alternatives tested so that decisions can be compared and made.
The calculation tool enables the evaluation of alternative strategies and measurement of the values of alignment with the concept of Green IT, also supporting the analysis and validation of the strategies that are intended to be implemented. One of the main objectives is to assist IT technicians and other users in the application of the framework, allowing them to perform calculations and analyses more efficiently and accurately. In addition, the tool will also offer additional features to enhance the user experience, such as graphical visualizations [7].
On the environmental side, discussed in this article, the indicators envisaged focus on energy consumption, carbon footprint, recycling, climate change, and deforestation. The practical validation of the work and demonstration of the applied theory included the collaboration of the municipality of Barreiro, Portugal, which made it possible to analyze the feasibility in a real context of the work.

4. Results: Environmental Aspect of the FACIIL Framework

Considering the environmental aspect of the FACIIL framework, there is the objective of achieving several goals. These goals include reducing energy consumption, as well as reducing the amount of material to be recycled. The intent is to [15] also reduce carbon dioxide emissions, contributing to the preservation of the ozone layer, promoting environmental improvements, and aligning with Green IT principles.
Based on the 2016 values, the scenario experienced in the municipality of Barreiro was identified, which is intended to be improved through this project and the tool developed. Using the calculation tool of the FACIIL framework, several alternative strategies were analyzed to assess the most appropriate perspective and the best way forward. Among the analyses performed, some values were highlighted for comparison of the results obtained in each scenario, since the main objective of this article is not to detail them exhaustively.
One of the premises of top management is to preserve or reduce costs, along with environmental improvement. Based on these assumptions and based on the results of Phase 1—Diagnosing, in which several obsolete computers at the end of their useful life were identified, we carried out a hypothetical test. In this test, we replaced the obsolete computers with thin clients and analyzed the values generated by the calculation tool of the FACIIL framework to proceed with their evaluation.
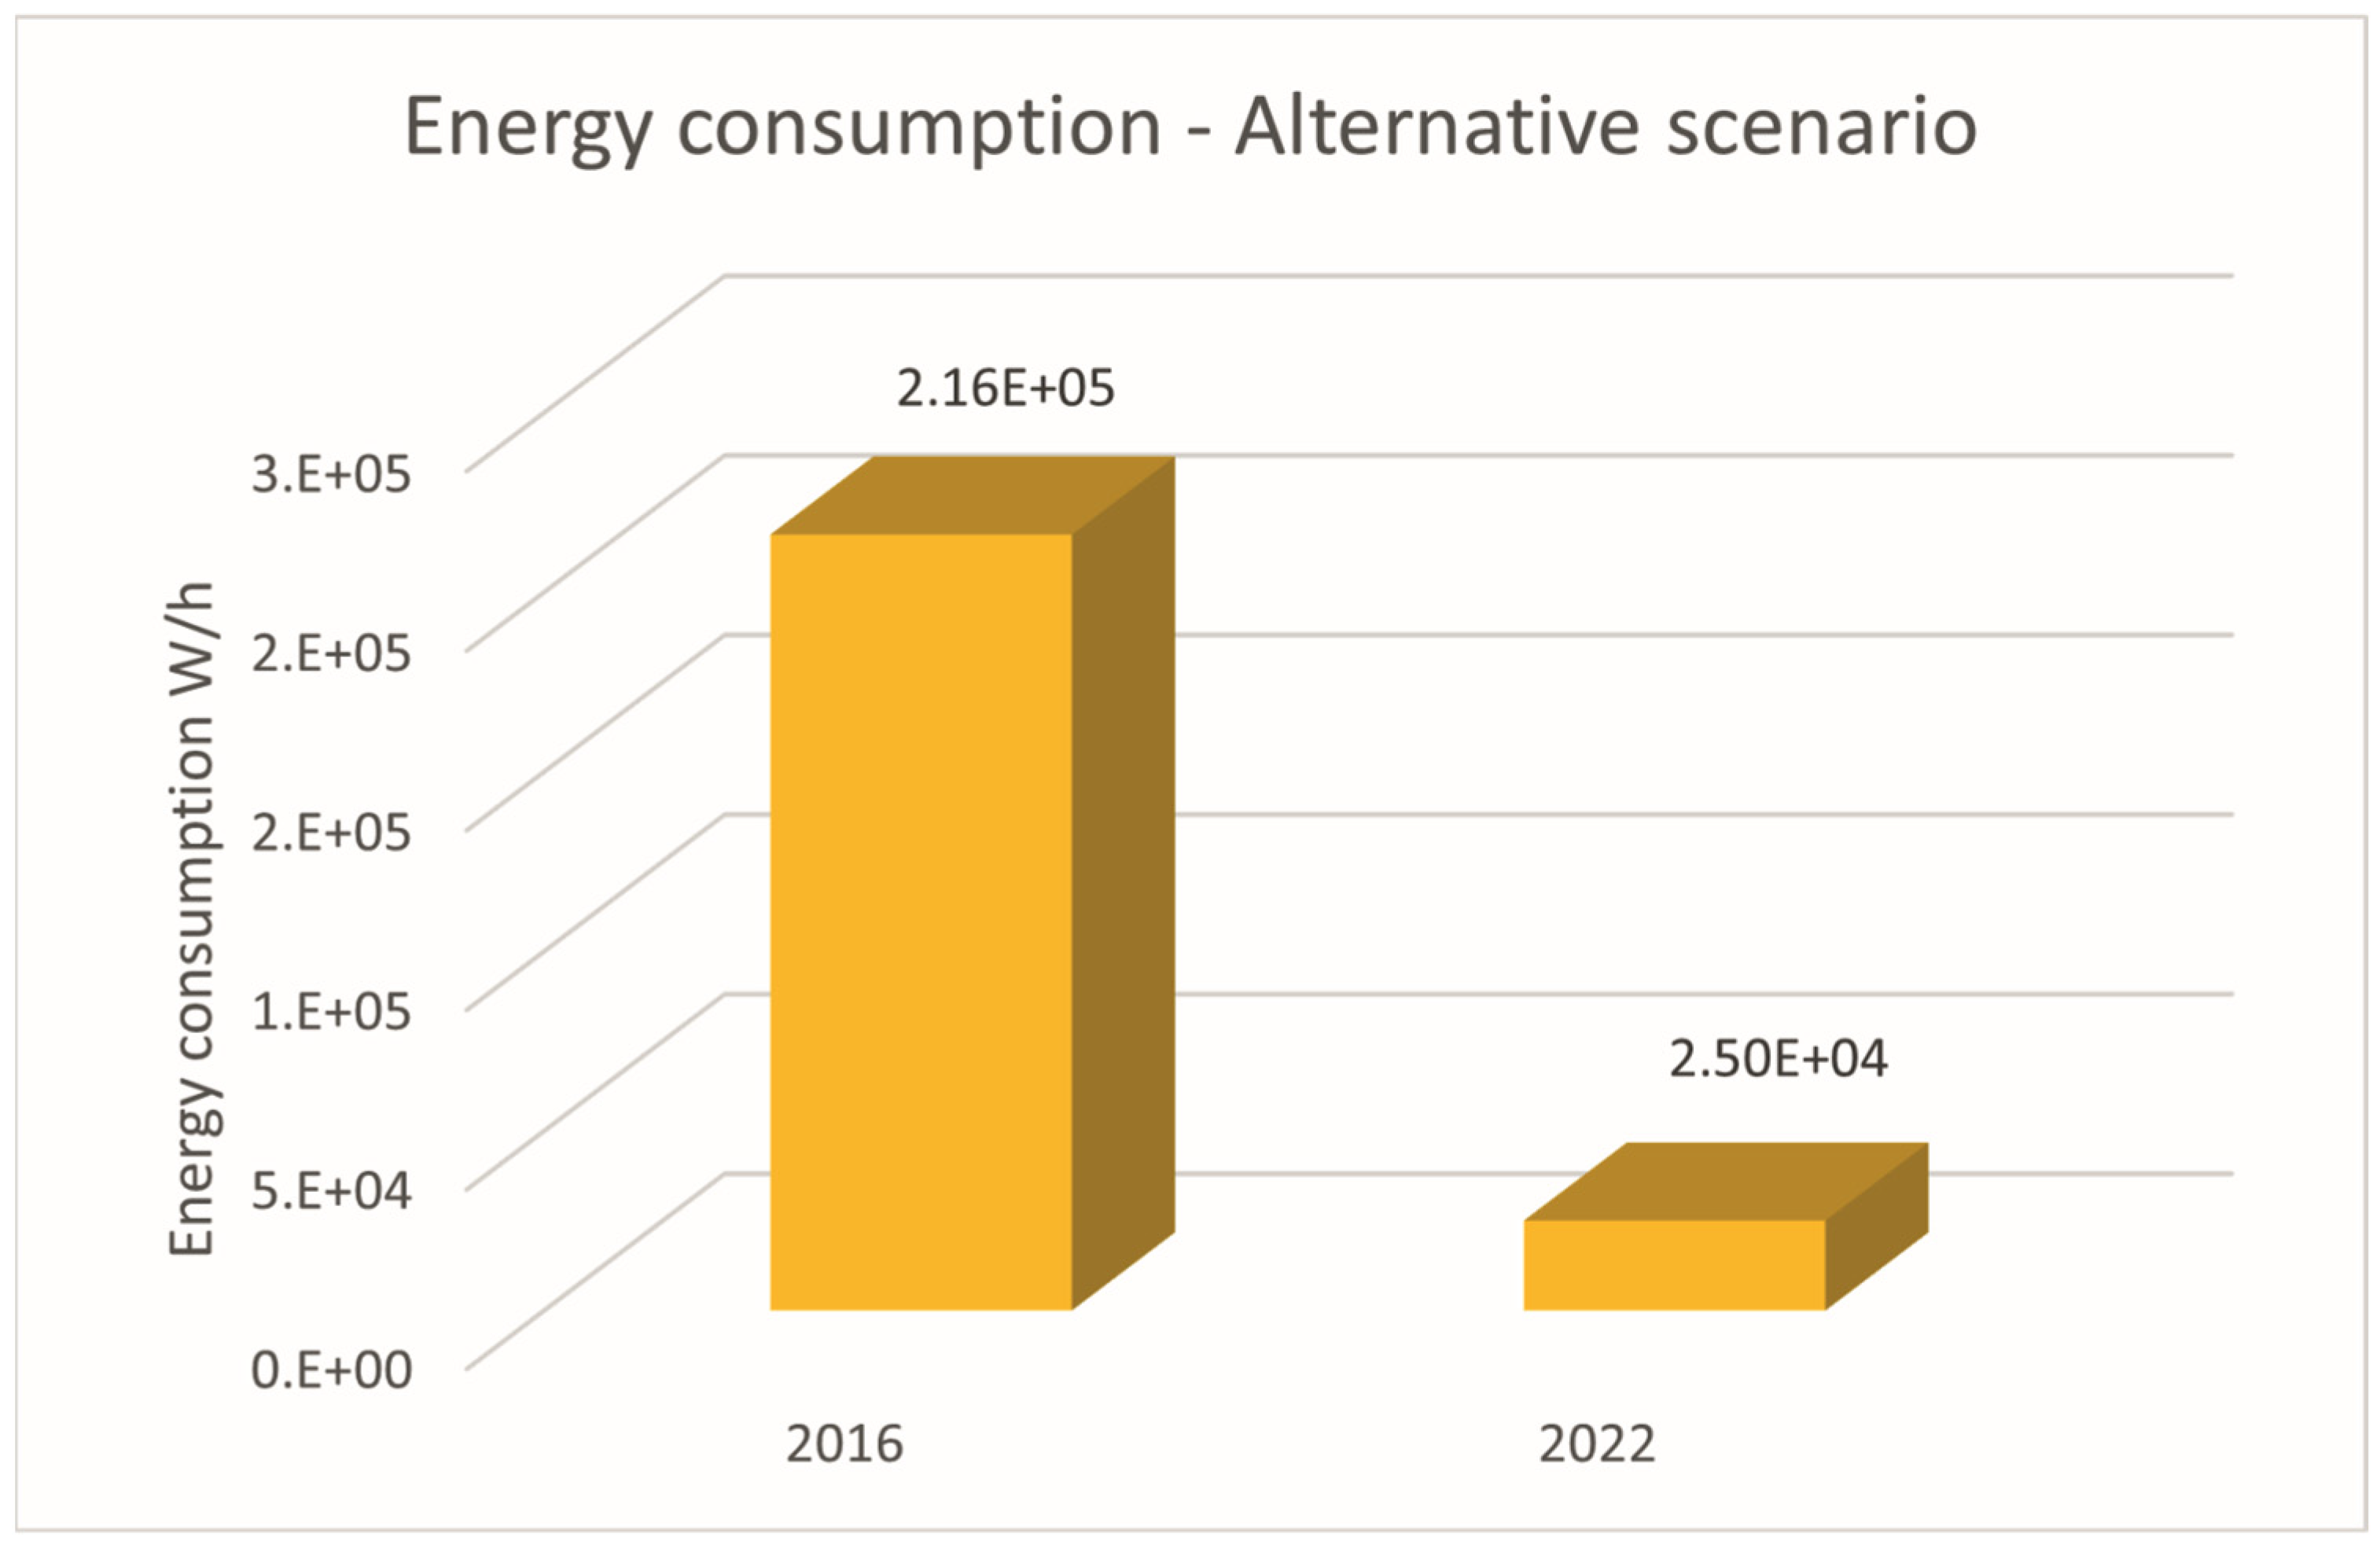
Figure 3 shows the values of the environmental indicator regarding energy consumption/hour. Considering these values, the Environmental vector is influenced by the results in a satisfactory way, where in 2016 an average energy consumption of IT equipment per hour of 216,000 W·h was found. Comparing these values with those obtained in 2022, after evaluation in the framework, with the inclusion of equipment with lower consumption, there is a reduction in the average consumption per hour, to 25,000 W·h, values that allow a better alignment with Green IT.
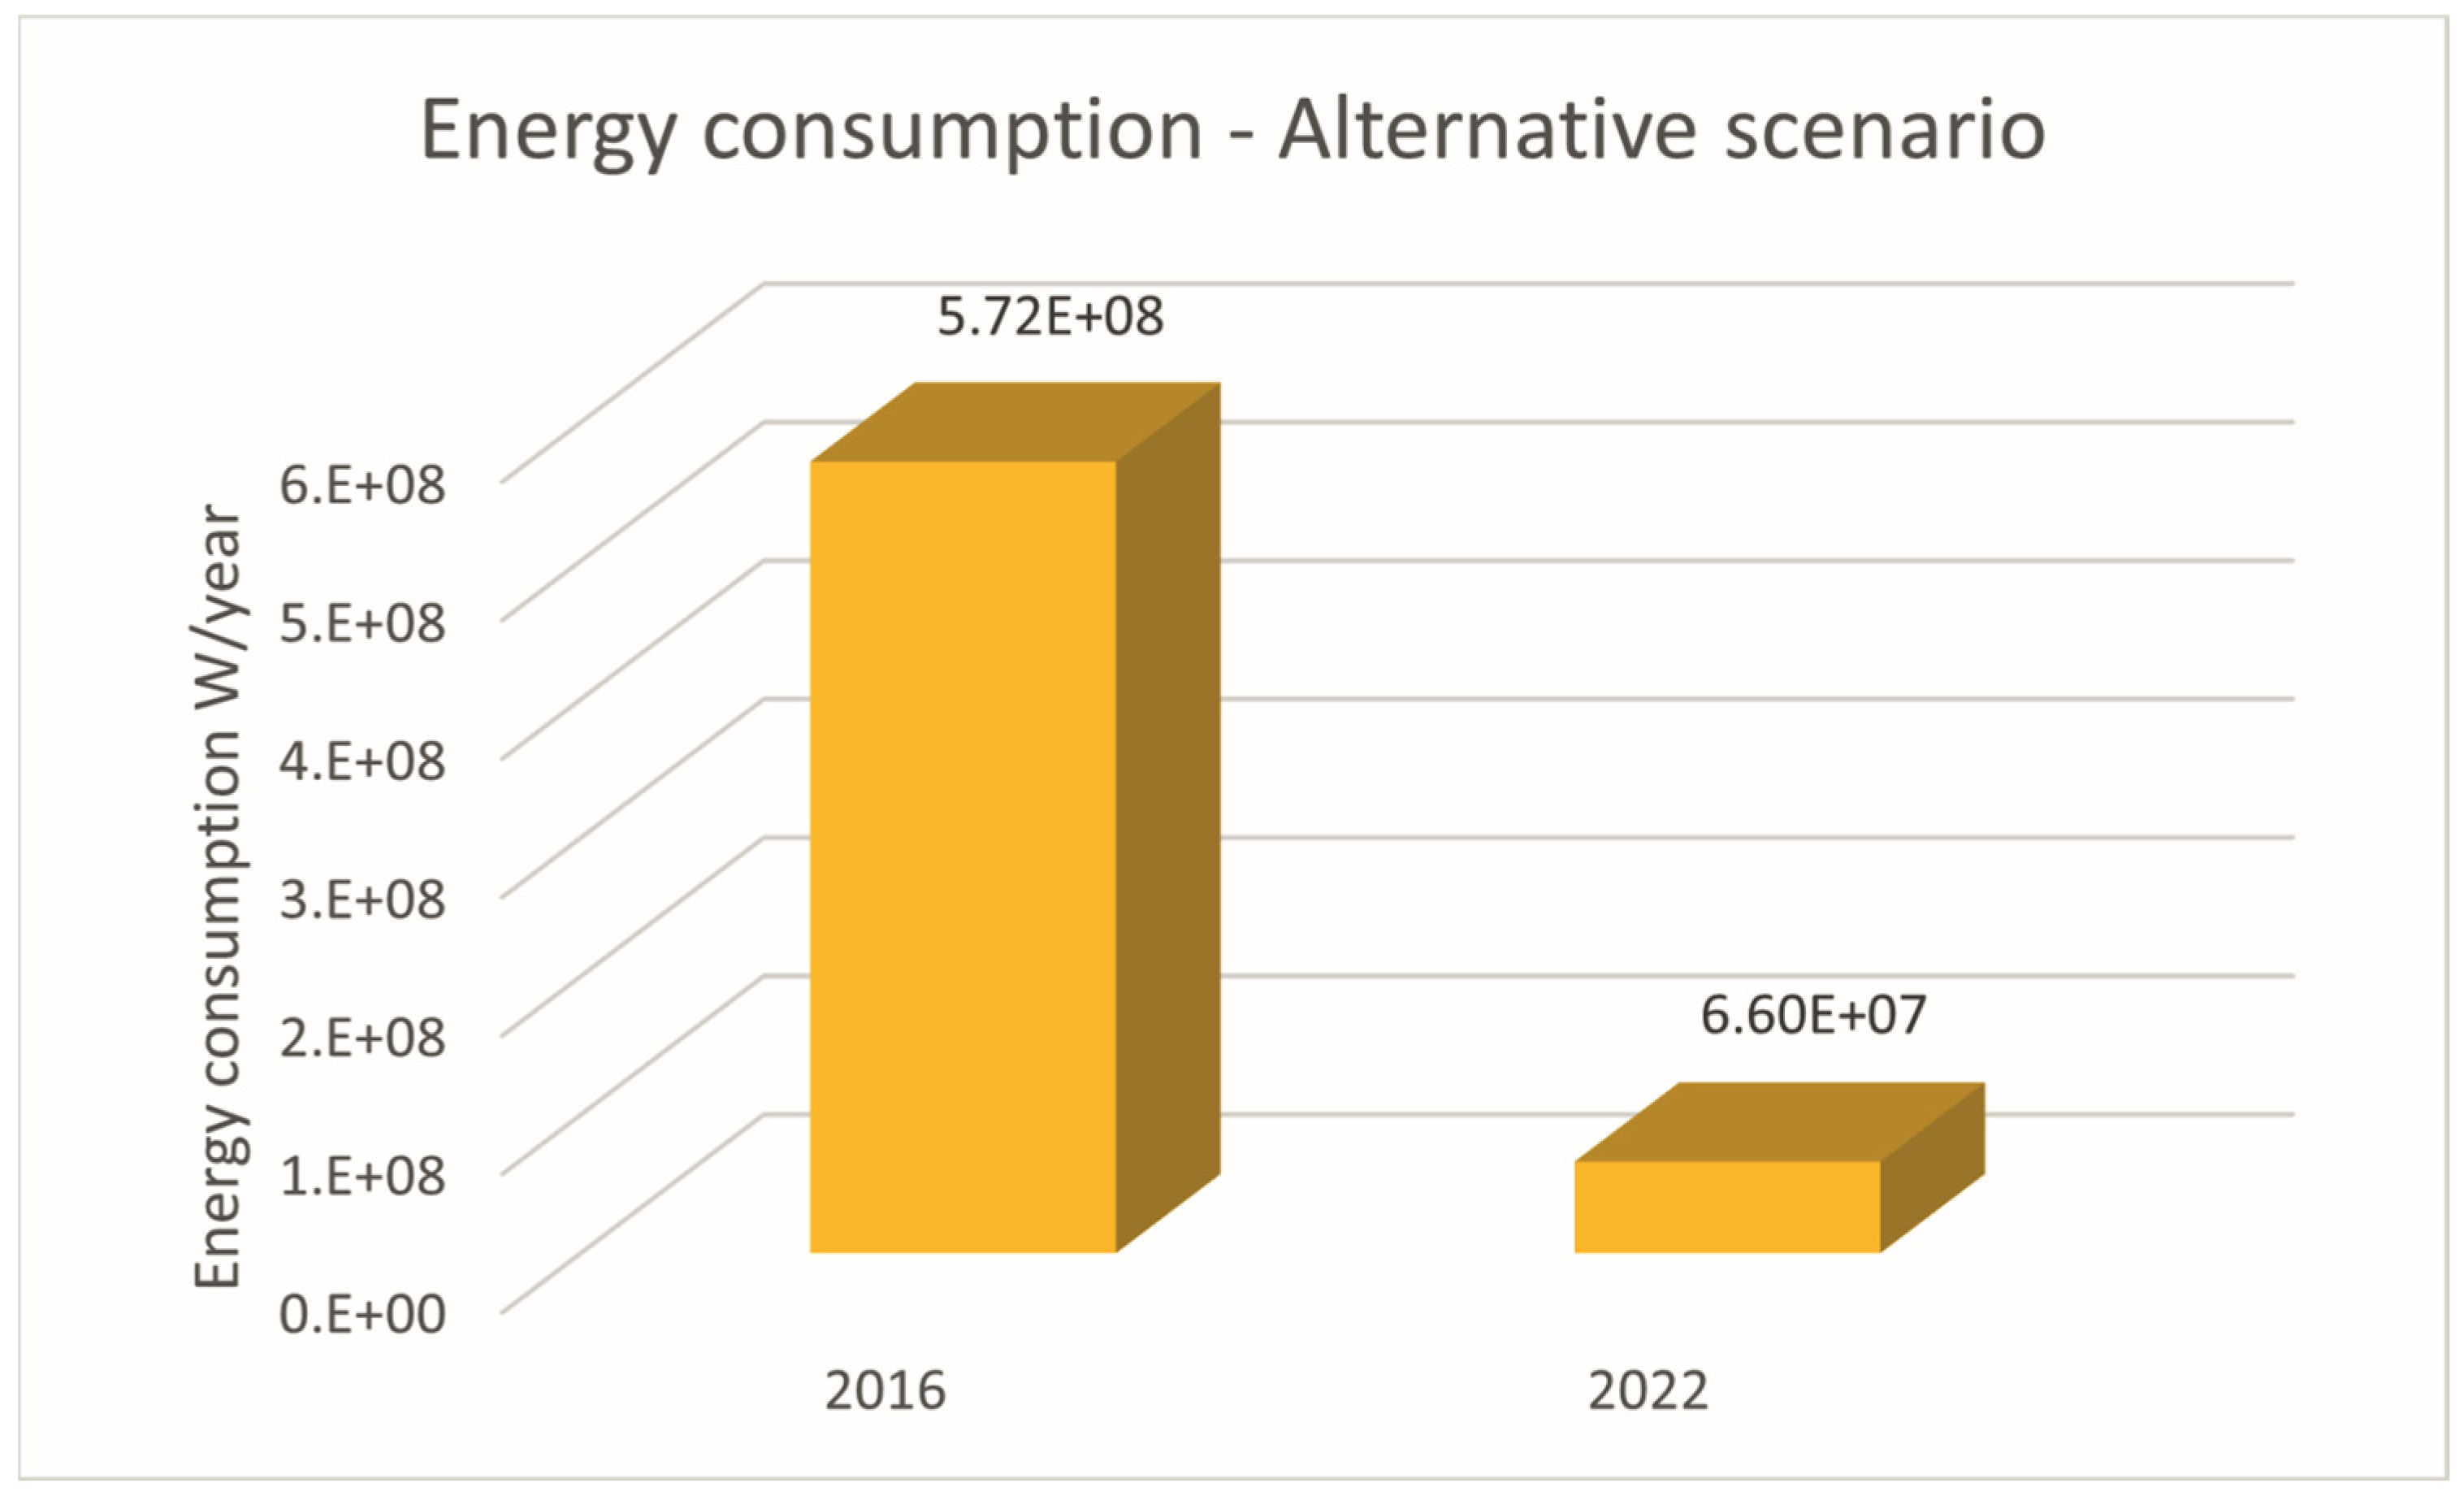
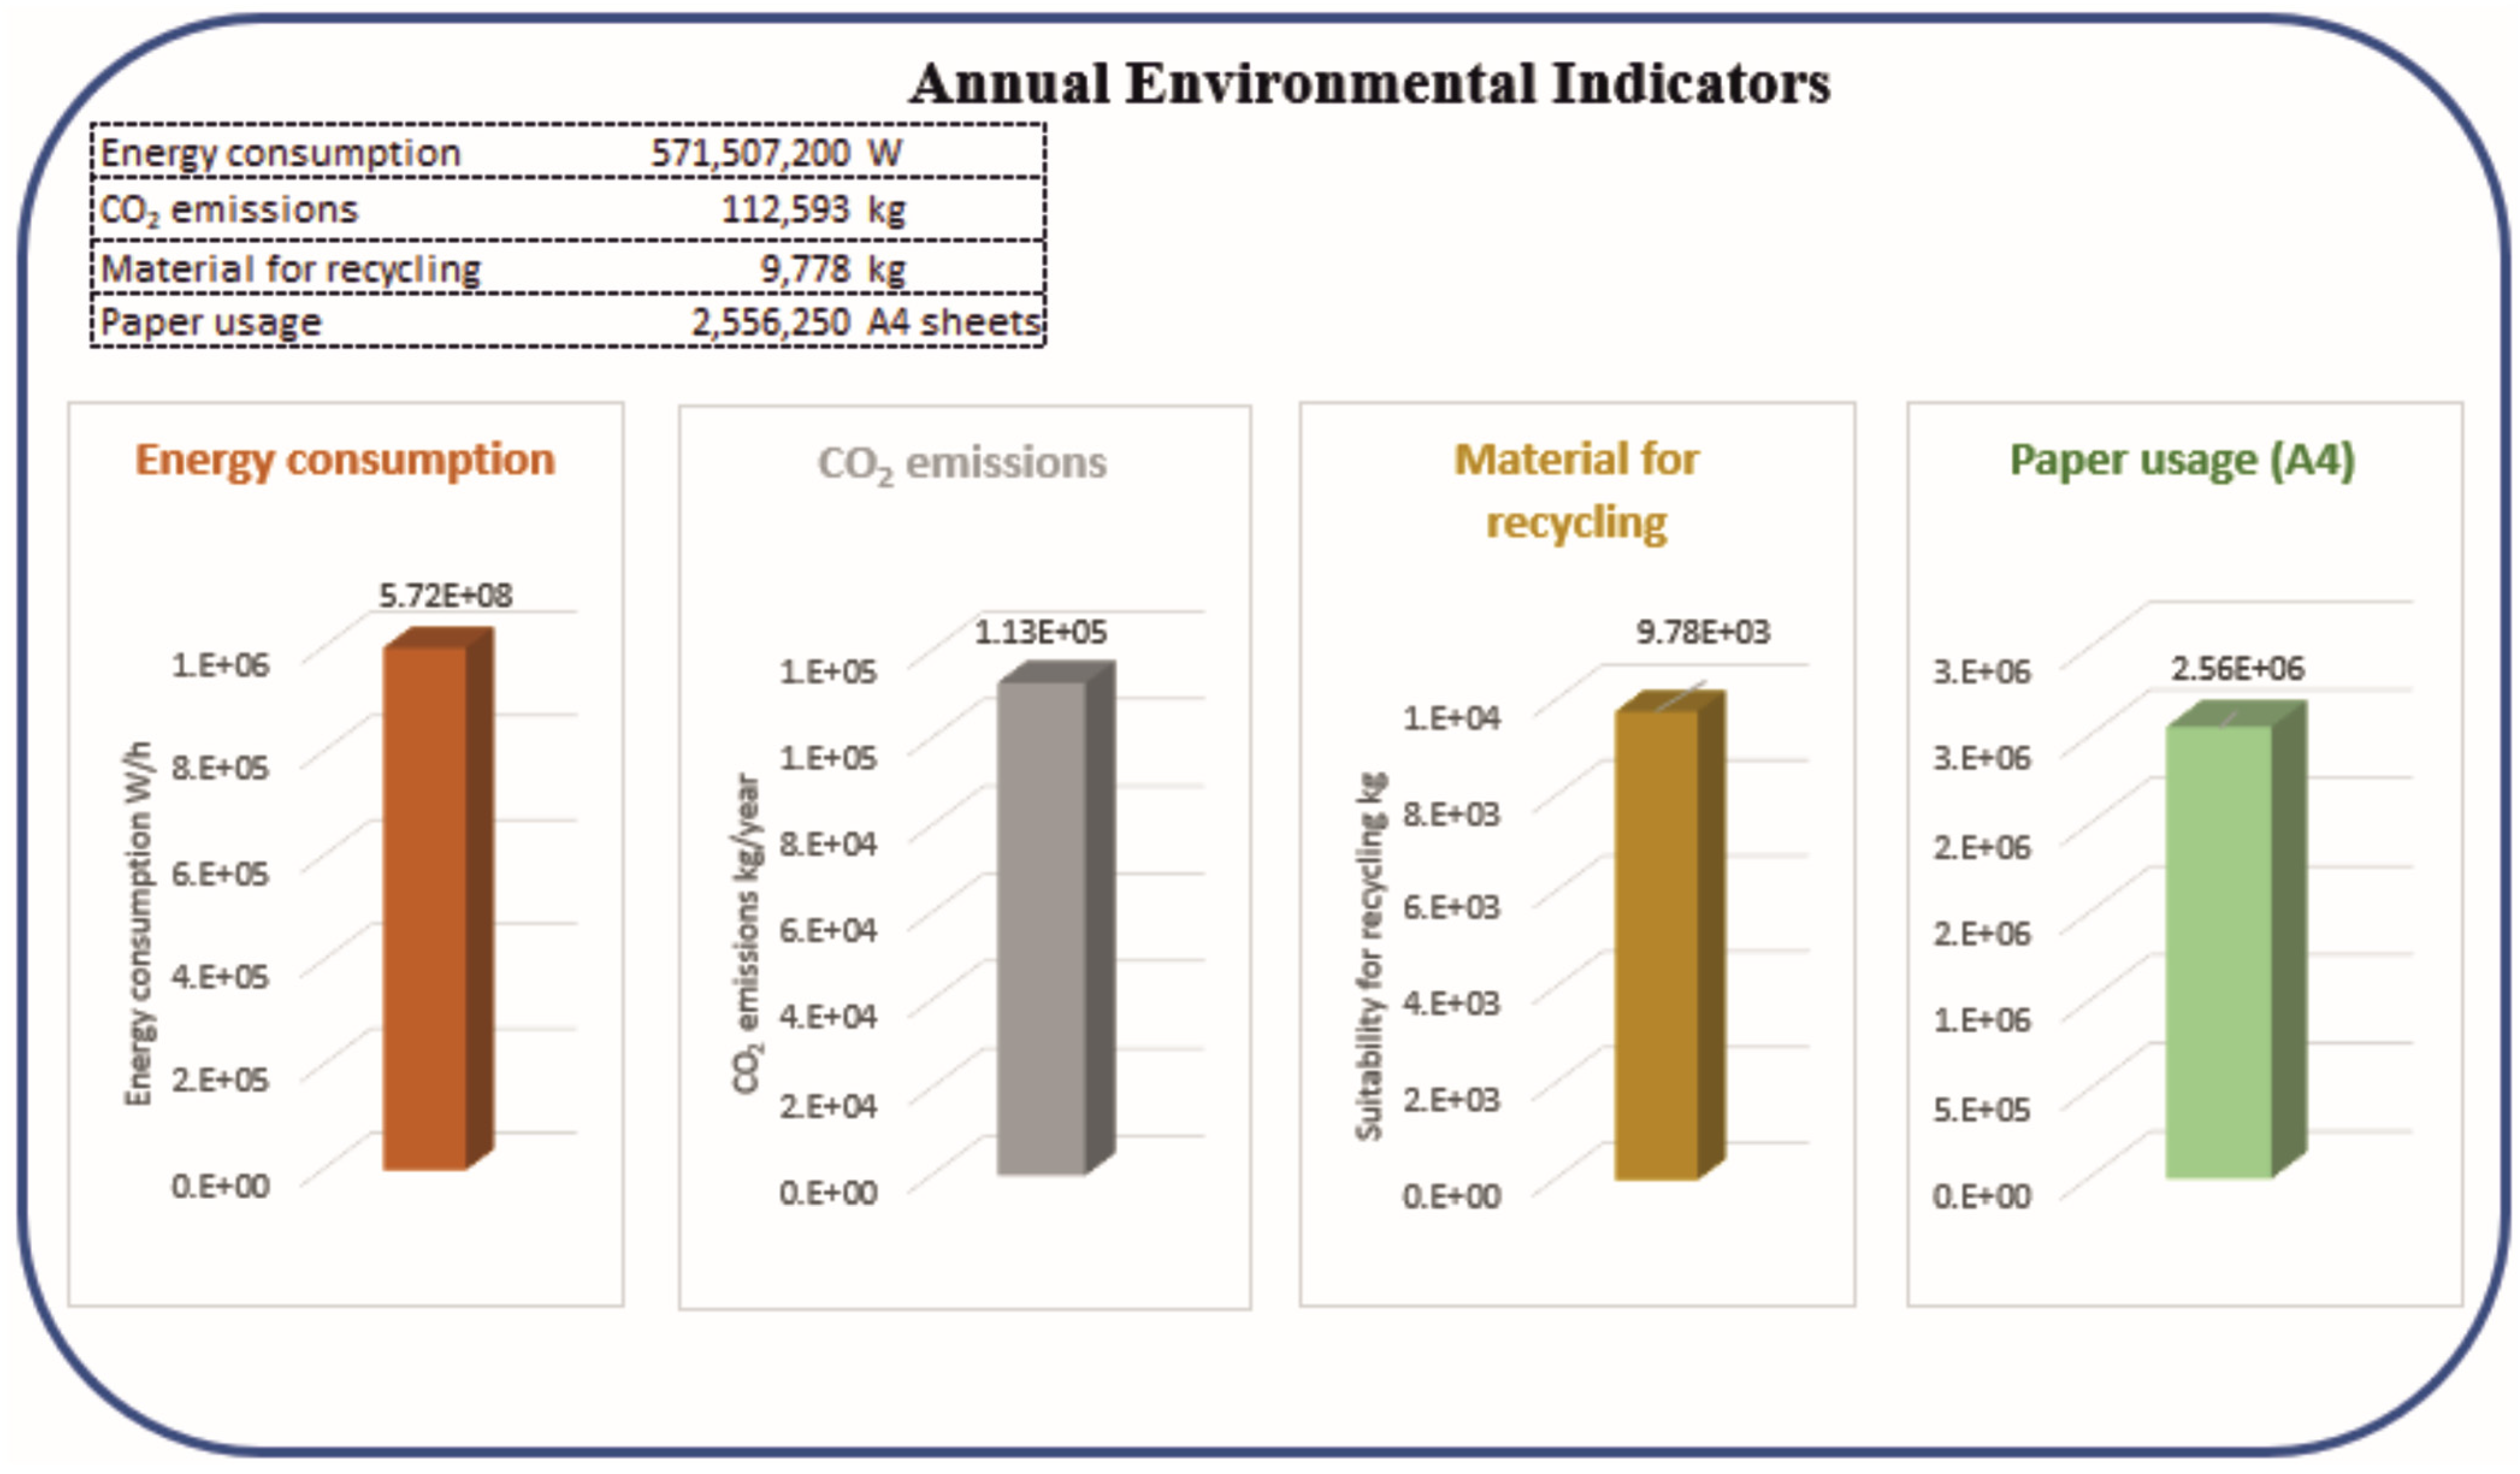
Figure 4 allows the observation of annual energy consumption, where in 2016 there was an average annual consumption of 571,507,200 W, and for the year 2022, this consumption reduced to 66,000,000 W, improving the contribution to Green IT to 25%.
Because of these results, the strategy of exchanging 400 PCs and CRT monitors for 400 thin clients and LCD monitors resulted positively, allowing a reduction in energy consumption of 191,000 W·h, corresponding to an annual reduction of 505,507,200 W.
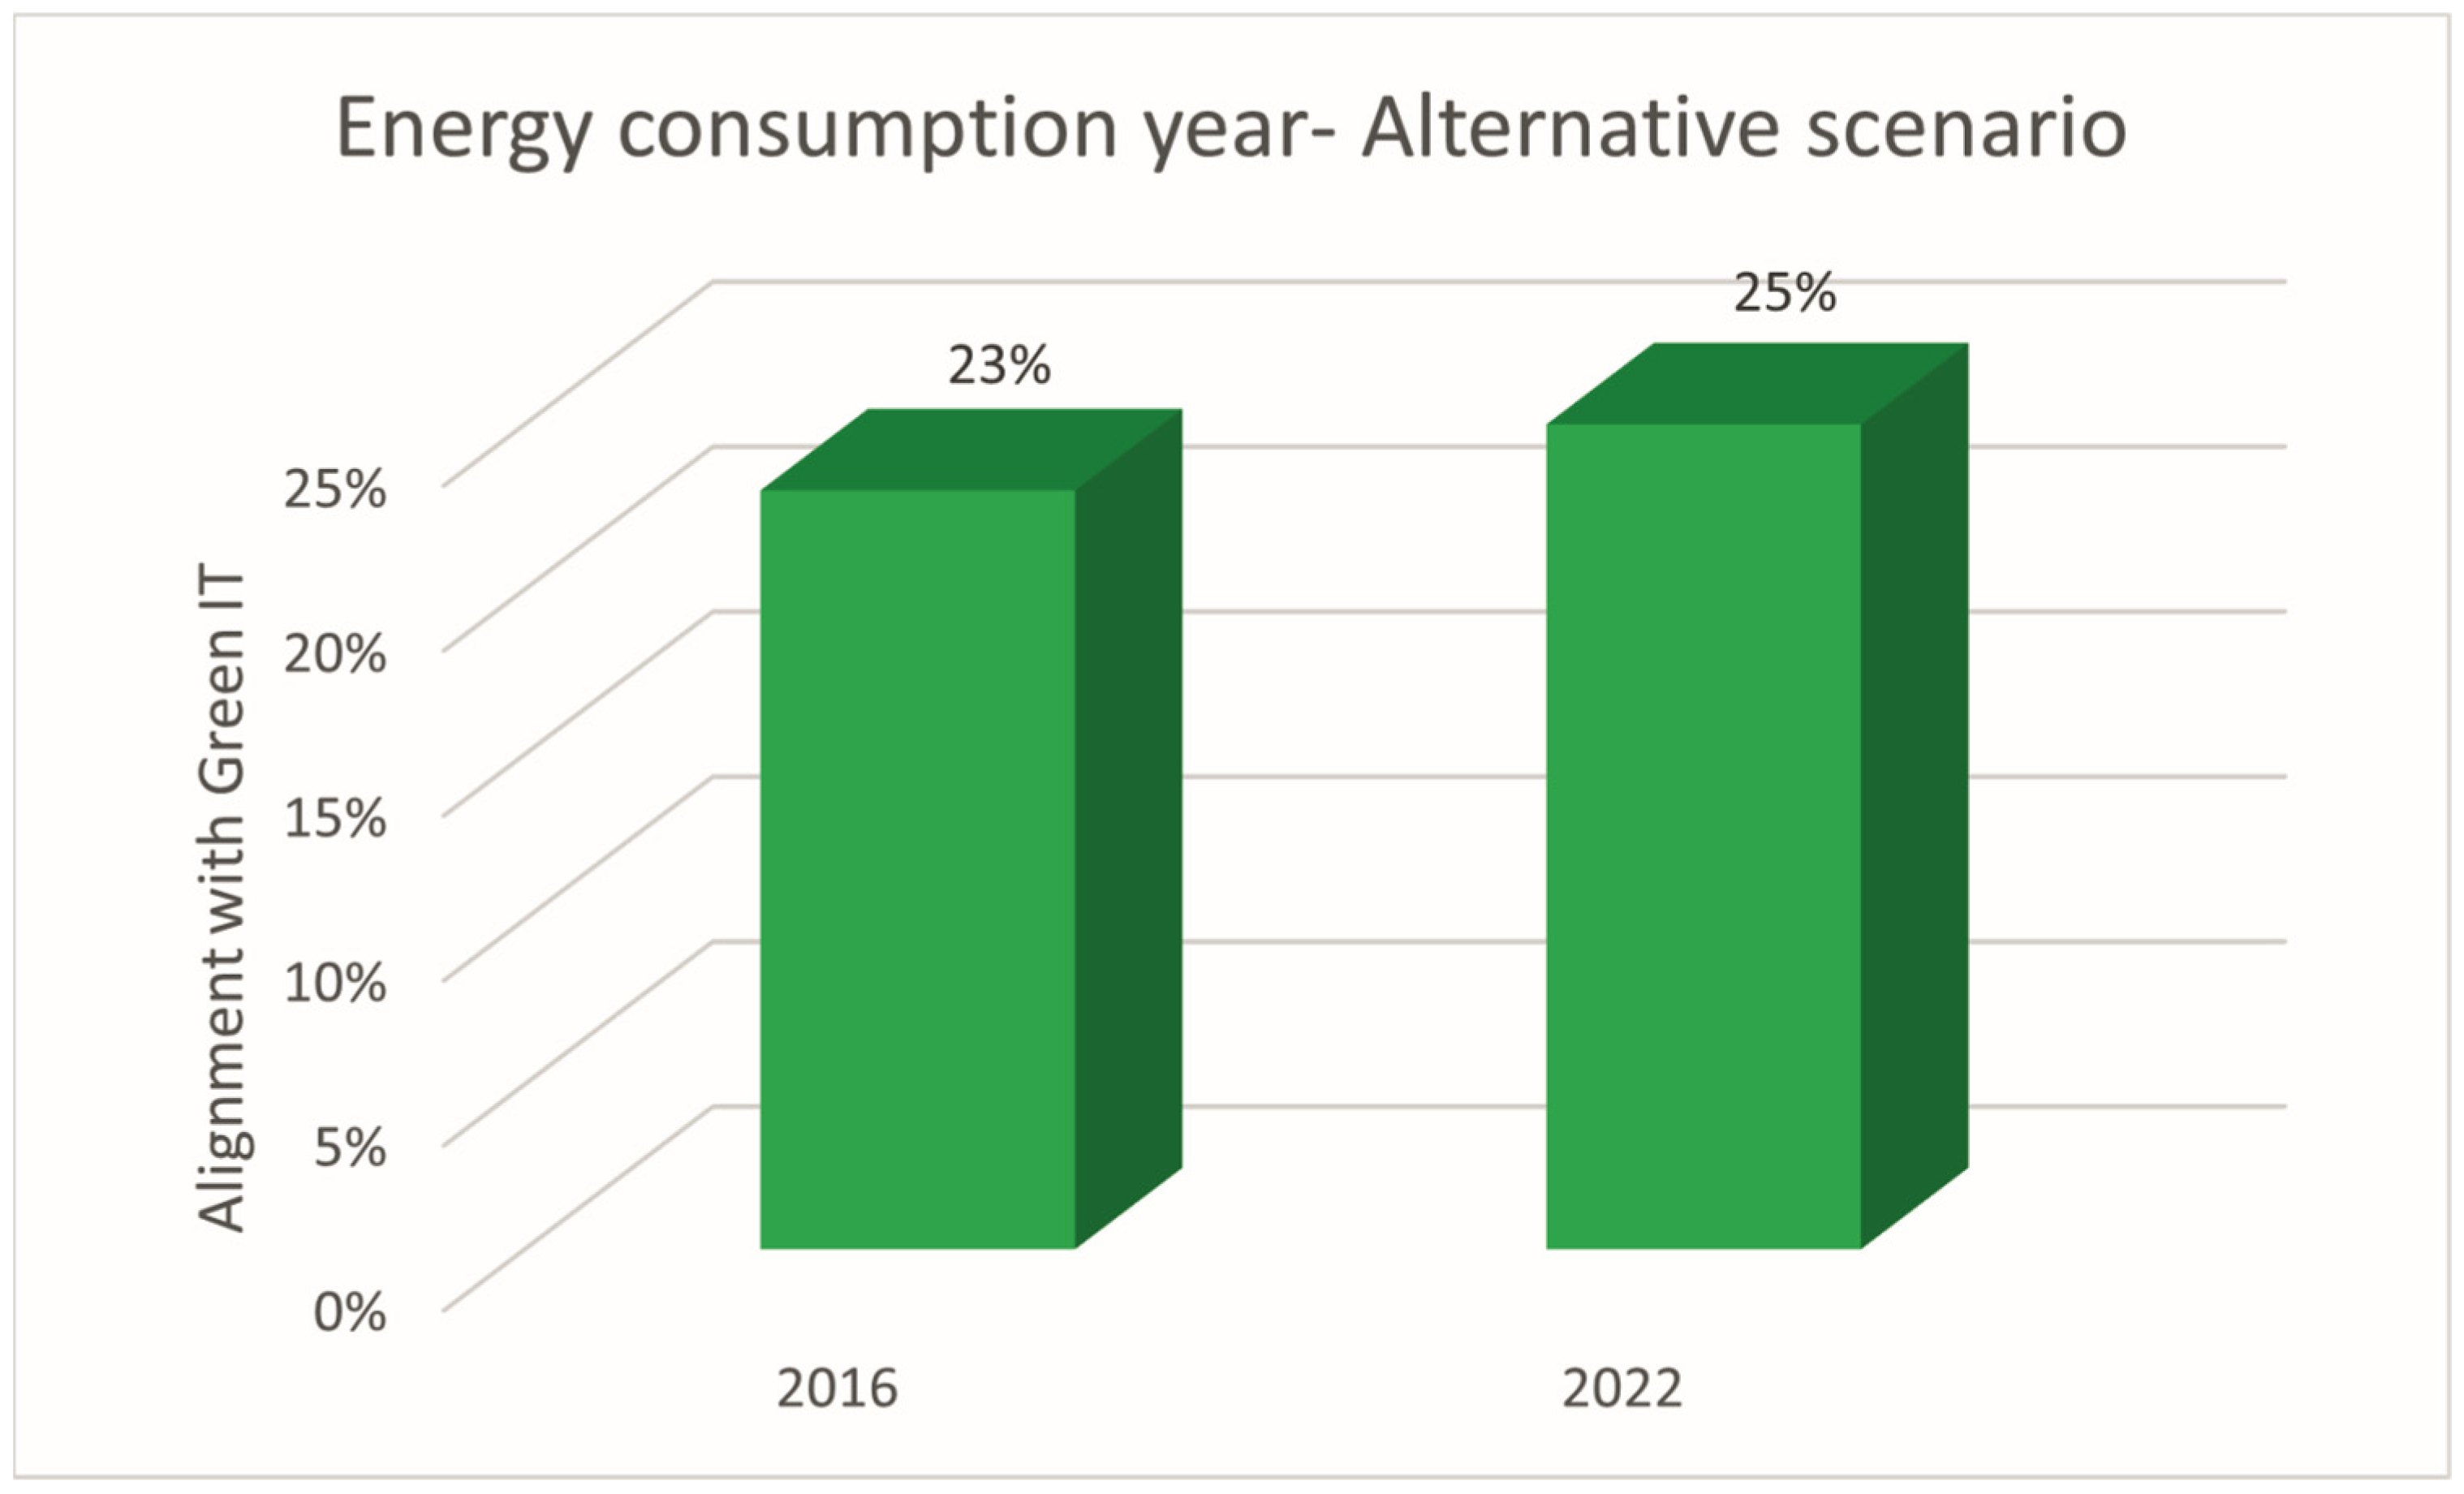
Figure 5 shows the values of improvement in the alignment with Green IT and energy consumption. The results in 2022 can also be observed, also positive, demonstrating a better alignment in annual consumption, going from 23% to 25%.
Consequently, the reduction in CO2 emissions into the atmosphere will also be a reality. Look at the data of this indicator in Figure 6, where it can be seen that emissions in 2016, as a result of energy consumption, reached the approximate values of 112,593 kg of CO2 in one year. In turn, the values in 2022 reduced to about 13,000 kg per year, as a result of the strategic changes made.
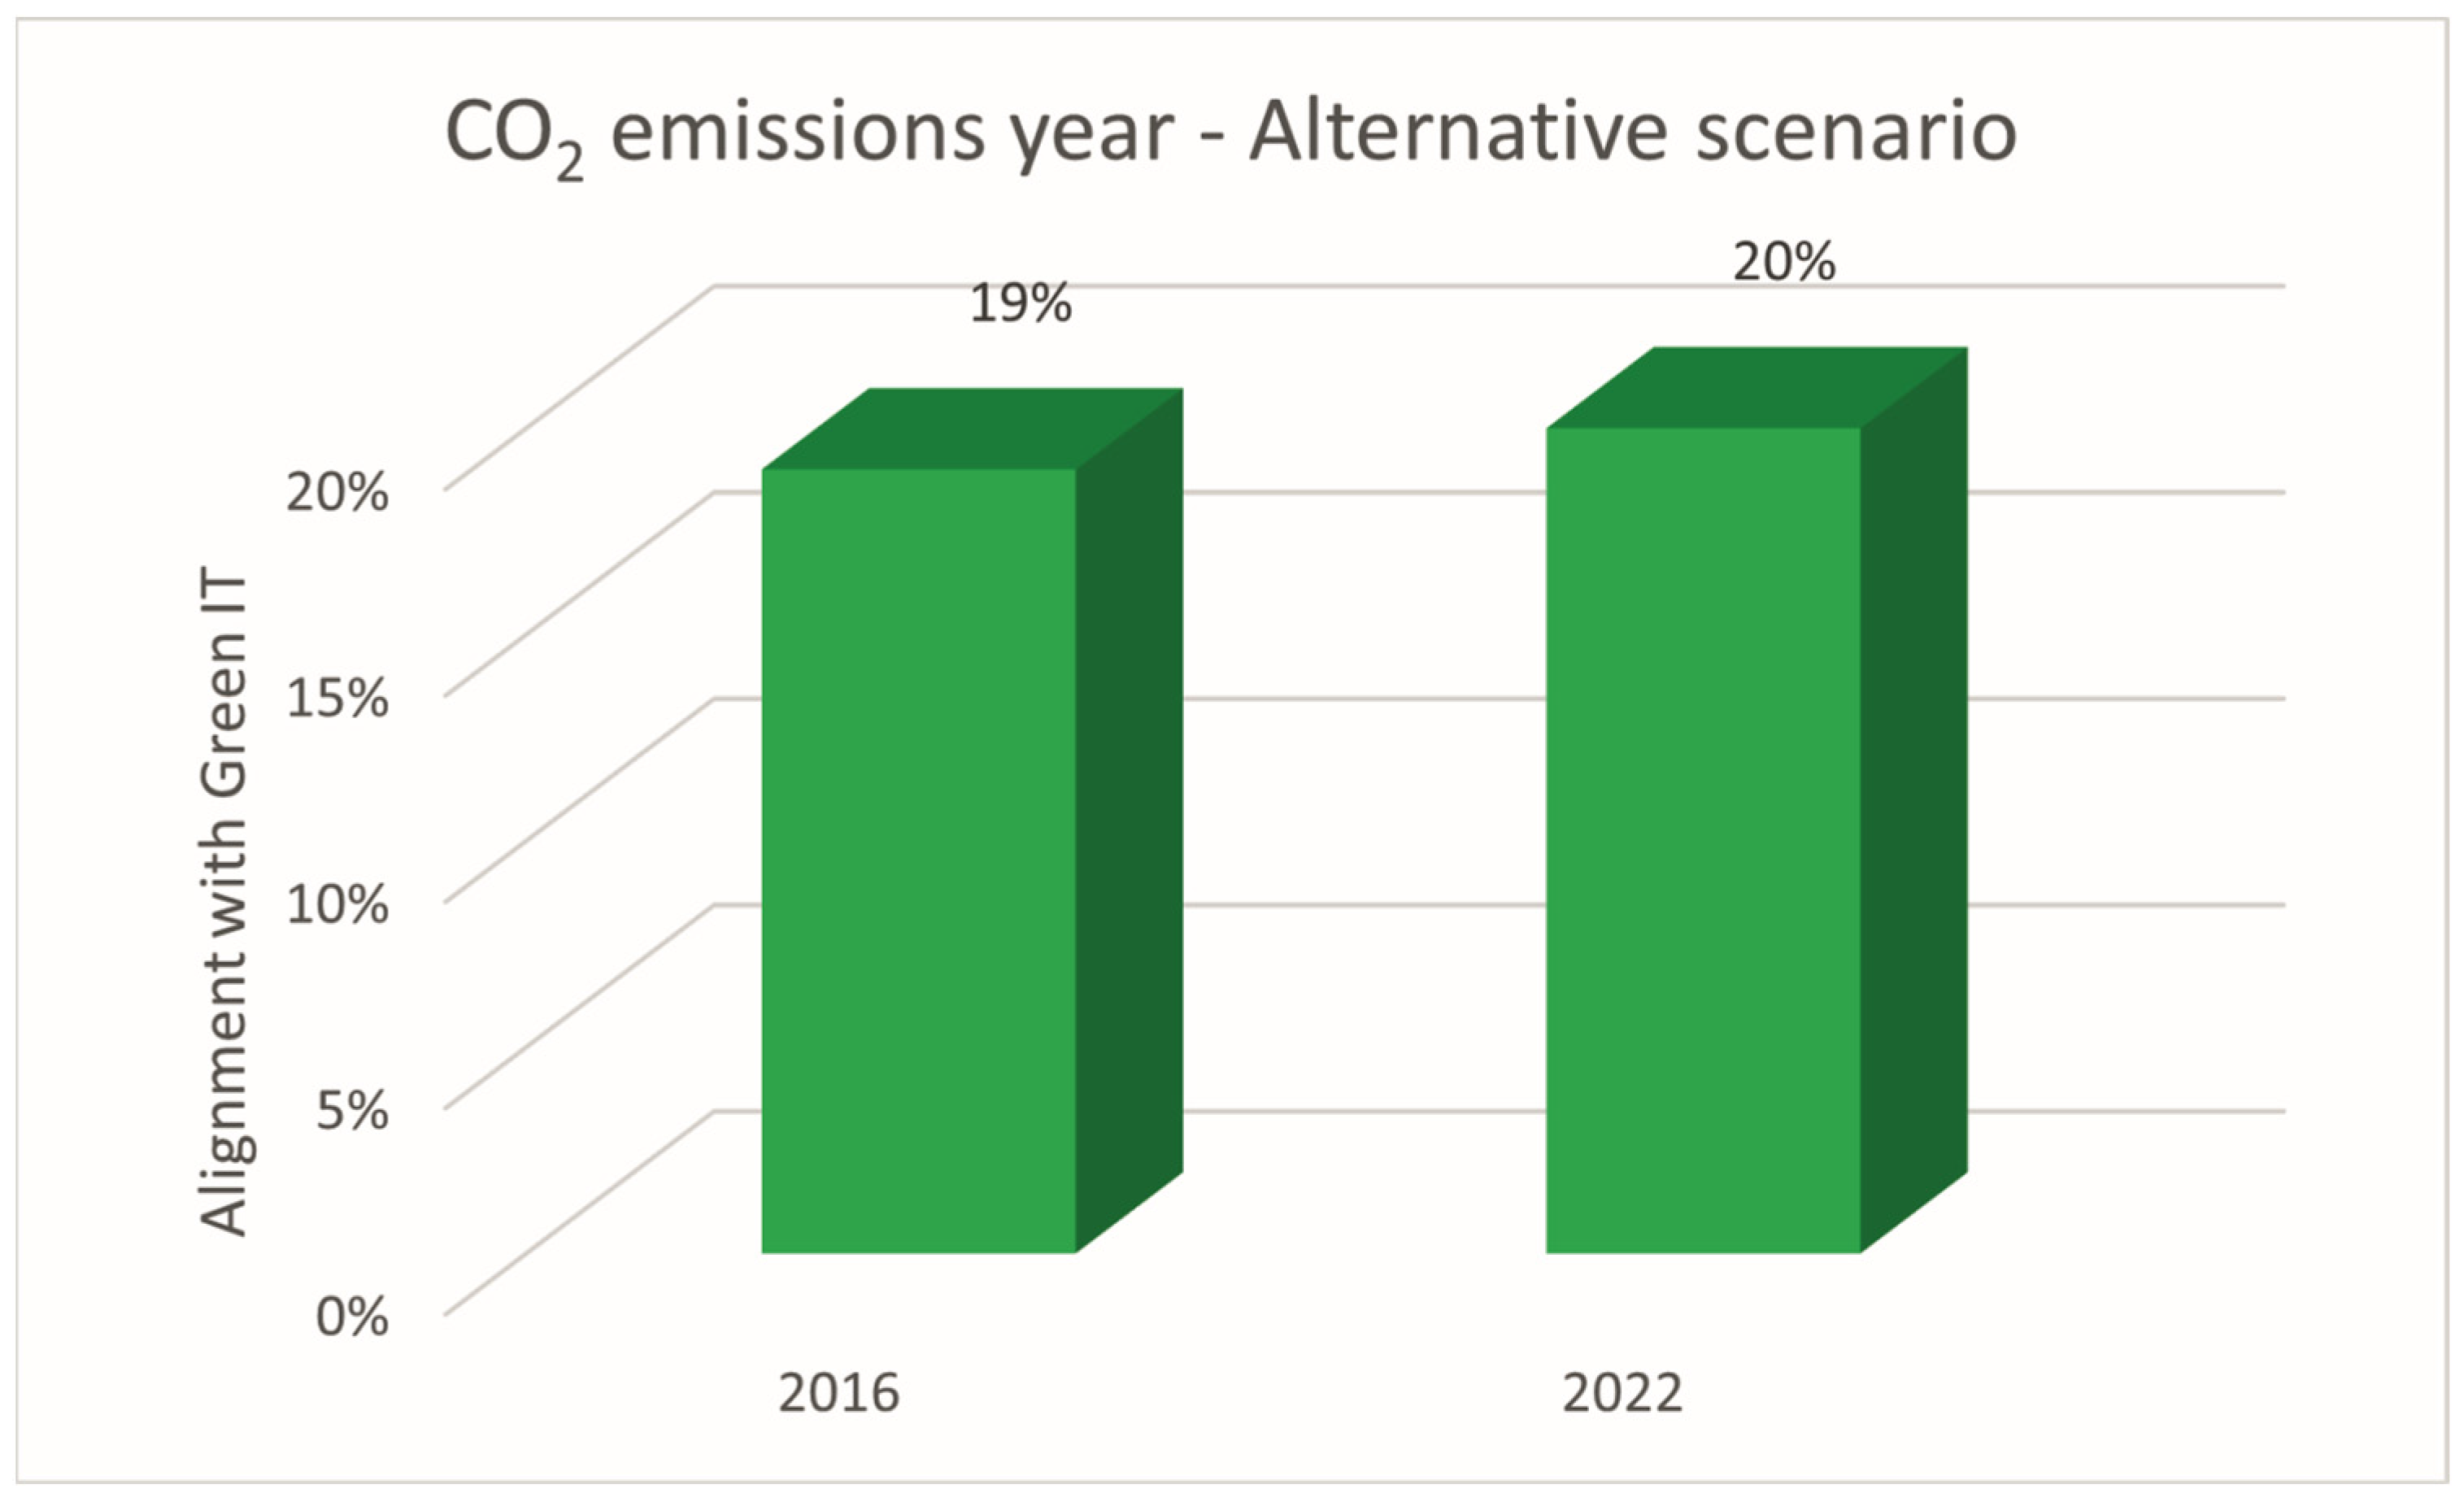
Using the values resulting from the strategy adopted, a reduction of 99,593 kg in CO2 emissions into the atmosphere can be achieved. Figure 7 therefore shows the values of the alignment of CO2 emissions with Green IT. Also in this indicator, the results in 2022, with 20%, are positive compared to 2016, where it had 19%, demonstrating a better contribution to the objective of alignment with Green IT.
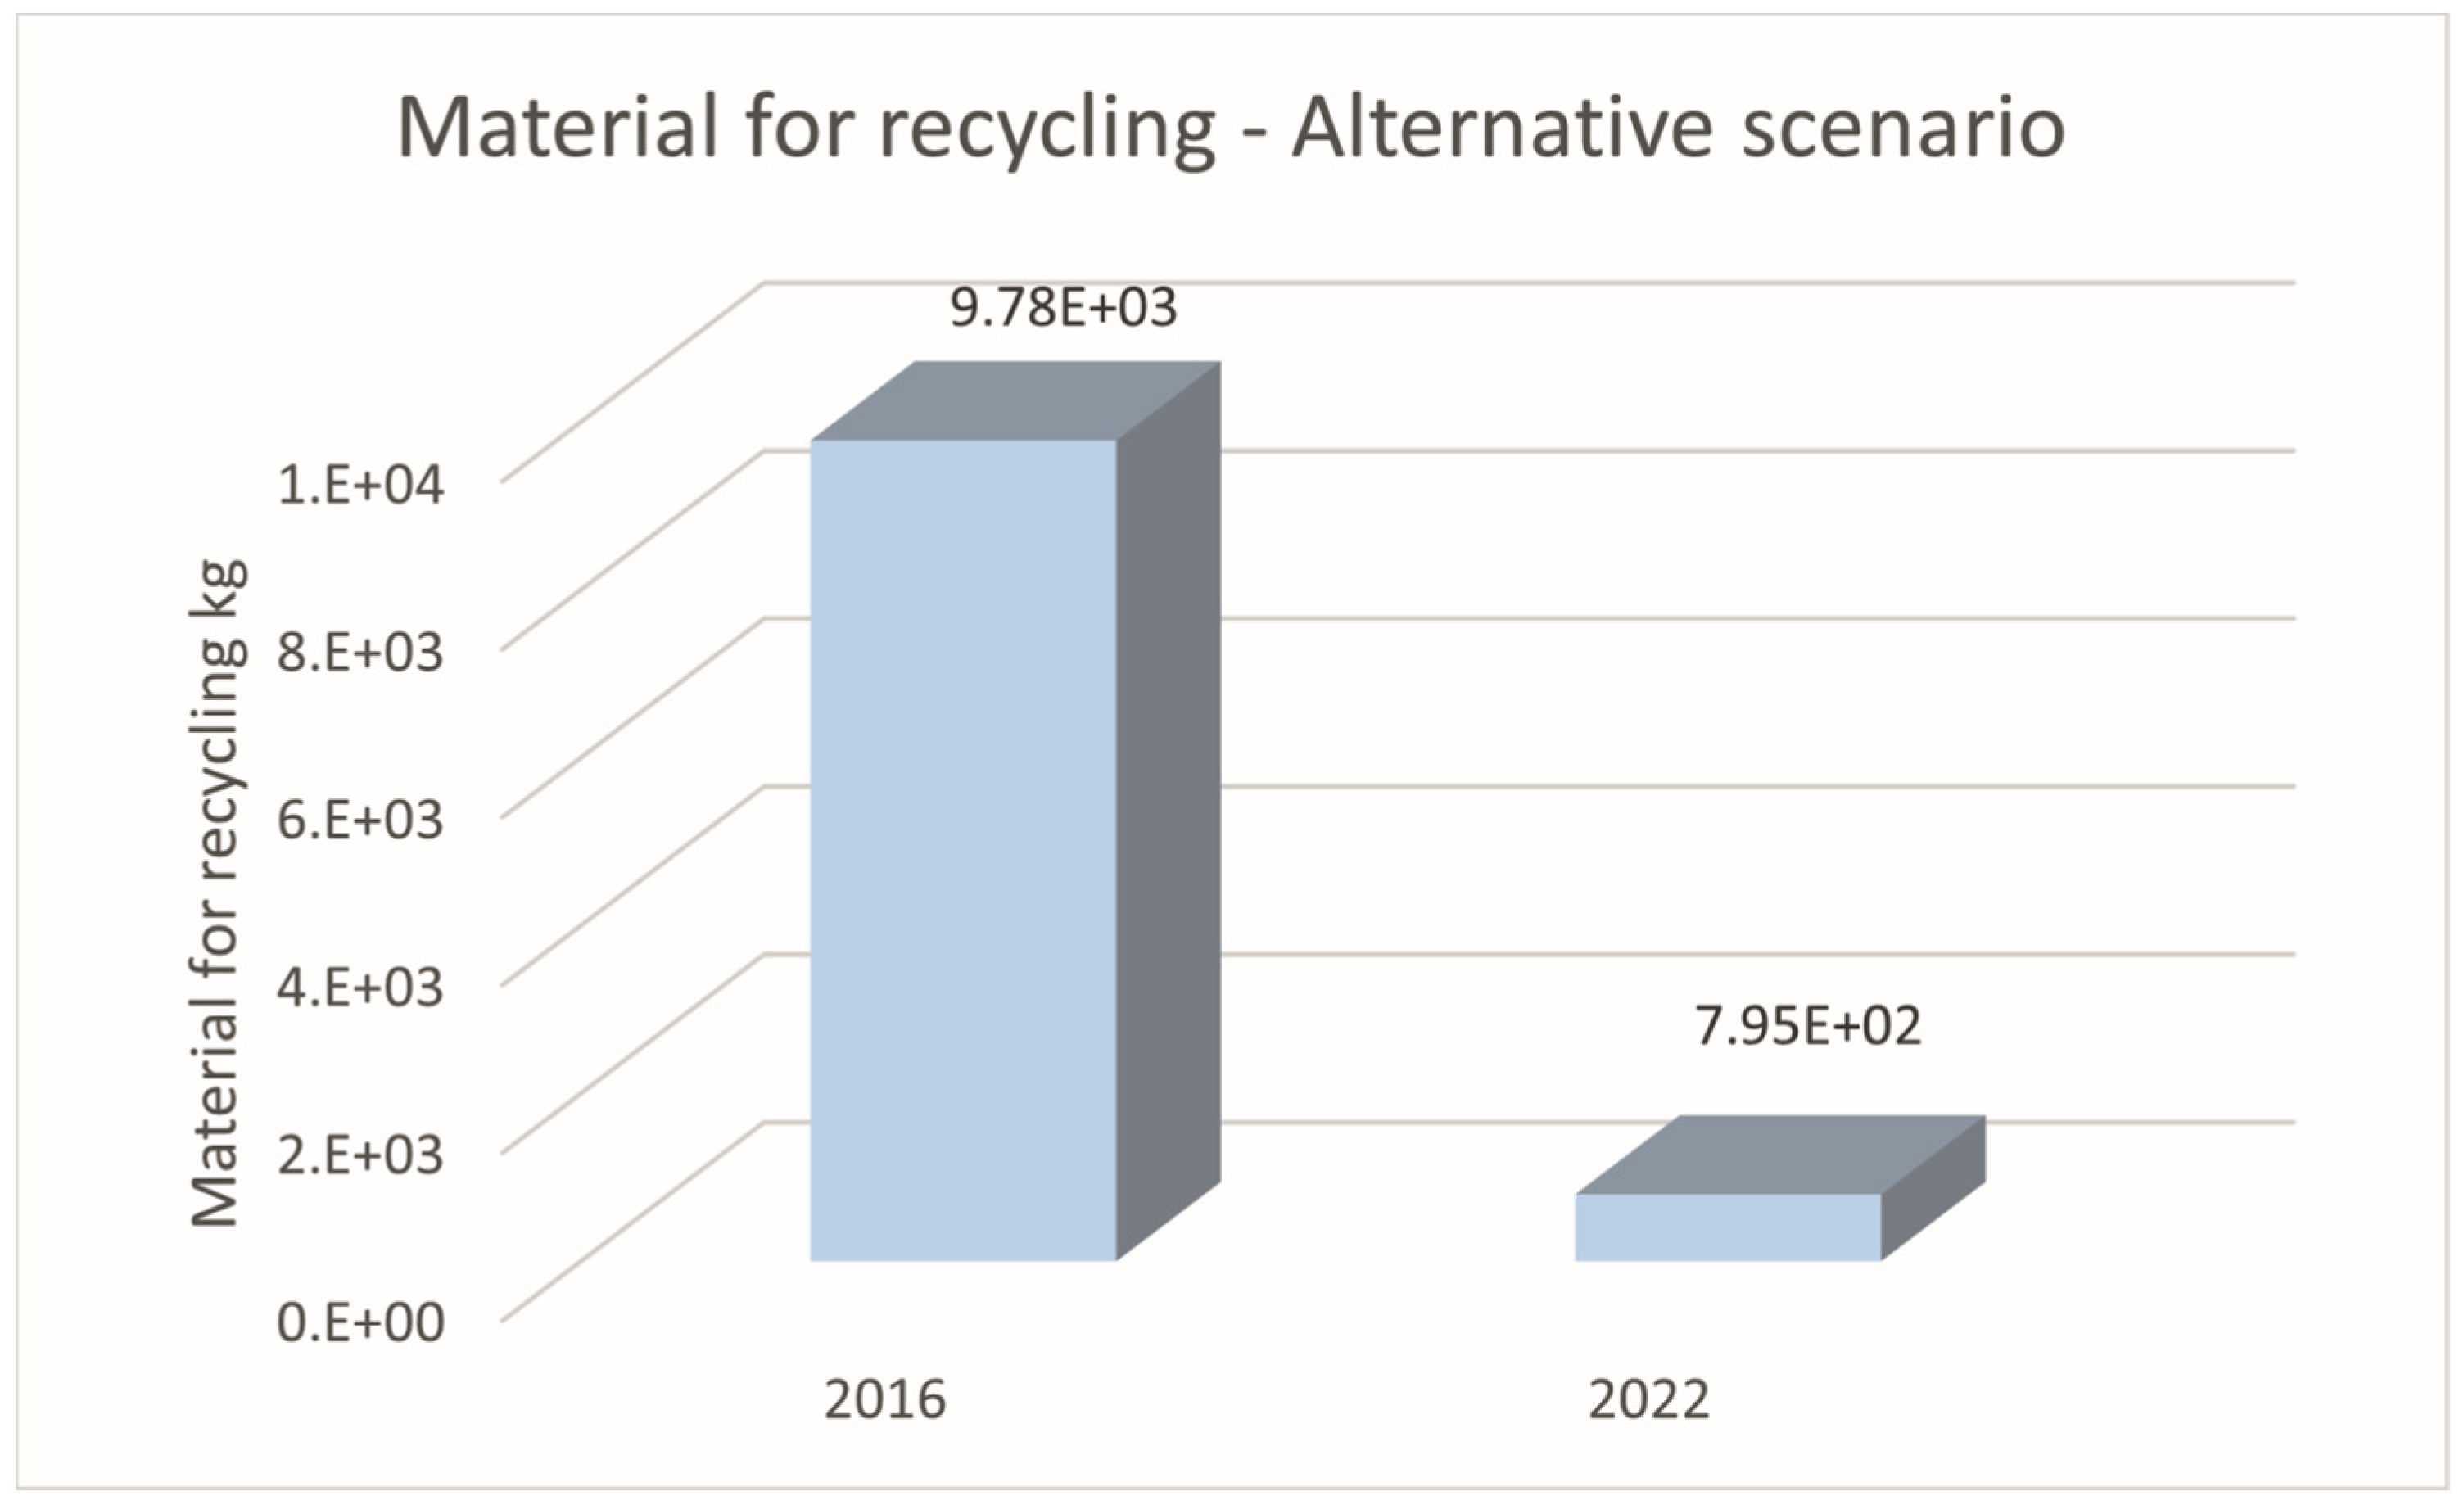
In the next environmental indicator, suitability for recycling in Figure 8, the values of 258 PCs and CRT monitors for slaughter and recycling are used. In 2016, these add up to a total of about 9800 kg of material, and for 2022, estimated values of the same amount of equipment were used but according to those used after the implementation of the adopted strategy, replacing them with 258 thin clients and LCD monitors. In this scenario, a reduction of about 9000 kg of material is observed, increasing the values to about 800 kg.
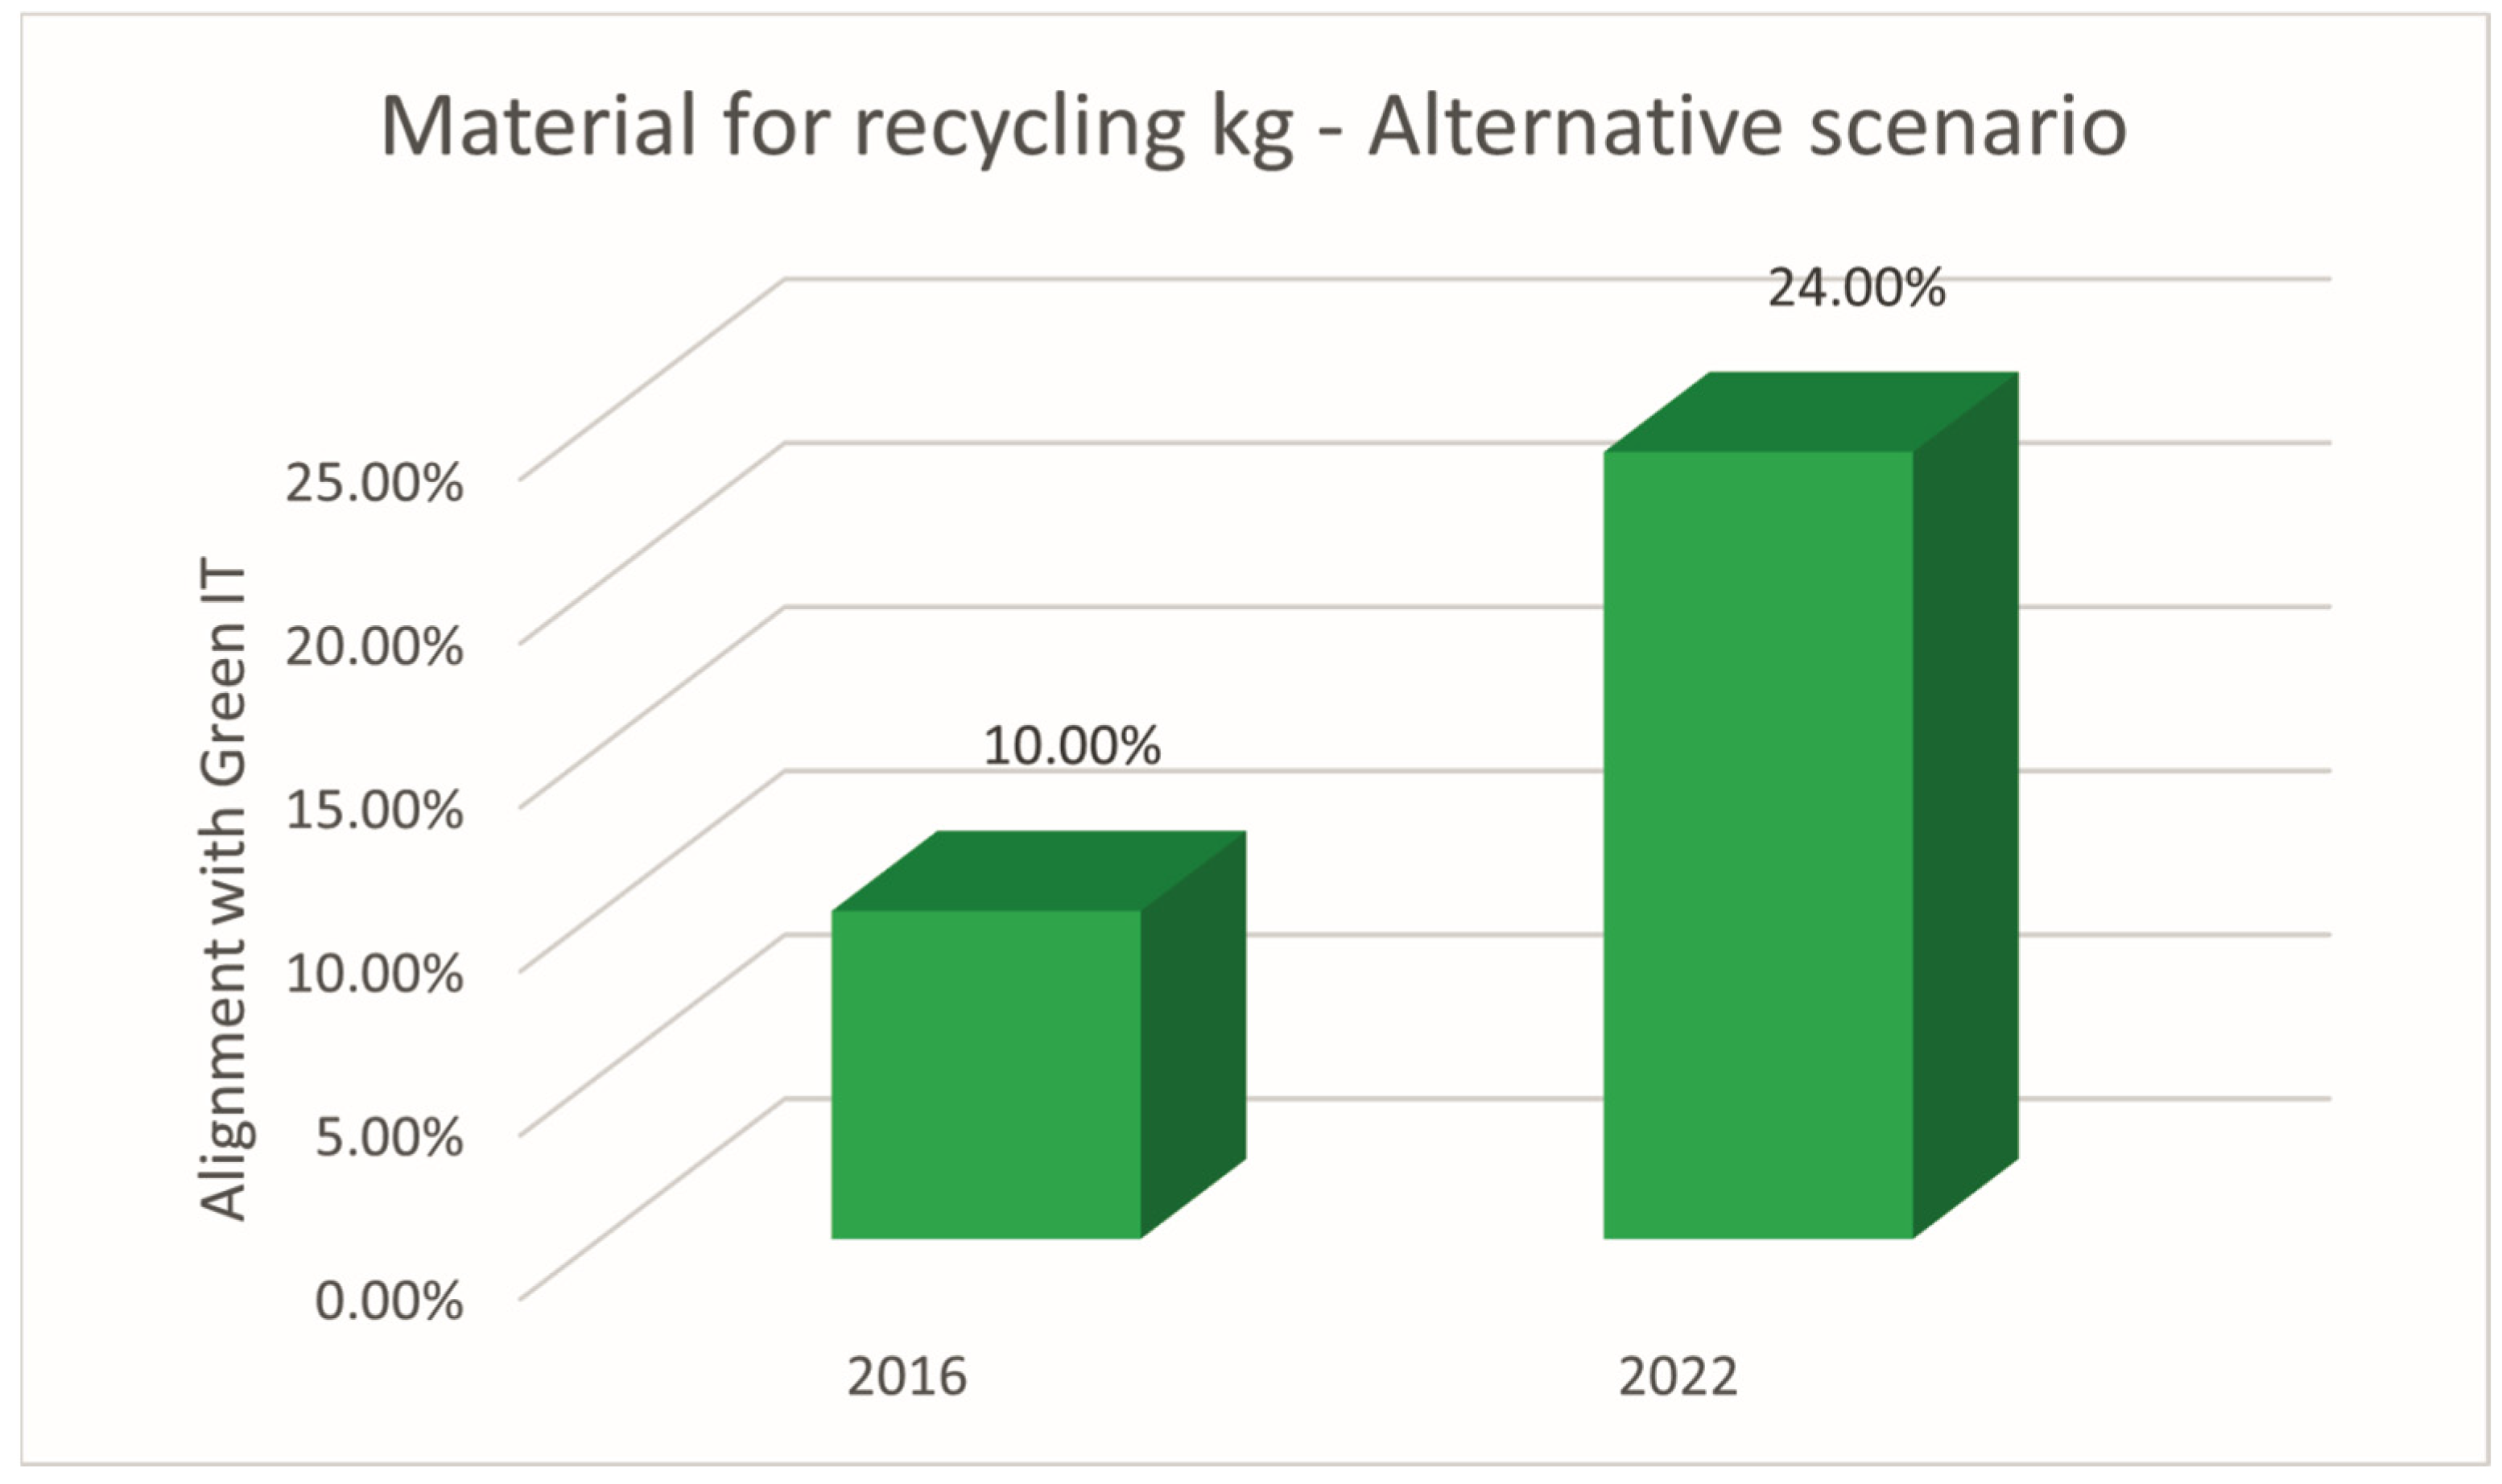
The figures shown in Figure 9 confirm an improvement in the alignment of suitability for recycling with Green IT, where in 2016 there was a 10% alignment, and in 2022 there was a 24% alignment: Again, there is an environmental improvement and less quantity of hazardous materials.
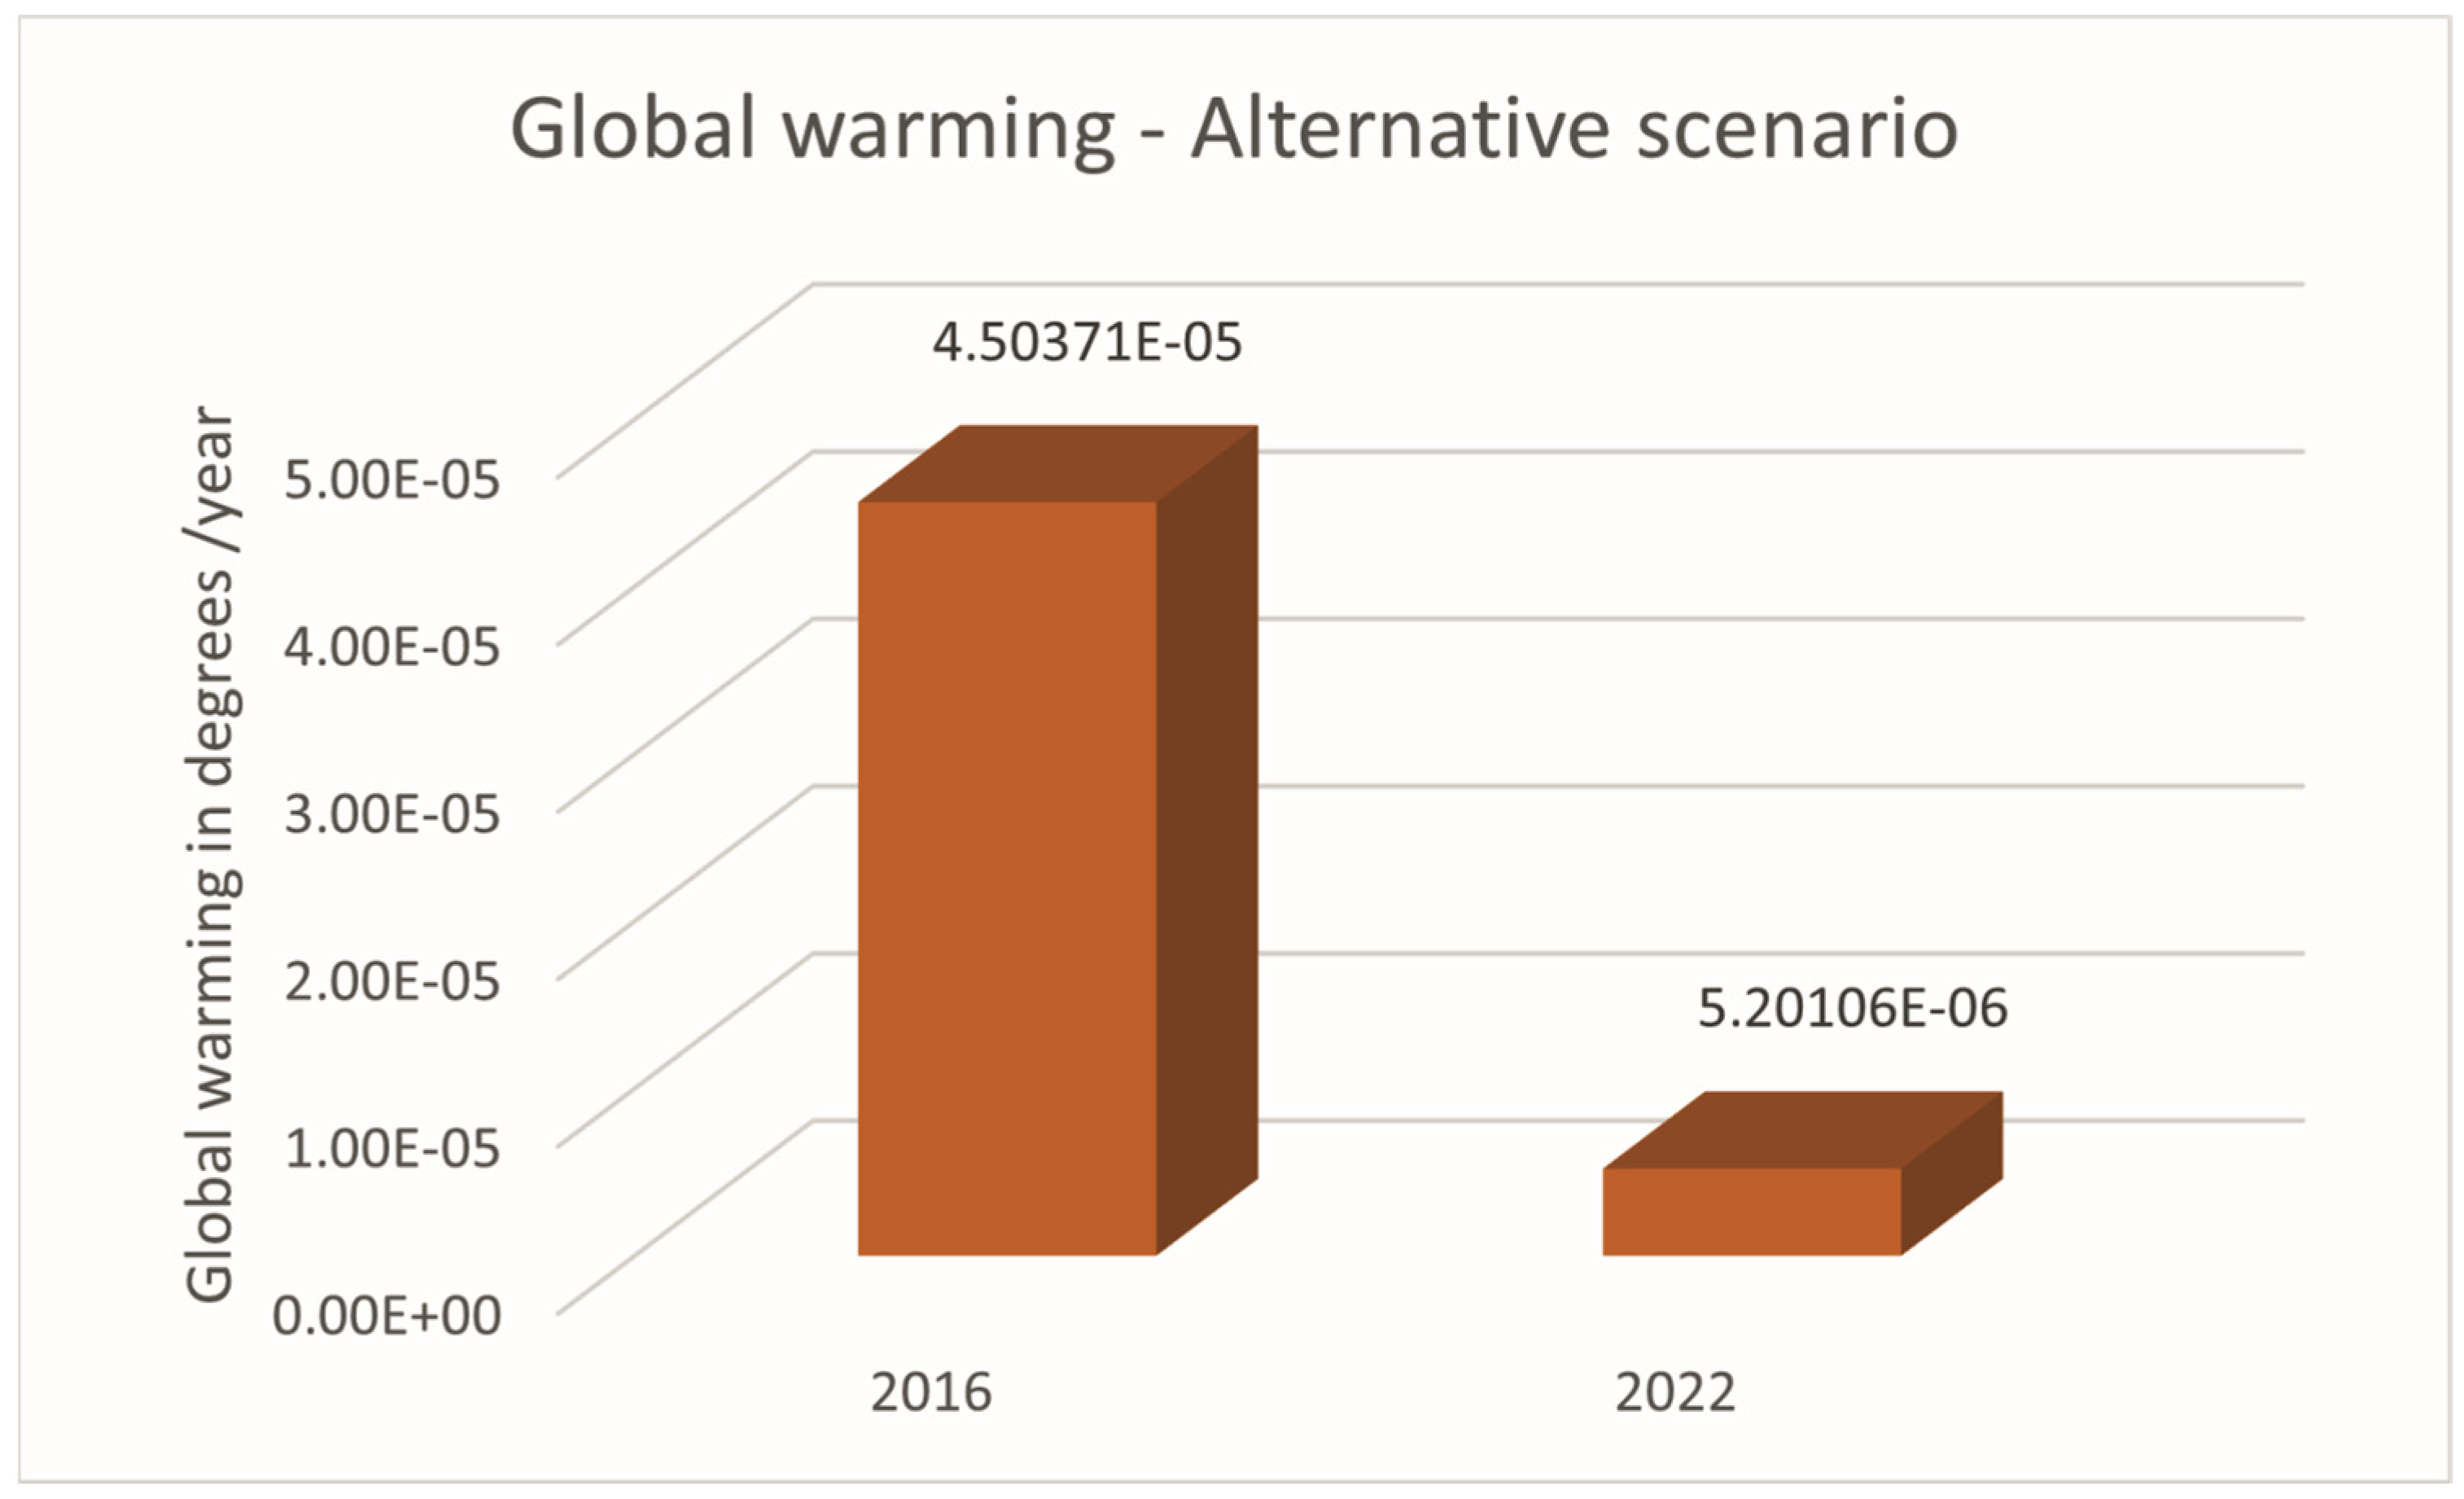
In analyzing and comparing other environmental indicators, the next one measures global warming. Figure 10 shows that through energy consumption and CO2 emissions sent into the atmosphere, it is possible to reach a value of 4.504 × 10⁻⁵ °C in 2016, and maintaining the strategy adopted in 2022, the value reduced favorably to 5.20106 × 10⁻⁶ °C, improving the contribution to the reduction in global warming.
The alignment of global warming values with Green IT can be seen in Figure 11, where the difference between 2016 and 2022 is not noticeable in the graph despite its improvement. The values of the different indicators presented so far allow us to assess an environmental improvement and reinforce the option taken with the exchange of equipment, where the options for virtualization and digital transformation are gaining more and more strength.
The last indicator that is presented considers the annual paper expenses within the organization., The values presented in Figure 12 allow us to verify that to meet the paper expenses calculated for 2016, with ream values per tree provided by [56], It would be necessary to cut down 255 trees per year. Given the strategy of dematerialization, digitization of processes, and use of document management, this value in 2022 was reduced to the annual felling of 101 trees.
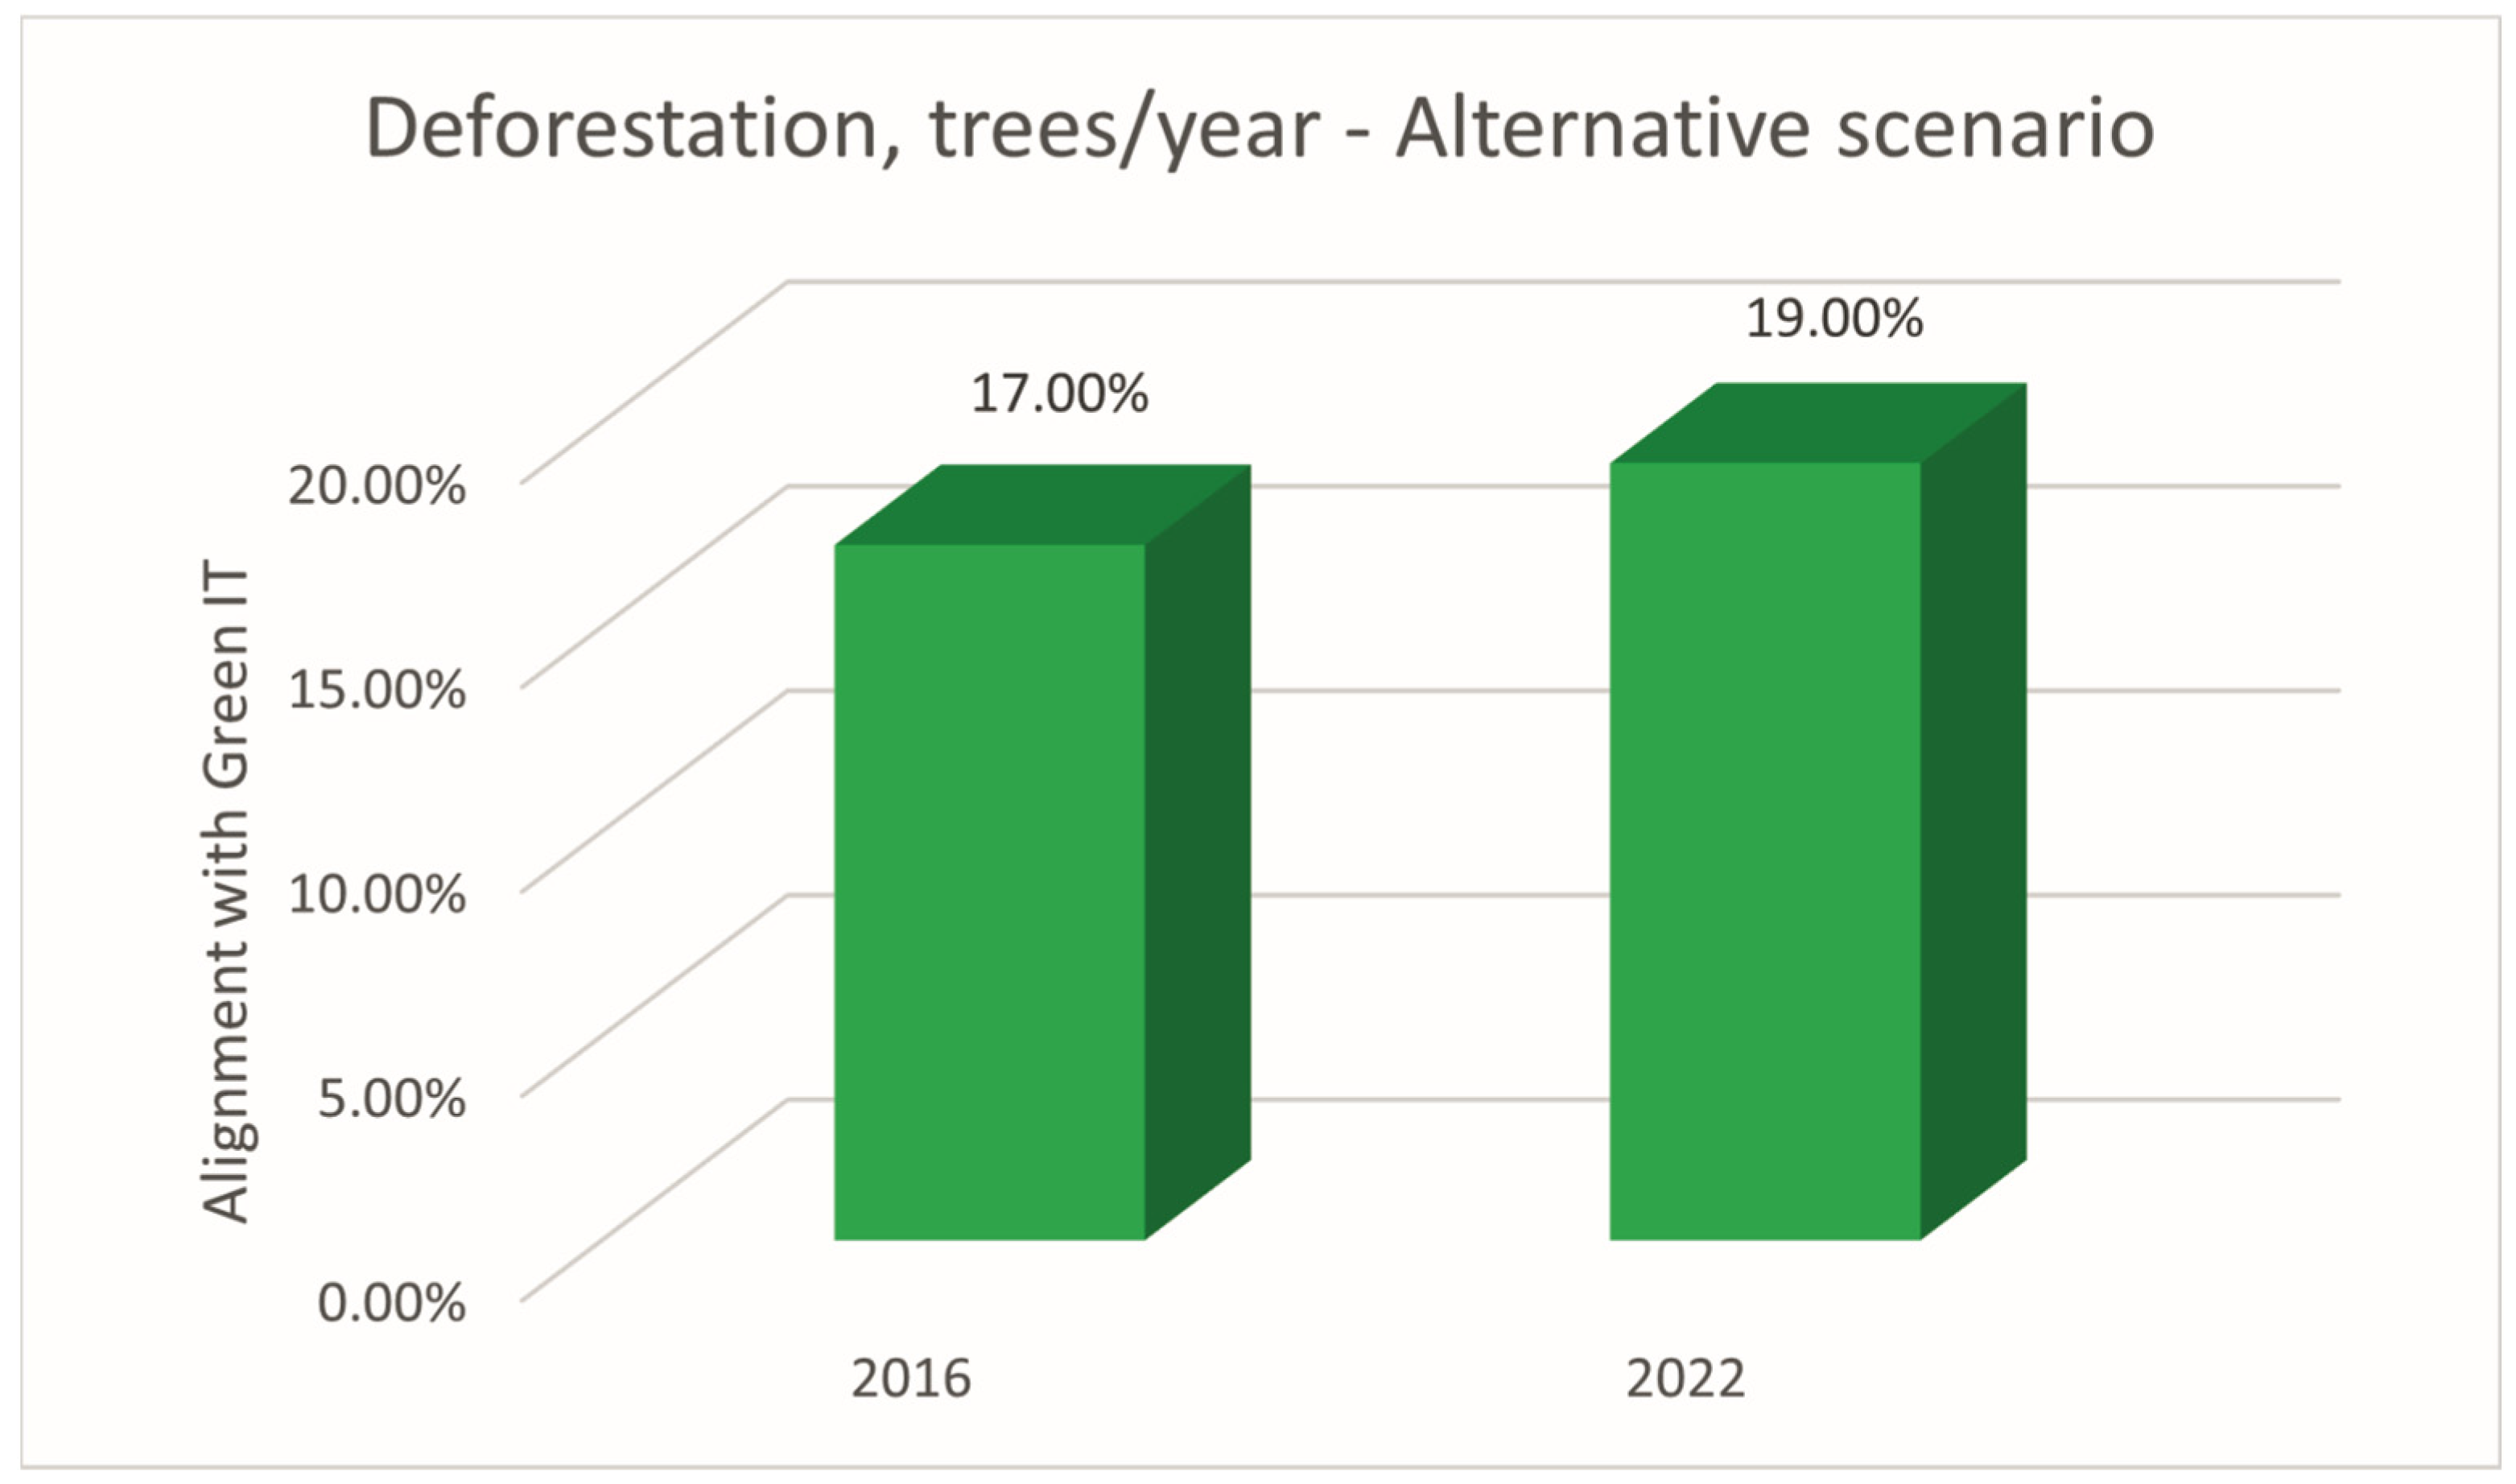
The reduction of 154 trees per year is also, in itself, a measure of environmental improvement, which contributes to a better alignment with Green IT, as can be seen in Figure 13, wherein in 2016 there was an alignment of 17%, and in 2022 it improved to 19%.
Summarizing the analysis presented above, there is an environmental improvement due to the reduction in energy consumption and CO2 emissions. This also contributes to the reduction in global warming, with a lower number of materials that need to be recycled, which, in turn, is more following the concept of Green IT.
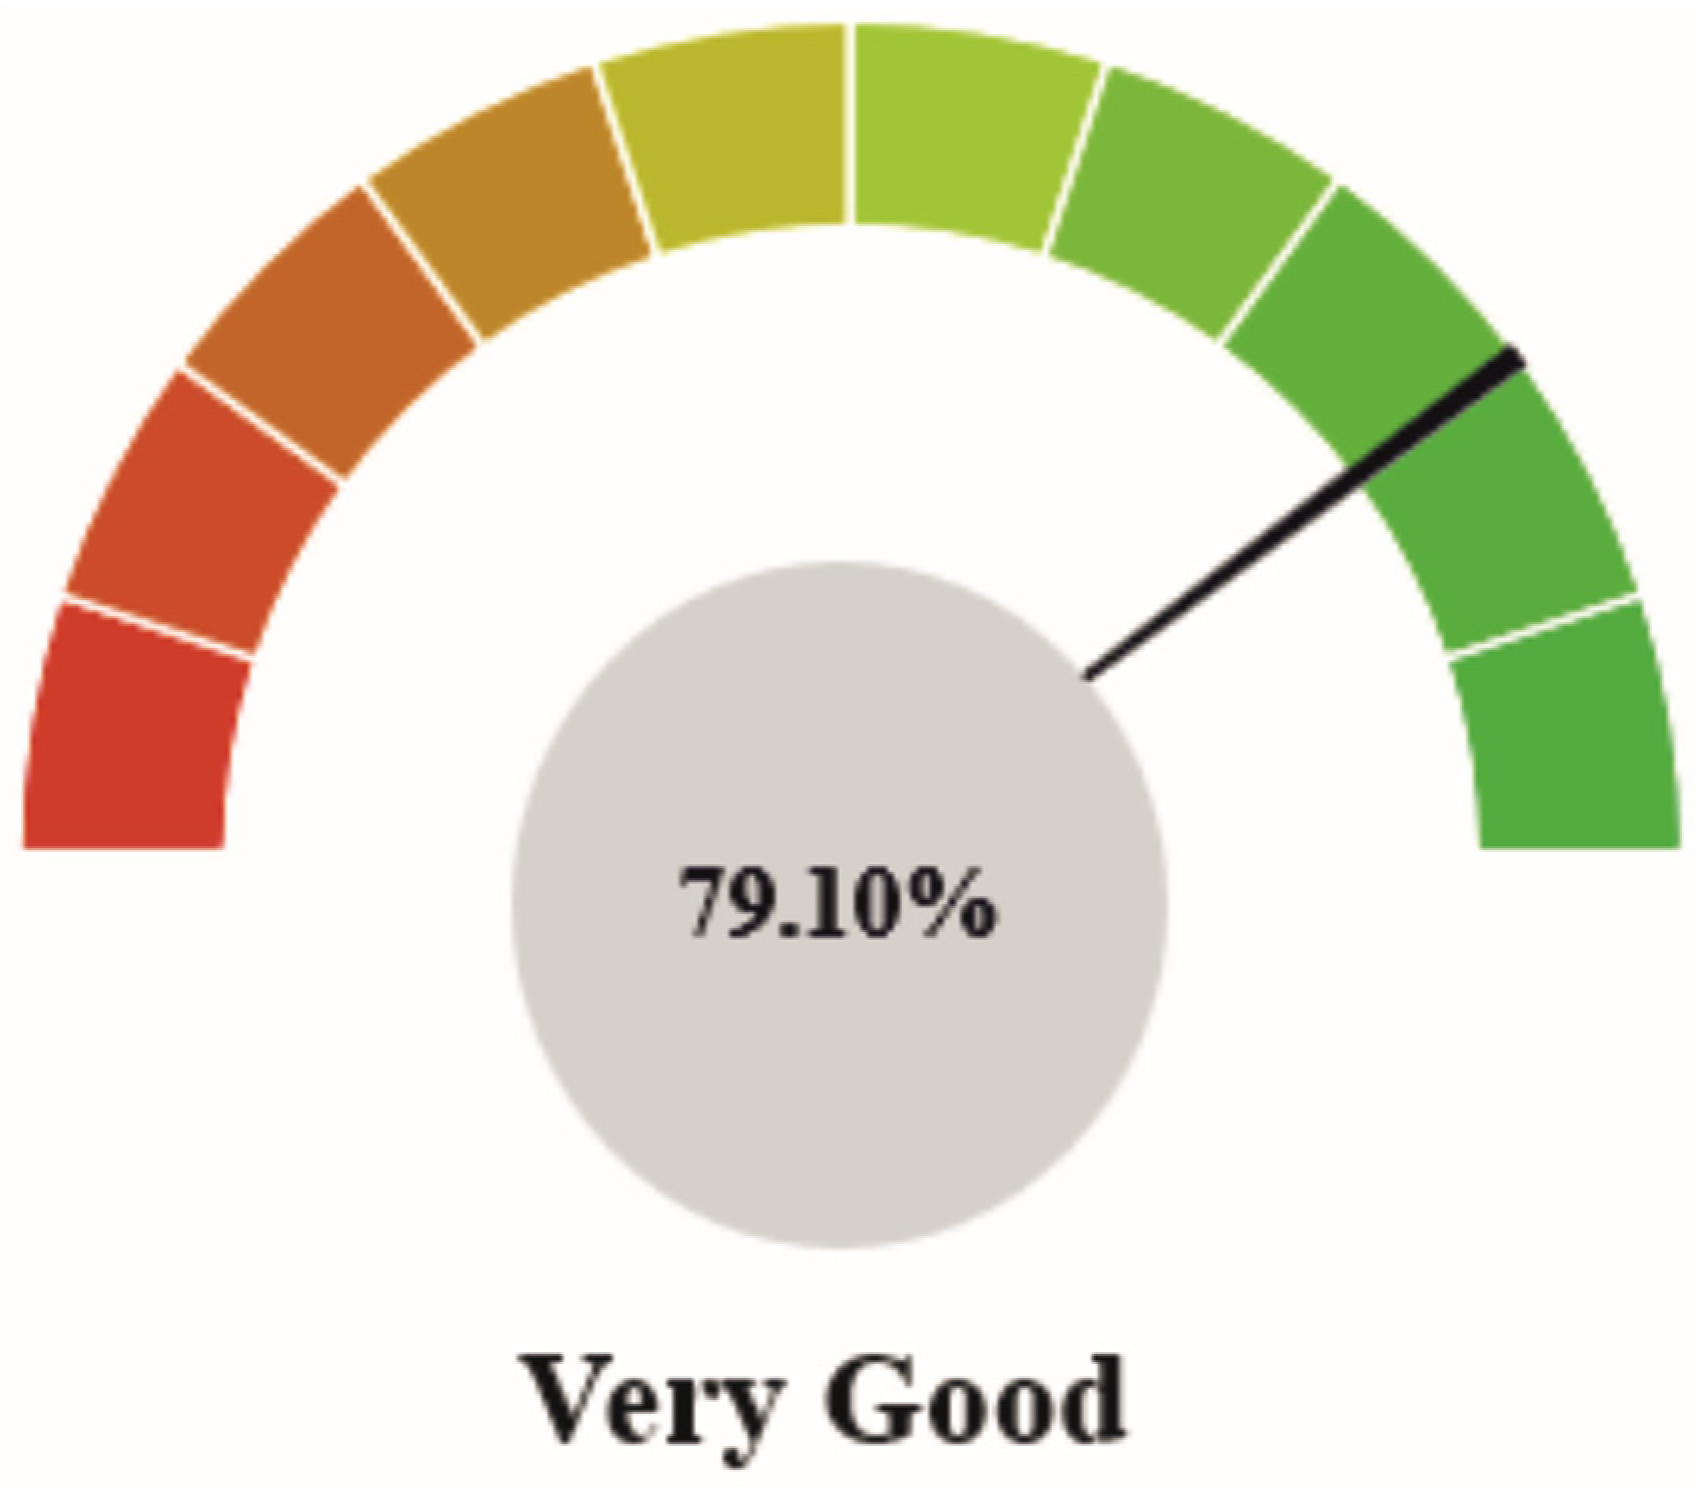
Figure 14 shows the overall result of the alignment of the Environmental vector with Green IT in 2016, where there was already a very good alignment of 79.10%.
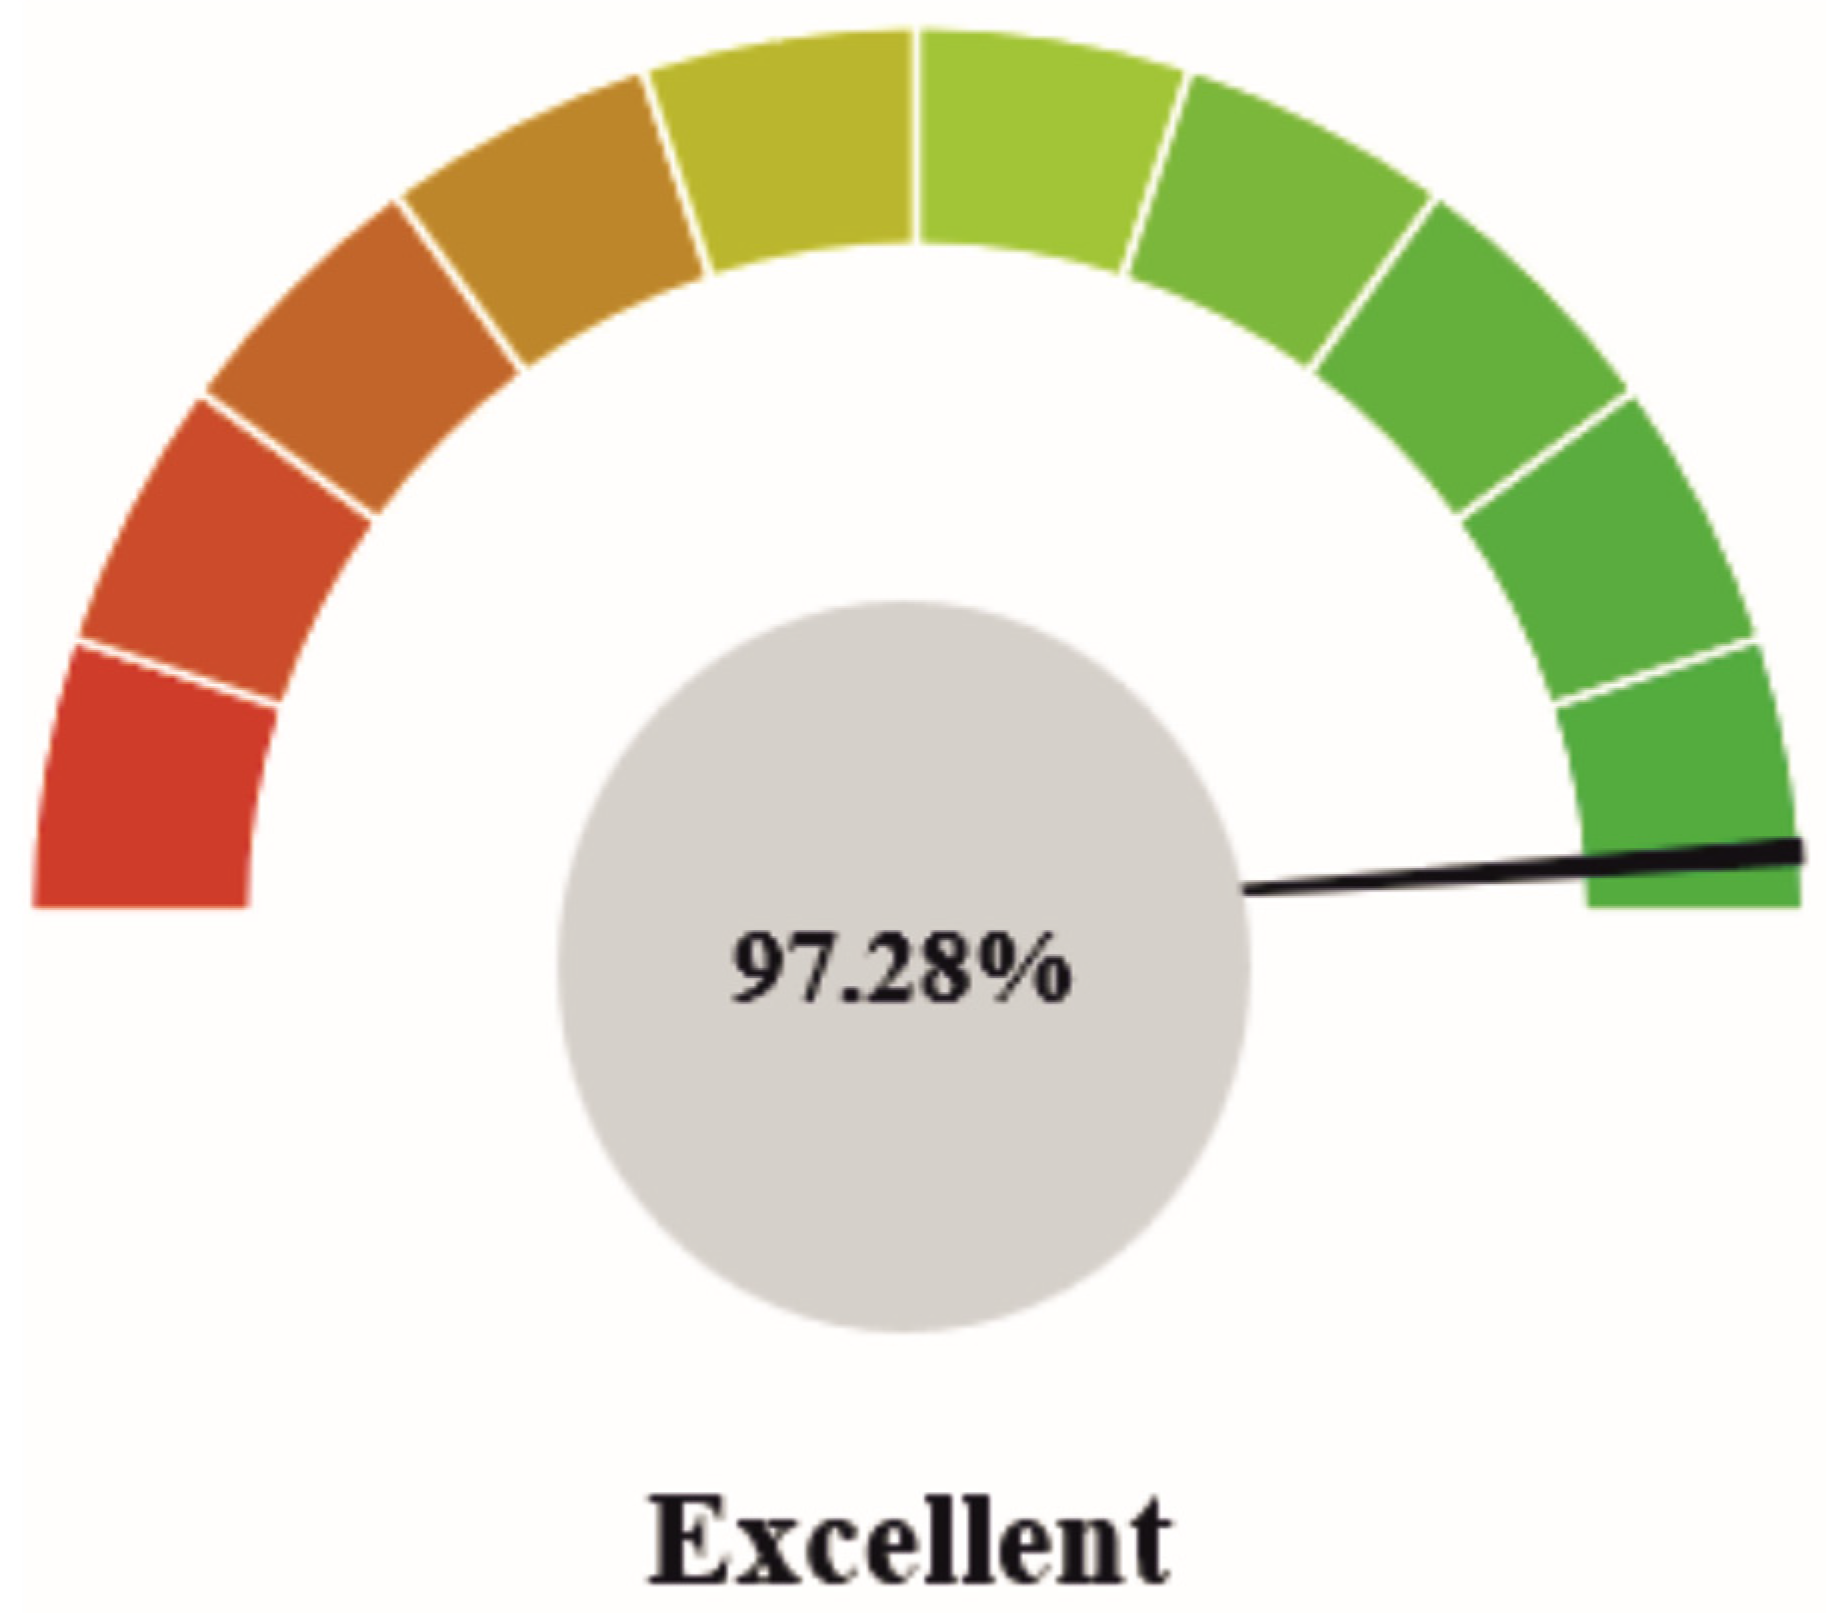
After the implementation of the framework and the alternative strategies tested. The results obtained are more satisfactory, as the contribution of the Environmental vector increased from 79.10%, considered Very Good, to 97.28% considered Excellent, as can be seen in Figure 15.
It should be noted that this was just one of many tests that can be carried out with the tool developed and supported by the FACIIL framework.
Figure 16 allows the observation of four environmental indicators related to the year of the project’s start, 2016, where you can see the values of energy consumption, CO2 emissions, suitability for recycling, and use of paper, values that are quite high compared to those of 2022.
Figure 17 shows the same four indicators, but with 2022 values, where lower values are found, more aligned with environmental quality and alignment with Green IT, a reflection of the test conducted.
An overview of the Environmental vector indicators was presented in an example case. After the analysis of the results obtained, through the alternative strategies tested, with the FACIIL calculation tool, it was found that the adoption of a virtualized infrastructure presents itself as a positive and viable solution for the municipality, ensuring greater efficiency and security in data management, and enabling users to carry out their activities in a ubiquitous way, more productive and efficient, promoting environmental improvement and improving its alignment with Green IT.

5. Discussion

The work presented is intended to be the first approach to these issues in the LA, where we intend to direct it so that soon it can contribute to and emphasize the reduction in the carbon footprint, environmental sustainability, and improvement and alignment with Green IT. To this end, we oriented the framework so that it could align with the three main drivers of Green IT initiatives, according to the authors [16]: cost reduction due to budget cuts, consumption reduction due to resource constraints, and compliance with current legislation. This is a reality on the national scene in the Portuguese LA, which we intend to help improve.
Based on the literature and the results achieved, we argue that virtualization allows for greater flexibility in implementing solutions, greater efficiency, and cost reduction and contributes to environmental sustainability. The success of these environmental sustainability initiatives and their alignment with Green IT in the LA will always depend on the decision-makers. Our contribution will be to encourage the use of this framework in the LA or other organizations.

5.1. Analysis of Results

The analysis carried out and the results presented in the previous chapter, referring to the Environmental vector, through the alternative strategies tested, are aligned with the literature presented in the theoretical framework of this article and prove that the alternatives experienced can be a solution for a better alignment with Green IT, as intended.
One of the alternatives pointed out by the literature, for an improvement in the alignment with Green IT, was the digital transformation based on the virtualization of servers and workstations, as well as the strategic alternative tested proved through the results obtained by this same theory.
The FACIIL framework resulted in good support in the resolution of some of the constraints identified in the municipality of Barreiro, and the calculation tool facilitated obtaining the quantification of the proposed and necessary indicators. It should be noted that this set of proposed indicators may be revised, and their weightings changed, according to the organization that uses them.
The results presented, because of the strategic alternatives tested, contribute to a better environmental quality through the reduction in energy consumption, which, in the case presented, directly and positively influences the indicators, energy consumption, carbon footprint (CO2 to the atmosphere), a smaller number of materials to be recycled, less global warming, and less deforestation.
In these results, it is also possible to identify the improvement of the alignment with Green IT in the Environmental vector, which emerges as an approach to promote sustainability in the IT sector, verifying that the role of the PA and LA is improved through their contribution to this improvement, by about 21%, as can be seen in the results. It should be noted that all Green IT indicators improved from 2016 to 2022.

5.2. Future Work

Based on the results presented and as perspectives for future work, the PA and LA should be encouraged to seek solutions that involve the implementation of the FACIIL framework, to promote a cultural change about sustainability in ICT management and continuous improvement of the framework.
The adoption of this framework may also contribute to the advancement of scientific knowledge around Green IT.
It is recognized that the FACIIL framework has limitations and some challenges, which can be overcome through the feedback of the municipalities or organizations that adopt it, to ensure a constant evolution. Several initiatives that help promote environmental sustainability may be considered in the future and take advantage of a new version of this framework, such as e-commerce, green buildings, or teleworking.

6. Conclusions

Taking advantage of the facilities of ICT, the PA operates in such a way that processes flow electronically between central, regional, and local administrations. In this way, it is intended to achieve greater speed in the relationship with citizens and citizens in general. This is achieved by improving the speed and streamlining of processes between the various stakeholders.
Based on these assumptions and to align with this reality, the main objective of this work was to develop an approach to optimize ICT management practices and alignment with Green IT. The study considered the challenges and opportunities identified in the municipality of Barreiro, seeking an approach that was easy to implement, fast, integrated, and progressive. To achieve these objectives, international standards and reference frameworks mentioned in the literature were analyzed. However, no appropriate approaches have been found for the Public Administration in this specific context.
Against this backdrop, the appropriate response involved the creation of the FACIIL framework, an innovative and comprehensive approach aimed at addressing the challenges of Green IT, considering sustainable information technologies, and boosting sustainability in the field of ICT. This framework was developed to be aligned with the needs and reality of the municipality of Barreiro, Portugal, placing special emphasis on promoting digital transformation, mobility, usability, and accessibility. In addition, the fundamental importance of aligning ICT with strategic alternative processes is recognized, to ensure that technologies play a strategic role in the overall improvement of organizational efficiency and effectiveness and environmental improvement.
FACIIL brings together a qualitative component, continuous improvement, and a quantitative component of decision support. The qualitative component includes the Know, Diagnose, Plan, Design, Communicate, Protect, Innovate, and Optimize phases. The quantitative component considers the four vectors Information Technologies, Financial, Environmental, and Social, and, for each vector, a set of dimensions that gather, in turn, the relevant indicators [7]. In this article, only the results of the Environmental vector were demonstrated.
The scenario provided by the municipality of Barreiro, representative of the local public administration, played a crucial role in the practical demonstration and subsequent validation of the framework. During the audit, opportunities for improvement and areas of risk were identified, which allowed for a deeper understanding of the context and its specific needs. By testing, the proposed ideas and concepts were demonstrated, and it was possible to translate them into concrete and advantageous results for the municipality. This further strengthened the usefulness and relevance of the FACIIL framework in the context of the local public administration.
The results obtained through the application of FACIIL showed the potential to achieve positive results, and it is possible to evaluate them by comparing the results of 2016, the initial state, and the results obtained in 2022, with the implementation of the project. There is a significant reduction in the energy consumption of IT systems, as well as a decrease in associated carbon emissions and even a smaller number of products for recycling. In addition, the collaboration has made it possible to identify new research challenges and opportunities, contributing to continuous improvements and future work. It also sought to provide the LA’s internal and external customers (employees and citizens, respectively) with efficient technologies that optimize the different aspects of the municipality, such as performance, sustainability, productivity, safety, and innovation, aligning with Green IT [7].
In conclusion, the FACIIL framework, developed in this work, represents an important step for the municipality and the entire LA, allowing the evolution of its practices and processes, consistently aligned with the best market practices and relevant international standards. It is expected that the FACIIL framework can be applied in other municipalities and organizations, providing tangible benefits and driving the digital transformation and optimization of ICT in the public or private sector, quantifying its alignment with Green IT.

Author Contributions

Conceptualization, M.L.; Methodology, M.L.; Software, M.L.; Writing—original draft, M.L.; Writing—review & editing, M.M.M.M. and L.R.; Supervision, M.M.M.M. and L.R. All authors have read and agreed to the published version of the manuscript.

Funding

This research received no external funding.

Data Availability Statement

Data are contained within the article.

Conflicts of Interest

The authors declare no conflict of interest.

References

  1. European Commission. Reducing CO2 Footprint of Information and Communication Technologies. 2021. Available online: https://webgate.ec.europa.eu/life/publicWebsite/project/details/3818 (accessed on 5 September 2023).
  2. Batista, M. Aliar a Tecnologia à Gestão do Negócio Para uma Estratégia de Crescimento; InovaPrime: Lisboa, Portugal, 2020; Available online: https://governance.business/2020/10/01/how-to-improve-internal-collaboration-and-performance-through-the-digitalization-of-processes-2/ (accessed on 6 September 2023).
  3. Estima, A.C. O Impacto das Tecnologias de Informação e Comunicação nas Organizações Públicas–O Caso da Universidade de Aveiro. 2004. Available online: https://ria.ua.pt/bitstream/10773/3325/1/2009000504.pdf (accessed on 18 October 2023).
  4. Duarte, J.; Gonçalves, R.R.; Medina, R. IT Governance, Alinhar as Tecnologias de Informação (TI’s) com o Negócio. 2013. Available online: https://silo.tips/download/it-governance-alinhar-as-tecnologias-de-informaao-ti-s-academia-da-pwc (accessed on 18 October 2023).
  5. Harguem, S. A Conceptual Framework on IT Governance Impact on Organizational Performance: A Dynamic Capability Perspective. Acad. J. Interdiscip. Stud. 2021, 10, 136. [Google Scholar] [CrossRef]
  6. Cidades, J. Os Pilares de IT Governance. 2021. Available online: https://olisipo.pt/blog/os-pilares-de-it-governance/ (accessed on 18 October 2023).
  7. Landum, M. Conceção de Abordagem Para Otimização das Práticas de Gestão das TIC. Ph.D. Thesis, University of the Algarve, Faro, Portugal, 2024. [Google Scholar]
  8. APA. Plano Nacional Energia e Clima (PNEC); APA, 2021. Available online: https://apambiente.pt/clima/plano-nacional-de-energia-e-clima-pnec (accessed on 26 August 2023).
  9. Landum, M.; Moura, M.; Reis, L. A framework for the alignment of ICT with Green IT. Adv. Sci. Technol. Eng. Syst. J. 2021, 6, 593–601. [Google Scholar] [CrossRef]
  10. ITIL. ITIL Foundation ITIL 4 Edition; AXELOS: London, UK, 2019. [Google Scholar]
  11. COBIT. COBIT 2019 Framework-Governance and Management Objectives; ISACA: Schaumburg, IL, USA, 2019. [Google Scholar]
  12. Bianchi, I.S.; Sousa, R.D. IT Governance Mechanisms in Higher Education. Procedia Comput. Sci. 2016, 100, 941–946. [Google Scholar] [CrossRef]
  13. Landum, M.; Reis, L.; Moura, M. Concept of Approach to Optimize ICT Management Practices: State of the Art. In Handbook of Research on Multidisciplinary Approaches to Entrepreneurship, Innovation, and ICTs, USA; IGI Global: Hershey, PA, USA, 2021; pp. 174–199. [Google Scholar]
  14. Project Management Institute. The Standard for Project Management and a Guide to the Project Management Body of Knowledge, 7th ed.; Project Management Institute, Inc.: Newtown Square, PA, USA, 2021. [Google Scholar]
  15. Institute CMMI. Build Capability, Drive Performance. 2023. Available online: https://cmmiinstitute.com/ (accessed on 20 October 2023).
  16. Landum, M.; Moura, M.; Reis, L. Evaluating Green IT in Local Administration. In Proceedings of the Fourth International Scientific Conference on Recent Advances in Information Technology, Tourism, Economics, Management and Agriculture, Belgrade, Serbia, 8 October 2020; p. 1. [Google Scholar]
  17. Landum, M.; Moura, M.; Reis, L. ICT Good Practices in alignment with Green IT. In Proceedings of the 2020 15th Iberian Conference on Information Systems and Technologies (CISTI), Seville, Spain, 24–27 June 2020; pp. 1–6. [Google Scholar]
  18. Bose, R.; Luo, X. Integrative framework for assessing firms’ potential to undertake Green IT initiatives via virtualization—A theoretical perspective. J. Strateg. Inf. Syst. 2011, 20, 38–54. [Google Scholar] [CrossRef]
  19. Velte, T.; Velte, A.; Elsenpeter, R. Green IT: Reduce Your Information System’s Environmental Impact While Adding to the Bottom Line McGraw-Hill Companies; McGraw-Hill: New York, NY, USA, 2008. [Google Scholar]
  20. Chugh, R.; Wibowo, S.; Grandhi, S. Environmentally sustainable Information and Communication Technology usage: Awareness and practices of Indian Information and Communication Technology professionals. J. Clean. Prod. 2016, 131, 435–446. [Google Scholar] [CrossRef]
  21. Zhu, Q.; Ma, D.; He, X. Digital transformation and firms’ pollution emissions. Technol. Forecast. Soc. Change 2023, 197, 122910. [Google Scholar] [CrossRef]
  22. Péréa, C.; Gérard, J.; Benedittis, J.D. Digital sobriety: From awareness of the negative impacts of IT usages to degrowth technology at work. Technol. Forecast. Soc. Change 2023, 194, 122670. [Google Scholar] [CrossRef]
  23. Johnson, P.C.; Laurell, C.; Ots, M.; Sandström, C. Digital innovation and the effects of artificial intelligence on firms’ research and development–Automation or augmentation, exploration or exploitation? Technol. Forecast. Soc. Change 2022, 179, 121636. [Google Scholar] [CrossRef]
  24. Moreira, L. A Quarta Revolução Industrial no Setor Metalomecânico Português. 2019. Available online: https://repositorio.ucp.pt/bitstream/10400.14/28532/1/TFM_LuísLimaMoreira_351313040.pdf (accessed on 2 August 2023).
  25. Borges, D. O Novo Papel do CIO na era da Transformação Digital. 2022. Available online: https://repositorium.sdum.uminho.pt/bitstream/1822/81414/1/Denisa%20Correia%20Borges.pdf (accessed on 12 October 2023).
  26. Caraffini, J.P.; Souza, R.B.; Behr, A. Transformação Digital e Desempenho no Setor Bancário; em Congresso Transformação Digital: São Paulo, Brazil, 2018; Available online: https://www.researchgate.net/publication/336550199_TRANSFORMACAO_DIGITAL_E_DESEMPENHO_NO_SETOR_BANCARIO (accessed on 17 September 2023).
  27. Alvarenga, A. Transformação Digital na Administração Pública: Estudo de Caso. 2019. Available online: http://hdl.handle.net/10071/20205 (accessed on 14 October 2023).
  28. IT Governance Institute. IT Governance: Definition & Explanation. 2023. Available online: https://www.itgovernance.co.uk/it_governance (accessed on 18 October 2023).
  29. Wu, S.P.-J.; Straub, D.W.; Liang, T.-P. How Information Technology Governance Mechanisms and Strategic Alignment Influence Organizational Performance: Insights from a Matched Survey of Business and IT Managers. MIS Q. 2015, 39, 497–518. [Google Scholar] [CrossRef]
  30. Campbell, J.; McDonald, C.; Sethibe, T. Public and Private Sector IT Governance: Identifying Contextual Differences. Australas. J. Inf. Syst. 2010, 16, 2. [Google Scholar] [CrossRef]
  31. Rodrigues, B. A Importância da Capacitação do Capital Humano Para as Autarquias Locais. 2021. Available online: https://comum.rcaap.pt/bitstream/10400.26/39329/1/Bernadette%20Rodrigues.pdf (accessed on 20 October 2023).
  32. Kohler, A.R.; Erdmann, L. Expected Environmental Impacts of Pervasive Computing. Hum. Ecol. Risk Assess. Int. J. 2004, 10, 831–852. [Google Scholar] [CrossRef]
  33. Hilty, L.M.; Arnfalk, P.; Erdmann, L.; Goodman, J.; Lehmann, M.; Wäger, P.A. The relevance of information and communication technologies for environmental sustainability–A prospective simulation study. Environ. Model. Softw. 2006, 21, 1618–1629. [Google Scholar] [CrossRef]
  34. Charfeddine, L.; Umlai, M. ICT sector, digitization and environmental sustainability: A systematic review of the literature from 2000 to 2022. Renew. Sustain. Energy Rev. 2023, 184, 113482. [Google Scholar] [CrossRef]
  35. Qing Gu e Patricia Lago. Estimating the Economic Value of Reusable Green ICT Practices. In Safe and Secure Software Reuse; Favaro, J., Morisio, M., Eds.; Springer: Berlin/Heidelberg, Germany, 2013; pp. 315–325. [Google Scholar]
  36. Watson, R.T.; Boudreau, M.-C.; Chen, A.J. Information Systems and Environmentally Sustainable Development: Energy Informatics and New Directions for the IS Community. MIS Q. 2010, 34, 23–38. [Google Scholar] [CrossRef]
  37. Schmidt, N.-H.; Erek, K.; Kolbe, L.; Zarnekow, R. Towards a Procedural Model for Sustainable Information Systems Management. In Proceedings of the 2009 42nd Hawaii International Conference on System Sciences, Waikoloa, HI, USA, 5–8 January 2009; pp. 1–10. [Google Scholar]
  38. Kuo, B.; Dick, G. The greening of organisational IT: What makes a difference? Australas. J. Inf. Syst. 2010, 16, 3. [Google Scholar] [CrossRef]
  39. Al-Rejal, H.M.E.A.; Udin, Z.M.; Hassan, M.G.; Sharif, K.I.M.; Al-Rahmi, W.M.; Al-kumaim, N.H. Green information technology adoption antecedence: A conceptual framework. In Emerging Trends in Intelligent Computing and Informatics: Data Science, Intelligent Information Systems and Smart Computing 4; Springer International Publishing: New York, NY, USA, 2020; pp. 1098–1108. [Google Scholar]
  40. Landum, M. Cloud na Administração Local, Estudo de Caso. 2012. Available online: https://comum.rcaap.pt/handle/10400.26/3999 (accessed on 9 August 2023).
  41. ISO/IEC 20000-1:2018; Onformation Technology-Service Management-Part 1: Service Management System Requirements. ISO: Geneva, Switzerland, 2018.
  42. ISO/IEC 27000:2018; Information Technology—Security Techniques—Information Security Management Systems—Overview and Vocabulary. ISO: Geneva, Switzerland, 2018.
  43. ISO/IEC 27001:2022; Information Security Management Systems. ISO: Geneva, Switzerland, 2022.
  44. ISO/IEC 27002:2022; Information Security, Cybersecurity and Privacy Protection—Information Security Controls. ISO: Geneva, Switzerland, 2022.
  45. ISO/IEC 27005:2022; Information Security, Cybersecurity and Privacy Protection—Guidance on Managing Information Security Risks. ISO: Geneva, Switzerland, 2022.
  46. ISO/IEC 27013:2021; Information Security, Cybersecurity and Privacy Protection—Guidance on the Integrated Implementation of ISO/IEC 27001 and ISO/IEC 20000-1. ISO: Geneva, Switzerland, 2021.
  47. ISO 31000:2018; Risk Management—Guidelines. ISO: Geneva, Switzerland, 2018.
  48. ISO/IEC 38500:2015; Information Technology—Governance of IT for the Organization. ISO: Geneva, Switzerland, 2015.
  49. ISO/IEC TS 38501:2015; Information Technology—Governance of IT—Implementation Guide. ISO: Geneva, Switzerland, 2015.
  50. ISO/IEC TR 38502:2017; Information Technology—Governance of IT—Framework and Model. ISO: Geneva, Switzerland, 2017.
  51. ISO/IEC 55000:2014; Asset Management—Overview, Principles and Terminology. ISO: Geneva, Switzerland, 2014.
  52. ISO/IEC 55001:2014; Asset Management—Management Systems—Requirements. ISO: Geneva, Switzerland, 2014.
  53. ISO/IEC 55002:2018; Asset Management—Management Systems—Guidelines for the Application of ISO 55001. ISO: Geneva, Switzerland, 2018.
  54. EDP. Conheça a Origem da Energia; EDP: Lisbon, Portugal, 2021; Available online: https://www.edp.pt/origem-energia/ (accessed on 30 June 2023).
  55. Reis, C. Emissões de CO2 e Aquecimento Global, Desenvolvimento de Tecnologias de Captura e Armazenamento de CO2. Ph.D. Thesis, Faculdade de Ciências e Tecnologia, Caparica, Portugal, 2013. [Google Scholar]
  56. Verde, P. Afinal, Quantas Árvores são Necessárias para Produzir uma Folha de Papel? Pensamento Verde. 2018. Available online: https://www.pensamentoverde.com.br/meio-ambiente/afinal-quantas-arvores-sao-necessarias-para-produzir-uma-folha-de-papel/ (accessed on 14 August 2023).
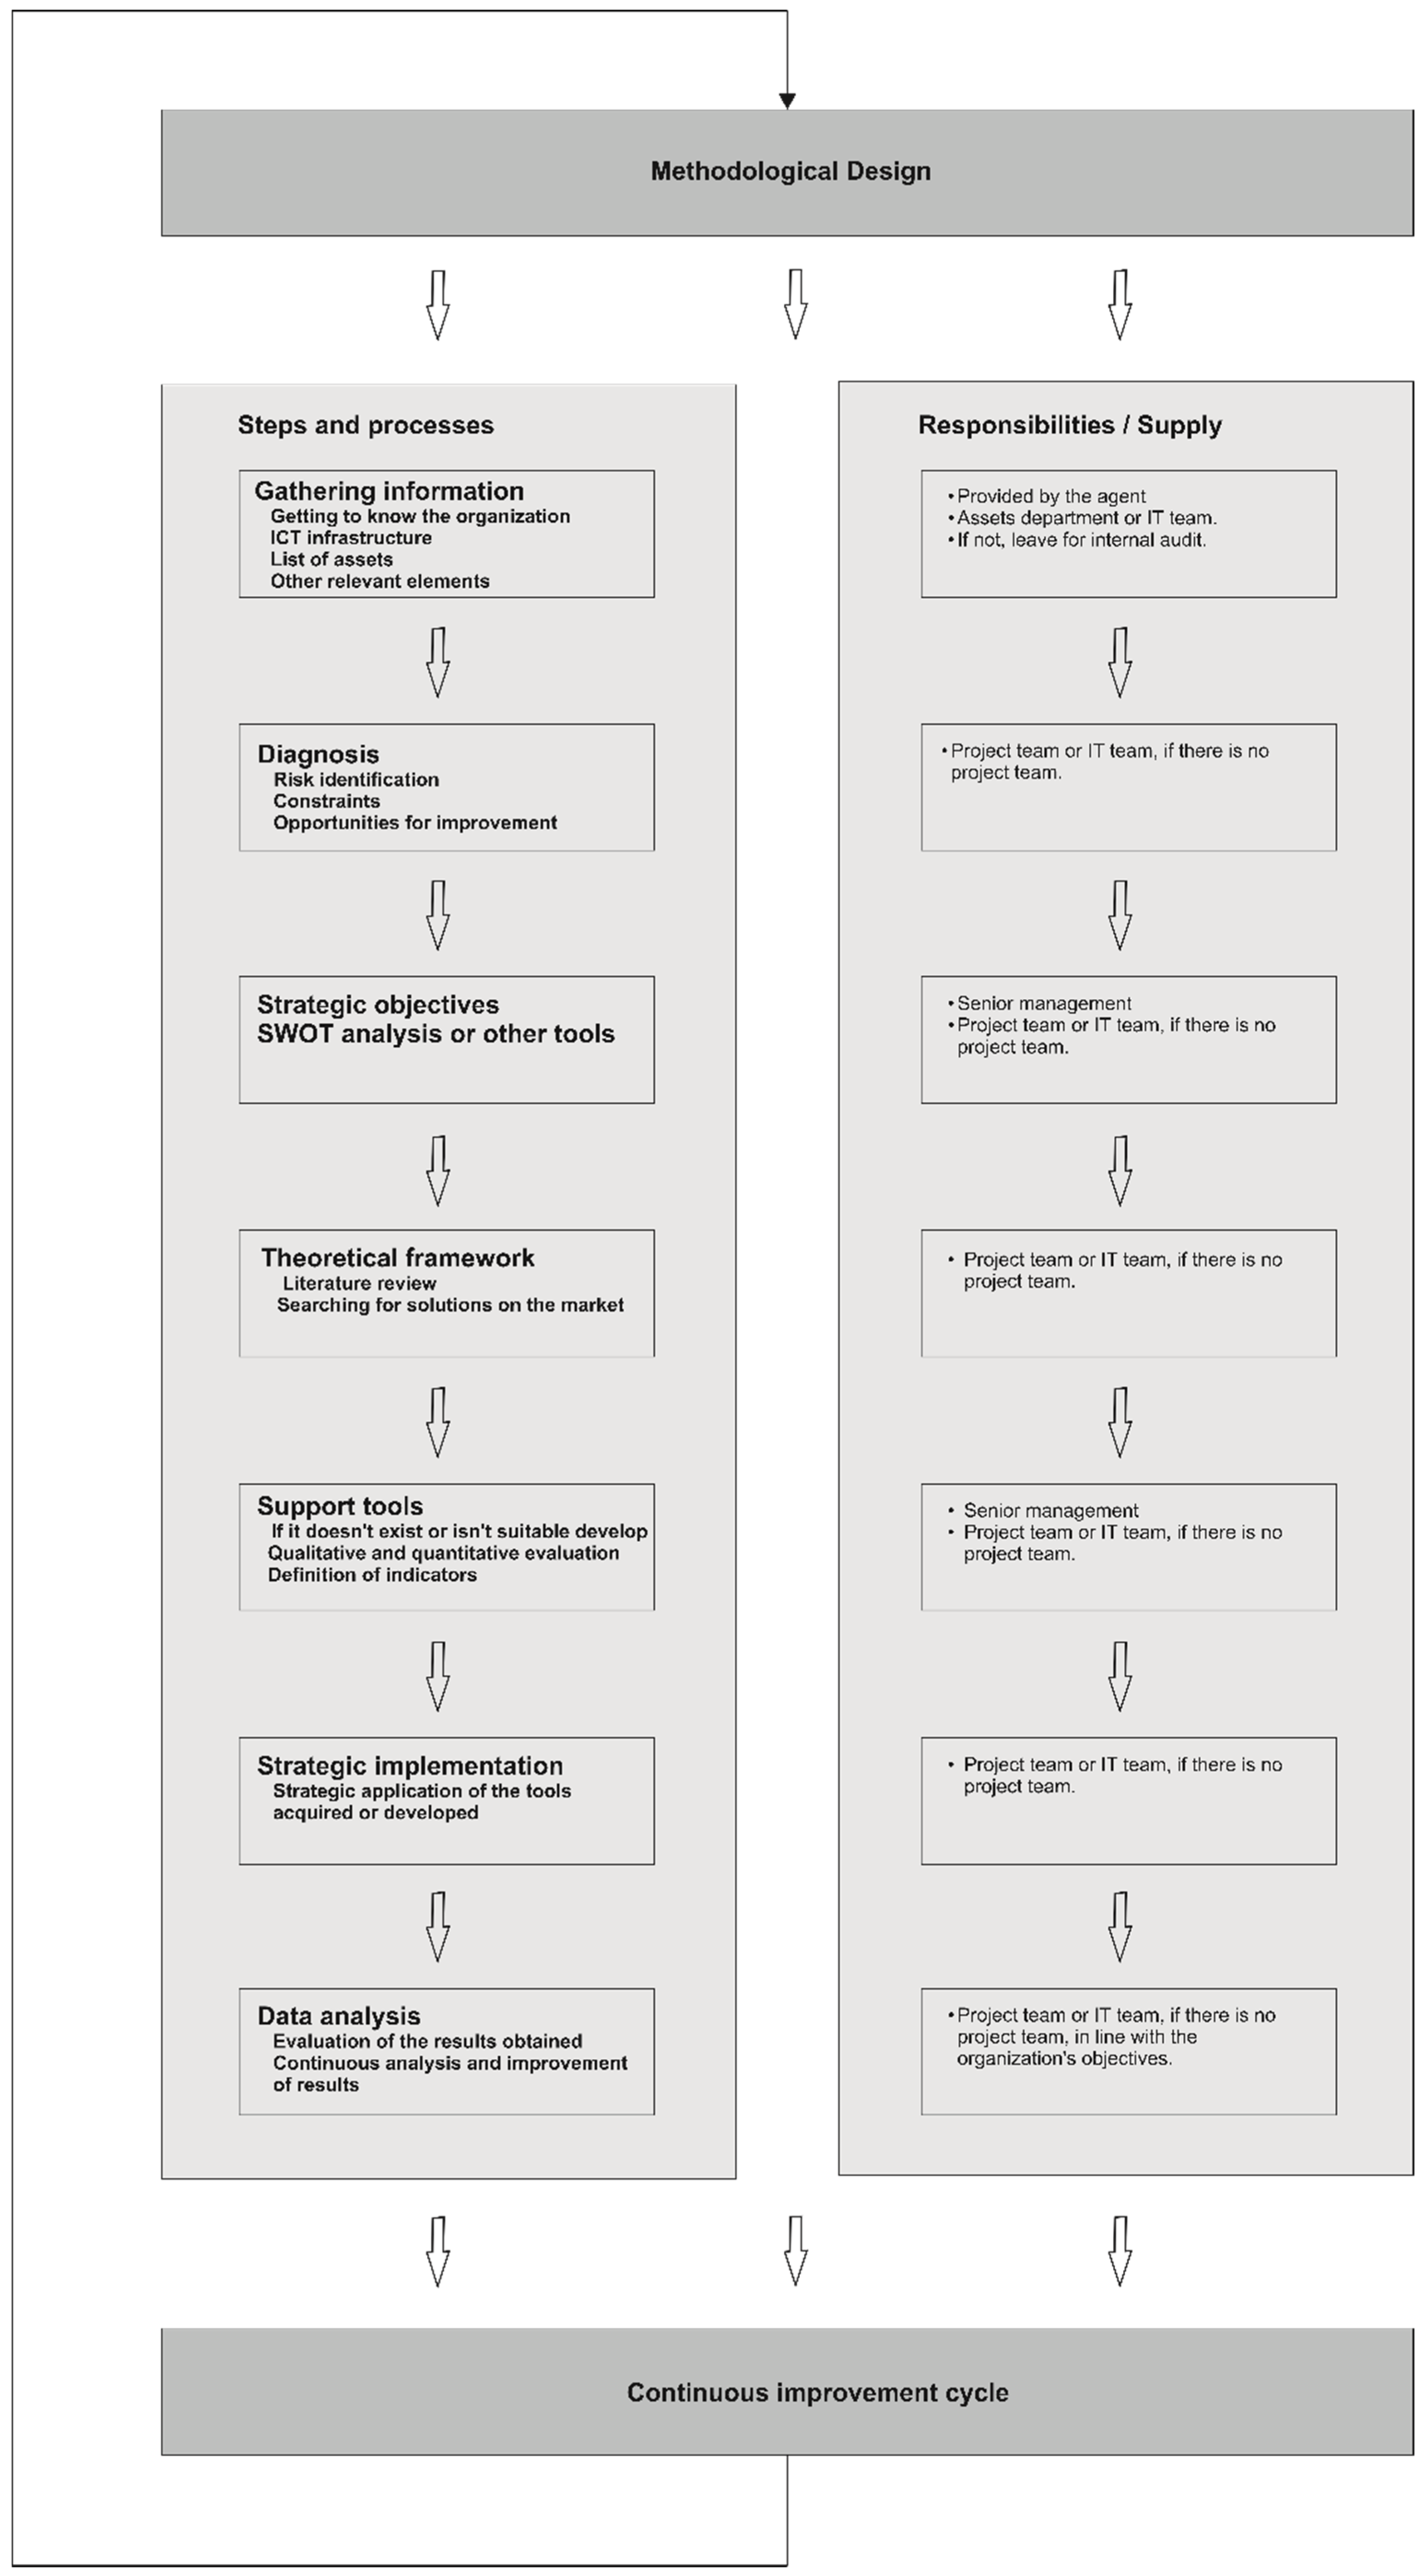
Figure 1. Methodological design.
Energies 17 00057 g001
Figure 2. Framework for Support and Control of Local IT Infrastructures (FACIIL).
Energies 17 00057 g002
Figure 3. FACIIL Framework, energy consumption per hour.
Energies 17 00057 g003
Figure 4. FACIIL Framework, annual energy consumption.
Energies 17 00057 g004
Figure 5. FACIIL Framework, energy consumption, alignment with Green IT.
Energies 17 00057 g005
Figure 6. FACIIL Framework, annual CO2 emissions.
Energies 17 00057 g006
Figure 7. FACIIL Framework, CO2 emissions, alignment with Green IT.
Energies 17 00057 g007
Figure 8. FACIIL Framework, material for recycling.
Energies 17 00057 g008
Figure 9. FACIIL Framework, material for recycling, alignment with Green IT.
Energies 17 00057 g009
Figure 10. FACIIL Framework, global warming.
Energies 17 00057 g010
Figure 11. FACIIL Framework, global warming, alignment with Green IT.
Energies 17 00057 g011
Figure 12. FACIIL Framework, annual deforestation.
Energies 17 00057 g012
Figure 13. FACIIL Framework, annual deforestation, alignment with Green IT.
Energies 17 00057 g013
Figure 14. Environmental alignment with Green IT in 2016.
Energies 17 00057 g014
Figure 15. Environmental alignment with Green IT in 2022.
Energies 17 00057 g015
Figure 16. Annual environmental indicators, 2016.
Energies 17 00057 g016
Figure 17. Annual environmental indicators 2022.
Energies 17 00057 g017
Disclaimer/Publisher’s Note: The statements, opinions and data contained in all publications are solely those of the individual author(s) and contributor(s) and not of MDPI and/or the editor(s). MDPI and/or the editor(s) disclaim responsibility for any injury to people or property resulting from any ideas, methods, instructions or products referred to in the content.