Article

A Cost–Benefit Analysis for Utility-Scale Agrivoltaic Implementation in Italy

1
ENEA—Italian National Agency for New Technologies, Energy and Sustainable Economic Development, P.le E. Fermi, 1, Portici, 80055 Napoli, Italy
2
Division of Agricultural Economics and Policy, Department of Agricultural Sciences, University of Naples Federico II, Via Università 100, Portici, 80055 Napoli, Italy
*
Author to whom correspondence should be addressed.
Energies 2023, 16(7), 2991; https://doi.org/10.3390/en16072991
Submission received: 1 February 2023 / Revised: 15 March 2023 / Accepted: 16 March 2023 / Published: 24 March 2023
(This article belongs to the Section C: Energy Economics and Policy)

Abstract

:
Utility-scale photovoltaic plants can take up areas as wide as several tens of hectares, often occupying spaces normally used for other purposes. This “land competition” issue might become particularly relevant for agriculture since, similarly to the production of photovoltaic electricity, farming uses the sun as a primary energy source. Thus, there is increasing interest in investigating agrivoltaic plants that allow the coexistence of agricultural activity and the production of electricity from photovoltaics. Such solutions are more complex and expensive than standard ground-mounted photovoltaic plants, so it is questionable whether the economic revenues produced by the agrivoltaic choice and resulting from both the cropland activity and electricity production can compensate for the high costs involved. The problem is further complicated by the fact that both crop revenues and photoelectricity costs depend, in general, on the geographical location. In this study, a cost/benefit methodology was developed to investigate the conditions under which the installation of an agrivoltaic utility plant can be economically advantageous compared with a standard ground-mounted photovoltaic plant. The analysis relies on the evaluation of both the extra cost related to the agrivoltaic choice and the performance benefit related to the crop revenues. By fixing the capacity of PV utility plants to be installed in all Italian regions, results were validated, considering crops such as wheat, corn, soybean, potato, and sunflower that make use of wide areas. It was determined that the higher infrastructural costs of agrivoltaic plants seriously hamper their installation, even for high-revenue croplands, unless suitable supporting policies in the form of public subsidies are conceived. In this context, it would be useful to evaluate whether such financial aids conceived to support agrivoltaic implementation in productive agricultural areas could be better used to support agrivoltaic installations in croplands at risk of abandonment or even already abandoned croplands, recovering otherwise unproductive agricultural lands.

1. Introduction

Due to the demand for a transition towards a low-carbon society, solar photovoltaic and wind electricity production is growing exponentially worldwide. The reasons for this increase are the ubiquity of these sources, which are available in abundance everywhere; their cost per kWh produced, which is now comparable, if not even lower than that of energy from fossil and nuclear sources, their high environmental compatibility, and the practical impossibility that these sources can be used as an instrument of pressure in the geopolitical field.
One of the main drawbacks still hampering the widespread diffusion of photovoltaic energy is the fact that it is a low power-density energy source. As recently reported by Bolinger and Bolinger [1] in a study that considered most of the utility-scale PV plants built in the United States up until 2019, at present, the average photovoltaic power density that can be installed for a ground-mounted PV (GMPV) utility plant (dependent on the latitude of the installation site) is roughly 70 W/m2–90 W/m2 for a fixed-tilt system and around 49 W/m2–74 W/m2 for a tracking solution. An example of a GMPV utility plant is the largest fixed-tilt PV system realized in Italy in Troia (Apulia) between 2019 and 2021, which is characterized by a power density of about 70 W/m2 (Figure 1) [2].
Although they increased from 2011 to 2019 by more than 50% and 40% for fixed-tilt and tracking plants, respectively, the numbers imply that large PV systems are strongly land intensive [1]. Therefore, the increasing demand for photovoltaic energy will require either considerable land area to be dedicated to the installation of large PV plants and/or the realization of a very large number of small/medium plants (rooftop residential or commercial PV plants) characterized by a cost of the energy produced that, according to the size of the plant, ranges from twice to even sevenfold higher relative to a large utility plant based on crystalline silicon modules [3]. It should, therefore, come as no surprise that the increasing demand for electricity production from large PV plants has entered into direct competition with different land uses, especially agricultural use. Large photovoltaic power plants in the order of hundreds of MW are now becoming increasingly common all over the world, requiring land areas that could exceed, in the case of Italy, hundreds of hectares for their installation and operation [4].
The solutions proposed to offset the effects of this competition to date can be divided into two categories: Those that involve moving the installation of large photovoltaic systems to non-agricultural areas (unused agricultural areas, water basins, etc.) and those that involve finding technical systems that allow for the coexistence, perhaps even in synergy, of agricultural activity linked to the production of electricity from photovoltaics. In the latter case, the term agrivoltaic (APV) is used. Figure 2 shows an image of an agrivoltaic plant [5].
In this paper, a cost–benefit analysis is performed to evaluate whether, in Italy, the installation of an APV plant can be economically advantageous with respect to the installation of a standard GMPV plant for the case of PV utilities. The paper is structured into six sections. In Section 2, the scientific literature relevant to the case under investigation is reviewed, in Section 3, the theoretical analytical framework is illustrated in terms of the price–performance ratio (Section 3.1), performance benefit (Section 3.2), and Net Present Value (Section 3.3), Section 4 reports the results of the analysis performed using a PV 1 MW utility plant as a case study, Section 5 is dedicated to the discussion of the results. The conclusions are presented in Section 6.

2. Literature Review

The term “agrivoltaic” was first conceived in 1982 by Goetzberger and Zastrow to propose a dual land use in which crop cultivation could coexist with photovoltaic energy production [6].
At present, agrivoltaic encompasses a wide range of possible combinations in terms of coexistence of solar electricity production plants conducting agricultural activities. Neglecting the case of closed solutions such as greenhouse crops which generally (and certainly in Italy) constitute a negligible fraction of the land involved in agricultural production, agrivoltaics ranges from the simplest case of soil maintenance to grassland farming or from fodder production to the more complex case of coexistence with agricultural activity supported by the use of specific machinery [7]. Further classification can be made in terms of the specific photovoltaic technology involved, such as: Fixed ground mounted, fixed ground elevated, adoption of tracking systems, etc., as schematically reported in Figure 3 from Ref. [8].
In all cases, unlike a conventional ground-mounted photovoltaic system, an agrivoltaic system has to be designed to limit any obstacle to agricultural activity to the greatest extent possible while trying to simultaneously maximize the production of electricity [9,10]. De facto, these objectives are antithetical since both the production of electricity from photovoltaics and that of a generic crop require the same primary energy source: The sun. Moreover, if we consider silicon solar cells, the most widespread technology photovoltaics is based on, they are generally designed to exhibit energy conversion efficiency in the same specific portion of the solar spectrum, the yellow-green region, which more effectively stimulates the biochemical processes typical of vegetable growth [11,12]. Interestingly, this is also the region in which the Earth’s solar spectra demonstrate maximum irradiance. Thus, the scientific community has increased its efforts to study and experimentally investigate possible solutions to cope with the above dualism. However, in spite of this interest, the number of scientific papers on this topic is still limited to just slightly more than 270, most of which appeared in the last four years. The reason for this is the novelty of the subject that connects two very different fields: Agriculture and electricity production. Most of the scientific and technical results obtained thus far have been recently reviewed by Trommsdorff and co-authors. In this work, the theoretical and practical implementation aspects are widely discussed. In the same paper, economical aspects are also illustrated, and an overview of the agrivoltaic implementation projects in various countries all over the world is reported [13]. Moreover, more recently, the worldwide research trends on this issue have been reviewed by Chalgynbayeva and co-authors in a paper based on publications indexed in SCOPUS [14].
At the same time, due to concerns about possible problems that photovoltaic diffusion could cause for agriculture, various governments are proposing guidelines aimed at preserving the type and productivity level of croplands by setting a limiting cap to the agricultural area that can be used for PV activity and/or by asking for the implementation of innovative PV technical solutions. These solutions are, in general, related to the arrangement and the structure of the agrivoltaic plant, aiming to compensate for the unavoidable competition between crop and electricity production by maximizing their mutual synergies. This can be achieved by means of more efficient PV module cooling, possible saving of water resources, or crop protection strategies implemented during adverse weather conditions [15,16,17,18]. At the same time, an economic assessment of this issue is now becoming urgent since such regulatory measures include subsidizing schemes to support agrivoltaic diffusion. Given the higher cost of an agrivoltaic plant compared to a conventional one, its lower density of installed power per unit of surface resulting from the need to minimize shading and to integrate the agricultural activities, its lower energy productivity deriving from the non-optimization of the structure of the plant itself for the purpose of energy production and considering the economic yield of agricultural production, it is, in fact, questionable whether it is convenient to install an APV system or, maybe, to install a more conventional GMPV system on a suitably reduced agricultural surface, unless a specific subsidizing scheme is adopted.
A general solution to this issue is still missing because, as stated by Mohammad Abdullah Al Mamun and co-authors, many data are not assessed or may not be collected at all. This includes data on crop yield changes, water use efficiency, PV panel temperature change in the agrivoltaic frame, or working and maintenance expenses in different operative scenarios [19]. For instance, the first data on the soiling effect in agrivoltaic plants have only recently been released, disclosing a quite worrying scenario for the heavy deleterious effect that cropland activities seem to cause on photoelectricity production [20]. Until now, it has been generally accepted that due to the higher capital costs involved, a supporting prize evaluated up to 0.80 USD/WDC should be conceived for agrivoltaic installations, as a recent NREL reported [21] and that Feed in Tariff to support APV could be only avoided for high-value crops and low land costs [22]. Moreover, as Daniels has recently pointed out when discussing the opportunities and obstacles to the development of utility-scale solar projects on agricultural lands in the US, apart from the need for public subsidies, agrivoltaics often require a large investment in transmission lines that will not be easily accepted by landowners and local communities [23]. As far as Italy is concerned, Agostini and coworkers have reported on the comparable techno-economic performances of a specific APV system (Agrovoltaico®) built on tensile structures and installed in the Po Valley with respect to other conventional PV systems [24].
On the other hand, in Italy, the National Recovery and Resilience Plan (NRRP) allocates a significant amount of financial resources (EUR 1.10 billion) to increase the share of energy produced from renewable energy sources [25].
Agriculture is heavily involved in this regard, considering that the sector is responsible for 10 percent of greenhouse gas emissions in Europe. Thus, with one of the measures included in the Plan, the spread of agrivoltaic systems of medium and large dimensions is incentivized. In particular, the investment measures specifically provide for: (a) The implementation of hybrid agriculture energy production systems that do not compromise the use of land dedicated to agriculture but contribute to the environmental and economic sustainability of the farms involved, (b) the monitoring of achievements and their effectiveness, collecting data on both photovoltaic systems and production of underlying agricultural activity, in order to evaluate the microclimate, water saving, fertility recovery soil, resilience to climate change and agricultural productivity for different types of crops. The investment aims to make the agricultural sector more competitive, reducing the costs of energy procurement (currently estimated to account for more than 20 percent of farms’ variable costs, with even higher peaks for some herbivorous and granivorous sectors) while improving climatic–environmental performance. The objective of the investment is to achieve a production capacity from agrivoltaic plants, when fully operational, of 1.04 GW, which would produce approximately 1300 GWh per year, with an estimated reduction in greenhouse gas emissions of about 0.8 million tons of CO2. Investigating the possible development of APV by examing the economic feasibility of a plant and highlighting the critical points for its implementation, which is the aim of this paper, is urgent and coherent with one of the objectives of NRRP.
Schindele and co-authors have recently proposed a methodology to study the techno-economic implementation of APV with respect to GMPV by evaluating the economic ratio between the price to be paid for the agrivoltaic solution to be implemented and the economic performance resulting from preserving cropland activity [26]. The study compares the performances of PV plants of different capacities: A 1379 kWp GMPV plant and a 1038 kWp APV system engaging the same total area of about 2 ha. Based on data obtained over years of observation, the authors conclude that, in spite of the higher capex costs of the APV systems, there are cropland activities that make the implementation of an agrivoltaic system economically advantageous.
A similar cost–benefit analysis was performed to compare the installations of APV and GMPV utility plants (1 MW), considering crops such as common wheat and durum wheat, corn, soybean, potato, or sunflower whose cultivation requires a rather extensive land use [27]. In this work, however, we compare APV and GMPV plants of the same total power capacity, G, and engaging defined total areas that are determined by PV power densities typical of GMPV and APV plants, respectively. In this way, area-related costs, such as those typical of mounting structures or site preparation, can be more clearly highlighted, and the price to be paid for the agrivoltaic solution to be implemented can be more easily and clearly determined. To ensure a reliable comparison, either the APV and the GMPV plants should be built using the same PV technology, such as the type of cell (silicon, CIS, etc.), the type of module (single sided, double sided), and, finally, the type of system, here considered fixed. Finally, to evaluate the economic performance resulting from the cropland activity, the agricultural annual revenues in terms of Value of Agricultural Production, VAP, are considered. Since the agricultural annual revenue can be dependent on the land location, the analysis has been performed at a regional level. The Italian territory extends over a considerable latitude range: From 47°5′ N at the northernmost point up to 37°56′ N at the southern one. This reflects a considerable difference in the GMPV power density: From about 75 W/m2 in the north to 87 W/m2 in the south, with an average of about 80 W/m2 and, in turn, in a corresponding sensible difference in the land requirement. When an issue refers both to the APV and to the GMPV plants, the term “PV plant” is adopted.
The main objective of this paper is to investigate the economic feasibility of implementing an agrivoltaic PV utility plant in comparison to a more standard ground-mounted PV utility. In this respect, although the problem of energy procurement in agricultural farms can have a particular impact on their profitability, in this study, aspects related to the self-consumption of electricity produced are not considered because they are not relevant to the objective this work resolves [28,29,30].

3. Materials and Methods

3.1. Price–Performance Ratio

As stated above, the price–performance ratio, ppr, is a technical–economic methodology that compares the extra cost, ec, that has to be paid per annum to preserve land agricultural use when the same land is also considered for the installation of a photovoltaic plant, with respect to the performance benefit pb that is, the economic revenue deriving from preserving the agricultural production of the area under consideration [26]:
p p r = e c / p b
In this methodology, ec is the differential price that has to be paid for installing a PV plant with the greatest possible compliance with respect to agricultural activities and pb is the resulting economical advantage. Of course, by definition, the lower ec and/or the higher pb, the more advantageous the installation of an agrivoltaic solution. The price–performance ratio analysis developed below is a cost–benefit analysis that compares the benefits resulting from the production of electricity by the APV plant, considering the capex and opex costs encountered during its whole operating lifetime and in terms of the correlated agricultural activities’ revenues. Hereafter, this project will be compared with a base case in which a more conventional GMPV plant is installed instead of the agrivoltaic one. In terms of Equation (1), if ppr > 1, then the implementation of agrivoltaic solutions would not be convenient from a technical–economic point of view.

3.2. The Extra Cost ec and the Levelized Cost of Energy

A general expression for ec, that is, for the price to be paid for the implementation of an APV plant with respect to a more conventional GMPV, is:
e c = L C O E A P V × E A P V L C O E G M P V × E P V / N
where LCOE is the Levelized Cost of Energy in EUR/kWh and EAPV and EPV are the total electric energy production, in kWh, along the whole operating lifetime, N years, of, respectively, the APV plant and the GMPV plant. In other words, ec is the cost to be paid for the implementation of an APV plant with respect to a GMPV plant.
LCOE, whose dimension is EUR/kWh, is defined as the ratio between the PV plant cost and the electric energy produced in its total lifetime. This methodology of energy cost estimation was first proposed by Short et al. in order to introduce a technique suitable to compare the costs of different sources of energy [31] and then thoroughly reviewed by Branker et al., as far as PV is concerned [32,33]. Here, we use the expression for LCOE defined by Vartiainen and coworkers [34] for large PV plants:
L C O E = C A P E X P V + O P E X P V t ( 1 + W A C C n o m ) t + I n v R e p l 1 + W A C C n o m N / 2 R e s V a l 1 + W A C C n o m N Y i e l d 0 × 1 d t 1 W A C C r e a l t
In Equation (3), N is lifetime of the PV system, t is the year number ranging from 1 to N, CAPEXPV is the total capital expenditure of the system, made at t = 0 in EUR /kWp, OPEXPV(t) is the operation and maintenance expenditure in year t in EUR/kWp, InvRepl is the cost of the inverter replacement, made at t = N/2 in EUR /kWp, ResValue is the residual value of the system at t = N in EUR /kWp, Yield(0) is the initial annual yield in year 0 in kWh/kWp without degradation, d is the annual degradation of the nominal power of the system, WACCnom is the nominal weighted average cost of capital per annum and WACCreal is the real weighted average cost of capital per annum. The relation between WACCnom and WACCreal is:
W A C C r e a l = 1 + W A C C n o m 1 + i 1
where i is the annual inflation rate.
In the following equation, residual PV plant value and inverter replacement costs are considered to mutually compensate each other, which is very realistic since a modern PV plant’s operating lifetime is now in the range of 30 years while, for these calulations, N is still assumed to be 25 years [35]. Thus, if we multiply both numerator and denominator of Equation (3) by the total peak power of the PV plant, G, we then obtain:
L C O E = C A P E X P V , t o t a l + O P E X P V ,   t o t a l t ( 1 + W A C C n o m ) t G Y i e l d 0 1 d t 1 + W A C C r e a l t
where CAPEXPV,total is the total capital expenditure of the system, made at t = 0 in EUR and OPEXPV,total(t) is the operation and maintenance expenditure in year t and in EUR for the whole plant. OPEXPV,total(t) is generally assumed to only be dependent on the power size of the PV plant throughout its whole operating lifetime. Finally, G×Yield(t) × (1 − d)t is the total plant electric energy production in the year t.
Following the recommendation of the European Commission [27] in Italy, for long-term investments, WACCnom is presently set at about 5%, and a 2% inflation rate is considered [36]. Recalling that on the average d ≈ −0.05%/yr [37], with straightforward calculations, it can be shown that Equation (5) turns into:
L C O E = C A P E X P V , t o t a l × 1 + W A C C r e a l N + N × O P E X P V , t o t a l   N × Y i e l d 0 G
This expression for LCOE is particularly useful for this analysis, since it allows us to simply highlight the effect of the capital and operation and maintenance expenditures related to the power of the PV plant, CAPEXP and OPEXP with respect to those that are area intensive: CAPEXA and OPEXA [38]:
C A P E X P V , t o t a l = C A P E X = C A P E X P + C A P E X A
N O P E X P V , t o t a l = O P E X = O P E X P + O P E X A ,
CAPEXP are all the capital expenditures related to the capacity size of the PV plant in Watts. The expenditures are related to the modules cost, combiners, switch gears, fuses, ground fault detectors, charge controllers, batteries, transformers, and grid connection equipment. In CAPEXP, additional costs related to plant design, test, and start-up, as well as the installation profits and any other administrative or financial costs are, in general, also included.
CAPEXA are all the capital expenditures related to the area of the PV plant in m2. They include costs related to the supporting structures, the component transport up to the installation site, the site preparation, and any civil work required for the realization of the mounting structures, such as a reinforced concrete base or a fence.
OPEXP are all the costs accrued throughout the PV plant’s lifetime and depend on the capacity size of the plant, such as, for instance, costs related to module and electric equipment replacement.
Finally, OPEXA are all the costs depending on the area of the plant, such as, for instance, those related to land rental, to its maintenance, and to surveillance and monitoring.
Since, for the case under consideration, APV and GMPV plants have the same total peak power, G, then:
E A P V = E P V = E p r = G × Y i e l d 0 × 1 d t   ,
Moreover, since APV and GMPV plants are based on the same technologies:
Y i e l d 0 A P V = Y i e l d 0 P V = Y i e l d 0 ,
The difference in Equation (2) can be, therefore, rewritten as:
e c = ( L C O E A P V L C O E G M P V ) × E p r N = C A P E X P A P V + C A P E X A A P V × 1 + W A C C r e a l N + O P E C P A P V + O P E X A A P V   N × G × Y i e l d 0 C A P E X P G M P V + C A P E X A G M P V × 1 + W A C C r e a l N + O P E X P P V + O P E X A P V   N × G × Y i e l d 0 × G × Y 0 × N / N ,
Since APV and GMPV plants have the same capacity, the power-dependent costs are as follows:  C A P E X P A P V = C A P E X P G M P V  and  O P E X P A P V = O P E X P P V , Equation (11) can be more simply rewritten as:
L C O E A P V L C O E G M P V × E p r / N = ( 1 + W A C C r e a l N × C A P E X A A P V C A P E X A G M P V + O P E X A A P V O P E X A P V ) / N ,
For this analysis, both  C A P E X A A P V  and  C A P E X A G M P V  can be more usefully expressed in terms of a cost per unit of surface:
C A P E X A A P V = C a p e x A , u A P V × A t o t A P V ,
and
C A P E X A G M P V = C a p e x A , u G M P V × A t o t G M P V ,
where  C a p e x A , u A P V  are the area-related capital expenditures of the APV plant per ha,  C a p e x A , u G M P V  are the area-related capital expenditures of the GMPV plant per ha and  A t o t A P V  and  A t o t G M P V  are the areas, in ha, occupied by the APV plant and the GMPV plant, respectively.
Similarly, the area-dependent Operation and Maintenance costs can be expressed as:
O P E X A A P V = O p e x A , u A P V × A t o t A P V ,
and
O P E X A G M P V = O p e x A , u G M P V × A t o t G M P V ,
where  O p e x A , u A P V  are the area-related capital expenditures of the APV plant per ha and  O p e x A , u G M P V  are the area-related capital expenditures of the GMPV plant per ha.
Agrivoltaic is, in many aspects, still in its infancy with respect to ground-mounted PV plants, and the related technological costs are still far from being market assessed [22]. Several reports have shown that agrivoltaic plants are expected to have CAPEX and OPEX costs considerably higher with respect to GMPV plants, mainly in terms of CAPEX costs, but a number of cost items are still simply disregarded. These could be, for instance, capex costs, such as those related to realizing irrigation systems compatible with the APV plant, or to more complex safety systems related to the dual land-use operation or opex costs, related, for instance, to more frequent module cleaning requirements, to different and more complex soil investigation requirements, etc. Such costs are not currently investigated, and may not be conceived at all, and, therefore, they will be neglected here. As a result, from a mathematical point of view, this turns into a minorization in the evaluation of ec in Equation (2).
In order for a simple expression for the extra cost ec, to be obtained, here, it will be assumed the  C a p e x A , u A P V  is proportional to  C a p e x A , u G M P V :
C a p e x A , u A P V = β × C a p e x A , u G M P V ,
with β ≥ 1 and the  O p e x A , u A P V  proportional to  O p e x A , u G M P V :
O p e x A , u A P V = δ × O p e x A , u G M P V ,
with δ ≥ 1, so that Equation (12) can be simply rewritten as:
N × e c = 1 + W A C C r e a l N × C a p e x A , u G M P V × ( β × A t o t A P V A t o t G M P V ) + C a p e x A , u G M P V × ( δ × A t o t A P V A t o t G M P V ) ,
or:
N × e c = 1 + W A C C r e a l N × C a p e x A , u G M P V × A t o t G M P V × β ε 1 + O p e x A , u G M P V A t o t G M P V × δ ε 1 ,
where ε =  A t o t G M P V / A t o t A P V  is the ratio between the area occupied by the GMPV plant and the area occupied by the APV plant and β and δ will, in general, depend on the specific technology adopted for the implementation of the APV plant. For instance, in the case investigated by Schindele and coworkers, it is β ≈ 3.5 and δ ≈ 0.8.

3.3. Performance Benefit

The performance benefit, pb, is the annual revenue that results from preserving the land under APV plant for cropland activity with respect to annual revenues resulting from cropland activities eventually compliant with the GMPV plant. They depend, in general, on the particular cultivation and on the location.
Referring to the whole operating lifetime of the PV plant N, pb is, therefore, expressed as:
p b = V A P A P V , u t ( 1 + W A C C n o m ) t × A t o t A P V V A P G M P V , u t ( 1 + W A C C n o m ) t × ( A t o t A P V A t o t G M P V ) / N ,
where  V A P A P V , u  and  V A P G M P V , u  are annual Values of the Agricultural Production for surface unit in the case of the APV and GMPV plant, respectively. VAP is defined by means of the “quantity by price” method, which consists of multiplying the quantities of the products by their average annual unit price. The latter is increased by any contributions and adjusted for taxes on the products, and thus, the basic prices are obtained. Using the basic prices, the “quantity by price” method allows the production value to be obtained for each product [39].
For the sake of simplicity, we will assume that both  V A P A P V , u  and  V A P G M P V , u  do not vary during their operating lifetime. Therefore, assuming again that  W A C C n o m 1 , as discussed, Equation (21) can be rewritten as:
p b = V A P A P V 0 × A t o t A P V V A P G M P V 0 × ( A t o t A P V A t o t G M P V ) ,
where it is assumed, as schematically depicted in Figure 4, that the total land available is used for the installation of the APV plant and, as far as GMPV is concerned, that the only area available for agricultural activity is the portion of the land not used for GMPV implementation. This means, in other words, that we neglect the possibility that the land under the GMPV plant could be used for some cropland activity and could generate agricultural revenue. Notably, the  W A C C n o m  value depends on the specific productivity sector and, in general, the value to be used for pb valuation may be different from the value to be used for ec evaluation. Under the above assumptions:
p b = V A P A P V , u 0 × A t o t A P V × 1 α + α × ε   ,
where:  α = V A P G M P V , u 0 / V A P A P V , u 0  is the ratio between the annual revenue of the cropland activity performed in the area left available in case of implementation of a GMPV plant with respect to the activity performed under the APV installation.

3.4. Net Present Value

Net Present Value (NPV), defined as the sum of the present values of the single yearly cash flows, is another useful tool that can be used to compare APV and GMPV implementation from an economic point of view. For economic investments to be feasible, NPV should be positive: The higher its value, the more profitable the investment will be. Equations (24) and (25) report the NPV expression for the APV and the GMPV utilities, respectively. The revenues, R, refer in both cases to the actual revenues related to commercialization of both the produced electric energy, Revel, and the cropland activity, Revagr. Similarly, the operation and maintenance costs are here related to both the cropland activity, OPEXagr and to the PV plant operation, OPEXPV,total:
N P V A P V = C A P E X A P V , t o t a l + R e v e l A P V t + R e v a g r A P V t O P E X a g r A P V t O P E X A P V ,   t o t a l t ( 1 + W A C C n o m ) t
and
N P V G M P V = C A P E X G M P V , t o t a l + R e v e l G M P V t + R e v a g r G M P V t O P E X a g r G M P V t O P E X G M P V ,   t o t a l t ( 1 + W A C C n o m ) t  
Recalling that the APV and the GMPV plants are characterized by the same total power capacity, a quite simple expression can be obtained for:
  Δ N P V = N P V A P V N P V G M P V   ,
taking into account that in differentiating, the terms related to plant power mutually cancel each other out:
  Δ N P V = N P V A P V N P V G M P V = 1 β × ε × C a p e x A , u G M P V + R e v a g r × A t o t A P V 1 ε × 1 ( 1 + W A C C n o m ) t ,
where it has also been assumed that the OPEX costs are similar for an APV and a GMPV plant and that agriculture revenues do not change over time.

4. Results

In this paragraph, the above-developed methodology is applied to study the case of APV and GMPV utility plants of the same 1 MW capacity, installed in agricultural lands intended for the cultivation of Durum Wheat, Common Wheat, Corn, Sunflower, Soybean, and Potato, in all the Italian regions.
From Equations (20) and (23), ppr can be expressed as:
p p r = e c / p b = 1 + W A C C r e a l N × C a p e x A , u G M P V × A t o t G M P V × β ε 1 + O p e x A , u G M P V × A t o t G M P V × δ ε 1 N × v a p A P V 0 × A t o t A P V × 1 α + α × ε   ,
For the  O p e x A , u G M P V   1 + W A C C r e a l N × C a p e x A , u G M P V , Equation (24) can be simply rewritten as:
p p r = e c p b = C a p e x A , u G M P V × β ε N × V A P A P V , u 0 × ε   ,
where, as a futher minorization for ppr W A C C r e a l  has been assumed negligible. In Equation (29), it has been assumed that  α = 1 . This means that the annual revenue in EUR/ha of the cropland activity performed under the APV plant does not change with respect to the activity performed in the area unaffected by PV installation. In general, this can be considered an optimistic assumption due to the unavoidable APV shadowing effect, although it has also been observed that some specific crops, such as lettuce, tomatoes, or pepper, are particularly shade tolerant, to the point that some papers have reported possible productivity increases in some cases [19].
Equation (29) is particularly meaningful. It states that for ε→1—that is, when the areas engaged by the GMPV and the APV plants tend to be similar—ec decreases and pb increases since the agricultural activity becomes more and more feasible only for the APV plant. At the same time, ec increases as β increases, that is, as the complexity of the infrastructures required by the APV plant increases and pb increases as the productivity of the cropland activity increases. This means, in turn, that there is hardly any reason, from an economic point of view, to implement an APV plant with respect to a GMPV one in order to preserve the agricultural activity for a low-revenue cropland activity. Finally, since ec decreases as the  C a p e x A , u G M P V  costs reduce, due to the latitude effect on the PV power density, a further 15% decrease in the south of Italy should be then taken into account with respect to the north.
As a practical example, in Figure 4a, the case of a 1 MW utility-scale photovoltaic system to be installed in an available cropland area of 2.5 ha is discussed. The APV plant is assumed to occupy the whole available area of 2.5 ha (Figure 4b) and, assuming a power density of 40 W/m2, a quite common value for this kind of installation, it is ε = 1/2. For the case of the GMPV plant, assuming a power density of 80 W/m2, as is standard in Italy, the whole occupied area is 1.25 ha. Figure 4c,d shows the representations of the implementation of a 1 MW GMPV plant in this case.
Under the above assumptions and using, for the  C a p e x A , u G M P V   cos ts   , the data from Table 1 (Italian operators), it is:
p p r 220 , 000 25 × β 0.5 E U R   h a × y r 0.5 × V A P A P V , u 0 E U R   h a × y r   ,
The extra cost in the numerator linearly depends on β, and it can range from 4400 EUR/ha for β = 1 to much higher values depending on the complexity of the APV plant. In the case studied by Schindele and co-authors, β ≈ 3.5, and ec ≈ 26,000 EUR/ha × yr. The most favorable lower limit simply corresponds to the case in which the APV plant structure is the same as the GMPV structure, although it is extended on a double area. β increases if the APV mounting structure is designed to fully allow the cropland activity beneath it, as is the case when panels are mounted several meters over the ground to fully allow the movement of agricultural machinery.
For comparison, in Table 1, the costs listed in Refs. [13,26] are also reported. For the case of the Italian operators, data in EUR/ha have been obtained, with an average PV power density of 80 W/m2, as discussed in paragraph 1. For the case of Schindele and co-authors, the power density used is 69 W/m2, as reported by the same authors. Notably, there is a marked difference in the cost of mounting structures and hardware reported from Ref. [26] with respect to data from Italian operators or Ref. [13]. As far as  V A P A P V , u 0  is concerned, in Table 2, the annual revenue in EUR/ha for the main crops cultivated in Italy and others listed above are reported [40]. The results have been articulated by regions given the evident differences concerning prices and yields of the crops verifiable in the Italian regions for the same crop and are based on 2020 data for the crops which occupy at least one percent of the regional Utilized Agricultural Area (UAA).
Data show that the annual agricultural revenue for most extensive crops considered here is too low to allow the implementation of APV in comparison with a GMPV plant unless proper subsidizing schemes are conceived. In all cases, the ppr would be larger than 1 for any suitable β value. On the contrary, APV is a possible option for areas dedicated to potato crops. In this case, however, the complexity of the APV design that can be considered is strongly dependent on the specific region. In Sardegna, APV with a β value up to four can still be considered economically advantageous, while in Veneto, for instance, only β values around two are acceptable. In Figure 5, the ppr value is calculated from Equation (30), assuming that β = 2. Only in Veneto, Puglia, Campania, Sicilia, and Sardegna can APV implementation be considered economically advantageous for potato cropland activities. In terms of specific crops, such a frame does not substantially change, even considering a doubling of VAP during the whole APV plant lifetime, thus relaxing the approximation in Equation (22). In such a case, for potato crops, β values even higher than four can be considered feasible in Veneto, Puglia, Campania, Sicilia, and Sardegna.
It is worth stressing here that the farm accountancy data network (FADN) for 2020 releases data somewhat different from those used above. Additionally, the analysis performed using this source seems to suggest that, for the case of potatoes, there is no possibility of implementing an APV project that is economically advantageous in Italy.
In Figure 6, we report ΔNPV assuming β = 3.5, the value reported by Schindele and co-authors. It is easy to observe that only revenues higher than about 20,000 EUR/ha make the conditions for the implementation of an APV utility plant profitable with respect to a GMPV utility, that is only 6% of the crops reported in Table 2.

5. Discussion

The results above are intended to evaluate the economic feasibility of the implementation of a utility-scale APV plant in agricultural areas dedicated to common and durum wheat, corn, soybean, potato, or sunflower production in Italy. It is shown that:
-
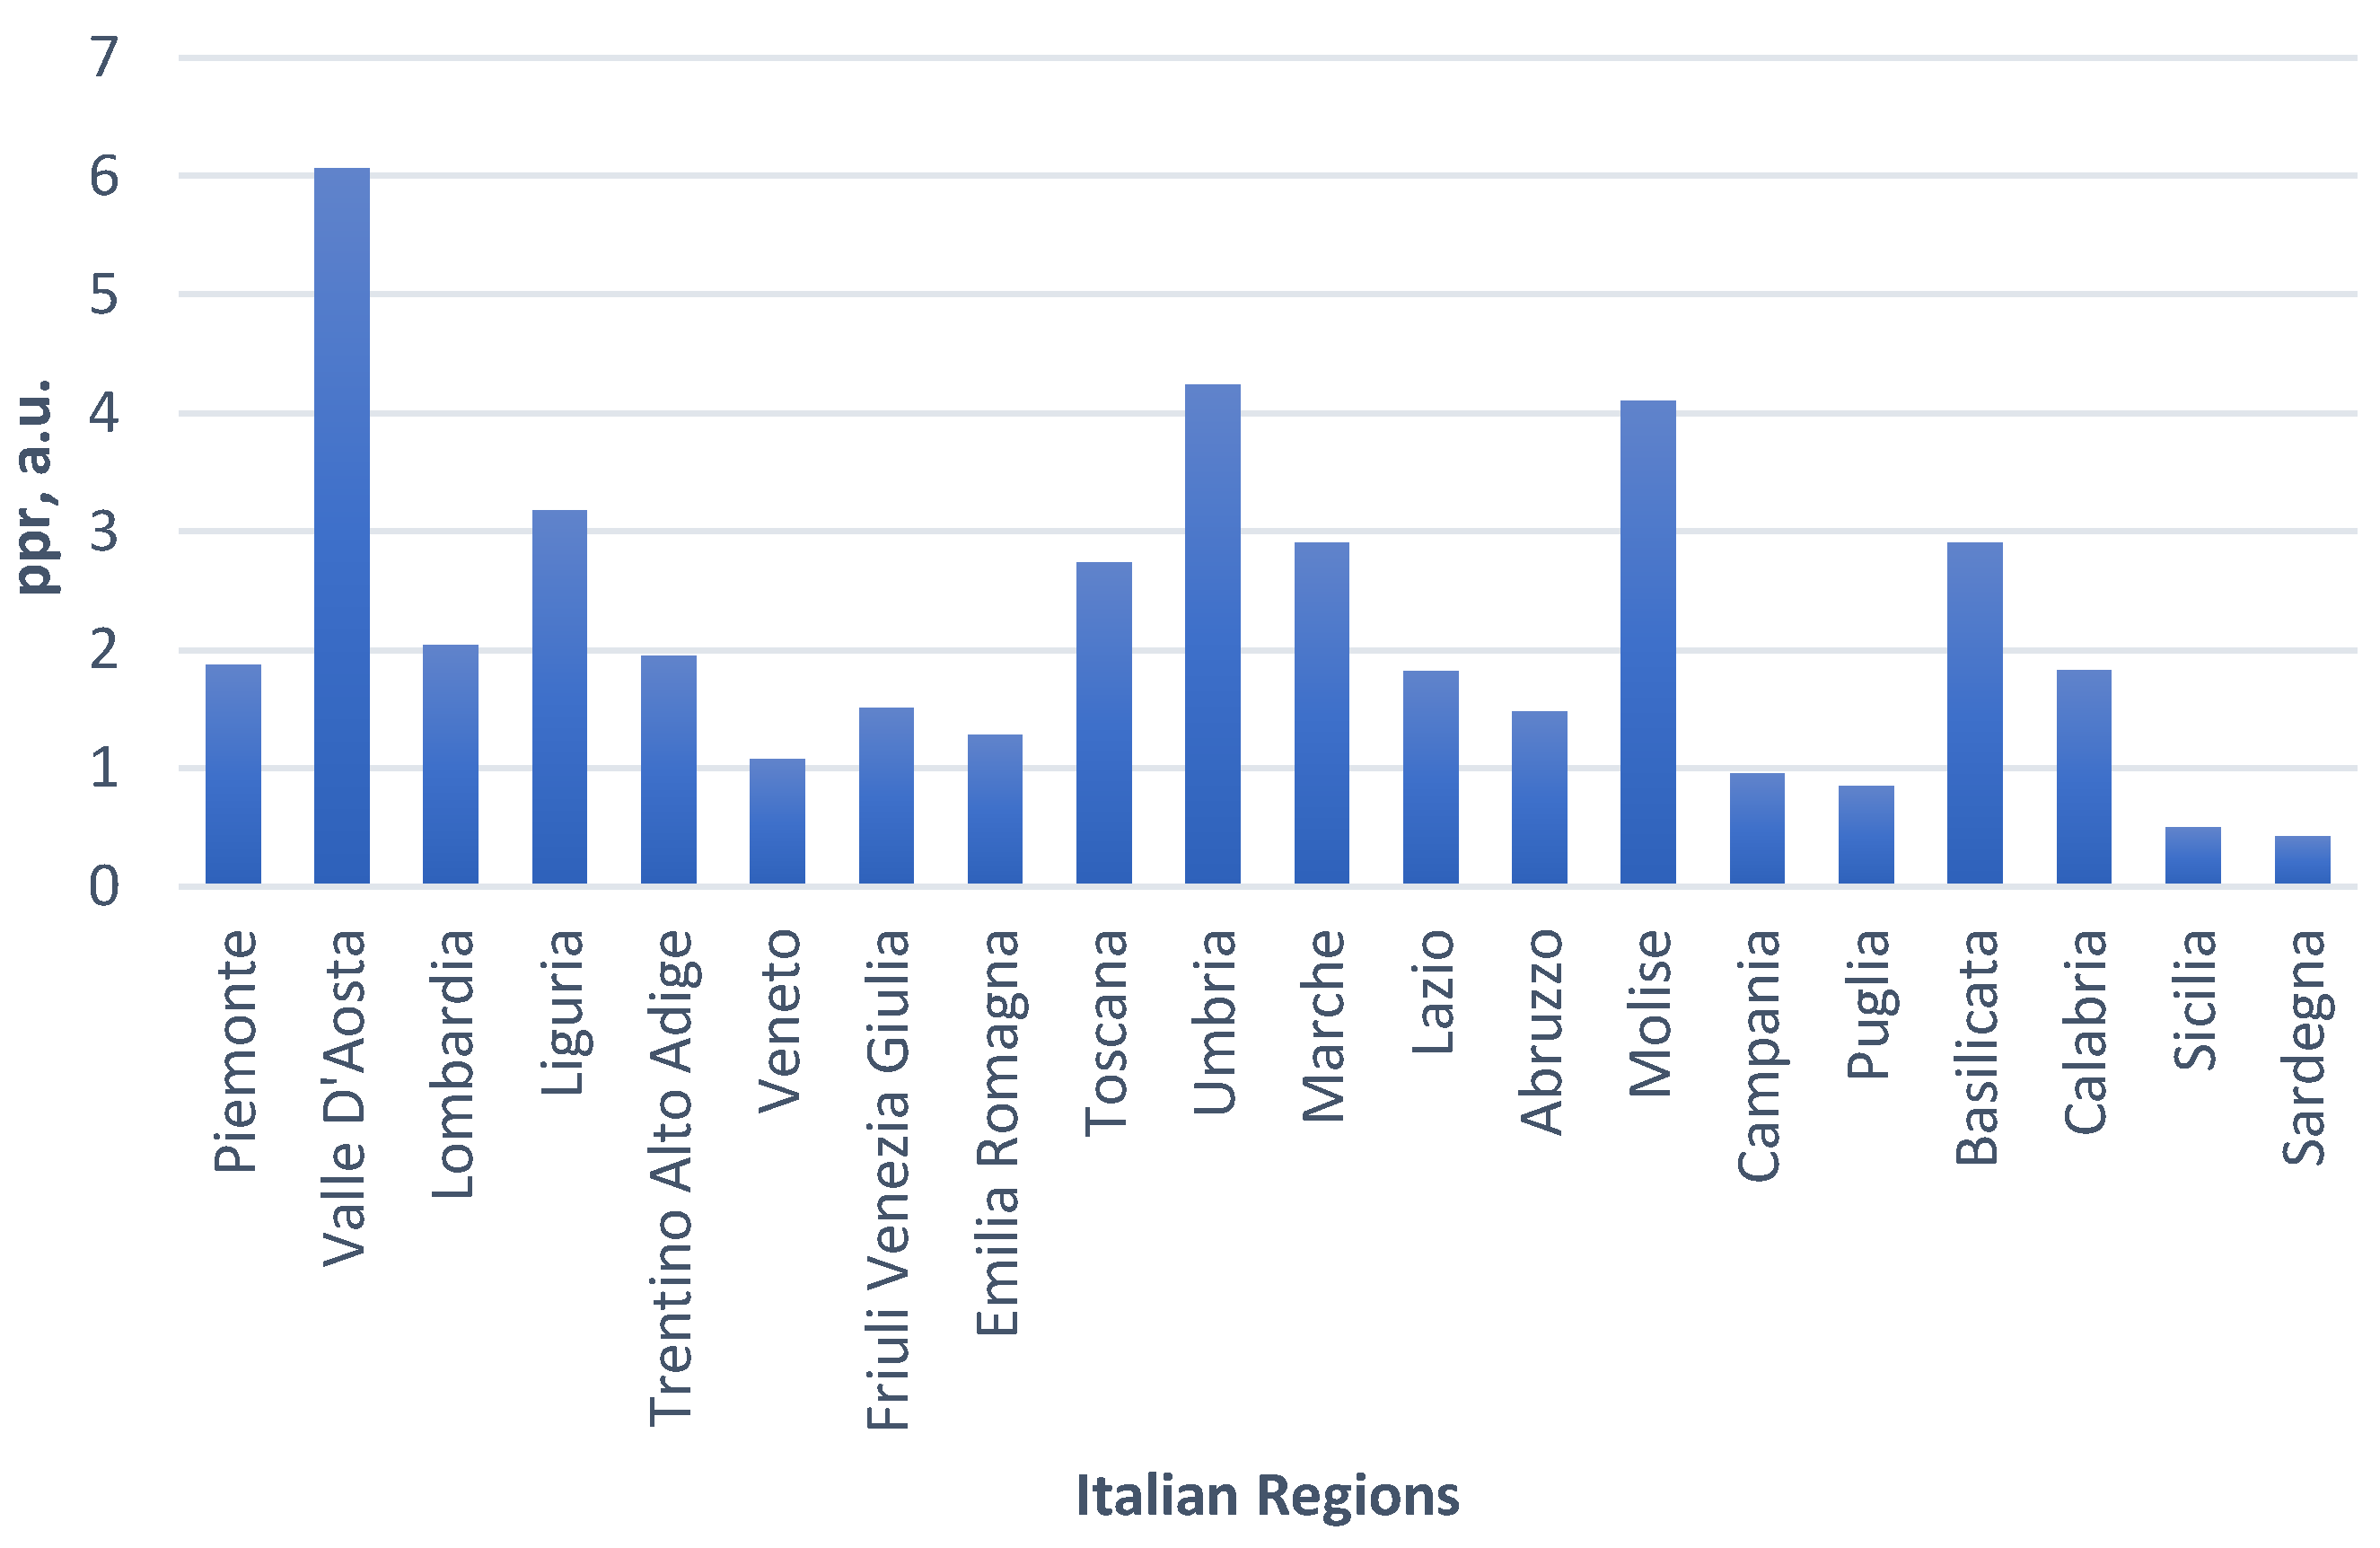
Due to the values of the agricultural revenues reported in Table 2, in most parts of the Italian territory, ppr can be lower than one only for β values in the range 1–2, that is for APV systems that are not too different from the corresponding GMPV plants. It is worth noting that, in this respect, at present, β values higher than three are reported in the literature.
-
For the lower-revenue cropland activities, there is no practical reason, from an economic point of view, to implement a utility-scale agrivoltaic plant: APV infrastructural costs are, at least at present, too high to justify the preservation of the limited cropland activity revenue in any part of the Italian territory. In this case, ppr can only decrease to values below one if there is a modification in the agricultural activity turning to higher VAP productions and/or if the extra cost ec is decreased by means of the adoption of some kind of external supporting financial scheme to electric energy production, such as a Feed in Tariff or a dedicated prize. Paradoxically, this is also the frame where, as discussed in further detail below, the implementation of utility-scale APV could be more interesting for social and political reasons since it could, in principle, help counter the phenomena of land abandonment and exodus from rural areas;
-
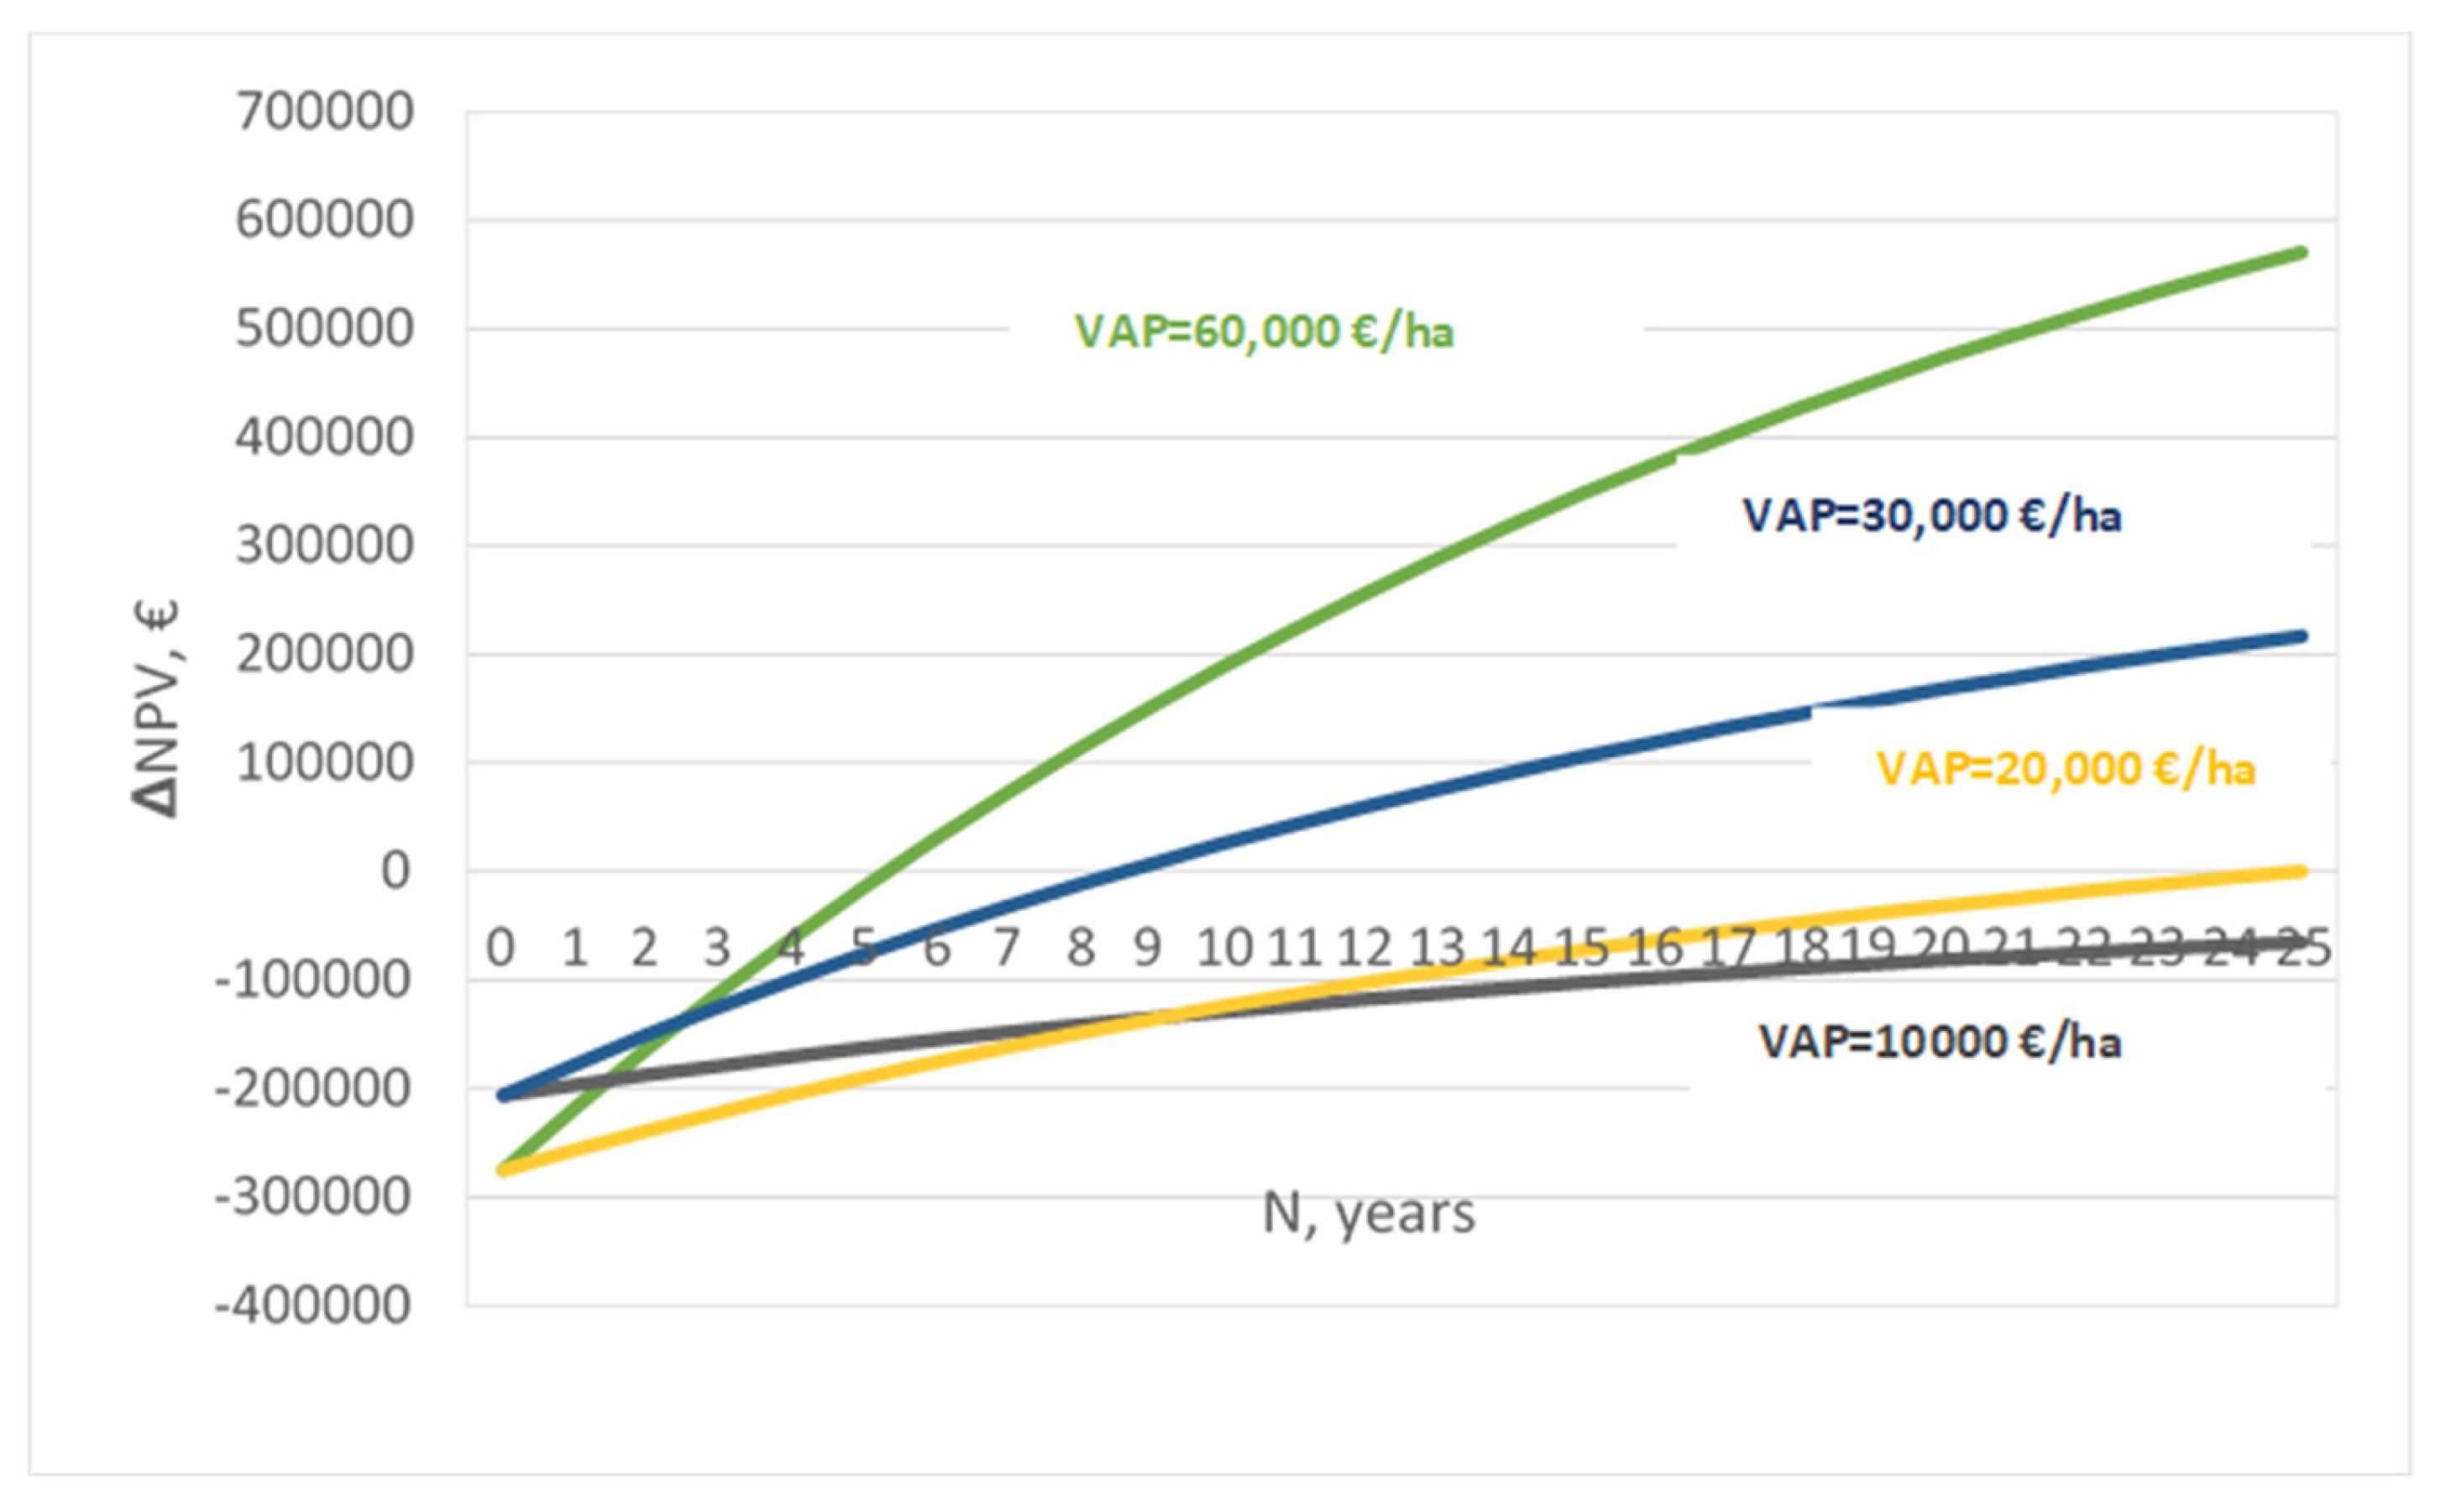
For a high-revenue cropland activity, such as potato cultivation, the high APV infrastructural costs are at least partially compensated by high VAP values leading, in some Italian regions, to ppr values less than one, even without the adoption of any financial supporting scheme. However, in this case, the economically feasible APV-specific design is dependent on the location of the agricultural activity since the cropland revenue is strongly site dependent. Of course, high revenues croplands are at much less risk of abandonment or exodus, and therefore, the adoption of financial schemes supporting electric energy production should be very carefully considered.
This analysis shows that, at least in Italy and for the crops considered, in general, the installation of an agrivoltaic utility system is not financially advantageous: Under current market conditions, significant public incentives should be considered. Hence, instead of posing the problem of how to make the production of electricity and agricultural production coexist, it would be more useful to focus on which sites are suitable for installing an APV system and where the necessary incentives will be allocated.
Therefore, at least for Italy and for the crops investigated, in order to consider a concrete implementation of agrivoltaics, the location is a key decision. The installation of an agrivoltaic plant could be one of the political tools capable of countering two phenomena that are increasingly characterizing national agriculture, i.e., land abandonment—defined as the “cessation of agricultural activities on a given surface of land not taken by another activity (such urbanization or afforestation)” [41,42,43,44]—and the exodus from rural areas. The causes of land abandonment are many, including geographic, ecological, agronomic, demographic, socio-economic, and policy impact factors. As a result of these factors, areas of Italy are not being actively managed between 1.2 Mha and 1.8 Mha [45]. It is interesting to observe that such a land extension corresponds, with the available standard PV technologies, to a PV power capacity potential between 1000 GW and 1400 GW, so that recovering agrovoltaics of about 5% of such lands would be enough to satisfy the request of renewable PV electric energy production in Italy up to 2030, and 50% of such lands would be enough to satisfy any hypothesis of renewable PV electric energy production in Italy up to 2050 [46]. As an example, in Figure 7, an image of an abandoned cropland in the north of Italy is shown [47].
Regarding the second phenomenon, which is evidently connected with the first, the rural areas—characterized by small, scattered settlements, low population density, and a relatively long distance from the largest urban centers—are those that have been accused of the most serious demographic hemorrhages. In these areas, the municipalities defined as hyper-rural, which are predominantly agricultural, have shown the greatest vulnerability, although, in the last few years, they have exhibited unexpected resilience [48]. For this reason, the National Strategy for Inner Areas launched in 2014, in the framework of the programming period of European Territorial Cohesion Policies 2014–2020, aimed to improve the quality of life and reverse the demographic dynamics of these areas by ensuring the minimum essential services, a specific focus on this same issue is also included in the NRRR [49].
Therefore, as APV implementation is not, in general, an economically feasible option in most of the Italian territory for various crops, other socio-political motivations should be considered to select the zones as a candidate for agrivoltaics. In the light of previous evidence, the financial support for APV implementation would probably be more useful if applied to the marginal areas, i.e., zones characterized by land considered, for various reasons, of poor quality with regard to agricultural use, totally localized in the inner areas. Efforts should focus on tackling the two aforementioned phenomena: Abandonment and exodus. Notably, in Japan, the country in which agrivoltaics was first conceived and put into practice, the original motivation for agrivoltaic implementation was just to revitalize the use of abandoned farmland [50]. In this respect, in Japan, an innovative GIS-based methodology has recently been proposed to evaluate the electric potential of abandoned farmlands, and it was concluded that such areas could provide electric energy quantities 10 times higher than the estimated electric power consumption of the agriculture sector [51]. In more detail, and given several dual-use opportunities to combine APV systems with crop production, it should be considered much more likely and feasible to install an agrivoltaics plant on cropland instead of on areas occupied by vegetables, orchards, and other tree crops, although the former are hand-harvested crops which can be cultivated manually requesting little equipment, in addition to being shade-tolerant crops. This explains why the analysis has regarded the agricultural products such as durum wheat, common wheat, corn, soybean, sunflower, and potato, many of them typically diffused in marginal areas, whereas the farmers presumably would be more sensitive to the improvement of land productivity by implementation of APV capable of maximizing synergies among energy, food, and environmental security. On the other hand, as pointed out by Walston et al. [52], studies are emerging to integrate APV with more traditional shade-intolerant commercial crops, such as corn, soybean, and wheat [53,54].

6. Conclusions

It has been shown that, because of the higher costs of installation, the implementation of agrivoltaic utility plants in Italy is rarely economically advantageous with respect to more standard ground-mounted PV plants, even for high-revenue cropland. Moreover, there is a close dependence on the specific location since agricultural revenues are strongly site dependent. From an economic point of view, it is confirmed that PV energy produced by a GMPV plant is much cheaper with respect to that produced by means of an APV plant. Thus, there is hardly any reason to implement an agrivoltaic utility, even in the most favorable agricultural conditions, unless suitable and maybe even consistent supporting financial incentives are adopted. However, it was shown that such state aids should be not only correlated to the PV electric energy production. They should also consider the agricultural revenue of the land considered for APV installation, paying particular attention to the lower-revenue croplands at higher risk of abandonment. From this perspective, it would be useful to evaluate the use of such incentives as a valuable tool to simultaneously recover agricultural areas that have already suffered from the abandonment phenomenon. In this view, the dualism of PV energy production/agricultural activity would, in fact, relax since APV projects would be implemented in areas lacking in active agricultural production, and land recovery could have a number of indirect environmental benefits in terms of savings in the electric power consumption of the same agricultural sector. It is worth emphasizing that the above-reported approach has some limitations: The use of a quite limited database in terms of APV-related costs mainly due to the still relatively limited number of systems deployed all over the world, the lack of standardized agrivoltaic technologies that resulted in the uncertainty related to β evaluation and, finally the fact that the cost–benefit analysis developed only considers financial profitability, neglecting possible socio-economic benefits. The paper highlights that the use of just a few percent of the agricultural lands abandoned in Italy up to now could fully satisfy the demand for PV electric energy foreseen, in Italy, by 2030. It would probably be of great relevance for a sustainable deployment of APV plants in Italy to evaluate, in the near future, the specific potential of such areas for PV electric energy production and cropland activities along the lines being investigated in Japan.

Author Contributions

Conceptualization, G.D.F. and P.C.; Extra cost and NPV methodology, G.D.F.; Performance benefit P.C.; Ppr results, G.D.F. and P.C.; NPV results, G.D.F.; Formal analysis, G.D.F. and P.C.; data curation PV plants, G.D.F.; data curation, VAP, P.C.; writing—original draft preparation, G.D.F. and P.C.; writing—review and editing, G.D.F. and P.C.; supervision, G.D.F. and P.C. All authors have read and agreed to the published version of the manuscript.

Funding

This research received no external funding.

Data Availability Statement

The data presented in this study are available in the article.

Conflicts of Interest

The authors declare no conflict of interest.

List of Abbreviations Used

AbbreviationDefinition
APVAgrivoltaic System.
CAPEXCapital Expenditure, in EUR.
CISCopper Indium Selenide solar cell.
dPV module efficiency degradation, %/yr.
EcExtra cost, in EUR/ha∗yr.
GPhotovoltaic power plant capacity, in Watts.
GMPVGround-Mounted Photovoltaic System.
GWGigawatt.
GWhGigawatt∗hour.
haHectare.
iInflation, in %.
LCOELevelised Cost of Energy in EUR/kWh.
NPV plant operating lifetime, in years.
NPVNet Present Value, in EUR.
NRRPNational Recovery and Resilience Plan.
OPEXOperational Expenditure, in EUR.
pbPerformance benefit, in EUR/ha∗yr.
pprPrice–performance ratio.
PVPhotovoltaic.
VAPValue of Agricultural Production, in EUR/ha.
WDCWatt in continuous current regime.
WACCWeighted Average Cost of Capital, in %.

References

  1. Bolinger, M.; Bolinger, G. Land Requirements for Utility-Scale PV: An Empirical Update on Power and Energy Density. IEEE J. Photovolt. 2022, 12, 589–594. [Google Scholar] [CrossRef]
  2. PV-Magazine. Available online: https://www.pv-magazine.com/2022/01/18/italys-largest-solar-park-changes-hands (accessed on 20 January 2023).
  3. Levelized Cost of Energy Levelized Cost of Storage and Levelized Cost of Hydrogen. Available online: https://www.lazard.com/perspective/levelized-cost-of-energy-levelized-cost-of-storage-and-levelized-cost-of-hydrogen/ (accessed on 11 November 2022).
  4. PV-Magazine. Available online: https://www.pv-magazine.com/2021/09/09/the-worlds-largest-solar-power-plants/ (accessed on 31 January 2023).
  5. Latia Agribusiness Solutions. 24 February 2022. Available online: https://www.flickr.com/photos/icraf/51938434312/in/photostream (accessed on 20 January 2023).
  6. Goetzberger, A.; Zastrow, A. On the Coexistence of Solar-Energy Conversion and Plant Cultivationy. Int. J. Sol. Energy 1982, 1, 55–69. [Google Scholar] [CrossRef]
  7. Campiotti, C.A. Tecnologie per la Sostenibilità ed il Risanamento Ambientale. 2014, pp. 5–6. Available online: https://iris.unipa.it/bitstream/10447/91330/1/DOTTORATO_campiotti (accessed on 31 January 2023).
  8. Gorjian, S.; Bousi, E.; Özdemir, Ö.E.; Trommsdorff, M.; Manoj Kumar, N.; Anand, A.; Kant, K.; Chopra, S.S. Progress and challenges of crop production and electricity generation in agrivoltaic systems using semi-transparent photovoltaic technology. Renew. Sustain. Energy Rev. 2022, 158, 112126. [Google Scholar] [CrossRef]
  9. Trommsdorff, M.; Kang, J.; Reise, C.; Schindele, S.; Bopp, G.; Ehmann, A.; Weselek, A.; Högy, P.; Obergfell, T. Combining food and energy production: Design of an agrivoltaic system applied in arable and vegetable farming in Germany. Renew. Sustain. Energy Rev. 2021, 140, 110694. [Google Scholar] [CrossRef]
  10. Willockx, B.; Lavaert, C.; Cappelle, J. Development of a quick-scan webtool to facilitate agrivoltaic system design. In Proceedings of the International Conference on Renewable Energies and Smart Technologies (REST), Tirana, Albania, 28–29 July 2022; pp. 1–5. [Google Scholar] [CrossRef]
  11. Fortes, R.; del Henar Prieto, M. Solar Radiation Effect on Crop Production. In Solar Radiation; Chapter 11; Babatunde, E.B., Ed.; IntechOpen: London, UK, 2012. [Google Scholar] [CrossRef] [Green Version]
  12. Demetriades-Shah, T.H.; Fuchs, M.; Kanemasu, E.T.; Flitcroft, I.D. Further discussions on the relationship between cumulated intercepted solar radiation and crop growth. Agric. For. Meteorol. 1994, 68, 231–242. [Google Scholar]
  13. Trommsdorff, M.; Sweta Dhal, I.; Özdemir, Ö.E.; Ketzer, D.; Weinberger, N.; Rosch, C. Agrivoltaics: Solar power generation and food production. In Solar Energy Advancements in Agriculture and Food Production Systems; Chapter 5; Gorjian, S., Campana, P.E., Eds.; Academic Press: London UK, 2022; pp. 159–210. [Google Scholar]
  14. Chalgynbayeva, A.; Gabnai, Z.; Lengyel, P.; Pestisha, A.; Bai, A. Worldwide Research Trends in Agrivoltaic Systems—A Bibliometric Review. Energies 2023, 16, 611. [Google Scholar] [CrossRef]
  15. Linee Guida Impianti Agrivoltaici. Available online: https://www.mite.gov.it/sites/default/files/archivio/allegati/PNRR/linee_guida_impianti_agrivoltaici.pdf (accessed on 7 December 2022). (In Italian)
  16. Agri-Photovoltaic Systems: Requirements for Primary Agricultural Use. Available online: https://www.beuth.de/de/technische-regel/din-spec-91434/337886742 (accessed on 7 December 2022).
  17. Label Agrivoltaïque–AFNOR Certification. Available online: https://certification.afnor.org/energie/label-agrivoltaique-positif (accessed on 31 January 2023).
  18. NEDO. Guidelines for the Design and Construction of Agricultural Solar Power Plants—2021 Edition. Available online: https://www.nedo.go.jp/content/100939011.pdf (accessed on 13 March 2023). (In Japanese).
  19. Al Mamun, M.A.; Dargusch, P.; Wadley, D.; Zulkarnain, N.A.; Aziz, A.A. A review of research on agrivoltaic systems. Renew. Sustain. Energy Rev. 2022, 161, 112351. [Google Scholar] [CrossRef]
  20. Jung, D.; Gareis, G.H.; Staiger, A.; Salmon, A. Effects of soiling on agrivoltaic systems: Results of a case study in Chile. AIP Conf. Proc. 2022, 2635, 020001. [Google Scholar] [CrossRef]
  21. Kelsey, H.; Ramasamy, V.; Macknick, J.; Margolis, R. Capital Costs for Dual-Use Photovoltaic Installations: 2020 Benchmark for GroundMounted PV Systems with Pollinator-Friendly Vegetation, Grazing, and Crops. Golden, CO: National Renewable Energy Laboratory. NREL/TP-6A20-77811; 2020. Available online: https://www.nrel.gov/docs/fy21osti/77811.pdf (accessed on 7 December 2022).
  22. Alam, H.; Alam, M.A.; Butt, N.Z. Techno Economic Modeling for Agrivoltaics: Can Agrivoltaics Be More Profitable Than Ground Mounted PV? IEEE J. Photovolt. 2022, 13, 174–186. [Google Scholar] [CrossRef]
  23. Daniels, T. The development of utility-scale solar projects on US agricultural land: Opportunities and obstacles. Socio Ecol. Pract. Res. 2023. [Google Scholar] [CrossRef]
  24. Agostini, A.; Colauzzi, M.; Amaducci, S. Innovative agrivoltaic systems to produce sustainable energy: An economic and environmental assessment. Appl. Energy 2021, 281, 116102. [Google Scholar] [CrossRef]
  25. Italy’s Recovery and Resilience Plan. Available online: https://commission.europa.eu/business-economy-euro/economic-recovery/recovery-and-resilience-facility/italys-recovery-and-resilience-plan_en (accessed on 13 March 2023).
  26. Schindele, S.; Trommsdorff, M.; Schlaak, A.; Obergfell, T.; Bopp, G.; Reise, C.; Braun, C.; Weselek, A.; Bauerle, A.; Högy, P.; et al. Implementation of agrophotovoltaics: Techno-economic analysis of the price-performance ratio and its policy implications. Appl. Energy 2020, 265, 114737. [Google Scholar] [CrossRef]
  27. European Commission. Guide to Cost-Benefit Analysis of Investment Projects: Economic Appraisal Tool for Cohesion Policy 2014–2020; European Commission: Brussels, Belgium, 2014. [CrossRef]
  28. Gorjian, S.; Ebadi, H.; Jathar, L.D.; Savoldi, L. Solar energy for sustainable food and agriculture: Developments, barriers, and policies. In Solar Energy Advancements in Agriculture and Food Production Systems; Chapter 5; Gorjian, S., Campana, P.E., Eds.; Academic Press: London, UK, 2022; pp. 1–23. [Google Scholar]
  29. Mančić, M.; Živković, D.; Vukadinović, B.; Ćosović, A. Techno-economic optimization of energy supply of a livestock farm. Facta Univ. Ser. Work. Living Environ. Prot. 2015, 12, 199–216. [Google Scholar]
  30. Aroonsrimorakot, S.; Laiphrakpam, M. Application of solar energy technology in agricultural farming for sustainable development: A review article. Int. J. Agric. Technol. 2019, 15, 685–692. [Google Scholar]
  31. A Manual for the Economic Evaluation of Energy Efficiency and Renewable Energy Technologies. Available online: https://www.nrel.gov/docs/legosti/old/5173.pdf (accessed on 7 December 2022).
  32. Branker, K.; Pathak, M.; Pearce, J.M. A review of solar photovoltaic levelized cost of electricity. Renew. Sustain. Energy Rev. 2011, 1, 4470–4482. [Google Scholar] [CrossRef] [Green Version]
  33. Campbell, M. Levelized Cost of Energy for Utility-Scale Photovoltaics. In Solar Cells and Their Applications; Wiley: Hoboken, NJ, USA, 2010; pp. 251–270. [Google Scholar]
  34. Vartiainen, E.; Masson, G.; Breyer, C.; Moser, D.; Román Medina, E. Impact of weighted average cost of capital, capital expenditure, and other parameters on future utility-scale PV levelised cost of electricity. Prog. Photovolt. Res. Appl. 2020, 28, 439–453. [Google Scholar] [CrossRef] [Green Version]
  35. IEA-PVPS; IRENA. Photovoltaic Power Systems Programme of the International Energy Agency and International Renewable Energy Agency. End-of-Life Management; Solar Photovoltaic Panels, Report T12-06:2016, IEA PVPS, St Ursen. 2016; Available online: https://www.irena.org/-/media/Files/IRENA/Agency/Publication/2016/IRENA_IEAPVPS_End-of-Life_Solar_PV_Panels_2016.pdf (accessed on 20 January 2023).
  36. Delibera 23 Dicembre 2021 614/2021/R/comARERA. Available online: https://www.arera.it/it/docs/21/614-21.htm# (accessed on 20 January 2023).
  37. Lifetime of PV Panels. Available online: https://www.nrel.gov/state-local-tribal/blog/posts/stat-faqs-part2-lifetime-of-pv-panels.html#:~:text=NREL%20research%20has%20shown%20that,climates%20and%20for%20rooftop%20systems (accessed on 20 January 2023).
  38. Di Francia, G. The impact of recycling policies on the photovoltaic Levelized Cost of the Electricity. In Proceedings of the International Conference on Renewable Energy Research and Applications (ICRERA), Madrid, Spain, 20–23 October 2013; pp. 979–983. [Google Scholar] [CrossRef]
  39. Istat. Preliminary Estimate of the Economic Accounts of Agricoluture Year 2020. Statistiche Report 2021. Roma. Available online: https://www.istat.it/it/files//2021/01/Report-Stima-preliminare-agricoltura-EN.pdf (accessed on 12 December 2022).
  40. Crea. Annuario Dell’agricoltura Italiana 2020; Consiglio per la Ricerca in Agricoltura e l’analisi Dell’economia Agraria; Centro di Ricerca Politiche e Bio-Economia: Rome, Italy, 2021; Volume LXXVI. [Google Scholar]
  41. Pointereau, P.; Coulon, F.; Girard, P.; Lambotte, M.; Sanchez Ortega, V.; Del Rio, A. Analysis of Farmland Abandonment and the Extent and Location of Agricultural Areas that are Actually Abandoned or are in Risk to be Abandoned. In EUR—Scientific and Technical Research Reports; OPOCE: Luxembourg, 2008. [Google Scholar]
  42. Hatna, E.; Bakker, M.M. Abandonment and Expansion of Arable Land in Europe. Ecosystems 2011, 14, 720–731. [Google Scholar] [CrossRef] [Green Version]
  43. Levers, C.; Schneider, M.; Prishchepov, A.V.; Estel, S.; Kuemmerle, T. Spatial variation in determinants of agricultural land abandonment in Europe. Sci. Total Environ. 2018, 644, 95–111. [Google Scholar] [CrossRef]
  44. Sluiter, R.; de Jong, S.M. Spatial patterns of Mediterranean land abandonment and related land cover transitions. Landsc. Ecol. 2007, 22, 559–576. [Google Scholar] [CrossRef]
  45. Hart, K.A.; Allen, B.; Lindner, M.; Keenleyside, C.; Burgess, P.; Eggers, J.; Buckwell, A. Land as an Environmental Resource. In Report Prepared for DG Environment, Contract No. ENV.B.1/ETU/2011/0029; Institute for European Environmental Policy: London, UK, 2013. [Google Scholar]
  46. Il Pniec e il Piano per la Transizione Ecologica. Available online: https://www.camera.it/leg17/561?appro=la-proposta-italiana-di-piano-nazionale-per-l-energia-e-ilclima#:~:text=La%20generazione%20di%20energia%20elettrica,95%2D100%25%20nel%202050 (accessed on 20 January 2023).
  47. La Regione fa un Ulteriore Passo in Avanti per Distribuire i Terreni Agricoli Incolti ai Giovani. Available online: https://argav.wordpress.com/2015/02/17/la-regione-fa-un-ulteriore-passo-in-avanti-per-distribuire-i-terreni-agricoli-incolti-ai-giovani/ (accessed on 13 December 2022).
  48. De Rubertis, S. Dinamiche insediative in Italia: Spopolamento dei comuni rurali. Perspect. Rural Dev. 2019, 2019, 71–96. [Google Scholar]
  49. Amodio, T. Territories at risk of abandonment in Italy and hypothesis of repopulation. Belgeo. Revue Belge Géographie 2022, 4, 57229. [Google Scholar] [CrossRef]
  50. Makoto, T.; Iida, T. Evolution of agrivoltaic farms in Japan. AIP Conf. Proc. 2021, 2361, 030002. [Google Scholar]
  51. Shimazaki, Y. Agrivoltaic Potential of Abandoned Farmlands in the National Capital Region of Japan. J. Jpn. Soc. Energy Resour. 2021, 42, 93–97. [Google Scholar]
  52. Walston, L.J.; Barley, T.; Bhandari, I.; Campbell, B.; McCall, J.; Hartmann, H.M.; Dolezal, A.G. Opportunities for agrivoltaic systems to achieve synergistic food-energy-environmental needs and address sustainability goals. Front. Sustain. Food Syst. 2022, 6, 1–13. [Google Scholar] [CrossRef]
  53. Sekiyama, T.; Nagashima, A. Solar sharing for both food and clean energy production: Performance of agrivoltaic systems for corn, a typical shade-intolerant crop. Environments 2019, 6, 65. [Google Scholar] [CrossRef] [Green Version]
  54. Designing Agrivoltaics for Sustainably Intensifying Food and Energy Production, U.S. Department of Agriculture SCAPES Study. Available online: https://cris.nifa.usda.gov/cgi-bin/starfinder/0?path=fastlink1.txt&id=anon&pass=&search=R=94424&format=WEBLINK (accessed on 13 December 2022).
Figure 1. The largest Italian fixed-tilt ground-mounted utility photovoltaic plant. The 103 MW solar park is in Troia, Puglia, in an area previously dedicated to cropland activities. It was completed in 2021 and installed over an area of about 150 hectares with a power density of about 70 W/m2. Photo courtesy granted by PV Magazine [2].
Energies 16 02991 g001
Figure 2. An image of a ground-mounted, fixed, overhead agrivoltaic system. The system is structured so that PV modules are, in general, separated enough from each other and sufficiently far from the ground to minimize shadowing effects. Photo courtesy granted under creative commons license by: Stacey Kihiu/ICRAF [5].
Energies 16 02991 g002
Figure 3. Agrivoltaic systems are characterized by large combinations of possible PV technical solutions (type of modules, mounting structures, etc.) and possible different uses of the land, such as grassland farming, arable farming, etc.). The general classification scheme above-reported is extracted from Ref. [8].
Energies 16 02991 g003
Figure 4. A schematic of the PV installations. (a) A schematic of the available 2.5 ha cropland area (upper image) and of its actual implementation (lower image); (b) the APV plant installed over the whole 2.5 ha available land assuming a power density of 40 W/m2 (upper) and its actual implementation (lower); (c,d) different equivalent structures of the GMPV plant where a power density of 80 W/m2 has been assumed.
Energies 16 02991 g004
Figure 5. The ppr values calculated for the case of the potato crops in various Italian regions, assuming β = 2, a particularly optimistic value. Only in Veneto, Campania, Puglia, Sicilia, and Sardegna, could APV implementation be considered economically sustainable with respect to GMPV plants, even for such a high-revenue crop activity.
Energies 16 02991 g005
Figure 6.   Δ N P V = N P V A P V N P V G M P V , for β = 3.5 and for some valus of VAP. Only values higher than 20.000 EUR/ha make this difference positive.
Energies 16 02991 g006
Figure 7. Abandoned cropland in the north of Italy from Ref. [47].
Energies 16 02991 g007
Table 1. Area-related capex costs for large GMPV plants. Data in this table and used for this investigation have been obtained by interviewing Italian PV operators and are related to September 2022.
Capex/Type of Cost EUR/ha
Italian Operators
EUR/ha
Ref. [26]
EUR/ha
Ref. [13]
Mounting structures and hardware120,00038,00092,000
Site preparation and installation88,000101,00090,000
Fencing12,00070006000
Total220,000146,000188,000
Table 2. Annual Values of the Agricultural Production for several extensive crops at the regional level in Italy (Elaborations by Crea on Istat data).
RegionDurum Wheat (EUR/ha)Common Wheat (EUR/ha)Corn (EUR/ha)Sunflower (EUR/ha)Soybean (EUR/ha)Potato (EUR/ha)
Piemonte1531.16963.962300.08671.12980.2114,427.52
Valle D’Aosta 4453.85
Lombardia1723.141089.572362.22828.561198.6613,214.29
Liguria 490.68904.76 8494.41
Trentino Alto Adige 757.28906.25 13,865.51
Veneto2118.811207.842129.48762.871099.1825,068.38
Friuli Venezia Giulia5022.47765.952276.58811.821011.1717,920.63
Emilia Romagna2118.251196.761902.97678.791352.2021,004.38
Toscana1362.31715.031574.61527.71679.869861.41
Umbria1622.47904.381544.86417.361500.006375.00
Marche1576.10907.361482.97498.68998.059306.57
Lazio915.65740.851876.14433.86625.0014,826.93
Abruzzo1405.05746.721591.84464.041022.7318,206.03
Molise1345.43725.29841.38404.76 6576.19
Campania1253.29703.001408.02544.91 28,188.95
Puglia976.99506.331136.90430.61 31,650.94
Basilicata1080.37509.93883.07469.39 9285.71
Calabria975.95565.61836.10500.00750.0014,755.99
Sicilia988.57512.821240.00 53,961.69
Sardegna917.52399.251761.30 62,837.94
Disclaimer/Publisher’s Note: The statements, opinions and data contained in all publications are solely those of the individual author(s) and contributor(s) and not of MDPI and/or the editor(s). MDPI and/or the editor(s) disclaim responsibility for any injury to people or property resulting from any ideas, methods, instructions or products referred to in the content.

