Abstract
The purpose of the article is to analyse the level of energy poverty in the EU member states for the period 2010–2020. The research was carried out on the basis of the author’s Synthetic Multidimensional Energy Poverty Index created on the basis of the zero-unitarization method. The proposed index allowed for the integration of 4 out of 13 indicators provided for the study of energy poverty in the Recommendation of the European Commission 2020, and 1 selected by the authors. The assessment of changes in the level of energy poverty over time in 24 EU countries using the method used adds value compared to the assessment methods used so far in this area. Previous studies of energy poverty levels have focused on individual countries or small groups of countries. Rarely have such studies covered the majority of EU countries, and even more rarely have they been conducted over a long period of time. The study carried out showed significant differences in energy poverty levels among EU members. Results obtained not only reflect the progress of member countries in reducing energy poverty, but also allow for a discussion on future approaches regarding its reduction.
1. Introduction
Energy poverty is a significant social challenge that hinders social inclusion and limits the ability of EU citizens to actively participate in and benefit from the green energy transition. The European Commission’s 2021 State of the Energy Union [1] report shows that as of 2019/2020, some 31 million people were affected by energy poverty. Among the population affected by energy poverty, 7.5% were unable to keep their home adequately warm by poverty status, and 6.3% had arrears on utility bills [2]. However, it should be remembered that the lack of a common definition of energy poverty makes it difficult to assess the scale of the problem, and the estimated number living in energy poverty population may be underestimated. For example, the Commission’s Joint Research Center calculated in 2019 that 50 million people live in energy poverty, nearly 20 million more than the cited report. Myers [3,4] warned that the number could rise to 80 million, due to the current energy price crisis associated with, among other things, the phasing out of fossil fuel energy in the face of global warming, combined with the impact of COVID-19. The number of energy poor may also increase as a result of the situation created by Russia’s war with Ukraine.
There is no uniform, mandatory definition of energy poverty. Until 2018, it was understood as a problem with maintaining an adequate (comfortable) temperature in the house/apartment, mainly for financial reasons. It is only in the regulation (EU) 2018/1999 on the Governance of the Energy Union and Climate Action [5] that there was, for the first time, a formal provision that “Member states should estimate the number of households suffering from energy poverty, taking into account the necessary household energy services needed to guarantee a basic standard of living in the national circumstances.” The current/extended definition of energy poverty is provided in the Commission Recommendation of 14 October 2020 on energy poverty [6]. The recommendation states, “energy poverty is a situation where households do not have access to basic energy services, such as adequate heating, cooling, lighting and energy to power appliances, which underpin a decent standard of living and health. Access to energy services is essential for social inclusion”.
Energy poverty occurs where there is a combination of three factors contributing to it: low-income levels (the economic situation), inadequate building quality/low energy efficiency of housing (poor technical condition) and high energy prices. The synergy of the impact of these three factors on poverty levels was reinforced by the COVID-19 pandemic, which led to increased unemployment, reduced household incomes and increased demand for energy, thereby contributing to the deepening of energy poverty. In such a situation, actions/policies aimed at reducing energy poverty, both at the EU level and at the level of individual member states, become even more important than before. Proper targeting of these actions/policies requires, among other things, operationalizing the measurement of energy poverty. Hence, the importance of improving the ways in which this phenomenon is measured.
Traditionally, energy poverty has been measured by a set of unidimensional indicators identifying, among other things, the nature and type of household and the energy source they use [7]. For example, Akpalu et al. [8], Mensah and Adu [9] and Karimu [10] examined households’ choices of cooking fuel in Ghana. While these indicators have many advantages in terms of data collection, monitoring and commensurability, and are favored by the EU [11,12], they unfortunately do not capture the full scope of the problem and are not collected directly to assess energy poverty. Thomson et al. [13] also believes that unidimensional/statistical indicators of energy poverty have great political weight and are often used to guide measures of energy poverty, but in the multidimensional space they are insufficient to fully interpret it. Herrero [14] even opposes official single indicators of energy poverty, such as low cost and high income, and advocates multidimensional indicators. Moreover, unidimensional indicators are primarily collected at the national level, in line with existing European arrangements. Their purpose is to obtain comparable data between member states, rather than to capture local realities and contexts in individual countries. Consequently, they do not allow for a more nuanced approach to the spatial scale and diversity of conditions [15]. According to Aristondo and Onainado [16] and Okushima [17], household energy poverty is a multidimensional concept encompassing two distinct aspects—availability and affordability. It is therefore necessary to measure energy poverty using multidimensional/synthetic indicators consisting of unidimensional indicators that capture simultaneous deprivations due to accessibility and affordability [7]. Many examples of multidimensional measures of energy poverty can be found in the literature. Different indicators illustrate aspects of this poverty, but there is no consensus on which one is best and how to integrate them [18]. The synthetic multidimensional indicator for assessing the level of energy poverty proposed and used by the authors is a voice in the ongoing discussion. The proposed indicator not only allows for the measurement of energy poverty and its analysis over time, but also allows for the use of available unidimensional statistical indicators collected by Eurostat (in the case of the EU). A synthetic indicator captures the multidimensionality of the energy poverty problem. It overcomes the shortcomings and inadequacies of unidimensional indicators. At the same time, it provides a score that condenses information into single, easily interpretable values. The advantage of the proposed indicator is that publicly available variables, reported annually by Eurostat, are used for its calculation. This determines the objectivity and comparability of results between countries. At the same time, the use of publicly available data makes the proposed indicator usable in that the indicator can be used to monitor energy poverty units at different levels of the economy. The previously cited synthetic indicators created by other authors often use data reported less frequently than annually, or data of a subjective nature obtained for a given country/region for the purpose of ongoing research, for example, through surveys. This not only limits the possibility to determine the value of such indicators over many years, but also to use them for international comparisons.
The 14 October 2020 Commission (EU) [6] recommendation on energy poverty published a list of 13 indicators (7 focusing on the affordability of energy services and 6 complementary indicators) set for monitoring the level of energy poverty. The indicators are as follows:
- (1)
- Share of population at risk of poverty (below 60% of national median equivalised disposable income) not able to keep their home adequately warm;
- (2)
- Share of total population not able to keep their home adequately warm;
- (3)
- Arrears on utility bills: share of population at risk of poverty (below 60% of national median equivalised disposable income) having arrears on utility bills;
- (4)
- Arrears on utility bills: share of population having arrears on utility bills;
- (5)
- Expenditure on electricity, gas and other fuels as a proportion of total household expenditure;
- (6)
- Proportion of households whose share of energy expenditure in income is more than twice the national median share;
- (7)
- Share of households whose absolute energy expenditure is below half the national median;
- (8)
- Electricity prices for household consumers—average consumption band;
- (9)
- Gas prices for household consumers—average consumption band;
- (10)
- Gas prices for household consumers—lowest consumption band;
- (11)
- Share of population at risk of poverty (below 60% of national median equivalised disposable income) with leak, damp or rot in their dwelling;
- (12)
- Share of population with leak, damp or rot in their dwelling—total population;
- (13)
- Final energy consumption per square metre in the residential sector, climate corrected.
Most of these indicators (except two) are reported by Eurostat. Unfortunately, some of them are reported every few years. For this reason, four of the recommended indicators for which full data were available for the adopted research period were adopted for the study. In addition, one of the indicators was adopted in a modified form. The indicator of final energy consumption, measured per square meter in the residential sector with adjustment for climatic conditions, was replaced due to limited data availability by the indicator of final energy consumption in households per capita. The variables adopted for the calculations represent, the previously mentioned groups of factors affecting the level of energy poverty and correspond to the previous and current definition of this phenomenon. Thus, it can be said that they allow/ensure the comparability of the level of energy poverty over the study period despite the modification of its definition.
Energy poverty is closely related to the phenomenon of poverty, the reduction in which was one of the most important goals of the Europe 2020 Strategy. The document, in force from 2010 to 2020, introduced a new type of growth—smart, sustainable and inclusive—to determine the EU’s long-term aspirations. It set out a number of measurable targets for 2020, among which social objectives were prominent. To monitor the targets, for the first time, numerical indicators were established to compare countries’ achievements in this regard. Due to the end of its period of validity, it is worth checking what achievements EU countries have in reducing the level of energy poverty after 10 years. Its reduction has a positive impact on achieving the social objective of the Europe 2020 strategy. Hence, the purpose of the article is to assess the changes in the level of energy poverty in 24 EU member states between 2010 and 2020. The article attempts to answer two research questions
- What are the main determinants of energy poverty in EU countries?
- Are there significant differences in the level of energy poverty between EU countries?
In the article, synthetic multidimensional index with application of zero-unitarization method was used, which allows a synthetic assessment of EU countries according to the level of energy poverty, and analysis of changes in the studied phenomenon over time. This method allows the integration of indicators recommended by the EU Commission for monitoring energy poverty [6], reported by Eurostat [2], and an indicator additionally selected for this analysis by the authors—which is an expansion of the previously used set of variables for this purpose. It should be noted that the assessment of changes in the level of energy poverty in 24 EU countries over time using the method used represents an added value compared to the evaluation methods used so far in this area. Typically, the level of energy poverty has been studied on a country-by-country basis (e.g., Faiella and Lavecchia studied energy poverty in Italy [19], Legendre and Ricci in France [20], and Sokolowski et al. [18] or EU regions (e.g., Karpińska and Śmiech [21] analysed invisible energy poverty in central and eastern Europe), at a specific point in time. Additionally, studies rarely looked at long periods of time. Comparative studies of this type were carried out by Healy [22] and Thomson and Snell [23] for the years 1994–1997, Bouzarovski and Herrero [24] for the years 2003–2013, Karpińska and Śmiech [25] for the years 2014–2018, Tundys et al. [26] for the years 2011–2019 and Halkos and Gkampoura [27,28] for the years 2004–2019. To the knowledge of the authors, this article is the first comparative analysis assessing changes in the level of energy poverty among EU member states throughout the period of validity of the Europe 2020 Strategy, and taking into account the analysis of the dynamics of these changes over time. Thus, the article also responds to the postulate of Huang, Ming and Duan [29], who point to the lack of literature on the evolution of energy poverty in different countries, taking into account longer time series. In addition, the article also has the added value of obtaining additional information on the internal structure and characteristics of energy poverty in EU countries. The analysis showed significant variation in the level of energy poverty among EU members. The results obtained (in the form of an aggregate index) reflect not only changes in the level of energy poverty, but also fit into the discussion of how to reduce it in the context of existing social and climate-energy policy goals. On the basis of the results obtained, the EU countries were divided into four groups with similar levels of energy poverty and ranked using a synthetic indicator according to changes in its level over time. This makes it possible not only to assess the performance of countries, but also to formulate recommendations for policymakers. The remainder of the article includes the following sections: a synthetic review of EU documents on energy poverty and the literature on its measurement, a description of the research methodology, a presentation of the results of two stages of research for 24 EU countries. The article concludes with a summary containing the conclusions of the analysis, answers to the questions posed, and recommendations/suggestions for further research activities/directions.
2. Documents and Literature Review
2.1. Documents Review
The European Union is increasingly focusing on energy poverty in its policy efforts by increasing its work to effectively reduce the problems as part of energy efficiency, decarbonization of the economy and a clean and fair energy transition [15]. These activities are accompanied by regulations on energy poverty and energy vulnerability [30], which are presented in chronological order in Table 1. The review of the documents presented in Table 1 illustrates not only the growing importance of the issue of fuel poverty and the work being undertaken to minimise it, but also, among other things, the evaluation of the concept and the indicators proposed for its measurement. Moreover, the review shows that member states have a certain degree of freedom, both in defining energy poverty and in choosing indicators to measure it. This goes some way to justifying the choice of indicators adopted for the study in the article.

Table 1.
Key EU regulations on energy poverty and vulnerability.
In the context of the above review of legislation, it can be said that proper targeting of policies and reduction in energy poverty requires, as already mentioned, operation-alization of energy poverty measurement. Therefore, the article attempts to estimate changes in the level of energy poverty in EU member states between 2010 and 2020.
2.2. Literature Review
The phenomenon of households energy poverty is multidimensional, and it is necessary to measure it with multidimensional indicators. This article presents only selected examples of current research that, according to the authors, is important for the observation of energy poverty.
The main objective of the literature review was to identify a research gap in the study of energy poverty for all countries in the European Union, taking into account long time series and simple synthetic indicators using yearly published statistics, corresponding to the recommendations of the European Commission. Achieving this objective required an analysis of the literature, taking into account various criteria. Five criteria were applied in the analysis of the existing literature, as outlined below.
Group 1. Research gap criterion indicating the paucity of energy poverty studies for the European Union as a whole with simple synthetic indicators over a long period.
Group 2. Criterion due to the data source used in the study.
Group 3. Criterion due to the methods and tools used in the study.
Group 4. Criterion for variables—to allow justification of the variables adopted for the study.
Group 5. Comparative criterion—to allow for a possible comparison of the results of the energy poverty assessment over time or in relation to individual EU member states.
It should be noted that most of the papers reviewed met more than one criterion for the selection of literature.
Group 1. Research gap criterion indicating the paucity of energy poverty studies for the European Union as a whole with simple synthetic indicators over a long period.
An analysis of the existing literature on the subject shows that energy poverty studies focus on individual countries, a group of several countries or selected regions. Rarely does research on energy poverty involve a simultaneous analysis of a larger group of EU countries. A number of papers are dedicated to the study of energy poverty in developing countries, where the scale of the problem of energy poverty is much wider than in the EU [42,43,44,45,46,47,48,49,50,51]. Rarely does research on energy poverty involve a simultaneous analysis of a larger group of EU countries.
Studies concerning only one country were conducted, among others, by the following:
- Aristondo and Onaindia [52] examined inequalities between household groups in terms of energy poverty values in Spain in four selected years. They analysed different classifications of households, taking into account the type of building, ownership and members of the household, as well as characteristics of the main breadwinner. They demonstrated the inequality of fuel poverty scores between groups for each characteristic and the expansion of poverty over the period studied.
- Faiella and Lavecchia [19,53] have studied energy poverty in Italy. Back in 2012, they developed an index to measure it based on qualitative criteria—the low-income/high-cost index, which was modified to include economically vulnerable households without heating expenses. Based on it, they found that the percentage of households in energy poverty was essentially stable between 1997 and 2012 (about 8%). After a few years, they introduced a new measure of energy poverty independent of household preferences, taking into account heating expenditures needed to achieve a minimum level of comfort. According to the new measure, the percentage of energy-poor households in 2014–2016 was 11.7% [53], so it was more than 3 p.p. higher than before. The new indicator was considered more precise, which influenced its adoption by the government as the official measure of energy poverty in Italy.
- Sokołowski et al. [18] studied energy poverty in Poland in 2017, assuming that it affects 10% of households. They developed a multidimensional index that included five dimensions of energy deprivation: three subjective indicators (“housing defects”, “insufficiently warm home,” “difficulties with bills”) and two objective indicators (“high actual costs” and “low income, high costs” (LIHC)).
- Legendre and Ricci [20] studied energy poverty in France. They challenged the existing way of measuring energy poverty by comparing the impact of three different measurement approaches (the “10% ratio approach”, “the after-fuel cost poverty approach”, and the “Hills’ approach” (Low Income–High Costs indicator) on the extent and composition of energy poverty in France. They identified households at risk of energy poverty simply because of fuel expenses, which they called “energy insecurity”/”fuel insecurity”/“energy precariousness” or “fuel precariousness”.
- Scarpellini et al. [54,55] studied energy poverty in Spain according to territorial criterion, taking into account the economic and financial dimensions of the measures in place to support its reduction.
- Sánchez et al. [56] also conducted a study of energy poverty in Spain. They set themselves the goal of defining new temperature thresholds for the country so as to set a minimum energy demand and achieve minimum living conditions. In contrast, Phimister et al. [57] studied the impact of taxes on energy poverty in Spain between 2007 and 2010.
- Karpińska and Śmiech [58] examined the long-term interactions between energy poverty and poverty in Poland between 2014 and 2017, using subjective indicators of energy poverty and poverty. They found that energy poverty in Poland is a transitional state from which it is difficult for the poor to recover.
Studies of energy poverty of groups of countries or selected regions of the EU were conducted by the following, among others:
- Kyprianou et al. [59] examined the history of energy poverty mitigation efforts, policies and instruments in five EU countries in the context of their evolution at the EU level. They took into account the different geographic dimensions, conditions and aspects (e.g., national or regional) in which energy poverty occurs, trying to identify any differences or similarities in the approaches taken. Through comparative analysis, they identified the strengths and weaknesses of national policies and ranked energy poverty mitigation measures in selected countries. In their research, they used statistical-descriptive analysis and inductive-deductive methods. These are easier to apply, but with a larger survey sample (due to some subjectivity in interpretation) they can be less precise than taxonomic/econometric methods.
- Papada and Kaliampakos [60,61] addressed the issue of vulnerability to energy poverty of households in Greece’s mountainous regions compared to the national level. They developed a “Vulnerability Index”/Vulnerability Index for Energy Poverty, which quantifies the vulnerability of a population to this phenomenon compared to a reference population based on stochastic analysis. They used the previously announced “Stochastic Model for Energy Poverty”, as it allows for more accurate estimates of energy poverty in the population. The sensitivity analysis conducted, combined with Pareto analysis, showed regional differences and the specific impact of various parameters on the problem of energy poverty, through the use of weighting factors. Papada and Kaliampakos’ novel approach to the Vulnerability Index for Energy Poverty provides a potential way to identify populations with unmet energy needs. The methodology they proposed could make it easier to provide support to population groups more prone to energy poverty. However, its application to international comparisons may be problematic, for countries do not use identical sets of parameters to measure energy poverty, which would make it difficult to assign weights to them in a way that ensures comparability with Papada and Kaliampakos.
- Karpińska and Śmiech [21] took a comprehensive approach to determining the magnitude of exposure to hidden energy poverty in the populations in 11 countries of central and eastern Europe in 2017. They were the first to use indicators based on household expenditures to measure this poverty between countries. They estimated the level of household energy scarcity using cross-sectional EU-SILC micro-level data.
- Stojilovska et al. [62] focused on the coping strategies of energy poor or energy vulnerable households in cities with different levels of energy poverty in the following countries: France, Spain, Austria and North Macedonia. This was a qualitative study based on case studies. The authors emphasised in their conclusions that they see the lived experiences of energy vulnerable people as a key opportunity to assess the inequalities shaping energy poverty. The study is relevant, but the method used in the study can hardly be seen as facilitating comparisons of changes in poverty levels.
- Sokolowski et al.’s [18] methodology of its calculation multidimensional energy poverty indicator, combined with the difficulty of ensuring the continuity of the needed data over the long term, may limit its use for long-term comparative analysis of all EU countries in economic practice.
Group 2 Criterion due to the data source used in the study.
Studies on energy poverty levels vary based on the data source adopted for the study. The most commonly used data sources include the following:
- Surveys developed for the study or in-depth interviews, for example, Hosan et al. [42], Zheng et al. [47], Zhou and Teng [48], Simcock et al. [63], Thomson et al. [64];
- Data from the EU—SILC (the European Union Statistics on Income and Living Conditions) database, for example, Karpińska and Śmiech [21,65], Halkos and Gkampoura [28], Bosch et al. [66] or Thomson and Snell [23];
- Cross-sectional or panel data, for example, by Tundys [26] Halcos and Gkampoura [27,27], Schislyaeva and Saychenko [67] and others [29,41,54,55,56,58,59,60,61].
Group 3 Criterion due to the methods and tools used in the study.
The concept of measuring energy poverty has evolved over the years. The first period was dominated by simple indicators involving an expenditure approach or consensual-based approach. Indicators involving an expenditure approach include the following: the 10% approach [68], AFCP (The After Fuel-Cost Poverty) indicator [69], LIHC (The Low Income–High Cost) indicator [69] and many others. The following list is of consensual-based approach indicators: survey data on lack of heating discomfort; % of households unable to afford to keep their home adequately warm; % of households living in dwellings with a leak in the roof; damp or rot; or Perceived Energy Poverty (PEP)—the number of households that report having financial difficulties in heating their homes sufficiently [70]. For an overview and assessment of the above-mentioned indicators for measuring energy poverty, see Charlier and Legendre [71] and Selecting Indicators to Measure Energy Poverty [70].
Another group consists of measures that take into account the multidimensional aspect of energy poverty. The Multidimensional Energy Poverty Index (MEPI), developed by Nussbaumer et al. [72], should be mentioned first. MEPI and its modifications was used to estimate energy poverty by many researchers, but mostly for analyses conducted outside the Europe [73,74,75].
For European countries, based on the results of the European Union Statistics on Income and Living Conditions (EU-SILC) and cross-sectional or panel data offered by national statistical offices or Eurostat, researchers propose their own multidimensional approaches to measuring energy poverty, using a range of quantitative methods. Bollino and Botti [76], in their analysis of energy poverty in European countries for 2012 and 2014, used the fuzzy set approach. They developed the Energy Poverty Multidimensional Index (EPMI) meeting the conditions of affordability and efficiency. Legendre and Ricci [20] used a logit, a C log–log and a mixed-effect logit model to analyse which factors influence the probability of being energy vulnerable. Based on this analysis, they identified the social groups in France most vulnerable to fuel precariousness. Karpińska and Śmiech [21] investigated energy poverty at a household level in 11 central and eastern European countries. To estimate the expected energy costs, authors introduced a new statistical approach, and they used three estimation approaches, namely the ordinary least squares, lasso and M-estimator (robust regression). Thomson and Snell [23] performed a consensual approach in an EU-wide comparative analysis of fuel poverty, based on proxy indicators of fuel poverty that were conducted using standardised EU-SILC data from 2007. Additionally, they constructed three logistic regression models to predict household inability to pay to keep the home adequately warm, incurring arrears on utility bills and living in a house that has leaks, damp or rot. To examine the interaction between energy poverty and subjective poverty in the long run in 26 European countries, Karpińska and Śmiech [25] applied the Markov process and clustering techniques. Halkos and Gkampoura [27,28] assessed fossil fuels and renewables’ impact on energy poverty using panel data from 28 European countries for the time period 2004–2019. To conduct their analysis, they used static and dynamic regression models, while also performing various econometric tests.
Methods typically used to measure efficiency are also used to study energy poverty levels. For example, a stochastic frontier analysis (SFA) approach was used by Rodriguez-Alvarez et al. [77] to identify the determinants of energy poverty in 30 European countries for the years 2005–2018.
Due to the complexity and multidimensionality of the problem of energy poverty, as well as the regional specificity of this phenomenon, there have recently been works using artificial intelligence (AI) tools. For example, Van Hove et al. [78], based on a dataset from a survey conducted at the household-level in 11 European countries, identify drivers for energy poverty in Europe using machine learning.
Group 4. Criterion for variables—to allow justification of the variables adopted for the study.
- Aristondo and Onaindia [52], who, in measuring energy poverty, used three classic indicators/variables of energy availability—the ability to maintain adequate heat in the home, arrears in utility payments (electricity, water, gas) and the presence of a leaking roof, damp walls or crumpled windows—following the consensus methodology described by Healy [22] and Healy and Clinch [79].
- Karpińska, L. and Śmiech, S. [21] mentioned energy and gas prices among the 16 variables used to measure energy poverty.
- Bouzarovski et al. [80] have analysed the policy actions of individual EU countries to reduce energy poverty, highlighting the issue of appropriate energy and gas pricing for households.
- Streimikiene et al. [81], studying the impact of climate change mitigation policies on energy poverty, found that it is a situation of material deprivation that goes beyond income poverty. Hence, energy and gas prices, which determine the level of energy poverty, must be taken into account.
- Tundys et al. [26], among the 26 variables they listed to measure energy poverty in Europe in the context of achieving the Agenda 2030 targets, listed household energy and gas prices. However, they did not analyse their impact on energy poverty levels.
- Halkos and Gkampoura [28], studying the impact of the economic crisis on energy poverty, noted that an important determinant of the three main indicators affecting this poverty is household electricity prices. In addition, they pointed out the need to take into account the variable presence of leaks, dampness and rot in the dwelling.
- Rodriguez and Alvarez et al. [77] considered energy prices among the 10 variables they looked at when analysing energy poverty.
Although some single variables (mainly energy and gas prices and dampness of the dwelling) were identified in the mentioned works, nowhere did the set of variables coincide with the set adopted in this study. This is because these works concerned the period before the publication of the Commission Recommendation of 14.10.2020 [6] on energy poverty, on which the authors relied.
Group 5. Comparative criterion—to allow for a possible comparison of the results of the energy poverty assessment over time or in relation to individual EU member states.
In the context of the above literature review and the number of thematic publications, it can be said that it is relatively easier to study energy poverty for individual countries or groups of countries, and over shorter periods of time. The multiplicity and diversity of determinants of this phenomenon and other determinants make it difficult to com-pare/assess its level for large groups of countries over long periods. For this reason, there are relatively fewer studies on all EU countries combined. As already mentioned, four such comparative multidimensional studies have been encountered in the literature over a period of more than 20 years. The first large-scale comparative analysis of energy poverty across all EU countries was conducted by Healy [22], and the study covered 14 “old” EU countries between 1994 and 1997. Taking a holistic approach, Healy analysed the relationship between home energy efficiency, energy poverty and health, taking into account a large number of social and economic risk factors to present a large-scale, cross-country, longitudinal analysis. A new (consensus) methodology for calculating levels of energy poverty in various countries was developed, and a detailed econometric/statistical analysis of energy poverty in the EU was presented, taking into account EU housing conditions, affordability and housing satisfaction. In addition, he identified risk factors associated with seasonal fluctuations in mortality in the EU and presented the results of a study of health outcomes associated with energy poverty. He provided surprising new evidence on energy poverty in southern Europe. He concluded that housing, fuel poverty and health are important references for researchers and practitioners in the fields of energy economics, public health, epidemiology, housing and social policy. His work caused other authors to study poverty using multidimensional indicators.
The second was a comparative analysis by Thomson and Snell [23]. They reviewed the prevalence of energy poverty in the EU after the accession of new members and against a backdrop of rising fuel prices (the global financial and economic crisis was still ongoing at the time). The study was conducted in 2011 based on survey data collected for the EU-SILC dataset. It showed that the phenomenon of energy poverty exists throughout the EU. However, it has particularly high levels in eastern and southern European countries. Against this backdrop, they suggested that the EU and national climate policy frameworks could be used as a starting point for addressing energy poverty by improving national instruments to increase energy efficiency.
The third was a comparative study by Bouzarovski and Herrero [24]. They conducted a comprehensive analysis of the spatial and temporal trends of energy poverty in all EU countries, taking into account gas and electricity prices. The study covered the years 2003–2013. In their publication, the starting point for conceptualizing and examining the relationship between energy transitions and existing patterns of regional economic inequality was to assume the existence of a geographic distribution of energy poverty in the EU. They created a descriptive statistical analysis of spatial and temporal patterns of indicators traditionally viewed as indicators of energy poverty, including national energy prices, welfare and deprivation in monetary and material terms. They supplemented the descriptive statistics with a bivariate analysis to identify factors that show a linear correlation with indicators of energy poverty incidence in the EU. On this basis, they showed that the classical distinction of economic development between the core and periphery also carries over to the level of energy poverty. This is evidenced by the incidence of this phenomenon, which is significantly higher in the southern and eastern European member states of the EU. Their study laid the groundwork for the theoretical integration of the issues of path dependency, uneven development and material deprivation into existing interpretations of energy transitions.
The fourth comparative study of energy poverty was completed by Karpińska and Śmiech [21], as mentioned earlier. They examined the relationship between energy poverty (EP) and subjective poverty in 26 EU countries between 2014 and 2018. They set out to see whether the poor were likely to escape energy poverty and to what extent the countries studied were similar in terms of the persistence of EP, poverty and deep poverty. Unlike their aforementioned study, they applied the Markov process and clustering techniques to micro-level longitudinal data from the EU Survey on Income and Living Conditions (the ability to keep home warm and the ability to make ends meet). Based on their findings, they found that being poor on makes it twice as difficult to get out of energy poverty, on average. They also identified three groups of countries with similar probability paths for the transformation of the EP phenomenon. The method they used allowed them to achieve the stated goal of the research, but like any method, it has a limitation. In this case, it is related to the current reporting schedule of EU-SILC statistics (every four years) used in the calculations, which determines the length of the assumed research period. This makes research over a longer time horizon difficult, especially when it does not coincide with the statistical reporting timeframe.
Another comparative work on energy poverty was completed by Tundys et al. [26]. They carried out a comparative analysis of selected indicators influencing energy poverty in the context of sustainable development for 37 European countries, including EU members, for the period 2011–2019. They focused on a time series analysis of selected variables and then established correlations between five other independent variables (GDP per capita; share of renewable energy in gross final energy consumption; household expenditure on electricity, gas and other fuels; an indicator of energy poverty, represented by the inability to maintain adequate heat at home). Although Tundys et al. analysed changes in energy poverty in a different way than adopted in this article, the results of their study can indirectly be used to check the validity of the results obtained.
Another comparative study was completed by Halkos, G.E.; Gkampoura, E-Ch. [28]. As already mentioned, they investigated the impact of the global economic crisis on energy poverty of 28 selected European countries (not EU members alone) from 2004 to 2019. They used a consensus approach and composite measurement based on three main indicators proposed in the literature and included in the public statistics on income and living conditions (EU-SILC). They found a negative impact of the recession on energy poverty in Europe. This was confirmed by the inverse relationship between GDP per capita and energy poverty levels. Although they conducted their study based on data reported at several-year intervals rather than continuous data, their results can be used for comparison with the results obtained in this article.
The Rodriguez–Alvarez study [77] can also be taken as a comparative work. They studied the effectiveness of social policy instruments in reducing energy poverty for 30 European countries (including the EU) between 2005 and 2018. They developed a model to estimate an energy poverty line. This frontier indicates the minimum level of energy poverty that a country can achieve, given selected country characteristics. During the study period, they adopted partly overlaps with the one adopted in this article; hence, despite the different purpose and set of variables studied, their results can be contrasted with the results achieved in this article.
In each of the above studies, the study of energy poverty was approached in a slightly different way, with different attention paid to it. Different research methods and different sets of variables have been used to analyse this phenomenon, not to mention different research periods. None of them exhausted such a broad issue as energy poverty. This leaves an open research field for other authors. Therefore, this article attempts to assess changes in the level of energy poverty in the EU member states in 2010–2020.
3. Materials and Methods
In this paper, a dynamic approach with two analytical levels was used. The evaluation was based on a taxonomic linear ordering method [82] and on the normalization, with a constant reference point for the whole period of the analysis (the years 2010–2020). The constant reference point gives the range of normalized variables described with Equation (1) [83,84]:
During analysis the overall assessment of countries by one synthetic measure based on all proposed five indicators was made. The method used allows not only the creation of rankings of countries and evaluation based on their levels of energy poverty, but also to group them into four classes—countries with (a) very high, (b) high, (c) medium and (d) low energy poverty levels. The analysis was conducted for 24 EU countries (Austria (AT), Belgium (BE), Denmark (DK), France (FR), Greece (GR), Spain (ES), Netherlands (NL), Ireland (IE), Germany (DE), Portugal (PT), Sweden (SE), Italy (IT), Czech Republic (CZ), Estonia (EE), Hungary (HU), Latvia (LV), Lithuania (LT), Poland (PL), Slovakia (SK), Slovenia (SI), Bulgaria (BG), Romania (RO) and Croatia (HR), including also Great Britain (UK)). The following countries were excluded from the analysis due to significant data gaps: Finland (FI), Luxembourg (LU), Cyprus (CY) and Malta (MT).
The level of energy poverty was measured using five diagnostic criteria, which can be divided into two groups.
The first group—objective variables:
—Electricity prices for household consumers [Kilowatt-hour in Purchasing Power Standard (PPS), all taxes and levies included];
—Gas prices for household consumers [Kilowatt-hour in Purchasing Power Standard (PPS), all taxes and levies included];
—Final energy consumption in households per capita [Kilogram of oil equivalent (KGOE)].
The second group—subjective variables:
—Population unable to keep home adequately warm due to poverty status [Percentage];
—Population living in a dwelling with a leaking roof, damp walls, floors or foundation or rot in window frames of floor by poverty status [Percentage].
All data for period 2010–2020 were obtained from Eurostat [2]. Descriptive statistics of variables are depicted in Table A1 (see Appendix A. Descriptive Statistics).
Among the selected variables, four (), have a positive influence on the measure, whereas 1 () has a negative (inversely proportionate) influence on the energy poverty index.
Despite a large selection of normalization methods based on quotient transformation, the zero unitarization method, compared to other methods, is the best, due to the fulfillment of all seven criteria for such methods. According to Kukula [85], the features that such a method should meet are the following: (1) depriving the titers (units) in which diagnostic features are expressed; (2) reducing the order of magnitude of diagnostic variables to a state of comparability; (3) equality of the range of variability ranges of values of all normalized features (constant nature of the range) and the equality of the lower and upper limits of their variability range; (4) the ability to normalize diagnostic features with both positive and negative values or only negative ones; (5) the ability to normalize features taking the value of zero; (6) non-negative values of standardized features; and (7) the existence of simple formulas—within a given normalization procedure, unifying the nature of variables.
Since the set of independent features contains variables that cannot be aggregated directly using appropriate standardization, normalization formulas were applied. Among the formulas, the method of zero unitarization was selected based on the interval of a normalized variable [85]:
where:
is the normalized value of the j-th variable in the i-th country on year t,
is the initial value of the j-th variable in the i-th country on year t.
Assessment of the variable that characterizes the objects—a synthetic measure, Synthetic Multidimensional Energy Poverty Index ()—was obtained by the following formula 4:
The proposed Synthetic Multidimensional Energy Poverty Index takes values from 0 to 1, where higher values (closer to 1) indicate a high level of energy poverty.
The synthetic measure enables the division of the set of countries into four groups:
- Group I—the countries with very high energy poverty level (;
- Group II—the countries with a high energy poverty level (SM;
- Group III—the countries with an average energy poverty level (SM;
- Group III—The countries with low energy poverty level (.
Where the following is the case:
-arithmetic mean of a synthetic measures ,
—standard deviation of a synthetic measure .
Using the procedures described above, the main research analysis was divided into two parts. In the first part, a general assessment was made using one Synthetic Multidimensional Energy Poverty Index (SMEPI) with one reference point for all analyzed years (2010–2020). This made it possible to observe changes in the level of energy poverty in the analysed countries. Then, using the obtained Synthetic Multidimensional Energy Poverty Index (SMEPI) values, the surveyed countries were classified into one of four groups—and the procedure was carried out for each year of the analysed period.
4. Results
This section is divided into subheadings. It should provide a concise and precise description of the experimental results and their interpretation, as well as the experimental conclusions that can be drawn.
In the first stage, the level of energy poverty in the EU member states was assessed using the Synthetic Multidimensional Energy Poverty Index (SMEPI) in the years 2010–2020. The results obtained in this stage are presented in Table A2, (Appendix B) and Figure A1 (Appendix B). The Table A2 shows changes in the SMEPI level and its dynamics for individual EU countries for which the study was conducted. In order to facilitate the analysis of the dynamics, apart from the numerical data, the dynamic of this changes for particular 24 EU members is demonstrated on Figure A1.
Analyzing the data in Table A2 and Figure A1, (Appendix B) it can be seen that the average poverty level (SMEPI) was constantly changing in all countries. There were alternating periods of its increase and decrease, separated by one or several years of changes of the same nature. Therefore, it is difficult to talk about a dominant trend in relation to countries. Positively, against this background, SK stands out, in which one direction of change was observed for the longest time, as many as seven years in a row (2012–2018)—the decrease in the level of energy poverty.
Taking into account individual years, it is possible to see a reflection of the economic situation prevailing at that time, which determined the level of energy poverty in the surveyed countries. In the years 2010–2014, when the global financial and economic crisis was ending and recovery was beginning, the SMEPI was growing in most countries. The number of countries with an increasing rate ranged from 19 (2010–2011) to 13/15 (2012–2014). Decreasing SMEPI was observed in the following countries: in 2010–2011—BG, HR, GR, RO, ES, AT, BE, SI and SE, and in 2012–2013—AT, BE, BG, CZ, DK, HU, LV, NL, PL, SK, SI, EE, LT, RO and SK.
After 2014, when the economic situation began to improve, the SMEPI decreased in most countries. A clear change for the better took place in 2015, when the indicator increased only in BE and SE. In the remaining 22 countries, there was a reduction. The year 2016 was specific, when the energy poverty rate decreased in all the countries surveyed. So far, this has not happened again. In addition, positive changes in 2015–2016 could be related to, among other things, the introduction of aid programs by the EU in order to improve the then difficult situation on the labor market and help the unemployed. One of them was the “Youth Guarantee” programme. Large financial resources were transferred to support young people in finding a job. Thanks to this, they had the opportunity not only to obtain a job, but also to improve their financial situation. This had an impact on the level of social and energy poverty.
In 2017, the situation reversed and only six countries recorded a decrease in EIP (HU, LV, LT, PL, RO, SK), while it increased in the others. In the following years, the number of countries with decreasing EIP increased.
In 2020, SMEPI increased in 10 countries (AT, CZ, DK, FR, DE, IR, RO, SK, SI, ES) and decreased in the remaining 14. Eight countries (GR, HU, LV, LT, PL, RO, SK, SI) managed to reduce energy poverty compared to 2010, which was an achievement. Since energy poverty is related to social poverty, it can be said that its reduction contributed to the achievement of the strategy’s goal of reducing the number of socially poor people. However, it is not possible to assess the impact of the COVID-19 pandemic on the level of energy poverty too precisely on the basis of the SMEPI in 2020. This may be because the state aid launched in all countries for companies and society due to the situation has delayed the reduction in this poverty. It is likely that only the analysis of data for the next year will reflect the deepening of the phenomenon.
The SMEPI reflects changes over 10 years, both in groups of countries by level of achievement and by their position in the ranking. Changes in the classification of countries into four individual groups in the analysed years are presented in Table A3 (Appendix B). Both the analysis of changes in the SMEPI value and the classification of countries into individual groups distinguish the year 2014, in which a significant increase in SMEPI occurred for most of the countries surveyed. In order to better understand the specificity of 2014, Table 2 presents the SMEPI values for the countries analysed, along with their classification into one of four groups in 2010, 2014 and 2020.
Table 2.
The result of analysis of the SMEPI in 2010, 2014 and 2020.
In the analysis, apart from the year when the Europe 2020 Strategy expired, the year 2014 was additionally shown, which, as previously mentioned, was specific to the analysed phenomenon. At that time, in most EU countries, there was a sharp increase in the level of energy poverty, despite the downward trend in previous years. This anomaly was a consequence of the situation on the commodity and fuel markets. During the crisis, their prices increased. After the end of the global financial and economic crisis of 2008–2012, the size of economic activity began to increase, and the demand for raw materials and fuels increased. As a result, the level of prices of fuels and energy increased (two variables being the basis for calculating the SMEPI), which also affected the costs of living and energy supply, and thus the level of energy poverty [86]. In this situation, both at the level of the EU and the member states, measures to support the labor market and the economy were undertaken. This helped after 2014 in, for example, reducing energy poverty.
The discussed situation was reflected in the research results. In 2014, the number of countries with very high energy poverty level was two more than it was in 2010. The two existing countries of PT (moved from 2nd to 1st place due to the highest level of the SMEPI) and BG (from 1st to 3rd position) remained in the group. HU left the group (from 3 to 10). The group was joined by three countries previously included in the group of countries with a high energy poverty level—ES, IT and GR (they took 2nd, 4th and 5th places, respectively). It may seem surprising that almost all countries with a high energy poverty level belonged to the so-called old EU. This was due to the fact that the global financial and economic crisis in these countries lasted much longer and was deeper than in other member states, which resulted in an increase in the level of energy poverty. BG, as the only country in this group, had a lower level of SMEPI, thanks to i.a. using EU aid for new member states. BG, as one of the poorest EU countries (next to RO), received a lot of support, which contributed to the improvement of the socio-economic situation.
In 2020, there was a positive change, both in the size of the discussed group and in the level of the SMEPI. Only two countries, PT and ES, remained in the group—and in the same positions. However, their SMEPI has decreased, which means a reduction in the level of energy poverty. These countries have improved thanks to their rigorous economic policies, the use of EU support tools [87] and, in the case of PT, a loan from the International Monetary Fund [88].
In 2014, the number of countries with a high energy poverty level decreased from nine to six, compared to 2010. Five countries remained in the group (LT, PL, RO, SI, LV). At the same time, the position of two improved, despite the increase in the SMEPI (LT—moved from position 4 to 6, PL—from position 7 to 11) and, the position of two deteriorated (SI moved from 9 to 7, LV from 12 to 9). On the other hand, the position of RO improved (it moved from position 5 to position 8), and thanks to the EU support, the level of the SM indicator slightly decreased. The new country in the group was HU, which, as already mentioned, moved here from the first group.
In 2020, the size of the second group was one more than in 2014. RO, SI and PL remained in the group. The SMEPI remained in the same seventh position, despite the reduction in the SMEPI. Worse positions were taken by RO (moving from 8 to 3) and PL (moving from 11 to 8), which also had lower SMEPI scores, but their achievements in this respect were lower than those of other countries. The case of PL, which in 2016 introduced the 500+ social benefit for families with children, is interesting. This benefit had positive effects (including reducing the level of energy poverty) until 2018. This was confirmed, among others, by the increase in final energy consumption in households per capita in 2010–2018. In 2019, there was a significant decrease due to the deterioration of the economic situation. The COVID-19 pandemic further limited the effectiveness of this instrument, which was reflected in the ranking position.
In 2020, thanks to the lowering of the SMEPI ratio from group I to II, IT (constantly 4th position), BG (from 3rd to 5th) and GR (from 5th to 6th position) were transferred from group I to II. DE appeared in group II, which, due to a higher SMEPI compared to 2010, moved from position 15 in group III (countries with an average energy poverty level) to position 9. A significant impact on the growth of the index caused relatively higher than other countries, final energy consumption in households per capita, electricity prices for household consumers and gas prices for household consumers.
In 2010, group III—countries with an average energy poverty level—included 6 countries (CZ, HR, DE, NL, EE, BE). In 2014, there were already 10 of them in this group. There are five countries left in the group, with four ranked better despite the increase in the SMEPI, i.e., HR (moved from 14 to 15), CZ (from 13 to 16), NL (from 16 to 17), BE (from 18 to 20) and one worse place—DE (from 15 to 13). One country—EE—moved from position 17 to 20 to group IV, which are the countries with a low energy poverty level, which was a very positive phenomenon, especially in the case of the so-called new EU country. A similar positive change also concerned the new EU country—SK, which moved from position 11 in group II to position 12 in group III. Next to it in group III, there are countries that moved from group IV: IE (from 20th to 14th position), UK (from 23rd to 18th position), DK (from 21st to 19th position) and FR (from 24th to 21st position, which was unfavorable for them). This was due to a relatively greater increase in their SMEPI compared to other countries. It should be noted that all four countries are highly developed and the described reaction reflects how the decline in the GDP growth rate must have occurred during the aforementioned crisis, since then the so-called the “economic rebound” has brought about these unfavorable changes in the level of energy poverty.
In 2020, the number of countries in group III increased to 12. LV (20th place), LT (12th place) and HU (16th place) passed from group II. They were promoted to a higher group thanks to a significant reduction in the SMEPI. This was related to the reduction in final energy consumption in households per capita, the population unable to keep their homes adequately warm by poverty status, population living in a dwelling with a leaking roof, damp walls, floors or foundation or rot in window frames of floor by poverty status. DE, on the other hand, left the group (moved to position 9 in group II), which meant a further deterioration of their position in the ranking.
The countries that remained in group III changed their place in the ranking. A total of five countries moved to higher or worse places: FR (from 21 to 10), CZ (from 16 to 11), IR (from 14 to 13), BE (from 20 to 18) and UK (from 18 to 17). Two of them (FR, BE) recorded an increase in the SMEPI, both compared to 2010 and 2014. In contrast, in three countries (CZ, IR, UK), the SMEPI was higher than in 2010, but lower than in 2014.
Four countries moved to further, better places in the ranking: SK (from 12 to 14), HR (from 15 to 18), NL (from 17 to 19), DK (from 19 to 21), whereas SK and HR recorded a decrease in the SMEPI, both in relation to 2010 and 2014. NL and DK, on the other hand, had a SMEPI higher than in 2010, but lower than in 2014.
In 2010, the number of countries in group IV (countries with a low energy poverty level) was six: AT, IE, DK, SE, UK and FR. In 2014, there were only three of them in this group. As already mentioned, IE, DK, UK and FR left the group. Two countries remained in the group, but they took lower/better places in the ranking despite the increase in the SMEPI, i.e., AT (change from 19th to 23rd place)and SE (24th instead of 22nd). EE was ranked 22nd, moving up from 17th in Group III, which meant a rise in the ranking and a positive change in the level of energy poverty in this country. All countries in the group had an SMEPI higher than in 2010, but its changes were relatively smaller than for other countries, which gave them the best position.
In 2020, these three countries in group IV switched places, which was related to the decrease in their SMEPI compared to 2014. Namely, AT was 22nd, SE was 23rd and EE was 24th. Thus, EE was at a low energy poverty level. It has achieved the biggest positive change in the level of energy poverty. It changed not only its position in the ranking, but also the group, moving from group III—countries with an average energy poverty level—to group IV. This was possible thanks to, among other things, having relatively lower energy and gas prices compared to other countries, and a significant reduction in the percentage of the population living in a dwelling with a leaking roof, damp walls, floors or foundation or rot in window frames of floor by poverty status. The positive effects are the result of the good economic situation of Estonia, which is not only one of the most economically developed countries of the former Eastern bloc, but also one of the most cybernetically developed countries in the world. The scope and forms of the EU’s influence favored its development. The confirmation is, among other things, the lowest level of the energy poverty rate among the EU countries surveyed.
The analysis shows that within 10 years there have been changes in the structure and size of groups of countries due to the level of energy poverty. They were both positive and negative.
Positive changes:
- (1)
- Reducing from three to two the number of countries with very high energy poverty level, and from nine to seven the number of countries with a high energy poverty level;
- (2)
- Increasing the number of countries with an average energy poverty level from 6 to 12;
- (3)
- A reduction in the SMEPI in eleven countries. This concerned BG, HU, LT, RO, PL, SI, SK, LV, HR, EE and GR. Among them, only GR was the so-called old member state, and the others were the so-called new EU countries. This is a great achievement for them, confirming their efforts to reduce energy poverty. For GR, it is also a success showing that after many years of fighting the effects of the economic crisis, its socio-economic situation is improving.
Unfavorable changes:
- (1)
- Reducing the number of countries with a low energy poverty level from 6 to 3;
- (2)
- An increase in the SMEPI in 13 countries (AT, IE, DK, SE, UK, FR, PT, ES, IT, DE, BE, NL and CZ), which means an increase in the level of energy poverty in them. It is surprising/disturbing that apart from CZ, these were the so-called old EU countries, from which better results were expected. One could say that in 2020 the SMEPI rate is affected by the effects of the COVID-19 pandemic. This may be partly true, but it is not entirely true, as the increase in the rate of SMEPI started earlier.
Summing up, it can be said that the EU’s achievements in reducing poverty have been partial. This phenomenon still exists and instruments supporting its reduction would be needed. One of them should be raising awareness of the need to reduce final energy consumption in households per capita, especially in the old member states, where it is much higher than in the new members. This would be in line with the EU’s climate and energy policy.
The multidimensional analysis of the level of energy poverty is supplemented by the analysis of the average level of energy poverty for 25 EU countries in 2010, 2014 and 2020, shown in Figure 1.
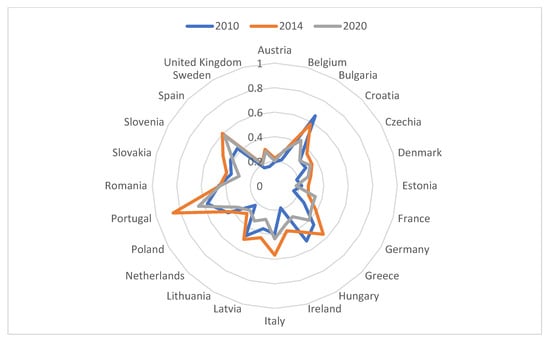
Figure 1.
The average energy poverty level for 25 EU countries in 2010, 2014 and 2020.
In 2014, the average energy poverty level increased in almost all countries (21), except for RO, HU and BG. However, in some cases it was relatively smaller (e.g., LT, AT, SE and EE), and in a few it was larger (e.g., PT, IE, ES, GR, DE). It was, as already mentioned, related to the consequences of the global financial and economic crisis of 2008–2012. The furthest from the pattern were PT, ES, BG, IT and GR. BG is, next to RO, one of the poorest, and a new member of the EU. The consequences of the crisis overlapped with the conditions existing there, translating into a relatively high level of energy poverty. A similar situation concerned the other four countries of the so-called south of the EU, where the crisis lasted the longest. SE and AT were closest to the benchmark (SMEPI), i.e., the lowest average level of energy poverty. In 2014, these countries had the lowest value of the SMEPI compared to the rest of the countries.
In 2020, things improved a bit. In most countries, the SMEPI decreased compared to 2014. ES and PT were furthest from the benchmark, while EE, AT and SE were the closest. Over the 6 years, PT, GR, BG, LV and LT had the greatest achievements in reducing the average poverty level, while DK, UK, CZ and ES had the lowest achievements.
In 2020, 10 countries (BG, HU, PL, LT, LV, SK, HR, RO, GR and EE) managed to reduce their average poverty level below the 2010 level, which is a major achievement. It was the result of well-used EU aid, internal economic reforms (e.g., in GR), development of forms of social assistance (e.g., in PL), technological changes in the economy, reduction in the energy intensity of production, development of renewable energy sources and taking advantage of the good economic situation after the crisis in 2008–2008 and 2012. Thanks to this, it was possible to reduce the level of variables taken into account when calculating the average level of energy poverty (i.e., final energy consumption in households per capita, population unable to keep their homes adequately warm by poverty status, population living in a dwelling with a leaking roof, damp walls, floors or foundation or rot in window frames of floor by poverty status) [2].
The remaining EU countries, which failed to reduce the average level of energy poverty below the state in 2010, pose a challenge. Old member states (except CZ) were characterized by relatively higher electricity and gas prices for household consumers than in the new member states. They include determining the high percentage of population living in a dwelling with a leaking roof, damp walls, floors or foundation or rot in window frames of floor by poverty status. In addition, in these countries there is a high final energy consumption in households per capita among people who are in a good financial situation, who do not have to limit it. Motivating these people to save energy requires, among other things, using instruments referring to their knowledge and environmental awareness.
In the context of the above, it can be said that there are significant differences in the average level of energy poverty between countries. Some countries have achieved positive effects from measures aimed at reducing energy poverty. Although they are not yet very satisfactory, they are still better compared to countries with negative effects.
5. Discussion
The study produced interesting and innovative results in relation to prevailing opinions on the development of energy poverty in the EU. Some of the results obtained overlap with those of studies by other authors, and some are slightly different.
Different results of changes in the level of energy poverty were obtained for Slovakia, which only recorded a decrease in the level of energy poverty for seven years from the government (2012–2018). (Table A2 and Figure A1 in Appendix B). Meanwhile, Koďousková and Bořuta [89], who study energy poverty in Slovakia, do not assess changes in this area so optimistically. They argue that despite its official definition, it is misrepresented in major policies. National policies directly or indirectly address energy poverty in Slovakia, based on the energy fairness framework. The framework consists of four pillars—the recognition aspect, the distribution aspect, the participation aspect and the spatial sensitivity aspect. Their analysis of documents shows that the problem of energy poverty is largely ignored. The two most recent Energy Efficiency Action Plans and the economic policy strategy mention energy poverty only briefly in relation to the possible negative effects of rising energy prices on end-users. Such an approach may slightly falsify the real picture of energy poverty. It should be emphasized, however, that it is difficult to compare the convergence of the results of the qualitative analysis with the results of quantitative research based on the same criteria for all the examined objects.
Consistent with other studies carried out to date, the authors obtained for individual country groups.
In 2014, the group of countries with the highest level of energy poverty included four old EU countries (PT, ES, GR and IT) and one new country—BG. In the group with high energy poverty levels were the new eastern European member states (LT, SI, RO, LV, PL and HU). Similar conclusions were reached by Bouzarovski and Herrero [90], who conducted a comprehensive analysis of spatial and temporal trends in national patterns of energy poverty and gas and electricity prices. Their research shows “that the classical distinction of economic development between the center and the periphery (in this case, the EU) also holds true for energy poverty, as the incidence of this phenomenon is much higher in southern and eastern European EU member states”. Braubach and Ferrand [91], Healy [22], Healy and Clinch [79] and Thomson and Snell [23] also contributed to the debate on the dynamics and diversity of energy poverty across the EU. The conclusions of their studies are consistent with the results presented in this paper. In their work, they identified a number of factors at the household level that affect the likelihood of energy deprivation in a household. In addition, they found significant differences between EU member states. They underlined that southern and eastern European countries generally report a higher incidence of energy poverty. In their works, they emphasized the paradox concerning the EU countries in the Mediterranean basin. Countries such as Portugal, Spain, Italy, Malta, Greece and Cyprus, despite milder winters, still have a high proportion of people unable to keep their homes warm. Such countries still have key national energy deprivation indicators above the EU average. The global crisis, with its rapid rise in unemployment and income inequality, has made this situation even worse. Political organizations and advocacy groups have also highlighted the existence of an “energy gap” in the EU. By this, they understood that poor households in most member states are unable to meet their basic energy needs, while being penalized by high and increasing energy costs due to a combination of rising prices and inefficient real estate [92]. Similar conclusions were also reached by Scarpellini et al. [55] and Halkos and Gkampoura [28]. In part, the study by Tundys et al. [26] also confirmed that some of the old EU countries have a more severe energy poverty problem than some of the new member states. The above-average indicators of the risk of energy poverty in the member states of central and eastern Europe (the so-called former Eastern Bloc) were pointed out by the already mentioned Bouzarovski and Herrero [90]. They showed that these countries, despite the lowest nominal energy prices, are characterized by higher-than-average energy prices measured in PPS. They are therefore more exposed to the price factor as households spend relatively more on domestic energy than in the rest of the EU. It can therefore be said that their conclusions confirm the validity of the results obtained in the paper.
A surprising result of the analysis of the change in SMEPI values by country group was the appearance of DE in the group of countries with high energy poverty. A significant impact on the growth of the index had, relatively higher to other countries, final energy consumption in households per capita, electricity prices for household consumers and gas prices for household consumers. High energy consumption in households is characteristic of highly developed countries, and its reduction is quite slow. In these countries, including DE, the proportion of people living in poverty tends to be low. The rest of society is relatively wealthy and does not have to drastically reduce energy consumption, because they can afford it. In addition, most household appliances currently run on electricity, which makes it difficult to reduce the amount of energy consumed in such households. On the other hand, the German government could not counteract the high prices of gas and energy during the period under review. This was related, among other things, with investments serving the implementation of EU climate and energy goals [84] and the influx of a large number of immigrants from non-European countries, which required the involvement of large financial resources. Therefore, there was not enough to finance additional energy poverty reduction. This is confirmed by the information provided by the German press agency DPA about the rapidly expanding energy poverty in Germany. The main reason is rising electricity prices, caused by legally binding subsidies for wind and solar energy. Individual consumers pay almost three times more per kilowatt hour than in the USA [93]. The situation has also been exacerbated by the COVID-19 pandemic. The result is a worse position of DE in the ranking of countries, according to the level of this phenomenon.
The German Economic Institute (IW) [94] has stated that Europe’s escalating energy crisis threatens to push middle-class German households into “energy poverty”... “Many households may need support” to pay their electricity, gas and fuel bills, adding that social security payments should be adjusted to cover excess energy costs and perhaps extended to households still above the poverty line. The German government coalition has spent around EUR 30 billion to ease the cost pressure on citizens and is not planning any new aid packages for now, but they can be introduced if necessary [95]. The situation in Germany confirms the correctness of the calculations presented in this article.
What was surprising was the deterioration of the FR position in the ranking, which in 10 years “jumped” as many as 14 places (from 24th in 2010 to 10th in 2020). The correctness of the obtained result is, in a sense, confirmed by the results of research by other authors. Namely, the already mentioned Legendre and Ricci [20] pointed out that energy poverty is a growing problem in France, as well as in ES and IT. They questioned the UK’s current energy poverty measurement, whereby a household is considered to be in fuel poverty if it needs or must spend more than 10% of its income on fuel to keep its home to an acceptable level. For this reason, they measured it themselves by doing an income-based analysis to quantify fuel-sensitive households. It can therefore be said that their approach justifies the calculation used in this article, without taking into account the UK SMEPI.
An interesting case was EE, which was ranked in the group of countries with a low energy poverty level in 2020. It achieved the greatest positive change in energy poverty levels, moving not only to a better ranking, but also to a higher group of countries from an energy poverty level perspective. Similar results for EE were obtained by Rodriguez–Alvarez et al. [77]. They estimated the limits of the minimum level of energy poverty in 30 European countries in 2005–2018. They took into account the level of income, energy prices, energy intensity and other country-specific characteristics. Estonia, along with Malta and Turkey, had the lowest indicators of both energy poverty and energy poverty efficiency. France, Sweden and Denmark had the highest, which indicates the correctness of the results in this article.
The analysis of the average energy poverty level of the EU countries studied, as shown in Figure 1, are showed in 2020. A total of 10 countries (BG, HU, PL, LT, LV, SK, HR, RO, GR and EE) managed to reduce the average poverty level below the 2010 level. Indirect confirmation of the positive changes in the level of energy poverty are the achievements of these countries in the implementation of the social goals of the Europe 2020 strategy described by Kryk [96], Kryk and Guzowska [97] and the analysis of the implementation of climate/energy goals by EU member states made by Guzowska and Kryk [84]. Similar conclusions were reached by Karpińska and Śmiech [21], who analysed the invisible energy poverty in central and eastern Europe. Similar results were presented by Turai et al. [38]. They surveyed five pilot countries, Bulgaria, Hungary, Lithuania, North Macedonia and Ukraine, for energy poverty, and assessed existing financial support programs to fight energy poverty. They indicated both the factors supporting the reduction in the level of energy poverty and the factors hindering the fight against it. This enabled them to suggest what country-specific changes/actions would be needed to achieve even greater impact in this regard. Very similar changes in the evolution of energy poverty were also pointed out by Rodriguez–Alvarez et al. [77], who studied the effectiveness of financial assistance to energy vulnerable people in relation to selected European countries. Similar conclusions were also reached by Tundys et al. [26], finding that some European countries are rapidly and effectively reducing energy poverty.
In summary, the results of the study obtained are mostly consistent with those of other authors, confirming the correctness of the calculations and the logic of the inference. Even the seemingly surprisingly higher levels of energy poverty of some of the old EU countries, in relation to the new members, and their worse performance in this respect, were confirmed by the results of other authors’ studies. It should be stressed that the high levels of energy poverty in old countries such as PT, ES, IT and GR are related not only to the economic situation of the population, but also to the building traditions resulting from the prevailing climate in these countries (houses were built without heating installations) [54,56]. Such wooing makes energy poverty reduction more difficult. In the context of the above, when assessing the level of energy poverty of individual countries, the criterion of a division between old and new member states should not be used.
6. Conclusions
Energy poverty is a phenomenon that is gaining increasing attention from academic and political circles in the EU. It threatens the quality of life and well-being of many EU households. Energy poverty occurs where there is a combination of three contributing factors: low-income levels, inadequate building quality and high energy prices. The synergy of the impact of these three factors on the level of poverty was strengthened by the COVID-19 pandemic. Hence, the article attempts to assess changes in the level of energy poverty in the EU member states in the years of the Europe 2020 Strategy.
This paper proposes a multidimensional synthetic indicator to measure the level of fuel poverty and analyses its changes over time between different countries/groups of countries. The advantage of the proposed indicator is its simplicity and universality. The set of proposed variables, publicly available in Eurostat, determines the objectivity and continuous comparability of results between countries. The use of publicly available data makes the indicator suitable for use to monitor the level of energy poverty at different levels of the economy and to explain changes in it. We can say that the results obtained in the article bring added value to the current state of knowledge about the methods of measuring the level of energy poverty and may contribute to the creation of other possibilities for monitoring changes taking place in it. The issues of energy poverty are not only interesting for scientists, but also have an application dimension because they allow for specifying recommendations for decision-makers.
The research conducted for the purposes of the article made it possible to achieve the goal and answer the questions formulated in the introduction. The analysis confirmed that there are still differences in the level of energy poverty between countries. While the Europe 2020 Strategy was in force, both positive and negative changes took place in this respect.
Positive changes include the following:
- The decrease from three to two countries with very high energy poverty level (PT, ES), and from nine to seven countries with a high energy poverty level (RO, IT, BR, GR, SI, PL and DE);
- Increasing the number of countries with an average energy poverty level from 6 to 12 (FR, CZ, LT, IE, SK, BE, HU, UK, HR, NL, LV, DK);
- Energy poverty reduction in 11 countries (BG, HU, LT, RO, PL, SI, SK, LV, HR, EE and GR).
Negative changes include the following:
- Reducing from six to three the number of countries with a low energy poverty level (AT, SE, EE);
- Increase in energy poverty in 13 countries (AT, IE, DK, SE, UK, FR, PT, ES, IT, DE, BE, NL and CZ).
Based on the Synthetic Multidimensional Energy Poverty Index (SMEPI) in 2020, it is impossible to clearly assess the impact of the COVID-19 pandemic on this phenomenon, because in a given year, this indicator increased in only 10 countries (AT, CZ, DK, FR, DE, IR, RO, SK, SI and ES), and in the remaining 14 it decreased (BE, BG, HR, EE, GR, HU, IT, LV, LT, NL, PL, PT, SE and UK). It is likely that only on the basis of relevant data for 2021 and 2022 will it be possible to precisely determine the impact of the pandemic situation on the level and scope of energy poverty.
The conducted analysis, empirical and theoretical, also allows for the formulation of several general recommendations:
- In countries with high levels energy poverty rates, measures should be taken to protect households and empower vulnerable consumers. This will help citizens spend less on energy bills, provide them with healthier living conditions and reduce energy poverty. The form of these activities should not violate the principles of market economy or cause social and economic controversies.
- Appropriate reforms/changes that would support/accelerate poverty reduction should be implemented in some countries [41,49].
The phenomenon of energy poverty, as mentioned in the documents review, has long been an important subject of interest and regulation in the EU. The most up-to-date thematic document on this matter is Commission Recommendation (EU) 2020/1563 of 14 October 2020 on energy poverty [6]. This document, in nine points, presents recommendations for member states regarding the implementation of specific activities aimed at reducing energy poverty. The report is complementary to the Study on Addressing Energy Poverty in the Energy Community Contracting Parties [30]. It presents the recommendations of the European Commission in the context of the existing situation in the member states and the applicable legal framework directly or indirectly related to the phenomenon of energy poverty. In addition, the report points to the benefits of reducing energy poverty, emphasizing that they will directly contribute to stimulating economic growth and prosperity in the European Union, and thus to the implementation of social and climate/energy objectives of the EU.
This article presents only one option for assessing changes in the level of energy poverty during the period of validity of the Europe 2020 Strategy. The authors are aware of the simplistic nature of the index created to measure energy poverty. Of course, it would be better if it integrated all the indicators included in the EC Recommendation, but this is not feasible at present. However, the design of the index allows it to be extended. It would be interesting in the future to include other variables for study, which is determined by the continuity of their reporting.
Author Contributions
Conceptualization: B.K., M.K.G.; Methodology: M.K.G.; validation: M.K.G.; formal analysis: B.K., M.K.G.; resources: B.K.; writing: B.K., M.K.G.; writing—review and editing: B.K., M.K.G.; visualization: M.K.G.; project administration: B.K. All authors have read and agreed to the published version of the manuscript.
Funding
The project is financed within the framework of the program of the Minister of Science and Higher Education under the name “Regional Excellence Initiative” in the years 2019–2022, project number 001/RID/2018/19, the amount of financing PLN 10,684,000.00.
Institutional Review Board Statement
Not applicable.
Informed Consent Statement
Not applicable.
Data Availability Statement
Data were obtained from https://ec.europa.eu/eurostat (accessed on 5 February 2022).
Conflicts of Interest
The authors declare no conflict of interest.
Appendix A
Table A1.
Descriptive statistics.
Table A1.
Descriptive statistics.
| 2010 | 2011 | 2012 | 2013 | 2014 | 2015 | 2016 | 2017 | 2018 | 2019 | 2020 | |
|---|---|---|---|---|---|---|---|---|---|---|---|
| Electricity prices for household consumers [Kilowatt-hour in Purchasing Power Standard (PPS). all taxes and levies included] | |||||||||||
| Mean | 0.185 | 0.196 | 0.209 | 0.214 | 0.211 | 0.217 | 0.217 | 0.203 | 0.208 | 0.210 | 0.208 |
| Min. | 0.120 | 0.127 | 0.134 | 0.141 | 0.146 | 0.146 | 0.147 | 0.137 | 0.150 | 0.167 | 0.116 |
| Max. | 0.267 | 0.272 | 0.272 | 0.278 | 0.287 | 0.293 | 0.294 | 0.281 | 0.276 | 0.268 | 0.280 |
| Std. Deviation | 0.037 | 0.038 | 0.040 | 0.037 | 0.038 | 0.038 | 0.040 | 0.038 | 0.037 | 0.033 | 0.041 |
| Gas prices for household consumers [Kilowatt-hour in Purchasing Power Standard (PPS). all taxes and levies included] | |||||||||||
| Mean | 0.069 | 0.076 | 0.082 | 0.080 | 0.079 | 0.076 | 0.070 | 0.067 | 0.070 | 0.069 | 0.064 |
| Min. | 0.039 | 0.049 | 0.051 | 0.054 | 0.055 | 0.052 | 0.046 | 0.043 | 0.046 | 0.044 | 0.038 |
| Max. | 0.114 | 0.114 | 0.118 | 0.120 | 0.134 | 0.126 | 0.104 | 0.095 | 0.097 | 0.110 | 0.096 |
| Std. Deviation | 0.018 | 0.018 | 0.019 | 0.017 | 0.018 | 0.017 | 0.015 | 0.014 | 0.015 | 0.017 | 0.017 |
| Final energy consumption in households per capita [Kilogram of oil equivalent (KGOE)] | |||||||||||
| Mean | 635.792 | 584.375 | 594.833 | 588.125 | 529.875 | 549.792 | 563.417 | 563.750 | 557.458 | 553.208 | 557.375 |
| Min. | 281.000 | 263.000 | 256.000 | 252.000 | 267.000 | 266.000 | 273.000 | 272.000 | 280.000 | 281.000 | 293.000 |
| Max. | 902.000 | 813.000 | 846.000 | 816.000 | 746.000 | 782.000 | 801.000 | 791.000 | 768.000 | 755.000 | 749.000 |
| Std. Deviation | 187.237 | 153.783 | 162.408 | 173.451 | 142.126 | 147.753 | 155.083 | 150.143 | 144.358 | 138.887 | 132.326 |
| Population unable to keep home adequately warm by poverty status [Percentage] | |||||||||||
| Mean | 11.917 | 11.879 | 12.638 | 12.417 | 11.713 | 11.075 | 10.367 | 9.333 | 8.658 | 8.063 | 7.838 |
| Min. | 1.900 | 1.600 | 1.700 | 0.900 | 1.100 | 1.200 | 2.600 | 2.100 | 1.600 | 1.800 | 1.500 |
| Max. | 66.500 | 46.300 | 46.500 | 44.900 | 40.500 | 39.200 | 39.200 | 36.500 | 33.700 | 30.100 | 27.500 |
| Std. Deviation | 13.882 | 11.399 | 11.335 | 11.005 | 10.488 | 10.105 | 9.972 | 9.336 | 8.686 | 7.728 | 6.924 |
| Population living in a dwelling with a leaking roof. damp walls. floors or foundation or rot in window frames of floor by poverty status [Percentage] | |||||||||||
| Mean | 16.921 | 16.783 | 16.354 | 16.696 | 16.433 | 15.688 | 15.688 | 14.417 | 14.525 | 13.621 | 13.613 |
| Min. | 5.800 | 7.800 | 7.800 | 7.500 | 7.000 | 6.300 | 6.200 | 6.700 | 5.100 | 5.700 | 4.900 |
| Max. | 32.400 | 34.700 | 31.500 | 31.900 | 32.800 | 28.100 | 30.500 | 25.500 | 26.900 | 24.400 | 25.200 |
| Std. Deviation | 5.951 | 5.998 | 5.917 | 6.433 | 7.086 | 5.990 | 5.893 | 5.140 | 5.308 | 4.744 | 5.306 |
Appendix B
Table A2.
Values of the Synthetic Multidimensional Energy Poverty Index and the dynamics of this index for EU countries in period 2010–2020.
Table A2.
Values of the Synthetic Multidimensional Energy Poverty Index and the dynamics of this index for EU countries in period 2010–2020.
| 2010 | 2011 | 2012 | 2013 | 2014 | 2015 | 2016 | 2017 | 2018 | 2019 | 2020 | |||||||||||
|---|---|---|---|---|---|---|---|---|---|---|---|---|---|---|---|---|---|---|---|---|---|
| Austria | 0.194 | ↗ | 0.229 | ↘ | 0.228 | ↘ | 0.217 | ↗ | 0.225 | → | 0.225 | ↘ | 0.216 | ↘ | 0.202 | ↗ | 0.210 | ↘ | 0.198 | ↗ | 0.202 |
| Belgium | 0.219 | ↗ | 0.325 | ↘ | 0.307 | ↘ | 0.266 | ↗ | 0.291 | ↗ | 0.303 | ↗ | 0.344 | ↘ | 0.342 | ↗ | 0.359 | ↘ | 0.337 | ↘ | 0.300 |
| Bulgaria | 0.659 | ↘ | 0.590 | ↗ | 0.643 | ↘ | 0.597 | ↘ | 0.580 | ↘ | 0.554 | ↘ | 0.505 | ↘ | 0.500 | ↗ | 0.522 | ↘ | 0.482 | ↘ | 0.428 |
| Croatia | 0.290 | ↘ | 0.283 | ↗ | 0.363 | ↗ | 0.363 | ↗ | 0.371 | ↘ | 0.342 | ↘ | 0.320 | ↘ | 0.286 | ↗ | 0.299 | ↗ | 0.307 | ↘ | 0.289 |
| Czechia | 0.292 | ↗ | 0.360 | ↗ | 0.377 | ↘ | 0.361 | ↘ | 0.350 | ↘ | 0.346 | ↘ | 0.330 | ↘ | 0.295 | ↗ | 0.308 | ↗ | 0.332 | ↗ | 0.333 |
| Denmark | 0.185 | ↗ | 0.307 | ↗ | 0.308 | ↘ | 0.301 | ↗ | 0.305 | ↗ | 0.315 | ↘ | 0.292 | ↘ | 0.288 | ↗ | 0.320 | ↘ | 0.278 | ↗ | 0.282 |
| Estonia | 0.220 | ↗ | 0.253 | ↗ | 0.280 | ↗ | 0.288 | ↘ | 0.274 | ↘ | 0.238 | ↘ | 0.200 | ↗ | 0.216 | ↗ | 0.223 | ↘ | 0.221 | ↘ | 0.174 |
| France | 0.160 | ↗ | 0.200 | ↗ | 0.208 | ↗ | 0.217 | ↗ | 0.284 | ↘ | 0.264 | ↘ | 0.260 | ↘ | 0.238 | ↗ | 0.275 | ↗ | 0.306 | ↗ | 0.342 |
| Germany | 0.273 | ↗ | 0.328 | ↗ | 0.333 | ↗ | 0.347 | ↗ | 0.384 | ↘ | 0.378 | ↘ | 0.371 | ↘ | 0.348 | ↗ | 0.351 | ↘ | 0.311 | ↗ | 0.349 |
| Greece | 0.450 | ↘ | 0.426 | ↗ | 0.484 | ↗ | 0.550 | ↗ | 0.559 | ↘ | 0.531 | ↘ | 0.495 | ↘ | 0.457 | ↗ | 0.462 | ↘ | 0.412 | ↘ | 0.397 |
| Hungary | 0.520 | ↗ | 0.529 | ↗ | 0.534 | ↘ | 0.475 | ↘ | 0.436 | ↘ | 0.407 | ↘ | 0.404 | ↘ | 0.339 | ↘ | 0.331 | ↘ | 0.318 | ↘ | 0.291 |
| Ireland | 0.187 | ↗ | 0.247 | ↗ | 0.308 | ↗ | 0.348 | ↗ | 0.380 | ↘ | 0.352 | ↘ | 0.329 | ↘ | 0.299 | ↗ | 0.319 | ↗ | 0.323 | ↗ | 0.330 |
| Italy | 0.393 | ↗ | 0.483 | ↗ | 0.522 | ↗ | 0.523 | ↗ | 0.565 | ↘ | 0.540 | ↘ | 0.498 | ↘ | 0.434 | ↗ | 0.442 | ↗ | 0.460 | ↘ | 0.433 |
| Latvia | 0.363 | ↗ | 0.445 | ↗ | 0.467 | ↘ | 0.461 | ↘ | 0.439 | ↗ | 0.493 | ↘ | 0.435 | ↘ | 0.394 | ↘ | 0.381 | ↘ | 0.344 | ↘ | 0.284 |
| Lithuania | 0.471 | ↗ | 0.529 | ↗ | 0.544 | ↗ | 0.566 | ↘ | 0.505 | ↘ | 0.480 | ↘ | 0.447 | ↘ | 0.388 | ↘ | 0.366 | ↗ | 0.385 | ↘ | 0.331 |
| Netherlands | 0.226 | ↗ | 0.279 | ↗ | 0.300 | ↘ | 0.297 | ↗ | 0.321 | ↘ | 0.319 | ↘ | 0.294 | ↘ | 0.260 | ↗ | 0.299 | ↗ | 0.342 | ↘ | 0.285 |
| Poland | 0.441 | ↗ | 0.442 | ↗ | 0.474 | ↘ | 0.437 | ↘ | 0.423 | ↗ | 0.444 | ↘ | 0.421 | ↘ | 0.395 | ↘ | 0.362 | ↘ | 0.360 | ↘ | 0.349 |
| Portugal | 0.569 | ↗ | 0.621 | ↗ | 0.698 | ↗ | 0.811 | ↗ | 0.858 | ↘ | 0.805 | ↘ | 0.770 | ↘ | 0.680 | ↗ | 0.686 | ↘ | 0.652 | ↘ | 0.645 |
| Romania | 0.457 | ↘ | 0.447 | ↘ | 0.438 | ↗ | 0.486 | ↘ | 0.449 | ↗ | 0.484 | ↘ | 0.472 | ↘ | 0.429 | ↘ | 0.426 | ↗ | 0.433 | ↗ | 0.446 |
| Slovakia | 0.367 | ↗ | 0.412 | ↗ | 0.431 | ↘ | 0.414 | ↘ | 0.407 | ↘ | 0.394 | ↘ | 0.383 | ↘ | 0.310 | ↘ | 0.304 | ↘ | 0.299 | ↗ | 0.301 |
| Slovenia | 0.417 | ↗ | 0.485 | ↘ | 0.477 | ↘ | 0.459 | ↗ | 0.487 | ↘ | 0.444 | ↘ | 0.414 | ↘ | 0.372 | ↗ | 0.397 | ↘ | 0.385 | ↗ | 0.388 |
| Spain | 0.431 | ↘ | 0.430 | ↗ | 0.520 | ↗ | 0.561 | ↗ | 0.605 | ↘ | 0.589 | ↘ | 0.563 | ↘ | 0.502 | ↗ | 0.562 | ↗ | 0.577 | ↗ | 0.580 |
| Sweden | 0.169 | ↗ | 0.214 | ↘ | 0.196 | ↗ | 0.205 | ↗ | 0.207 | ↗ | 0.211 | ↗ | 0.222 | ↘ | 0.195 | ↗ | 0.245 | ↗ | 0.249 | ↘ | 0.200 |
| United Kingdom | 0.163 | ↗ | 0.244 | ↗ | 0.255 | ↗ | 0.270 | ↗ | 0.307 | ↘ | 0.280 | ↘ | 0.272 | ↘ | 0.269 | ↗ | 0.286 | ↗ | 0.297 | ↘ | 0.289 |


Figure A1.
Values of the Synthetic Multidimensional Energy Poverty Index and the dynamics of this index for particular 24 EU countries in period 2010–2020.
Table A3.
Values of the Synthetic Multidimensional Energy Poverty Index and the rank of EU countries in terms of level of energy poverty in period 2010–2020.
Table A3.
Values of the Synthetic Multidimensional Energy Poverty Index and the rank of EU countries in terms of level of energy poverty in period 2010–2020.
| 2010 | 2011 | 2012 | 2013 | 2014 | 2015 | 2016 | 2017 | 2018 | 2019 | 2020 | ||||||||||||
|---|---|---|---|---|---|---|---|---|---|---|---|---|---|---|---|---|---|---|---|---|---|---|
| Austria | 0.194 | IV | 0.229 | IV | 0.228 | IV | 0.217 | IV | 0.225 | IV | 0.225 | IV | 0.216 | IV | 0.202 | IV | 0.210 | IV | 0.198 | IV | 0.202 | IV |
| Belgium | 0.219 | III | 0.325 | III | 0.307 | III | 0.266 | III | 0.291 | III | 0.303 | III | 0.344 | III | 0.342 | III | 0.359 | III | 0.337 | III | 0.300 | III |
| Bulgaria | 0.659 | I | 0.590 | I | 0.643 | I | 0.597 | I | 0.580 | I | 0.554 | I | 0.505 | II | 0.500 | I | 0.522 | I | 0.482 | I | 0.428 | II |
| Croatia | 0.290 | III | 0.283 | III | 0.363 | III | 0.363 | III | 0.371 | III | 0.342 | III | 0.320 | III | 0.286 | III | 0.299 | III | 0.307 | III | 0.289 | III |
| Czechia | 0.292 | III | 0.360 | III | 0.377 | III | 0.361 | III | 0.350 | III | 0.346 | III | 0.330 | III | 0.295 | III | 0.308 | III | 0.332 | III | 0.333 | III |
| Denmark | 0.185 | IV | 0.307 | III | 0.308 | III | 0.301 | III | 0.305 | III | 0.315 | III | 0.292 | III | 0.288 | III | 0.320 | III | 0.278 | III | 0.282 | III |
| Estonia | 0.220 | III | 0.253 | IV | 0.280 | III | 0.288 | III | 0.274 | IV | 0.238 | IV | 0.200 | IV | 0.216 | IV | 0.223 | IV | 0.221 | IV | 0.174 | IV |
| France | 0.160 | IV | 0.200 | IV | 0.208 | IV | 0.217 | IV | 0.284 | III | 0.264 | IV | 0.260 | III | 0.238 | IV | 0.275 | III | 0.306 | III | 0.342 | III |
| Germany | 0.273 | III | 0.328 | III | 0.333 | III | 0.347 | III | 0.384 | III | 0.378 | III | 0.371 | III | 0.348 | III | 0.351 | III | 0.311 | III | 0.349 | II |
| Greece | 0.450 | II | 0.426 | II | 0.484 | II | 0.550 | II | 0.559 | II | 0.531 | II | 0.495 | II | 0.457 | II | 0.462 | II | 0.412 | II | 0.397 | II |
| Hungary | 0.520 | I | 0.529 | I | 0.534 | II | 0.475 | II | 0.436 | II | 0.407 | II | 0.404 | II | 0.339 | III | 0.331 | III | 0.318 | III | 0.291 | III |
| Ireland | 0.187 | IV | 0.247 | IV | 0.308 | III | 0.348 | III | 0.380 | III | 0.352 | III | 0.329 | III | 0.299 | III | 0.319 | III | 0.323 | III | 0.330 | III |
| Italy | 0.393 | II | 0.483 | II | 0.522 | II | 0.523 | II | 0.565 | I | 0.540 | II | 0.498 | II | 0.434 | II | 0.442 | II | 0.460 | II | 0.433 | II |
| Latvia | 0.363 | II | 0.445 | II | 0.467 | II | 0.461 | II | 0.439 | II | 0.493 | II | 0.435 | II | 0.394 | II | 0.381 | II | 0.344 | III | 0.284 | III |
| Lithuania | 0.471 | II | 0.529 | I | 0.544 | I | 0.566 | I | 0.505 | II | 0.480 | II | 0.447 | II | 0.388 | II | 0.366 | II | 0.385 | II | 0.331 | III |
| Netherlands | 0.226 | III | 0.279 | III | 0.300 | III | 0.297 | III | 0.321 | III | 0.319 | III | 0.294 | III | 0.260 | III | 0.299 | III | 0.342 | III | 0.285 | III |
| Poland | 0.441 | II | 0.442 | II | 0.474 | II | 0.437 | II | 0.423 | II | 0.444 | II | 0.421 | II | 0.395 | II | 0.362 | III | 0.360 | II | 0.349 | II |
| Portugal | 0.569 | I | 0.621 | I | 0.698 | I | 0.811 | I | 0.858 | I | 0.805 | I | 0.770 | I | 0.680 | I | 0.686 | I | 0.652 | I | 0.645 | I |
| Romania | 0.457 | II | 0.447 | II | 0.438 | II | 0.486 | II | 0.449 | II | 0.484 | II | 0.472 | II | 0.429 | II | 0.426 | II | 0.433 | II | 0.446 | II |
| Slovakia | 0.367 | II | 0.412 | II | 0.431 | II | 0.414 | II | 0.407 | III | 0.394 | III | 0.383 | III | 0.310 | III | 0.304 | III | 0.299 | III | 0.301 | III |
| Slovenia | 0.417 | II | 0.485 | II | 0.477 | II | 0.459 | II | 0.487 | II | 0.444 | II | 0.414 | II | 0.372 | II | 0.397 | II | 0.385 | II | 0.388 | II |
| Spain | 0.431 | II | 0.430 | II | 0.520 | II | 0.561 | I | 0.605 | I | 0.589 | I | 0.563 | I | 0.502 | I | 0.562 | I | 0.577 | I | 0.580 | I |
| Sweden | 0.169 | IV | 0.214 | IV | 0.196 | IV | 0.205 | IV | 0.207 | IV | 0.211 | IV | 0.222 | IV | 0.195 | IV | 0.245 | IV | 0.249 | IV | 0.200 | IV |
| United Kingdom | 0.163 | IV | 0.244 | IV | 0.255 | IV | 0.270 | III | 0.307 | III | 0.280 | III | 0.272 | III | 0.269 | III | 0.286 | III | 0.297 | III | 0.289 | III |
References
- European Commission. Contributing to the European Green Deal and the Union’s recovery—Report from the Commission to the European Parliament, the Council, the European Economic and Social Committee and the Committee of the Regions State of the Energy Union 2021 (pursuant to Regulation (EU) 2018/1999 on the Governance of the Energy Union and Climate Action). COM (2021) 950 final. Brussels, Belgium, 26 October 2021. Available online: https://eur-lex.europa.eu/legal-content/EN/TXT/?uri=COM:2021:950:FIN (accessed on 20 February 2022).
- EUROSTAT. Available online: https://ec.europa.eu/eurostat (accessed on 5 February 2022).
- Simon, F.; Taylor, K. Energy Crisis Could Worsen Poverty for Millions of Europeans. 20 November 2021. Available online: EURACTIV.com (accessed on 20 February 2022).
- Mo, J.; Zhang, W.; Tu, Q.; Yuan, J.; Duan, H.; Fan, Y.; Pan, J.; Zhang, J.; Meng, Z. The role of national carbon pricing in phasing out China’s coal power. IScience 2021, 24, 102655. [Google Scholar] [CrossRef] [PubMed]
- European Parliament and of the Council. Regulation (EU) 2018/1999 of the European Parliament and of the Council of 11 December 2018 on the Governance of the Energy Union and Climate Action. 2018. Available online: https://eur-lex.europa.eu/legal-content/EN/TXT/?uri=CELEX%3A32018R1999&qid=1607598918514 (accessed on 10 January 2022).
- European Commission. Commission Recommendation of 14.10.2020 on energy poverty {SWD(2020) EN 960 final}. Official Journal of the European Union 27.10.2020, L 357/35 2020. Brussels, Belgium 2020. Available online: https://ec.europa.eu/energy/sites/ener/files/recommendation_on_energy_poverty_c2020_9600.pdf (accessed on 20 February 2022).
- Crentsil, A.O.; Asuman, D.; Fenny, A. Assessing the determinants and drivers of multidimensional energy poverty in Ghana. Energy Policy 2019, 133, 110884. [Google Scholar] [CrossRef]
- Akpalu, W.; Dasmani, I.; Aglobitse, B. Demand for cooking fuels in a developing country: To what extent do taste and preferences matter? Energy Policy 2011, 39, 6525–6531. [Google Scholar] [CrossRef]
- Mensah, J.T.; Adu, G. An empirical analysis of household energy choice in Ghana. Renew. Sustain. Energy Rev. 2015, 51, 1402–1411. [Google Scholar] [CrossRef]
- Karimu, A. Cooking fuel preferences among Ghanaian Households: An empirical analysis. Energy Sustain. Dev. 2015, 27, 10–17. [Google Scholar] [CrossRef]
- Sébastien, L.; Bauler, T. Use and influence of composite indicators for sustainable development at the EU-level. Ecol. Indicat. 2013, 35, 3–12. Available online: https://hal.archives-ouvertes.fr/hal-02462754 (accessed on 11 December 2022). [CrossRef]
- Sareen, S.; Thomson, H.; Herrero, S.T.; Gouveia, J.; Lippert, I.; Lis, A. European Energy Poverty Metrics: Scales, Prospects and Limits. Glob. Transit. 2020, 2, 26–36. [Google Scholar] [CrossRef]
- Thomson, H.; Bouzarovski, S.; Snell, C. Rethinking the measurement of energy poverty in Europe: A critical analysis of indicators and data. Indoor Built Environ. 2017, 26, 879–901. [Google Scholar] [CrossRef]
- Herrero, S.T. Energy poverty indicators: A critical review of methods. Indoor Built Environ. 2017, 26, 1018–1031. [Google Scholar] [CrossRef]
- Energy Poverty Advisory Hub. Bringing Energy Poverty Research into Local Practice: Exploring Subnational Scale Analyses. Published by the Energy Poverty Advisory Hub, February 2022. Available online: https://energy-poverty.ec.europa.eu/system/files/202203/EPAH_Bringing%20Energy%20Poverty%20Research%20into%20local%20practice_final.pdf (accessed on 2 April 2022).
- Aristondo, O.; Onaindia, E. Counting energy poverty in Spain between 2004 and 2015. Energy Policy 2018, 113, 420–429. [Google Scholar] [CrossRef]
- Okushima, S. Gauging energy poverty: A multidimensional approach. Energy 2017, 137, 1159–1166. [Google Scholar] [CrossRef]
- Sokołowski, J.; Lewandowski, P.; Kiełczewska, A.; Buzarowski, S. A multidimensional index to measure energy poverty: The Polish case. Energy Sour. Part B Econ. Plan. Policy 2020, 15, 92–112. [Google Scholar] [CrossRef]
- Faiella, I.; Lavecchia, L. Energy poverty. How can you fight it, if you can’t measure it? Energy Build. 2021, 233, 110692. [Google Scholar] [CrossRef]
- Legendre, B.; Ricci, O. Measuring fuel poverty in France: Which households are the most fuel vulnerable? Energy Econ. 2015, 49, 620–628. [Google Scholar] [CrossRef]
- Karpińska, L.; Śmiech, S. Invisible energy poverty? Analysing housing costs in Central and Eastern Europe. Energy Res. Soc. Sci. 2020, 70, 101670. [Google Scholar] [CrossRef]
- Healy, J. Housing, Fuel Poverty and Health: A Pan-European Analysis; Ashgate: Aldershot, UK, 2004; Available online: https://www.routledge.com/Housing-Fuel-Poverty-and-Health-A-Pan-European-Analysis/Healy/p/book/9781138266629 (accessed on 11 January 2022).
- Thomson, H.; Snell, C. Quantifying the prevalence of fuel poverty across the European Union. Energy Policy 2013, 52, 563–572. [Google Scholar] [CrossRef]
- Bouzarovski, S.; Herrero, S.T. The energy divide: Integrating energy transitions, regional inequalities and poverty trends. Eur. Urban Reg. Stud. 2017, 24, 69–86. [Google Scholar] [CrossRef]
- Karpińska, L.; Śmiech, S. On the Persistence of Energy Poverty in Europe: How Hard Is It for the Poor to Escape? Energy Econ. 2020, 1, 1–5. [Google Scholar] [CrossRef]
- Tundys, B.; Bretyn, A.; Urbaniak, M. Energy Poverty and Sustainable Economic Development: An Exploration of Correlations and Interdependencies in European Countries. Energies 2021, 14, 7640. [Google Scholar] [CrossRef]
- Halkos, G.E.; Gkampoura, E.-C. Assessing Fossil Fuels and Renewables’ Impact on Energy Poverty Conditions in Europe. Energies 2023, 16, 560. [Google Scholar] [CrossRef]
- Halkos, G.E.; Gkampoura, E.C. Evaluating the effect of economic crisis on energy poverty in Europe. Renew. Sustain. Energy Rev. 2021, 144, 110981. [Google Scholar] [CrossRef]
- Huang, Z.; Ming, X.; Duan, H. Heterogeneous effects of energy poverty convergence in Europe. Energy Strategy Rev. 2022, 41, 100822. [Google Scholar] [CrossRef]
- Energy Community. Final Report. Study on Addressing Energy Poverty in the Energy Community Contracting Parties. DOOREIHP_poverty_122021%20.pdf, Vienna, Austria 2021. Available online: https://www.energy-community.org/regionalinitiatives/Transition/poverty.html (accessed on 10 January 2022).
- European Union. Directive 2009/72/EU of the European Parliament and of the council of 13 July 2009 concerning common rules for the internal market in electricity and repealing directive 2003/54/EU. Off. J. Eur. Union L 2009, 211, 55–93. Available online: https://eur-lex.europa.eu/legal-content/EN/ALL/?uri=CELEX:32009L0072 (accessed on 10 January 2022).
- European Union. Directive 2009/73/EC of the European Parliament and of the Council of 13 July 2009 concerning common rules for the internal market in natural gas and repealing Directive 2003/55/EU. Off. J. Eur. Union L. 2009. Available online: https://eur-lex.europa.eu/legal-content/EN/ALL/?uri=CELEX%3A32009L0073 (accessed on 10 January 2022).
- European Parliament and the Council. Directive 2012/27/EU of the European Parliament and of the Council of 25 October 2012 on energy efficiency, amending Directives 2009/125/EC and 2010/30/EU and repealing Directives 2004/8/EC and 2006/32/EC. 2012. Available online: https://eur-lex.europa.eu/legal-content/EN/TXT/PDF/?uri=CELEX:32012L0027&from=EN (accessed on 10 January 2022).
- European Parliament and the Council. Directive (EU) 2018/2002 of the European Parliament and of the Council of 11 December 2018 amending Directive 2012/27/EU on energy efficiency. 2018. Available online: https://eur-lex.europa.eu/legal-content/EN/TXT/?uri=CELEX%3A32018L2002&qid=1607602143441 (accessed on 10 January 2022).
- European Parliament and the Council. Directive (EU) 2018/844 of the European Parliament and of the Council of 30 May 2018 amending Directive 2010/31/EU on the Energy Performance of Buildings and Directive 2012/27/EU on energy efficiency. 2018. Available online: https://eur-lex.europa.eu/legal-content/EN/TXT/PDF/?uri=CELEX:32018L0844&qid=1613039731264&from=EN (accessed on 10 January 2022).
- Energy Community Secretariat. Outline of the Social Strategy in the Energy Community. 2013. Available online: https://energy-community.org/archive/news/2013/01/02.html (accessed on 3 April 2022).
- European Parliament and of the Council. Directive (EU) 2019/944 of the European Parliament and of the Council of 5 June 2019 on common rules for the internal market for electricity and amending Directive 2012/27/EU. 2019. Available online: https://eur-lex.europa.eu/legal-content/EN/TXT/?uri=CELEX%3A32019L0944&qid=1607599967481 (accessed on 10 January 2022).
- European Commission. The European. Green Deal–Communication from the Commission to the European Parliament, the European Council, the Council, the European Economic and Social Committee and the Committee of the Regions. Brussels, Belgium, 11 December 2019. COM (2019) 640 final. Available online: https://eur-lex.europa.eu/legal-content/PL/TXT/?uri=CELEX%3A52019DC0640 (accessed on 20 February 2022).
- European Commission. Clean Energy for all Europeans; Publications Office of the European Union: Luxembourg, 2019; Available online: https://oeuropa.eu/en/publication-detail/-/publication/b4e46873-7528-11e9-9f05-01aa75ed71a1/language-en (accessed on 20 February 2022).
- European Commission. Action Plan for the implementation of the European Pillar of Social Rights. Brussels, Belgium, 4 March 2021. COM/2021/102 final. Available online: https://ec.europa.eu/info/european-pillar-social-rights/european-pillar-social-rights-action-plan_en (accessed on 20 February 2022).
- Turai, E.; Schmatzberger, S.; Broer, R. Overview report on the energy poverty concept Energy poverty in the privately-owned, multi-family environment. Com Act 2021. Available online: https://comact-project.eu/pilot_content/overview-report-on-the-energy-poverty-concept/ (accessed on 20 February 2022).
- Hosan, S.; Rahman, M.; Karmaker, S.C.; Andrew, J.; Chapman, A.J.; Saha, B.B. Remittances and multidimensional energy poverty: Evidence from a household survey in Bangladesh. Energy 2023, 262A, 125326. [Google Scholar] [CrossRef]
- Barnes, D.F.; Khandker, S.; Samad, H. Energy poverty in rural Bangladesh. Energy Policy 2011, 39, 894–904. Available online: https://www.sciencedirect.com/science/article/pii/S0301-421500838-4 (accessed on 11 December 2022). [CrossRef]
- Hasanujzaman, M.; Omar, M.A. Household and non-household factors influencing multidimensional energy poverty in Bangladesh: Demographics, urbanization and regional differentiation via a multilevel modeling approach. Energy Res. Soc. Sci. 2022, 92, 102803. [Google Scholar] [CrossRef]
- Nguyen, T.T.; Nguyen, T.-T.; Hoang, V.-N.; Wilson, C.; Managi, S. Energy transition, poverty and inequality in Vietnam. Energy Policy 2019, 132, 536–548. [Google Scholar] [CrossRef]
- Nguyen, C.; Su, T.D. The influences of government spending on energy poverty: Evidence from developing countries. Energy 2022, 238A, 121785. [Google Scholar] [CrossRef]
- Zheng, X.; Wei, C.; Qin, C.; Guo, J.; Yu, Y.; Song, F.; Chen, Z. Characteristics of residential energy consumption in China: Findings from a household survey. Energy Policy 2014, 75, 126–135. [Google Scholar] [CrossRef]
- Zhou, S.; Teng, F. Estimation of urban residential electricity demand in China using household survey data. Energy Policy 2013, 61, 394–402. [Google Scholar] [CrossRef]
- Cheng, X.; Chena, J.; Jianga, S.; Daia, Y.; Zengd, J.; Shuaia, C.; Liue, J.; Lif, W.; Liuh, Y.; Kanga, X.; et al. Pursuing sustainable development goals: A review of renewable energy and poverty alleviation nexus. Environ. Dev. 2021, 40, 100679. [Google Scholar] [CrossRef]
- Cheng, X.; Shuai, C.; Liu, J.; Wang, J.; Liu, Y.; Li, W.; Shuai, J. Topic modelling of ecology, environment and poverty nexus: An integrated framework. Agric. Ecosyst. Environ. 2018, 267, 1–14. [Google Scholar] [CrossRef]
- Agyekum, E.B. Energy poverty in energy rich Ghana: A SWOT analytical approach for the development of Ghana’s renewable energy. Sustain. Energy Technol. Assess. 2020, 40, 100760. [Google Scholar] [CrossRef]
- Aristondo, O.; Onaindia, E. Inequality of energy poverty between groups in Spain. Energy 2018, 153, 431–442. [Google Scholar] [CrossRef]
- Faiella, I.; Lavecchia, L. Energy Poverty in Italy. Politica Econ. Soc. Ed. Il Mulino 2015, 1, 27–76. [Google Scholar] [CrossRef]
- Scarpellini, S.; Rivera-Torres, P.; Suárez-Perales, I.; Aranda-Usón, A. Analysis of energy poverty intensity from the perspective of the regional administration: Empirical evidence from households in southern Europe. Energy Policy 2015, 86, 729–738. [Google Scholar] [CrossRef]
- Scarpellini, S.; Hernández, M.A.S.; Moneva, J.M.; Portillo-Tarragona, P.; Rodríguez, M.E.L. Measurement of spatial socioeconomic impact of energy poverty. Energy Policy 2019, 124, 320–331. [Google Scholar] [CrossRef]
- Sanchez-Guevara, S.C.; Mavrogianni, A.; Gonzalez, N.F.J. On the minimal thermal habitability conditions in low income dwellings in Spain for a new definition of fuel poverty. Build. Environ. 2016, 114, 344–356. [Google Scholar] [CrossRef]
- Phimister, E.; Vera-Toscano, E.; Roberts, D. The dynamics of energy poverty: Evidence from Spain. Econ. Energy Environ. Policy 2015, 4, 153–166. [Google Scholar] [CrossRef]
- Karpińska, L.; Śmiech, S. Breaking the cycle of energy poverty. Will Poland make it? Energy Econ. 2021, 94, 105063. [Google Scholar] [CrossRef]
- Kyprianou, D.K.; Varo, A.S.; Gouveia, J.; Kopeva, D.; Murauskaite, L. Energy poverty policies and measures in 5 EU countries: A comparative study. Energy Build. 2019, 196, 46–60. [Google Scholar] [CrossRef]
- Papada, L.; Kaliampakos, D. Development of Vulnerability Index for Energy Poverty. Energy Build. 2019, 183, 761–771. [Google Scholar] [CrossRef]
- Papada, L.; Kaliampakos, D. Measuring energy poverty in Greece. Energy Policy 2016, 94, 157–165. [Google Scholar] [CrossRef]
- Stojilovska, A.; Yoon, H.; Robert, C. Out of the margins, into the light: Exploring energy poverty and household coping strategies in Austria, North Macedonia, France, and Spain. Energy Res. Soc. Sci. 2021, 82, 102279. [Google Scholar] [CrossRef]
- Simcock, N.; Frankowski, J.; Bouzarovski, S. Rendered invisible: Institutional misrecognition and the reproduction of energy poverty. Geoforum 2021, 124, 1–9. [Google Scholar] [CrossRef]
- Thomson, H.; Simcock, N.; Bouzarovski, S.; Petrova, S. Energy poverty and indoor cooling: An overlooked issue in Europe. Energy Build. 2019, 196, 21–29. [Google Scholar] [CrossRef]
- Karpinska, L.; Śmiech, S. Conceptualising housing costs: The hidden face of energy poverty in Poland. Energy Policy 2020, 147, 111819. [Google Scholar] [CrossRef]
- Bosch, J.; Palència, L.; Malmusi, D.; Marí-Dell’Olmo, M.; Borrell, C. The impact of fuel poverty upon self-reported health status among the low-income population in Europe. Hous. Stud. 2019, 34, 1377–1403. [Google Scholar] [CrossRef]
- Schislyaeva, E.R.; Saychenko, O.A. Evaluation of post COVID-19 energy poverty and global trading impact on energy affordability. Front. Energy Res. 2022, 10, 971122. [Google Scholar] [CrossRef]
- Boardman, B. Fuel Poverty: From Cold Homes to Affordable Warmth; Belhaven Press: London, UK, 1991. [Google Scholar]
- Hills, J. Fuel Poverty: The Problem and its Measurement. Interim Report of the Fuel Poverty Review; Case Report; Centre for Analysis and Social Exclusion: London, UK, 2011; p. 69. [Google Scholar]
- Trinomics. Selecting Indicators to Measure Energy Poverty. 2016. Available online: https://ec.europa.eu/energy/sites/ener/files/documents/Selecting%20Indicators%20to%20Measure%20Energy%20Poverty.pdf (accessed on 10 March 2022).
- Charlier, D.; Legendre, B. Fuel poverty in industrialized countries: Definition, measures and policy implications a review. Energy 2021, 236, 121557. [Google Scholar] [CrossRef]
- Nussbaumer, I.; Bazilian, M.; Modi, V. Measuring energy poverty: Focusing on what matters. Renew. Sustain. Energy Rev. 2012, 16, 231–243. [Google Scholar] [CrossRef]
- Sadath, A.C.; Acharya, R.H. Assessing the extent and intensity of energy poverty using multidimensional energy poverty index: Empirical evidence from households in India. Energy Pol 2017, 102, 540–550. [Google Scholar] [CrossRef]
- Alkire, S.; Foster, J.E.; Seth, S.; Santos, M.E.; Roche, J.M.; Ballon, P. Multidimensional poverty measurement and analysis, ch. 2 and 7. OPHI Work. Pap. 2015, 82, 1–33. [Google Scholar]
- Alkire, S.; Apablaza, M. Multidimensional poverty in Europe 2006–2012: Illustrating a methodology. In Monitoring Social Inclusion in Europe; Atkinson, A.B., Guio, A.C., Marlier, E., Eds.; Publications Office of the European Union: Luxembourg, 2017; pp. 225–238, Eurostat; Available online: https://ec.europa.eu/eurostat/web/products-statistical-books/-/ks-05-14-075 (accessed on 20 April 2022).
- Bollino, C.A.; Botti, F. Energy poverty in Europe: A multidimensional approach. PSL Q. Rev. 2017, 70, 283. [Google Scholar]
- Rodriguez-Alvarez, A.; Lorka, M.; Jamasb, T. Alleviating energy poverty in Europe: Front-runners and laggards. Energy Econ. 2021, 103, 105575. [Google Scholar] [CrossRef]
- van Hove, W.; Dalla Longa, F.; van der Zwaan, B. Identifying predictors for energy poverty in Europe using machine learning. Energy Build. 2022, 264, 112064. [Google Scholar] [CrossRef]
- Healy, J.D.; Clinch, J. Quantifying the severity of fuel poverty, its relationship with poor housing and reasons for non-investment in energy-saving measures in Ireland. Energy Pol 2004, 32, 207–220. [Google Scholar] [CrossRef]
- Bouzarovski, S.; Thomson, H.; Cornelis, M. Confronting Energy Poverty in Europe: A Research and Policy Agenda. Energies 2021, 14, 858. [Google Scholar] [CrossRef]
- Streimikiene, D.; Lekavičius, V.; Baležentis, T.; Kyriakopoulos, G.L.; Abrhám, J. Climate change mitigation policies targeting households and addressing energy poverty in European union. Energies 2020, 13, 3389. [Google Scholar] [CrossRef]
- Hellwig, Z. Application of the Taxonomic Method to the Countries Typology According to Their Level of Development and the Structure of Resources and Qualified Staff. Przegląd Stat. 1968, 4, 307–326. [Google Scholar]
- Kukula, K.; Bogocz, D. Zero Unitarization Method and Its Application in Ranking Research in Agriculture. Econ. Reg. Stud. 2014, 7, 5–13. [Google Scholar]
- Guzowska, M.K.; Kryk, B. Efficiency of Implementing Climate/Energy Targets of the Europe 2020 Strategy and the Structural Diversity between Old and New Member States. Energies 2021, 14, 8428. [Google Scholar] [CrossRef]
- Kukuła, K. The Method of Zero Unitarization in the Background of Chosen Normalization Methods. Acta Sci. Acad. Ostroviensis 1999, 4, 5–31. [Google Scholar]
- Frankel, J. Why Are Commodity Prices Falling? 2014. Available online: https://www.project-syndicate.org/commentary/commodities-oil-falling-prices-by-jeffrey-frankel-2014-12 (accessed on 20 September 2022).
- Sanchez-Torija, J.G.; Fernandez Nieto, M.A. Reviewing energy poverty from Spain. Towards an enriched framework. Inf. Construcción 2022, 74, 1–10. [Google Scholar] [CrossRef]
- International Labour Office. Decent work in Portugal 2008–18 From crisis to recovery. Geneva 2018. Available online: https://www.ilo.org›publication›wcms_646867 (accessed on 2 November 2022).
- Koďousková, H.; Bořuta, D. Energy poverty in Slovakia: Officially defined, but misrepresented in major policies. Energy Policy 2022, 168, 113095. [Google Scholar] [CrossRef]
- Bouzarovski, S.; Herrero, S.T. The European Energy Divide Connecting Energy Transitions with Regional Inequalities. L′Europe Form. 2015, 4, 39–63. Available online: https://www.cairn.info/revue-l-europe-en-formation-2015-4-page-39.htm (accessed on 20 October 2022). [CrossRef]
- Braubach, M.; Ferrand, A. Energy efficiency, housing, equity and health. Int. J. Public Health 2013, 58, 331–332. [Google Scholar] [CrossRef] [PubMed]
- National Energy Action. Developing a Social Energy Target in Europe Proposals for Bridging the “Energy Divide” and Putting Low-Income Households at the Heart of Europe’s Energy Future 2014; NEA: Newcastle upon Tyne, UK, 2014; Available online: https://jeanlambertmeorg.uk/wp-content/uploads/2014/10/Developing-a-Social-Energy-Target-in-Europe-NEA-24-10-2014.pdf (accessed on 20 October 2022).
- Trusewicz, I.; Niemcy: Ubóstwo energetyczne rośnie/Germany: Energy poverty is on the rise. Energy news. 2017. Available online: https://energia.rpl/energetyka/art10570671-niemcy-rosnie-ubostwo-energetyczne (accessed on 20 November 2022). (In Polish).
- Henger, R.; Stockhausen, M.; Energiearmut: Jeder Vierte gibt mehr als zehn Prozent. Pressemitteilung. 2022. Available online: https://www.iwkoeln.de/presse/pressemitteilungen/ralph-henger-maximilian-stockhausen-jeder-vierte-haushalt-gibt-mehr-als-zehn-prozent-seines-einkommens-fuer-energie-aus.html (accessed on 20 November 2022).
- Wehrmann, B.; Energy poverty increasingly affecting Germany′s middle class. Clean Energy Wire. 2022. Available online: https://www.cleanenergywire.org/news/energy-poverty-increasingly-affecting-germanys-middle-class-analysis (accessed on 20 November 2022).
- Kryk, B. Realization of the social goals of the Europe 2020 strategy in the countries of the former Eastern Bloc. Public Policy Adm. 2017, 16, 616–627. [Google Scholar] [CrossRef]
- Guzowska, M.K.; Kryk, B. Implementation of the social goals of the Europe 2020 strategy by EU member states. Eur. Res. Stud. J. 2020, 4, 1213–1229. [Google Scholar] [CrossRef]
Disclaimer/Publisher’s Note: The statements, opinions and data contained in all publications are solely those of the individual author(s) and contributor(s) and not of MDPI and/or the editor(s). MDPI and/or the editor(s) disclaim responsibility for any injury to people or property resulting from any ideas, methods, instructions or products referred to in the content. |
© 2023 by the authors. Licensee MDPI, Basel, Switzerland. This article is an open access article distributed under the terms and conditions of the Creative Commons Attribution (CC BY) license (https://creativecommons.org/licenses/by/4.0/).