Abstract
The article presents the results of research on the trajectory and amplitude values during the startup of a vibrating screen, depending on the set startup time. The research was conducted using a suspended vibrating screen with a segmental vibration trajectory, where vibration excitation was achieved through two vibratory motors directly attached to the screen frame. The vibratory motors were powered with three-phase voltage and connected to the grid through frequency converters, allowing for current control in steady-state and startup conditions. The analysis focused on the vibration trajectory and the resulting amplitude values for nine selected startup times (ranging from 0 s to 8 s). Two measurement methods were employed: using piezoelectric acceleration sensors and optical recording. Additionally, the momentary power consumption by the screen drive was recorded, and the maximum current flowing in the power supply circuit was determined. These studies enabled the determination of the most favourable startup parameters that reduce the power demand of the drive without significantly affecting the kinematic parameters of the screen during its startup. The results of experimental research presented in the article regarding the startup time of the screening machine and its influence on vibration parameters have shown that the startup time significantly impacts the amplitude values that occur during startup. In the analysed case, the most favourable startup time was 3 s. Power consumption studies during startup revealed that startup time has a notable influence on momentary power consumption. The conducted research demonstrated that for startup times below 0.2 s, the maximum momentary power was the highest (reaching 5 kW, with a current consumption of 4.5 times the rated current). Regarding energy efficiency, the most favourable startup times exceed 2.0 s. Extending these startup times can significantly reduce the power demand of the drive, even up to threefold, thereby enabling the selection of motors with much lower power ratings.
1. Introduction
The fundamental operation in material enrichment processes is the screening process. This process enhances the material’s utility, allowing for the attainment of a uniform grain composition [1,2,3]. In most industrial sectors, screens are used for this purpose. One of the basic types of screens is the super-resonance vibrating screen [4], which has undergone numerous modifications [5,6,7] to improve process efficiency, reduce noise levels, and minimize dynamic effects on the foundation or supporting structures [8]. Presently, the way to reduce energy consumption during the screening process is a significant concern. In the 21st century, vibrating screens with circular (WK) and linear (WP) vibrations are the most prevalent types of screens, whereas screens with elliptical vibrations (PZ, PWE) are less common [9]. More complex trajectories are also utilized to enhance screening efficiency, albeit at the expense of a more intricate drive system [10,11]. The product range of the manufacturers also encompasses vibrating flip-flow screens (VFFS), which, due to their slightly different design, are extensively employed for the separation of highly viscous and fine materials [12,13].
The primary component of any super-resonance screen is the sieve frame set in vibrating motion along a defined trajectory. Elastic support systems are employed to reduce dynamic effects on the foundation [14]. The vibrating motion of the sieve frame is driven by a drive system, typically consisting of an electric motor, flexible couplings, and an inertia vibrator or vibratory motors [15,16], occasionally electromagnetic ones [17]. In super resonant screens in which an inertial vibrator generates vibrations, the value of the vibration amplitude depends on the mass of elements (weights) attached to the vibrator shafts (or unbalanced masses in the vibration motor). However, the vibration frequency depends on the type of engine used (its rotational speed) or the method of power supply and control (e.g., use of a frequency converter). Most inertia vibrators offer the option to adjust the force applied to induce vibrations by adding or subtracting additional unbalanced masses or altering the configuration of unbalanced masses [9].
The operation of a screening machine can be divided into three stages: startup [16], steady-state operation [15], and shutdown. The startup phase refers to the period from the drive initiation until the rated vibration frequency is reached and the parameters of the sieve frame vibrations stabilize. This phase is particularly critical in selecting the screen’s mechanical parameters and the electrical parameters of its drive, as the screen passes through the resonance frequency during this period, which can potentially have destructive effects on the equipment. The starting time is an important parameter that affects the values of the vibration amplitude achieved during this phase of operation and the energy demand of the engines—which can be demonstrated by conducting appropriate tests.
The steady-state period represents a phase during which the screen maintains a stable vibration trajectory defined for a given technological process, while the shutdown phase is the time interval between the drive’s deactivation and the screen coming to a complete stop.
Screen drives consume power during the first two phases of operation. Such drives are designed to handle the startup torque, which is the most demanding in terms of power. During steady-state operation, the drive operates with a power level typically at 20–30% of the rated power. Using motors with excessive power reserves can adversely affect the power grid (significant reactive power) and increase the vibrating mass. In most cases, research on screens is limited to steady-state studies [15,18] and studies focused solely on the screening process using DEM simulations [19,20,21,22,23,24]. There are also attempts to develop vibration models that would consider the screened material’s influence on the vibration parameters. [25,26]. In order to aim for a reduction in the rated power of the drive, conducting startup research is crucial.
This research aims to determine the most favourable startup parameters that reduce the power demand of the drive without significantly affecting the kinematic parameters of the screen during its startup.
2. The Startup of a Linear Vibration Screener—Theoretical Analysis
During steady-state operation, vibratory screens operate at vibration frequencies several times higher than their natural resonance frequency. Compared to the mass of the screened material, the substantial mass of the riddle plate ensures the attainment of stable operating parameters despite fluctuations in material flow rate through the screener. The main challenge associated with operating at such vibration frequencies is passing through the resonant frequency during system startup and shutdown. Consequently, there is a highly unfavourable multiple increase in vibration amplitude compared to the steady-state condition [9]. Numerous scientists have analysed and researched these phenomena, enabling the determination of fundamental relationships that facilitate the estimation of the maximum amplitude value. Determining the maximum amplitude value allows for selecting an appropriate support system (suspension) for the screen, ensuring its trouble-free operation. Current capabilities for numerical simulations enable increasingly precise determination of vibration amplitudes appearing in transient states and the verification of theoretical models. In order to conduct theoretical analyses of the screen’s operation during startup, it was necessary to develop a physical model of the super-resonance screen with linear vibrations (WP)—this model is presented in Figure 1.
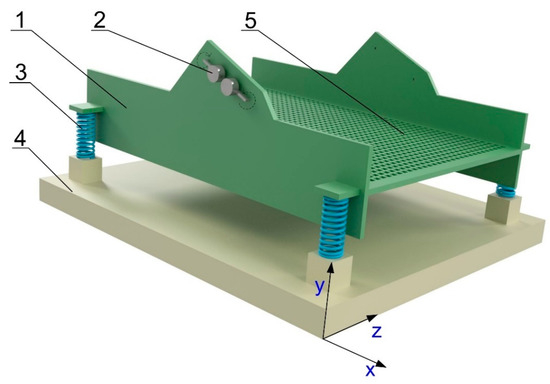
Figure 1.
Physical representation of the linear vibrating screen model utilized in the analysis: 1—riddle plate; 2—inertial vibrators; 3—spring support; 4—supporting structure; 5—screen surface.
Figure 2 presents the structural diagram of a two-mass inertial vibrator-supported screen. It consists of a screen with a mass of m1, supported by four springs with a spring constant of k/4, along with two unbalanced masses m0/2, acting as vibrators. The vibrator system is rigidly connected to the screen. It operates in a counter-directional motion, causing only inertial forces in the direction of I-I axis to act on the screen. The plane of the I-I axis passes through the centre of mass of the vibrating mass and the axis between the two vibrators. This direction is inclined to the horizontal by an angle α1. The analysis of such a system requires certain simplifying assumptions, where the direction of the acting driving force passes through the centre of mass of the screen, which is satisfied in the case of self-synchronization of the drive, and damping is neglected. Such a system performs linear motion, as no torsional moments causing rotary vibrations of the screen will occur. The value of the driving force acting in the I-I direction is determined by the formula:
where (Figure 2):
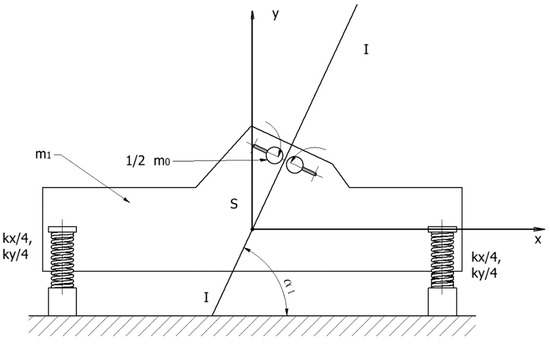
Figure 2.
Two-dimensional physical representation of a linearly vibrating screen model.
m1—mass of the riddle;
m0—unbalanced mass;
m—vibrating mass;
k—equivalent elastic modulus of the suspension along the x and y axes;
r0—eccentric radius of unbalanced mass;
α1—the angle of inclination of the I-I axis relative to the horizontal;
ω—vibration frequency;
t—time.
When decomposing this force into two components, we obtain:
After comparing with the value of the driving force and further transformation, we obtain the formula for the amplitude of vibrations in the x and y directions. The most significant, considering the interaction with the ground, is the formula for the y direction, which looks as follows:
After considering the formula for the natural frequency:
It is obtained:
On Figure 3, the amplitude of vibrations in the y-direction as a function of the frequency ratio ω/ω0 is shown.

Figure 3.
Theoretical amplitude response of vibrations in the y-axis (vertical) as a function of ω/ω0.
As seen from Figure 3, at the resonance frequency, the amplitude of the screen’s vibrations tends toward infinity, and beyond this frequency, it rapidly decreases and approaches a constant value. Assuming an operating range of the screen at least four times above the resonance, we can conclude that in the steady state, the vibration amplitude will be constant and equal to:
During startup, this amplitude will be higher and dependent on damping and primarily on the time and manner of passing through resonance. Amplitude studies during startup are presented in the article [16], although they did not account for the startup time and its impact on electrical power consumption.
3. Description of Test Stands and Applied Research Methods
The research was conducted at Department of Machinery Engineering and Transport. The object of the study was a WP screen with a linear trajectory of vibrations, with the screen suspended on a system of four steel cables attached to the screen on one side and to the elastic support system on the other. Vibrations with a linear trajectory were generated by a system of two vibratory motors, 3PH—6 poles type MVE 500/1E-50A0, with a power of 0.55 kW and a nominal speed of 1000 RPM (50 Hz). These motors are mounted on a frame attached to the screen above the screen deck. The engines have opposite rotational directions, and their close proximity allows for the occurrence of the “self-synchronization” effect of the vibrators. A view of this research station with the most important components marked is presented in Figure 4.
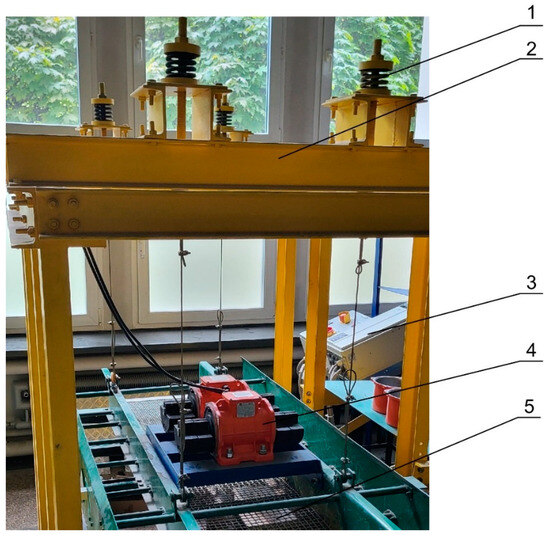
Figure 4.
View of the WP rectilinear vibration screen test stand. 1—spring support; 2—frame; 3—power and control system; 4—vibrating motors; 5—screen surface.
One of the research objectives was to demonstrate the impact of the preset startup time on the parameters of the vibrating screen’s motion. A frequency converter (variable frequency drive) Lenze AC Tech SMV ESV552 (Lenze: Hameln, Germany) with a power of 5.5 kW was used for startup. This converter increased the supply frequency from 0 to 50 Hz within a specified time frame in a linear manner. The applied power supply and control system (position 3—Figure 4) also enabled the measurement and recording of power using a digital three-phase wattmeter Metrix PX0120 (Metrix: Asnières-sur-Seine, France) and current intensity with a digital meter DPM V14 (DPM: Kowanówkowo, Poland). The measurement results presented in the article consider the energy consumed by the entire system, including the 50 W power consumption by the converter itself.
The study of vibrational motion was conducted using the experimental setup depicted in Figure 5. Vibration measurements using this setup were carried out using a three-axis PCB (piezoelectric) accelerometer, which was mounted on the screen of the screener. Accelerometers have many advantages and are often used for precise vibration measurements and in machine diagnostics [27,28,29,30]. The signal from the sensor was recorded by a NI9232 data acquisition card housed in a CompactDAQ (National Instruments Corporation: Austin, TX, USA) enclosure and then processed using custom software developed in the LabVIEW environment. The sampling frequency for all measurements was set at 1 kHz. This setup, where two accelerometers were employed, was also presented in a prior work [16].
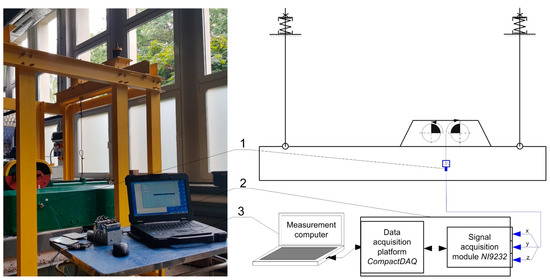
Figure 5.
View of the research stand and schematic of the vibration measurement system using an acceleration sensor: 1—three-axis acceleration sensor PCB 356A02; 2—measurement card; 3—measurement computer.
The investigation into the vibrating screen’s motion characteristics at the commencement of operation took place at a specific location on the screen deck (denoted as point 3 in Figure 5). This location (point) was aligned with the screen deck’s surface, coinciding with the plane perpendicular to the side of the sieve. This plane also served as the symmetrical axis of the drive system, running parallel to the vibrators’ axis.
Measuring vibration amplitude values and their trajectories using piezoelectric accelerometers (in the future referred to as electronic measurements) during the startup of a vibrating machine can result in significant measurement errors. These errors may arise from the need for double integration of the measured acceleration (to obtain displacement values). To derive displacement values in the program, a regression integration method was applied, necessitating the imposition of a high-pass filter to eliminate the DC component. However, the filter value should be set as low as possible to ensure that significant displacement (amplitude) data during startup are not omitted. Therefore, to unambiguously indicate the actual amplitude values and their trajectories, it was decided to conduct measurements optically, allowing for the verification of the results obtained using electronic methods. The additional measurement method enables the validation of the accuracy of measurements made with piezoelectric accelerometers.
The optical measurement was made possible by using a device attached to the screen with the help of neodymium magnets. This device generates two light points precisely spaced 10.0 mm ± 0.1 apart from each other. Subsequently, by employing appropriate lighting conditions (darkened environment) and using the Panasonic DMC-FZ1000 camera (Panasonic: Osaka Prefecture, Japan) (mounted on a tripod), an appropriately long exposure time (exceeding the startup time) was set to capture the trajectory of the light points (screen) during startup. Figure 6 shows a view of such a device with a fixed distance between the light points (on the left side), while on the right side, an example of the captured image during startup is presented, with the dimensions indicated.

Figure 6.
Measurement device with light points and a view of the captured image during measurement with overlaid measurements.
The figure’s maximum range of horizontal vibrations is denoted as Ax, and the full range of vertical vibrations is marked as Ay. These range values, provided in pixels, were determined using GIMP software (version 2.10.30). The highlighted value in blue (318 px) represents the known distance between the light points on the measuring device (10 mm), which allowed for a straightforward conversion of measured vibration ranges in pixels into values in millimetres with an accuracy of 0.1 mm.
4. Study of Vibrational Motion Parameters during the Startup of a Screen
The analysis of the vibrating screen during its startup focused on mechanical analysis (analysis of vibration trajectories) and electrical analysis (determination of power consumption during startup). These experiments were conducted for predetermined startup times, which were 0 s, 0.1 s, 0.2 s, 0.5 s, 1 s, 2 s, 3 s, 4 s, and 8 s.
4.1. Mechanical Analysis
The research aimed to answer the question of what high-pass filter values should be set to obtain the real values of maximum displacements (amplitudes) during startup and vibration trajectories. For this purpose, the motion parameters of the vibrating screen were studied using piezoelectric accelerometers, and then during the analysis of the results of these studies, a high-pass filter with the following values was applied: 1.0; 1.5; 2.0; 2.5; 3.0; 3.5; 4.0; 4.5; 5.0; and 5.5 Hz. For each filter variant and for each of the specified startup times, a trajectory of vibrations in the displacement coordinate system in the x and y directions was generated. The value of the applied filter significantly impacts the resulting displacement value and the obtained vibration trajectory.
Applying the optical measurement method made generating an actual image of the vibration trajectory possible, allowing for a comparison with the trajectories obtained by the electronic method. The optical measurements’ results, analysis (located in the top left corner), and plots of calculated trajectories for the applied high-pass filter values are presented in Figure 7, Figure 8, Figure 9, Figure 10, Figure 11, Figure 12, Figure 13, Figure 14 and Figure 15.
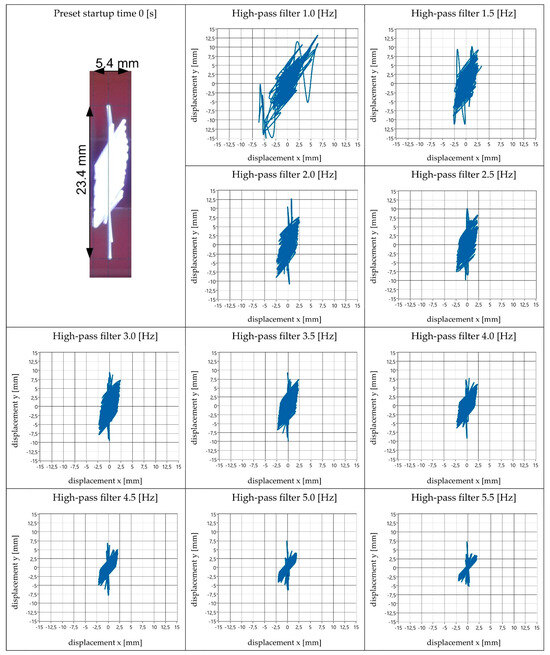
Figure 7.
View of obtained amplitude values and vibration trajectory shapes—startup time 0.0 s.
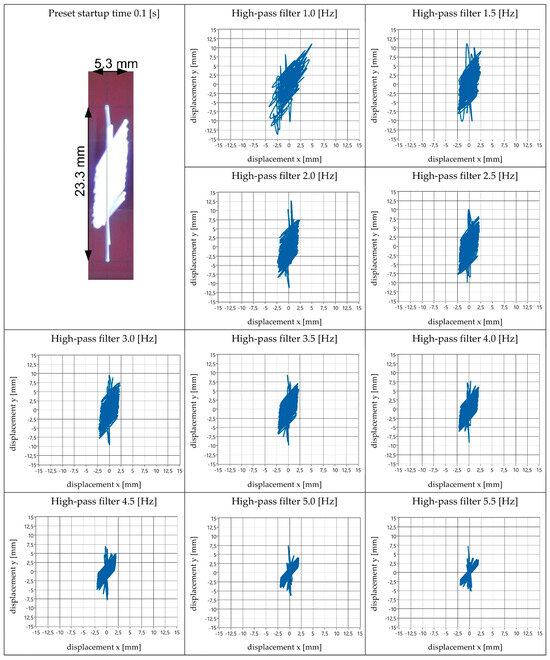
Figure 8.
View of obtained amplitude values and vibration trajectory shapes—startup time 0.1 s.

Figure 9.
View of obtained amplitude values and vibration trajectory shapes—startup time 0.2 s.
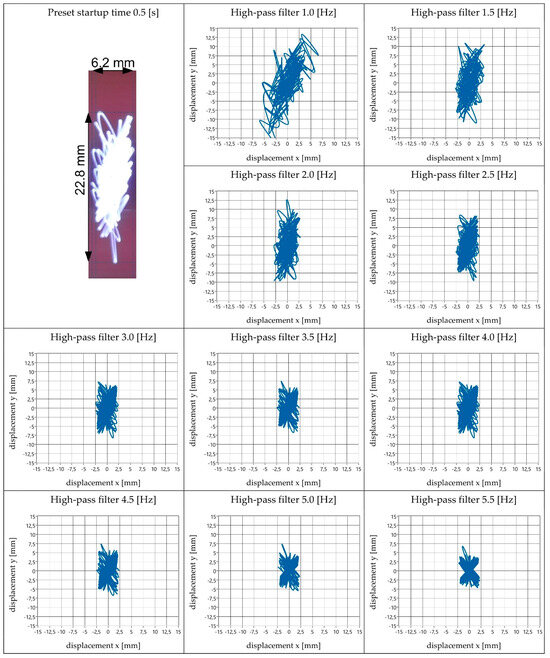
Figure 10.
View of obtained amplitude values and vibration trajectory shapes—startup time 0.5 s.
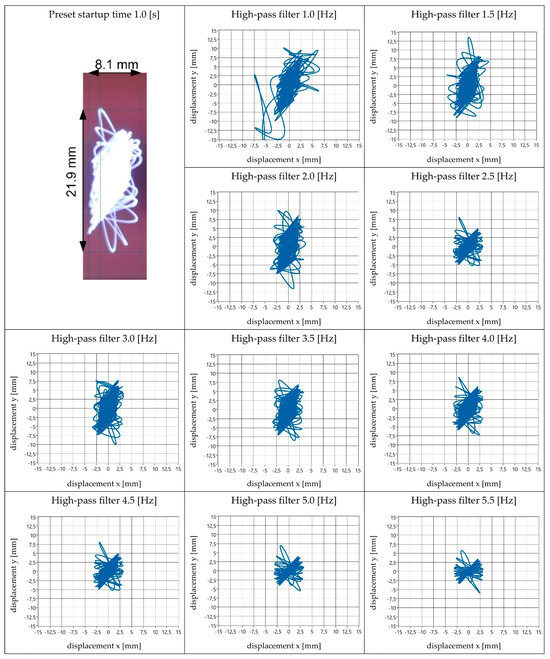
Figure 11.
View of obtained amplitude values and vibration trajectory shapes—startup time 1.0 s.
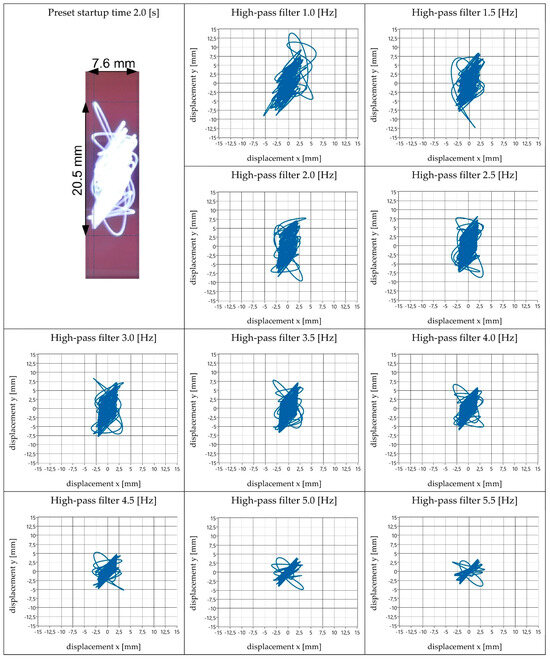
Figure 12.
View of obtained amplitude values and vibration trajectory shapes—startup time 2.0 s.
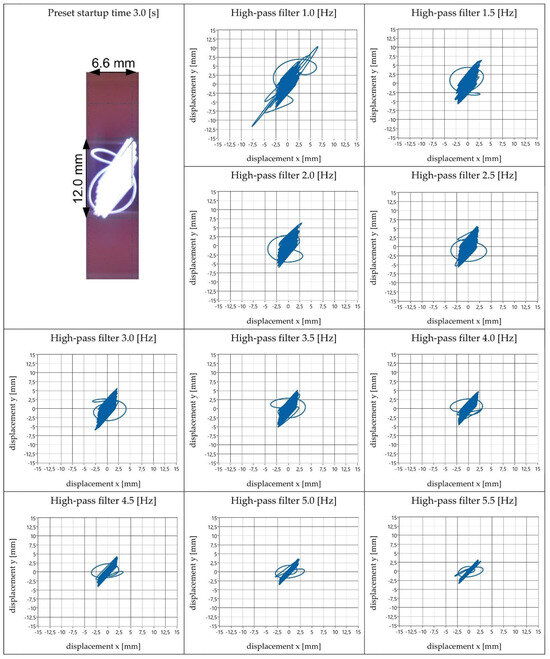
Figure 13.
View of obtained amplitude values and vibration trajectory shapes—startup time 3.0 s.

Figure 14.
View of obtained amplitude values and vibration trajectory shapes—startup time 4.0 s.

Figure 15.
View of obtained amplitude values and vibration trajectory shapes—startup time 8.0 s.
The results of the vibrating screen’s motion parameters for different startup time settings were analysed. The first stage of the analysis involved determining the maximum amplitude values in the x and y directions obtained by the electronic measurement method. These amplitude values represent the respective components of the generated vibration trajectory—the projection onto the coordinate system’s horizontal (Ax) and vertical (Ay) axes. Subsequently, an analysis was conducted to determine the high-pass filter value that provided the best representation (both qualitatively and quantitatively) of the obtained vibration trajectory to the actual values (i.e., results obtained by the optical method).
The results of this analysis are presented in the form of a table (Table 1). This table includes the following information: the values of Ax and Ay measured optically; the range of amplitude values variation in the x and y directions (for the full range of analysed high-pass filter values); and the value of the high-pass filter for the best representation of the vibration trajectory, as well as the obtained amplitude values when using this filter. The accuracy of the recorded amplitude values for both measurement methods is ±0.1 mm.

Table 1.
Compilation of obtained research results.
The analysis of the obtained research results, which is presented in Table 2, showed that the best representation of the real values of vibration amplitudes of the screen during its startup by using the accelerometer measurement method can be achieved by applying a high-pass filter with values ranging from 1.5 to 2.0 Hz. The highest relative errors for the selected filter values that provided the best representation of real results were related to the amplitude in the x direction (ranging from 3 to 20%). For the y direction, perfect agreement of results was achieved, with errors mostly ranging from 1 to 4%, except for one measurement (for a startup time of 4.0 s), where the error was 11%.
Table 2.
Maximum current and power values during start-up.
4.2. Power and Current Values during Start-Up
The second aspect of the conducted research involved measuring the current and power consumption of the screen drive during startup. Power was continuously measured and recorded, while the maximum current value was determined for current measurement. An example of the power consumption variation during the screen drive startup is shown in Figure 16.
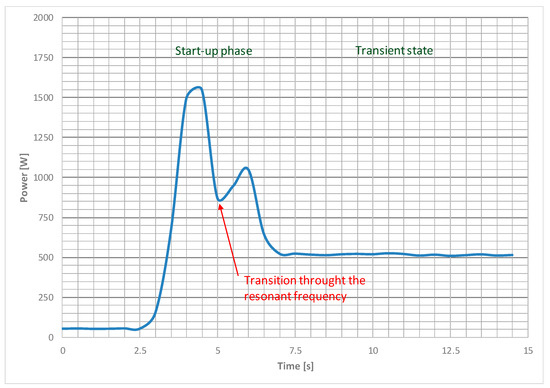
Figure 16.
Example chart of instantaneous power variation for a 4-s startup.
During the startup process, we can observe a significant initial increase in instantaneous power to its maximum value, resulting from the necessity of obtaining the required starting torque. Subsequently, as the system approaches its resonant frequency, there is a decrease in power consumption (a local minimum of power). To surpass this resonant frequency and transition to steady-state rotation, it is necessary to increase the torque once again, increasing power consumption. A noticeable reduction in instantaneous power is observed for longer startup times (above 2 s), while for shorter startup times, passing through the resonant frequency results in a change in the rate of power decrease. Table 2 presents the maximum current values recorded during startup and provides the maximum instantaneous power value.
The current and power remain constant for the first three startup times of 0 s, 0.1 s, and 0.2 s, with values around 4.5 A and 5 kW, which represents approximately 4.5 times the rated power. For longer startup times, the measured values decrease and are only slightly higher than the rated values. In steady-state operation, the screen drive consumes approximately 520 W of energy, which is half of the rated power.
5. Conclusions
The results presented in the article regarding the startup time of the screen and its impact on vibration parameters have led to the following conclusions:
- The measurements using three-axis acceleration sensors are subject to a small error only when the measurement method is calibrated correctly.
- The measurements can be calibrated using an optical method, allowing for the determination of correct maximum amplitude values obtained by electronic measurement.
- The initial calibration of the measurement system presented in the article (performed in the range from 1 to 5.5 Hz with a step of 0.5 Hz) allowed for obtaining measurement results with an accuracy ranging from 3 to 20% for the x-axis and up to 11% for the y-axis (up to 4% for eight out of nine analyzed startup times). The achieved measurement accuracy is very satisfactory, demonstrating the practical applicability of the proposed method in measuring vibrations of over-resonant vibrating screens. There is a possibility of improving the accuracy of the obtained results by conducting calibration tests with greater accuracy of the applied filter values (e.g., every 0.1 Hz).
- The research has shown that the startup time significantly impacts the maximum amplitude value, which can be up to seven times greater than in steady-state operation.
- Setting the screen startup time below 0.2 s does not affect the change in the screen’s vibration trajectory during startup, which is related to the insufficient startup torque of the drive.
- The most favourable startup profile for the screen was recorded for a startup time of 3 s, during which the lowest vibration amplitudes were obtained. This demonstrates that achieving the nominal rotational speed of vibrators as quickly as possible is not always the most advantageous approach in over-resonant vibrating machines.
The second part of the research focused on the impact of the set startup time on the energy parameters of the screen. The results of these studies indicate that the startup time significantly affects the maximum instantaneous power consumed by the screen. The following conclusions can be drawn from these studies:
- For startup times below 0.2 s, the maximum instantaneous power remains constant at approximately 5 kW (phase current of 4.5 A). This represents 4.5 times the rated power and falls within the permissible motor overload range. The lack of differences in the power values is most likely due to the insufficient startup torque of the motor, preventing startup in less than 0.2 s.
- Longer startup times significantly reduce the maximum instantaneous power consumption. A significant decrease was observed for startup times ranging from 0.5 to 2.0 s. Above this time range, the power consumption stabilizes at a level between 1.5 kW and 1.7 kW.
- The analysis of power consumption changes during startup (Figure 16) also identifies two stages of the screen startup: startup from 0 to the resonant frequency and from the resonant frequency to steady-state operation. When rotating at the resonant frequency, local minima of power consumption by the motors can be observed. This minimum is less pronounced for shorter startup times and is characterized by changes in the slope of the power curve (the rate of decrease).
- Regarding energy efficiency, the most favourable startup times are above 2.0 s. Using such startup times would allow for a threefold reduction in power consumption by the drive. Consequently, it would be possible to select motors with much lower power ratings, as low as 0.173 kW, thanks to the allowable fivefold overload of the drive (two engines) during startup (1.73 kW/5/2 = 0.173 kW). This value is lower than the steady-state power consumption of 0.52 kW (approximately 0.26 kW per motor). For the tested screen, with a 2.0 s startup, the drive size could be minimized to 0.3 kW motors (a 45% reduction in rated power), allowing for safe startup and operation at a power level close to the rated power.
The practical application of the results presented in this article contributes to the development of new guidelines for selecting drives for over-resonant vibrating screens. Such a well-matched drive will reduce environmental impact by reducing reactive power consumption, limiting the value of the resonance amplitude, as well as reducing operational and purchasing costs for the screen.
Author Contributions
Conceptualization, J.F. and P.T.; methodology, J.F. and P.T.; software, P.T.; validation, formal analysis, investigation, J.F. and P.T.; resources, J.F. and P.T.; data curation, J.F. and P.T.; writing—original draft preparation, J.F. and P.T.; writing—review and editing, P.T.; visualization, P.T. and J.F.; supervision, J.F.; project administration, J.F. and P.T.; funding acquisition, J.F. and P.T. All authors have read and agreed to the published version of the manuscript.
Funding
Works financed by the AGH University of Krakow.
Data Availability Statement
The data presented in this study are available on request from the corresponding author.
Acknowledgments
Thanks for technical support to Paweł Pawlik.
Conflicts of Interest
The authors declare no conflict of interest.
References
- Modrzewski, R. Przesiewacze Sitowe Materiałów Uziarnionych; Monografie Politechniki Łódzkiej, Nr 2339: Łódź, Poland, 2020. (In Polish) [Google Scholar]
- Feliks, J.; Filipowicz, A. Przesiewacze w wytwórniach mas mineralno-bitumicznych. Kopaliny 2008, 1, 73–75. (In Polish) [Google Scholar]
- Gawenda, T.; Stempkowska, A.; Saramak, D.; Foszcz, D.; Krawczykowska, A.; Surowiak, A. Assessment of Operational Effectiveness of Innovative Circuit for Production of Crushed Regular Aggregates in Particle Size Fraction 8–16 mm. Minerals 2022, 12, 634. [Google Scholar] [CrossRef]
- Sidor, J.; Feliks, J.; Mazur, M.; Tomach, P. Technika wibracyjna w przeróbce surowców mineralnych. In Mechanizacja, Automatyzacja i Robotyzacja w Górnictwie; Krauze, K., Ed.; AGH w Krakowie: Kraków, Poland, 2015; pp. 101–111. (In Polish) [Google Scholar]
- Makinde, O.A.; Ramatsetse, B.I.; Mpofu, K. Review of vibrating screen development trends: Linking the past and the future in mining machinery industries. Int. J. Miner. Process. 2015, 145, 17–22. [Google Scholar] [CrossRef]
- Trumic, M.; Magdalinovic, N. New model of screening kinetics. Miner. Eng. 2011, 24, 42–49. [Google Scholar] [CrossRef]
- Modrzewski, R.; Wodziński, P. Analysis of screening process of crushed basalt performed by a double-frequency screen. Physicochem. Probl. Miner. Process. 2013, 49, 81–89. [Google Scholar]
- Linhares, T.B.; Vimieiro, C.B.S. Analysis of the dynamic forces acting on a vibrating screen and its support structure using a scale model. Measurement 2021, 176, 109179. [Google Scholar] [CrossRef]
- Banaszewski, T. Przesiewacze; Wydawnictwo “Śląsk”: Katowice, Poland, 1990. (In Polish) [Google Scholar]
- Gursky, V.; Krot, P.; Korendiy, V.; Zimroz, R. Dynamic Analysis of an Enhanced Multi-Frequency Inertial Exciter for Industrial Vibrating Machines. Machines 2022, 10, 130. [Google Scholar] [CrossRef]
- Modrzewski, R.; Obraniak, A.; Rylski, A.; Siczek, K. A Study on the Dynamic Behavior of a Sieve in an Industrial Sifter. Appl. Sci. 2022, 12, 8590. [Google Scholar] [CrossRef]
- Yu, C.; Geng, R.; Wang, X. A Numerical Study of Separation Performance of Vibrating Flip-Flow Screens for Cohesive Particles. Minerals 2021, 11, 631. [Google Scholar] [CrossRef]
- Zhao, G.; Wang, X.; Lin, D.; Xu, N.; Yu, C.; Geng, R. Study of Double-Deck Vibrating Flip-Flow Screen Based on Dynamic Stiffness Characteristics of Shear Springs. Minerals 2021, 11, 928. [Google Scholar] [CrossRef]
- Yu, J.; Li, Z.; Zhang, Z.; Zhao, W.; Niu, Z.; Cheng, J. Vibration Test and Control of Factory a Building under Excitation of Multiple Vibrating Screens. Buildings 2022, 12, 607. [Google Scholar] [CrossRef]
- Tomach, P.; Feliks, J. Influence of the Type of Drive of the Laboratory Screen with Rectilinear Vibrations on the Parameters of Its Work in the Steady State; Nauka-Technologia-Technika Seria; Wydawnicza AGH: Kraków, Poland, 2021; Volume 2, pp. 161–176, (In Polish). [Google Scholar] [CrossRef]
- Feliks, J.; Tomach, P.; Foszcz, D.; Gawenda, T.; Olejnik, T. Research on the New Drive of a Laboratory Screen with Rectilinear Vibrations in Transient States. Energies 2021, 14, 8444. [Google Scholar] [CrossRef]
- Nuraliyev, A.; Ibadullayev, M. Research and development of resonant electromagnetic vibration screen for intensive vibration technologies. E3S Web Conf. 2020, 216, 01114. [Google Scholar] [CrossRef]
- Krot, P.; Shiri, H.; Dąbek, P.; Zimroz, R. Diagnostics of Bolted Joints in Vibrating Screens Based on a Multi-Body Dynamical Model. Materials 2023, 16, 5794. [Google Scholar] [CrossRef] [PubMed]
- Kryszak, D.; Bartoszewicz, A.; Szufa, S.; Piersa, P.; Obraniak, A.; Olejnik, T.P. Modeling of Transport of Loose Products with the Use of the Non-Grid Method of Discrete Elements (DEM). Processes 2020, 8, 1489. [Google Scholar] [CrossRef]
- Cheng, X.; Yang, H.; Yuan, L.; Lu, Y.; Cao, C.; Wu, G. Fault Feature Enhanced Extraction and Fault Diagnosis Method of Vibrating Screen Bearings. Machines 2022, 10, 1007. [Google Scholar] [CrossRef]
- Delaney, G.W.; Cleary, P.W.; Hilden, M.; Morrison, R.D. Testing the validity of the spherical DEM model in simulating real granular screening processes. Chem. Eng. Sci. 2012, 68, 215–226. [Google Scholar] [CrossRef]
- Chen, Z.; Tong, X.; Li, Z. Numerical Investigation on the Sieving Performance of Elliptical Vibrating Screen. Processes 2020, 8, 1151. [Google Scholar] [CrossRef]
- Lyu, Z.; Zhou, S. Research on spatial Lissajous trajectory vibrating screen. Adv. Mech. Eng. 2019, 11, 1687814019872851. [Google Scholar] [CrossRef]
- Peng, L.P.; Jiang, H.S.; Chen, X.H.; Liu, D.Y.; Feng, H.H.; Zhang, L.; Zhao, Y.M.; Liu, C.S. A review on the advanced design techniques and methods of vibrating screen for coal preparation. Powder Technol. 2019, 347, 136–147. [Google Scholar] [CrossRef]
- Moncada, M.; Rodriguez, C.G. Dynamic Modeling of a Vibrating Screen Considering the Ore Inertia and Force of the Ore over the Screen Calculated with Discrete Element Method. Shock. Vib. 2018, 2018, 1714738. [Google Scholar] [CrossRef]
- Gong, S.; Oberst, S.; Wang, X. An experimentally validated rubber shear spring model for vibrating flip-flow screens. Mech. Syst. Signal Process. 2020, 139, 106619. [Google Scholar] [CrossRef]
- Duda-Mróz, N.; Anufriiev, S.; Stefaniak, P. Application of Wavelet Filtering to Vibrational Signals from the Mining Screen for Spring Condition Monitoring. Minerals 2021, 11, 1076. [Google Scholar] [CrossRef]
- Ogonowski, S.; Krauze, P. Trajectory Control for Vibrating Screen with Magnetorheological Dampers. Sensors 2022, 22, 4225. [Google Scholar] [CrossRef]
- Rossi, A.; Bocchetta, G.; Botta, F.; Scorza, A. Accuracy Characterization of a MEMS Accelerometer for Vibration Monitoring in a Rotating Framework. Appl. Sci. 2023, 13, 5070. [Google Scholar] [CrossRef]
- Wu, T.; You, D.; Gao, H.; Lian, P.; Ma, W.; Zhou, X.; Wang, C.; Luo, J.; Zhang, H.; Tan, H. Research Status and Development Trend of Piezoelectric Accelerometer. Crystals 2023, 13, 1363. [Google Scholar] [CrossRef]
Disclaimer/Publisher’s Note: The statements, opinions and data contained in all publications are solely those of the individual author(s) and contributor(s) and not of MDPI and/or the editor(s). MDPI and/or the editor(s) disclaim responsibility for any injury to people or property resulting from any ideas, methods, instructions or products referred to in the content. |
© 2023 by the authors. Licensee MDPI, Basel, Switzerland. This article is an open access article distributed under the terms and conditions of the Creative Commons Attribution (CC BY) license (https://creativecommons.org/licenses/by/4.0/).