Abstract
With climate change advancing, the world’s target of zero deforestation by 2030 seems like a dream in Africa’s developing nations. This is because over 90% of households depend on wood fuels for their energy needs. Over the years, the decrease in natural rainforest area has been attributed to deforestation and forest degradation due to human activities, including the huge dependence on wood fuel for energy. Policies on clean energy production and imports to adapt to environmental and climatic implications are long overdue. This study hypothesized that Ugandans are willing to pay for alternative energies to conserve natural forests. The study aimed to examine the energy situation in Uganda and the willingness to pay for alternative energies (WTPEA) to reduce deforestation. This study conducted a dichotomous choice (DC) questionnaire for the willingness to pay for energy alternatives (WTPEA). This research used the questionnaire to collect the data, and a total of 1200 responses were collected and analyzed. The survey results showed that 80% of the respondents demonstrated a willingness to pay on average. The average willingness to pay amount (WTPA) was USD 15, and the median WTP was USD 10. Most of the respondents preferred gas and electricity for household cooking. The logistic regression results showed that their socioeconomic characteristics did not impact their hypothetical WTPEA. The willingness to pay for forest conservation (WTPFC) and the knowledge of forest functions and services were found to positively and significantly impact the WTPEA. The majority of the socioeconomic variables were found to very significantly influence the WTP amount. Furthermore, the WTPFC and charcoal fuel use were found to have a positive and very significant effect on the WTP for alternative energies. The Government of Uganda ought to employ policy tools to boost the imports and production of alternative energies in Uganda to save the depleting forests. This would promote and improve the conservation of virgin tropical rainforests, which are on the brink of extinction, and mitigate the dire climatic conditions.
1. Introduction
As the world targets zero deforestation by 2030, the drivers of deforestation are yet to be attended to, especially in the deforestation hotspots [1,2,3,4,5,6]. For example, Newton [1] noted how commodity value chains are devastating forests in the Amazon, and yet, policy tools to address such a serious cause of deforestation are yet to be adopted. Moreover, Glenday [5] decried tropical rainforest and biodiversity loss, which impact carbon storage and, therefore, the climate. The study attributed deforestation in the East African region to human activities and needs, including wood fuels.
Although much significant research has been performed on zero deforestation, key drivers of deforestation in Africa have not been fully explored, along with the possible solutions to them. Most studies have focused on the Amazon, where the problem is commodity-related, with many communities being displaced by commercial agricultural production. There is a similarity to the African context in that these situations affect forest-dependent communities, and regions are left with long-term socioeconomic and environmental effects such as climate change [1,2,3,4,5,6,7]. Newton [1] asserted that it is the smallholder and forest communities that suffer the consequences such as the loss of their livelihoods and extreme climate change from deforestation. However, in the long-run, the effects will catch up with the other regions.
Deforestation in the Tropical African region has severely reduced the forest cover and affected the provision and protection of forest functions and services, such as ecosystems, as well as biodiversity services, along with the consequent changes in the climatic seasons [7,8]. Wood fuels, roundwood production, and export form some of the biggest challenges [7,9]. Biomass is the most-substantial energy source for the majority of Uganda’s population [9,10]. Biomass accounts for about 90% of Uganda’s total primary household energy consumption, i.e., charcoal, firewood, and crop residues [9,11]. Electricity adds about 1.4% to the nationwide energy balance, whereas oil products for thermal power plants and vehicles cover approximately 9.7% [12]. The Ugandan Government increased electricity generation by installing 822 megawatts (MW) of capacity, with hydropower accounting for around 692 MW (84%) [11].
According to the World Bank [13], about 41.3% of the Ugandan population has access to electricity. Uganda’s electricity consumption per capita is one of the lowest worldwide, with over 215 kilowatts per hour (kWh) per capita per year. Africa stands at 552 kWh per capita, and the World average is 2975 per capita [13]. Uganda has economically and politically transformed the energy sector, and a new legal and regulatory agenda has formerly and precipitously transformed monopolies into private–public partnerships [12,14]. The Electricity Regulatory Authority (ERA) was established in 2000 to authorize and control the actions of all electricity operatives. Electricity demand is continuously growing at 10% annually, even though the operational capacity of hydroelectricity stands at 1072 MW, representing 80% of the current installation (Figure 1) [15]. This has led to irregular load shedding in the past few years as the supply cannot increase proportionally [16]. In 2012, Uganda had energy imports of 1,187,672 tonnes of oil equivalent (TOE), whereas the export amount (solely electricity) amounted to 8514 TOE [17].

Figure 1.
Current operational electricity capacity in Uganda (own analysis: data from ERA 2022 [15].
Since the 1990s, the forested area has diminished from 3,575,000 hectares (ha) to 2,337,000 ha in 2020. The same decrease shows that, from 1990 to 2010, about 19,360 square kilometers (km2) per annum, totaling 39% of the prevailing forest, vanished [18]. Currently, over 90,000 hectares (equal to 900 km2) of forest cover disappear per annum, which results in a wood fuel shortage in the rural parts and the swelling price levels of fuel and charcoal [19,20]. Previous studies suggested that such a diminishing trend in forested zones is due to both the production of wood for household fuel needs and domestic and export markets [9,18,21,22].
Charcoal is used for cooking among the town populations, while firewood for the rural population [9,23]. The high demand for uneconomical wood fuels results in the misuse and exhaustion of forests [9,10,21,22]. Even though there are numerous drivers of deforestation, wood fuel and demand play a significant role in the trend (Figure 2 and Figure 3). Moreover, illegal logging has increased amidst the forest conservation laws coupled with weak implementation by the authorities [9,24].

Figure 2.
Total roundwood and total wood fuel production (1961 to 2020), own analysis.
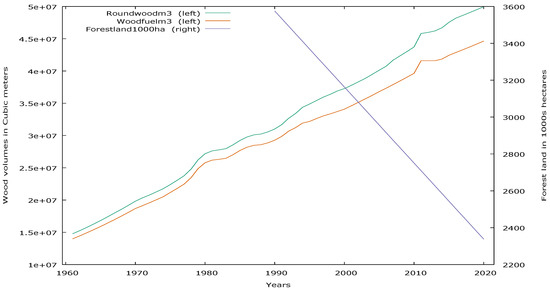
Figure 3.
Trend analysis of total roundwood, total wood fuel production, and forestland (1961 to 2020), own analysis.
Charcoal is mainly produced using poor techniques with tremendously low efficiency [25]. The government of Uganda’s efforts to employ market incentives to boost trade and demand for clean alternative energies comprise another problem [26,27]. Even though Uganda seems to have the best conservation and sustainable energy policies, putting some of them to work is a different matter. There appears to be a lack of coordination and uniformity and/or conflict between departments such as the Energy Ministry and the Uganda Revenue Authority, who collects taxes [26].
Government policies such as reducing taxes on renewable energy equipment and rural electrification schemes would increase electricity accessibility and other energy products, thus increasing supply and demand [9,23,28]. Consequently, such a direction would lead to reduced demand for wood fuels, which would lead to the conservation of forests given that the policies would boost the production and availability of renewable energy among other alternative energies in Uganda and other African countries [29,30,31].
This study aimed to investigate the energy situation in Uganda and the willingness to pay for alternative energies to reduce deforestation. The study hypothesized that Ugandans are willing to pay for alternative energies to conserve natural forests. The research question was: Are Ugandans willing to pay for alternative energies to help conserve forests, which are diminishing at a very high rate given the current climate change vulnerabilities in the country? The study used a dichotomous choice contingent valuation questionnaire to obtain the hypothetical WTPEA. Logistic and ordinary least-squares regression were used to understand the influences on the WTPEA and the willingness to pay amount (WTPA). The contingent valuation approach’s results are presented. The regression results and policy recommendations are discussed and demonstrated for policy- and decision-making regarding the energy needs of Uganda, as well as natural forest conservation to boost forest ecosystem functions and services.
The Energy Demand Situation in Africa
Access to a constant and safe energy supply is an essential driver of the development of the African economy [9,32,33]. Many Sub-Saharan African nations are on the less-developed economies worldwide index [34,35]. A considerable percentage of the African population has limited or no access to energy services, whereas those with reliable access encounter regular outages [34]. About two-thirds of the African population, almost 770 million people, have no access to electricity, and 95% of Africans cannot access better cooking facilities, for instance electricity or natural gas [9,35].
In recent years, improvements in access to electricity have progressively been implemented, but availability and affordability remain an issue. According to the African Energy Chamber (AEC)’s forecasts, energy generation is bound to increase if there is an increase in demand during the year, given the steady increase in COVID-19 lockdown restrictions and the opening of economies to global trade [36]. The concluding analysis is based on Africa’s aggressive push to increase the supply of electricity and other contemporary energy services in the Africa Agenda 2063 concerning energy and infrastructure growth [37]. The expansion of generation is anticipated to overtake the population development on the African continent.
The 2063 agenda anticipates that Africa will have 1.8 and 2.45 billion people by 2040 and 2050, respectively [38]. The estimated population is likely to have a higher demand for electricity and other energy sources, requiring increased programs to increase power generation and access for rural and urban dwellers. Although nuclear energy is about 2%, the percentage of renewables (REs) in the generation mix of Africa is increasing, notwithstanding that this is occurring at a slow pace compared to other regions [28].
It is apparent that the most-considerable percentage of REs is generated from geothermal power plants, wind, and solar, and this is projected to continue past 2030 [37]. Furthermore, in 2019, Africa installed 7236 megawatts (MW), 5748 MW, and 830 MW of solar, wind, and geothermal capacity, suggesting development rates of 60.2%, 26.1%, and 17.4%, respectively, from 2010 [39]. However, the UN General Assembly [37] shows that the growth of several REs in Africa is restricted to Northern and Southeastern Africa. Due to the deteriorating costs of critical REs’ technologies and the increased global concerns over CO2 emissions, the amount of renewables, primarily wind and solar energy, is predicted to rise by 1.5% yearly through to 2030 [37].
Concerning electricity consumption sectorially, the industrial sector is Africa’s major user, accounting for 41%, whereas 33% for residential, 18% for public services and commercial, and 4% for agriculture [40,41], as well as about 1% for transport and 3% for other uses. Concerning specific regions, South Africa and North Africa make up 70% of the continent’s electricity demand (Istituto Afari Internazionali [42]). However, achieving Africa’s energy demand revolution is problematic. Nevertheless, the agendas to meet the demand are limited by the infrastructure. Historically, with the high population growth rate, biomass and fossil fuels have been the most-accessible energy sources, worsening climate change with their growth [9,21,40,42,43]. Therefore, the prospects to meet the future energy needs consist of trade investments and approving new technologies to exploit Africa’s ample energy resources [8,9,44]. This is likely to reduce reliance on charcoal for urban inhabitants and firewood mostly for the rural population.
Recently, significant progress has been made in improving Africa’s energy and socioeconomic situation. However, the energy problem is far from any better given the environmental implications such as deforestation and climate change [9,36,37,38]. The African Union, through its Agenda 2063, and the UN, through the 2030 Agenda for Sustainable Development, as well as the common African position through the 2015 Development Agenda have designated the transformation of the socioeconomic framework, the modelling of climate change, and also, the objectives of the African nations [37]. The economic transformation relies on the energy transformation. African countries have a greater energy demand, but this is limited by accessibility. However, the International Energy Agency (IEA) anticipated that the population with no access to electricity was bound to increase in 2020/2021 due to the increase in poverty, triggered greatly by the COVID-19 lockdowns and barriers to trade [36]. Therefore, about 100 million Africans may not be able to afford to pay for these services. Furthermore, the Global Commission to End Energy Poverty (GCEEP) indicated that short- and long-term climate and sustainability goals to produce considerable environmental and socioeconomic benefits need to be considered. This must be reflected in the policies presently being advanced by African states and global institutions [8,9,45]. Currently and after COVID-19, worldwide access needs to be considered as essential for comprehensive economic recovery; a significant contributor to distributing reliable services in the education, water, and healthcare sector; and, when appropriately advanced, a vital step toward attaining a carbon-emission-free economy [36].
Uganda faces challenges in creating extra energy sources such as solar power and ensuring rural electrification due to the increased demand for electricity. The country has a meagre electrification rate with respect to the rest of Africa [12,15]. The rural electrification agency is following the 2013–2022 strategy of connecting around 1.4 million people to the primary grid. Uganda aims to achieve its main goal of total connection by 2035 [46]. Nevertheless, Uganda’s solar photovoltaic (PV) market segment has been steadily developing since the previous decade. The Government of Uganda has joined with other players, such as private investors [12]. The substantial increase in solar PV is instigated by the development of telecoms, enabling mobile payments and limited grid access in rural zones, but still at a small scale. Moreover, government policy actions, for example tax exemptions for wind and solar generation technology projects, support consumers to achieve the development of the energy sector [15,18]. However, numerous actors have criticized the arrangement of the mechanisms, which are poorly implemented, which often leads to further challenges.
2. Materials and Methods
2.1. Area of Study
The study was carried out in the capital of Uganda, Kampala Capital City, and its neighboring town of Wakiso. With the expansion of the capital city, the neighboring towns of Kampala have grown very fast, and most of them are now districts of their own. Both the capital city and its neighboring towns have had an increase in population over the years.
Kampala is located in the central region of Uganda and borders Lake Victoria. It is approximately 190 KM2 and is 1200 m above sea level. Kampala’s capital city holds about 1.5 million people and a metro population of about 6.8 million people. The Wakiso district borders Kampala and almost surrounds it in nearly all directions (Figure 4). It accommodates most of the metro population of the city.
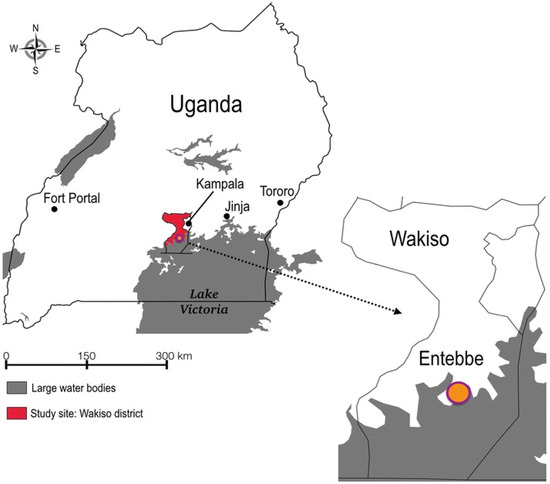
Figure 4.
Area of study: Wakiso and Kampala districts [47].
Both districts depend on charcoal and firewood fuel for their household needs, but mostly the former. This is mainly obtained in nearby and far away districts with extensive forests and transported by truck.
The research team identified the areas of study in the given districts, and the data collection tools were prepared. The research team chose 6 subdivisions/villages according to the administrative units in Uganda. Three were selected in Kampala and three in Wakiso. These areas/units were selected because of their populations and are mostly slums. Furthermore, the majority of households dominate use charcoal and wood fuels. Moreover, the urban areas depending on such energy have a high demand, which boosts the small and medium charcoal enterprises and other related businesses.
2.2. Contingent Valuation Method and Willingness to Pay
The contingent valuation method (CVM) has some drawbacks, such as bias. The study employed small talk to mitigate the bias associated with the method. The interviewers also talked to the respondents before answering the questions and expounded on the importance of their responses. Moreover, a question on the maximum WTP amount was asked.
The CVM determines either the willingness to pay (WTP) or the willingness to accept (WTA) through a questionnaire [48,49,50,51,52,53], as well as the payment amount for the public good/resource in question. Even though the CVM is tremendously widespread among investigators due to its advantages, for example the relative practicality of the system and the readiness to advance scenarios in which certain goods are given preference and value by the consumers or general public [53,54], the method has some disadvantages, such as a hypothetical bias, as some respondents give contradictory information, which can result in the attained WTP or WTA being underestimated [49,54,55,56].
The difference in the WTP and/or WTA is perhaps founded on whether certain goods are explicitly presented or as a portion of an extra comprehensive package, built on the nature and level of information offered to the respondent, and, finally, founded on the setup of the questions applied [47,49,57,58,59]. The possible disadvantages may be diminished by using some solutions, for instance the provision of a group of perceptions, comparative expenditure, cost data, and the quality of goods [60,61,62]. There are various WTP elicitation techniques, including bargaining or bidding formats, where one has to reject or accept the proposed WTP value and lower or higher bids based on one’s decision, and payment scale formats. A predefined list can be used as a source to capture respondents’ differing values regarding renewable energy to reduce emissions or save the environment [8,47,49,63].
Furthermore, there is an open-ended format where the respondent is not unprompted or unbounded to select the WTP value of his/her desired dichotomous choice, where the respondent rejects or accepts randomly assigned bids. Generally, under the CVM, households show a slightly lesser willingness to pay voluntarily, but back collective efforts toward renewable energy technologies [64,65,66]. Remarkably, families’ privately stated willingness to pay for renewable energy seems to be connected to what they observe others doing. Perceptions influence the WTP or WTA, e.g., [64,65], among other factors such as financing. Therefore, various options should be available when the policy is formulated and implemented [64,65,66].
2.3. Questionnaire Interviews
Numerous experts reviewed and corrected the structured questionnaire before deployment. The questionnaire was pretested to check and confirm the questions, their practical applicability, and the understanding of the respondents and the interviewer.
Face-to-face interviews were administered with the questionnaire. The study was conducted between December 2018 and May 2019. A total of 1200 questionnaires were filled, checked for completeness, coded, and analyzed using statistical software. A representative sample of the population was used. Each member of the population had an equal chance to participate in the study. This helped to reduce the bias that could be associated with the study.
The dichotomous choice questions (Yes or No) on the willingness to pay [67,68,69,70,71,72,73] for alternative energies (WTPEA): A dichotomous choice (DC) is when closed-ended questions with only two answers, yes or no, are provided to the respondents [70,71,72,73]. The DC was also applied to other variables, such as the willingness to pay for forest conservation (WTPFC) and knowledge of forest functions and services (KFF). Other questions asked about the preference for alternative energies (PEA), charcoal fuel use, and the willingness to pay an amount (WTPA). The research collected demographic data/characteristic information such as age, sex, marital status, economic activity/employment, and income.
The study hypothesized that Ugandans are willing to pay for alternative energies to conserve natural forests. The research’s main question was: Are Ugandans willing to pay for alternative energies to help conserve forests, which are diminishing at a very high rate given the current climate change vulnerabilities in the country?
The study asked the hypothetical question and the choice questions herein:
- Would you be willing to pay for an alternative sustainable energy source to change from firewood/charcoal and conserve forests? Yes or no.
- Which alternative energy source would you be willing to pay for if subsidized to change from firewood/charcoal use? 1. Gas, 2. hydroelectricity, 3. biogas, 4. others.
- How much would you be willing to pay per month?
2.4. Empirical Method
The study conducted a logistic regression following the CVM approach to model the WTPEA regarding demographic characteristics and the KFF, WTPA, and WTPFC. Logistic regression helps to understand the influence of explanatory variables on the WTPEA. Logistic regression is the most-appropriate method to study the relationship between categorical predictors and binary categorical variables in a study [74]. The study assumed that the WTPEA is either 1 or 0, thus the probability of the WTPEA effort in the selected residential areas of Wakiso and Kampala.
πi = probability (WTP) = 1 is related to the explanatory variable Z. The logistic regression is presented herein (Equation (1)).
Z is the vector of the explanatory variable that may impact the WTP. C is the intercept. is the vector of the coefficient, and is the odds ratio for the WTP, i.e., the probability of the willingness to pay and the likelihood of the unwillingness to pay. The study assumed the log of the odds to be a linear function of the explanatory variable, Z.
WTP estimation using contingent valuation method:
The contingent valuation method (CVM) is the most-used approach to estimate the value and/or price of non-market resources and products. This study followed these steps:
- Establishing the hypothetical market;
- Attainment of a bid of the WTP value;
- Approximating the average worth of the WTP;
- Establishing the WTP using the function WTP = f (A, S, E, I, EA, MS, KFF, PEA, CU).
The study further employed an ordinary least-squares (OLS) regression to estimate the WTPA amount and determine the factors that influence the value of the residents’ WTPEA in the selected districts in Uganda (Equation (2)). The variables are explained in Table 1. The summary statistics of some selected variables are also presented in Table 2.

Table 1.
Description of variables used in the study.
Table 2.
Summary statistics (observations 1–1200).
The subsequent equation demonstrates the OLS model.
3. Results
3.1. Socioeconomic Characteristics of the Respondents
Data were collected from household residents using a survey conducted by face-to-face interviews, which took place from December 2018 to May 22019. A sample of 1200 was interviewed; there were 772 (64%) who were males, while 428 (36%) were females. Most respondents were between 24 and 36 years (54% (650)), and 261 (22%) were between 36 and 48 years.
Moreover, 61% were employed, 54% were married, and 58% had at least 16 years of education. In comparison, 67% had over 16 years of education equivalent to a Bachelor’s degree, assuming no repeated classes. Other social demographic characteristics showed that 41% had incomes of approximately USD 700 per year and 32% about 2100 (Table 3).
Table 3.
Frequency distribution of the study variables.
3.2. Preference for Energy Alternatives and Willingness to Pay
Based on the discussions with the stakeholders, such as the leaders of the local councils and experts in the academic and business communities, the study selected 3 alternative energies to include in the questionnaire. Some of the reasons given by the respondents were what the possible alternatives to wood fuels are and which are hard to obtain and lead to the decline of forests and shrubs in Ugandan.
The hypothetical WTPEA results illustrated that 960 (80%) were willing to pay for the alternative energies monthly, and 236 (20%) were not willing to pay (Table 3 and Figure 5). The survey respondents’ results demonstrated that 59% (702) preferred gas for their household cooking, 34% (408) preferred hydroelectricity, and 8% (90) chose biogas (Table 3 and Figure 6 and Figure 7). The plot of the WTPEA against other variables also shows the distribution of the given variables against it (Figure 7).
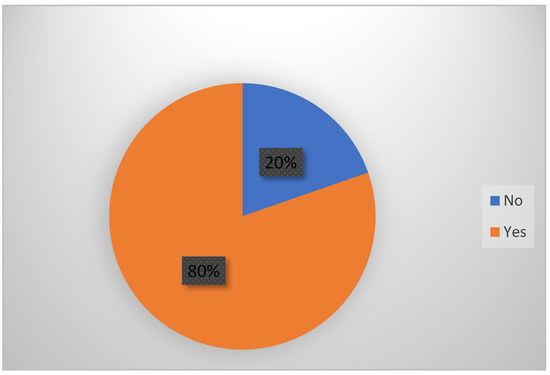
Figure 5.
Dichotomous choice results for the willingness to pay for alternative energies (WTPEA).
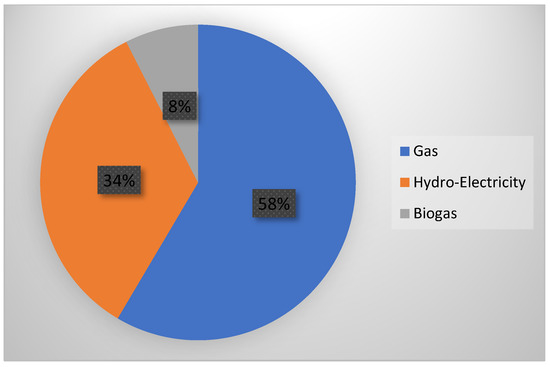
Figure 6.
Frequency distribution for the preference for alternative energies (PEA).
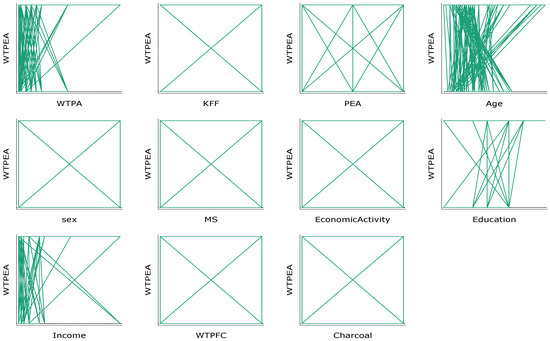
Figure 7.
Plot of the WTPEA against other variables.
There is a potential for bias regarding the WTP. The study mitigated this problem through a small talk approach where the interviewer conversed with the respondents before asking the WTP question. The talk included why using alternative energy sources is essential in efforts to conserve forests and fight deforestation.
Most respondents expressed their disappointment with the government in the management of forests and no effort to subsidize alternative energies to incentivize them through market forces. Most were willing to pay and use the alternative energies (Table 3). The majority (581 or 48%) of respondents were willing to pay up to USD 20, while 26% (300) and about 7% were willing to pay more than USD 50 for alternative energies monthly.
The summary statistics showed that an average of more than 80% were willing to pay the mean amount of USD 15 and the median payment USD 10. This corresponded with an average response of more than 87% with good knowledge of forest functions and services. The average age was 33 years, and the median was 31, showing that most respondents were young.
Moreover, 94% of the respondents used charcoal/wood fuel. This justifies why most were willing to pay for alternative energy sources to save the forests.
The logit regression results showed that the hypothetical WTPEA was not influenced by the socioeconomic factors (Table 4). However, gender was found to negatively influence the willingness to pay for alternative energies at 10% (Table) (Models 1 and 2). This influence was very weak, as indicated by the result (Table 4).
Table 4.
Determinants of the hypothetical willingness to pay for alternative energies (WTPEA).
The WTPEA was observed to be significantly influenced by the knowledge of forest functions and services (KFF) (p < 0.0001) and the willingness to pay for forest conservation (WTPFC) (Models 1 and 3 = p < 0.0006 and Model 2 = p < 0.0011) at 1%. This demonstrated very strong evidence against the null hypothesis (Table 4).
The preference for alternative energies and charcoal use were found not to impact the WTPEA (Table 4) significantly. Moreover, the willingness to pay amount was found to have a very weak positive, but significant influence on the WTPEA (Models 1 and 2).
The positive coefficient of the KFF (1.3) also demonstrated that an increase of the knowledge of forest functions and services increased the mean WTPEA by 1.3. Moreover, similar results were observed for the WTPFC (0.5), meaning that an increase in the willingness to pay for forest conservation increased the mean WTPEA by 0.5. Education (E), gender (S), and economic activity (EA) were found to have a very weak negative influence on the WTPEA and were not significant at all levels (Table 4).
3.3. Willingness to Pay Amount
The influencing factors of the WTPA presented very interesting results. Apart from the preference for alternative energies (PEA), the rest of the determinants positively impacted the WTPA. Economic activity was found to have the highest coefficient, 4.2%, followed by charcoal use at 4.0, the willingness to pay for forest conservation at 3.9%, gender at 2.3%, the knowledge of forest functions and services at 1.8%, and the willingness to pay for alternative energies at 1.4%. However, the knowledge of forest functions and services was insignificant throughout. This indicates the strength of the impact of the factors behind the WTPA. On the other hand, other socioeconomic factors such as age, marital status, education, and income had weak, but positive and significant influences on the WPTA (Table 5).
Table 5.
Determinants of the willingness to pay amount (WTPA).
Age (0.0001), economic activity (0.0001), gender (0.0020), income (0.0001), WTPFC (0.0001), and charcoal (0.0016) were found to be very significant at 1% and positive, respectively. The preference (PEA) and willingness to pay for alternative energies were significant at 10%, respectively, and education at 5%. However, the PEA had a negative influence. Marital status (MS) and the knowledge of forest functions and services (KFF) were found not to be significant (Table 5). The WTPA showed that most of the stated amounts were between USD 10 and USD 20, with a mid-point payment of USD 15. This represented 581 (48%) of the total respondents. Furthermore, USD <10 and the mid-point payment of USD 5 represented 306 (26%) of the total respondents. This means that 74% of the respondents were willing to pay an amount of USD 15 ceteris paribus (Table 2 and Figure 8 and Figure 9).
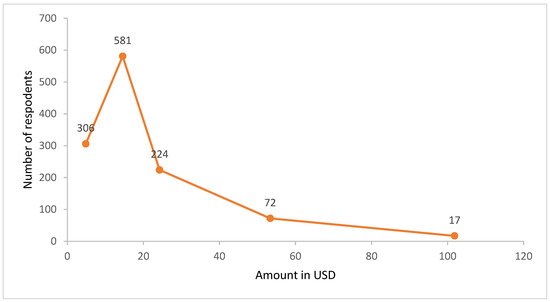
Figure 8.
Willingness to pay amount (WTPA).
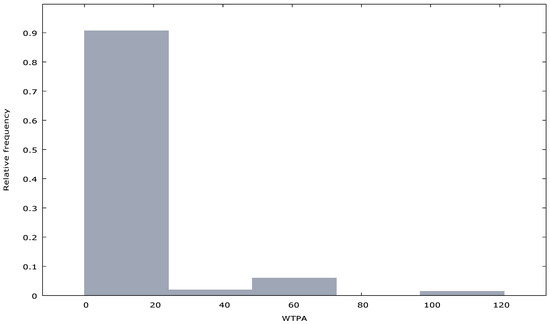
Figure 9.
Willingness to pay amount (WTPA) frequency.
There were 224 (19%) of the total respondents who offered between USD 20 and USD 30, with a cumulative percentage of 93%. Moreover, there were 72 (6%) and 17 (1%) who were willing to pay an amount between USD 50 and USD 60 and >100, respectively (Figure 8 and Figure 9).
The heterogeneity in the payment offers can be traced back or related to various characteristics such as low incomes, the young population, and other factors (Figure 10). The plot of the WTPEA amount paints the WTPA against demographic characteristics and other factors, such as the knowledge of forest functions and services (Figure 10) and the value the people attach to the environment represented in their hypothetical WTPEA and WPTFC.
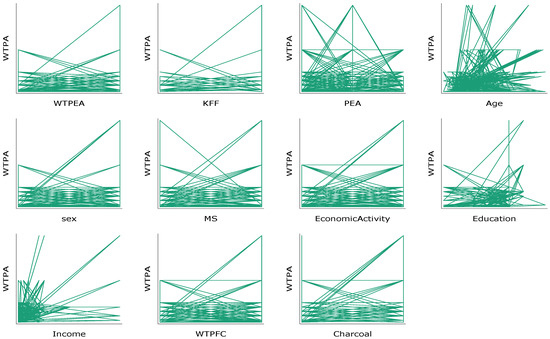
Figure 10.
Plot of the WTPA against other variables.
4. Discussion
The obtained results revealed the hypothetical and actual WTP by the stated amount, including among the unemployed, young and old, and low- and high-income groups. The study illustrated heterogeneity in the determinants of the WTPEA and WTPA. Socioeconomic variables that were seen not to impact the WTPEA were seen to impact the WTPA significantly. Previous studies have shown that the WTP is affected by many factors, including sociodemographic variables such as income, gender, age, and employment, among others [53,54,55,56].
The stated household willingness to pay for alternative energies of 80% was obtained, with a mean stated amount of USD 15 and USD 10 for the median. These results are in line with the results from previous studies, for example the willingness to pay for grid access (USD 9.6 to USD 22.3), solar lamps (USD 4.5 to 14.3), and small solar household systems (USD 7.1 to USD 15.3) in Sub-Sahara Africa [75]. Another similar trend of the determinants showed in a study from Kenya that the low-income earners would pay a huge amount of their incomes, while medium- and high-income people would pay a very small portion of their incomes. This leaves a very big gap for the four As (accessibility, availability, acceptability, and affordability), which calls for government intervention with its various policy tools to correct the associated externalities. Further similarities can be found in different studies, especially the WTP amounts and determinates; the studies noted incomes as a major factor (Table 6) [75,76,77,78,79,80].
Table 6.
WTP estimates’ comparison of the current study with previous studies from diverse regions.
This study, however, indicated a higher WTP than some of the previous studies from both Africa and other regions. On the other hand, the averages and/or majority of the WTP was similar (Table 6) [75,76,77,78,79,80]. Future studies in Uganda and other regions could focus on additional WTP for alternative energies. For Uganda’s case, it could be hard to measure additional WTP for specific sources given that the supply is still limited for all possible alternatives, including electricity and solar. Lee and Heo [78] illustrated global additional WTP estimates from various parts of the world. However, these were for developed countries, and the current problems with energy revolve around efficiency; furthermore, lately, security and price fluctuations and distortions have also contributed to the current problems.
On the other hand, the study noted other important factors, such as conserving the environment by contributing to reducing emissions, that significantly influence the WTP [8,29]. This study is also in line with some previous studies showing that Ugandans are willing to pay for clean energy and other environmentally friendly energy products rather than firewood [9,29]. Moreover, this study agreed with previous studies on wood fuel as the primary current source of energy in Uganda and Africa [9,28,29,30,31,32,33,34,35]. More than 90% of the respondents indicated that the households use charcoal or firewood. This is not by choice, but because there is no other available choice/alternative [9,28,29,30,31,32,33,34,35].
This study revealed that the current energy needs of Uganda heavily depend on wood fuels, which is in tandem with previous studies that attempted to study energy needs and the environment in Uganda and the surrounding regions [9,28,29,30,31,32,33,34,35]. Most of the related studies suggested that renewable energy is the way to go if countries such as Uganda and the region are to achieve sustainable development considering the role of energy in society. Of course, charcoal and firewood will meet the increasing population’s energy needs over time [9,30,31,32,33,34,35].
Both academics and civil society have recommended boosting renewables such as solar, hydropower, and biogas [9,23,24,25]. However, both the academic world and some government departments suggest that the Government of Uganda is not yet taking the energy needs as an essential issue, made worse at this point of no return given the rate of deforestation and climatic change in the region [9,10,11,15,17,26,27]. The UIA [27] and URA [26] documents showed a lack of coherency in the government policy. Civil society and the development partners face policy challenges such as the lack of clarity about taxes related to renewables, which delays projects and programs and may hinder future investments.
Already, there is a challenge for the majority of the population, which cannot afford the installation prices of renewable energy products such as solar and biogas tanks or bags [29,32,36,39,40,62]. Government intervention will have a significant impact on the future of renewables in Uganda and on saving forests, which are paying the price for our energy needs.
This study recommends first that future studies focus on choice experiments to obtain the best option for renewable alternative energies and products, as well as to maximize the perceptions of environmental conservation and sustainability.
The government of Uganda and the development partners ought to subsidize renewable energy products, production, and importation to boost access to lighting and household cooking energy products, hence removing the dependency on wood fuel. For example, tax reforms regarding renewables could lead to more investments in renewable energy, boost forest conservation, create a new value chain of retail and wholesale renewable energy products, and create jobs.
In conclusion, the Government of Uganda and its development partners should consider the impact of wood energy and roundwood trade/export. Regulating deforestation and forest degradation and supporting afforestation and reafforestation programs and projects without addressing the root causes of deforestation have led to a drastic decrease in the forested area, especially virgin tropical rainforest.
Therefore, financial and fiscal market policies, such as subsidies, grants, and other incentives, such as tax cuts for renewable energy products, will boost the economy and potentially allow achieving the 2030 zero deforestation target [81,82].
More than regulation is needed to succeed in achieving zero deforestation. The government of Uganda and its development partners need to invest in society’s needs such as energy, especially where people/households are willing to pay a monthly amount to access cleaner energy [83]. Otherwise, zero deforestation remains another dream and a political lie. Development partners ought to subsidize Africa to be able to access, accept, and afford alternative energies, among other climate-friendly products. This means that all stakeholders must actively become involved to achieve the dream of zero deforestation and reduce emissions:
- Train and obtain knowledge in the production and trade of renewables, especially the technical engineering needs.
- Subsidize renewable energy products so that developing nations, including Uganda, can afford to buy and use clean energy products and technology to save forests, which provide over 90% of the household cooking energy needs.
- Give tax incentives to companies exporting to developing countries.
5. Conclusions
Like many developing nations and Tropical Africa, Uganda depends on wood fuel for its household cooking energy needs. The trend for total wood fuels, such as charcoal and firewood production, is alarming. The deforestation and climate change targets such as zero deforestation in 2030 and the Green Deal 2050 may be a dream that cannot be achieved if nothing is done about the energy situations in developing nations.
This study investigated household cooking alternative energy (PEA) preferences. Moreover, the study estimated the willingness to pay for alternative energies to reduce the dependence on wood fuels for household cooking in Uganda. The study conducted a hypothetical and actual WTP study using the DC CVM approach and cost–benefit method. The questionnaire survey results showed that an average of 80% of the respondents showed the willingness to pay. The average willingness to pay amount (WTPA) was USD 15, and the median WTPA was USD 10 per month. Most of the respondents preferred gas and electricity for household cooking.
The hypothetical scenario’s results indicated that socioeconomic factors did not play a vital role in the willingness to pay for alternative energies. However, factors such as the knowledge of forest functions and services (KFF) and the willingness to pay for forest conservation (WTPFC) were found to be very significant in the WTPEA.
On the other hand, most socioeconomic variables significantly influenced the WTP amount, i.e., age, economic activity, gender, and income. The WTPFC and charcoal were found to have positive and very significant results.
The study recommends that, ceteris paribus, the Government of Uganda and its development partners consider policy tools and market incentives such as subsidies for cleaner energy production and tax relief for local producers, traders, and importers immediately. The availability of alternative energies and mixes will guarantee energy and food security. Some low-income families cook once a day due to poverty and the lack of energy sources, which is characterized by the high prices for charcoal and firewood. Moreover, this will also translate into relieving the current pressure on forests to supply the increasing energy demand of the country. This would promote and improve the conservation efforts of virgin tropical rainforests, which are on the brink of extinction given the already dire climatic conditions in the East African nation and the region.
Funding
This research received no external funding.
Data Availability Statement
Data can be obtained upon request from the author.
Acknowledgments
The author appreciates the anonymous Reviewers for their time and valuable comments.
Conflicts of Interest
The author declares no conflict of interest.
References
- Newton, P.; Benzeev, R. The role of zero-deforestation commitments in protecting and enhancing rural livelihoods. Curr. Opin. Environ. Sustain. 2018, 32, 126–133. [Google Scholar] [CrossRef]
- Lyons-White, J.; Pollard, E.H.; Catalano, A.S.; Knight, A.T. Rethinking zero deforestation beyond 2020 to more equitably and effectively conserve tropical forests. One Earth 2020, 3, 714–726. [Google Scholar] [CrossRef]
- Myers, N. Tropical forests: Present status and future outlook. Clim. Chang. 1991, 19, 3–32. [Google Scholar] [CrossRef] [PubMed]
- Rudel, T.; Roper, J. The paths to rain forest destruction: Cross-national patterns of tropical deforestation, 1975–1990. World Dev. 1997, 25, 53–65. [Google Scholar] [CrossRef]
- Glenday, J. Carbon storage and emissions offset potential in an East African tropical rainforest. For. Ecol. Manag. 2006, 235, 72–83. [Google Scholar] [CrossRef]
- Carodenuto, S. Governance of zero deforestation cocoa in West Africa: New forms of public–private interaction. Environ. Policy Gov. 2019, 29, 55–66. [Google Scholar] [CrossRef]
- CIFOR-ICRAF. Why Forests Matter: International Day of Forests 2022. 2022. Available online: https://www.cifor-craf.org/forests/?utm_campaign=CIFOR_ICRAF_Newsletter&utm_medium=email&utm_source=2022_MC_Newsletter_March (accessed on 1 June 2022).
- Bamwesigye, D.; Hlavackova, P.; Sujova, A.; Fialova, J.; Kupec, P. Willingness to pay for forest existence value and sustainability. Sustainability 2020, 12, 891. [Google Scholar] [CrossRef]
- Bamwesigye, D.; Kupec, P.; Chekuimo, G.; Pavlis, J.; Asamoah, O.; Darkwah, S.A.; Hlaváčková, P. Charcoal and wood biomass utilization in Uganda: The socioeconomic and environmental dynamics and implications. Sustainability 2020, 12, 8337. [Google Scholar] [CrossRef]
- Bamwesigye, D.; Darkwah, A.S.; Halvackova, P.; Kupcak, V. Firewood and charcoal production in Uganda. Int. Multidiscip. Sci. GeoConference SGEM 2017, 17, 521–528. [Google Scholar]
- ERA. Developments and Investment Opportunities in Renewable Energy Resources in Uganda, Electricity Regulatory Authority, Kampala. 2012. Available online: https://searchworks.stanford.edu/view/10676462 (accessed on 1 June 2022).
- USEA. Uganda Solar Energy Association Handbook on Solar Taxation, Uganda Solar Energy Association. 2019. Available online: https://www.uncdf.org/article/4949/uganda-solar-energy-association-solar-taxationhandbook (accessed on 1 June 2022).
- World Bank. Uganda: Support to Municipal Infrastructure Development Program—Additional Financing (P163515); World Bank: Washington, DC, USA, 2018. [Google Scholar]
- Electricity Regulatory Authority-ERA. Installed Capacity Summary. 2020. Available online: https://www.era.or.ug/index.php/stats/generation-statistics/installed-capacity (accessed on 1 June 2022).
- Electricity Regulatory Authority-ERA. Installed Capacity. 2022. Available online: https://www.era.go.ug/index.php/stats/generation-statistics/installed-capacity (accessed on 1 June 2022).
- UNEP. 2018 Global Status Report: Towards a ZeroEmission, Efficient and Resilient Buildings and Construction Sector. Report prepared for the Global Alliance for Building and Construction by the International Energy Agency and United Nations Environment Programme; UNEP: Nairobi, Kenya, 2018; Available online: https://wedocs.unep.org/20.500.11822/27140. (accessed on 14 January 2023).
- Biira, S.; Kilama, G. Analysis of solar radiation in Uganda (A case study of Kasese, Jinja and Soroti Districts). Int. J. Curr. Res. 2014, 6, 8110–8115. [Google Scholar]
- UECCC. Six Years of Steadily Providing Credit Support for Renewable Energy Projects, Uganda Energy Credit Capitalisation Company (UECCC) Magazine, V1. 2016. Available online: https://www.ueccc.or.ug/version2/storage/app/media/docs/UECCC_Magazine.pdf (accessed on 1 June 2022).
- UNDESA. 68% of the World Population Projected to Live In urban Areas by 2050, Says UN, United Nations Department of Economic and Social Affairs. 2018. Available online: https://un.org/development/desa/en/news/population/2018-revision-of-world-urbanization-prospects.htm (accessed on 1 June 2022).
- UBoS. Uganda: Demographic and Health Survey, Uganda Bureau of Statistics. 2016. Available online: https://www.ubos.org/wp-content/uploads/publications/07_2018UDHS_2016_FInal.pdf (accessed on 1 June 2022).
- Bamwesigye, D.; Boateng, K.A.; Hlaváčková, P. Timber and Wood production in Tropical African Virgin Forests. In Proceedings of the Public Recreation and Landscape Protection–With Nature Hand in Hand, Brno, Czech Republic, 10–11 May 2018; pp. 396–400. [Google Scholar]
- Bamwesigye, D.; Akwari, F.N.; Hlaváčková, P. Forest product export performance in tropical Africa: An empirical analysis. Forum Sci. Oecon. 2019, 7, 73–83. [Google Scholar]
- Du Can, S.R.; Pudleiner, D.; Jones, D.; Khan, A. Energy Efficiency Roadmap for Uganda: Making Energy Efficiency Count; Power Africa, Lawrence Livermore Berkeley National Laboratory: Tshwane, Gauteng; Berkeley, CA, USA, 2017. [Google Scholar]
- EnDev. Biogas Business Boost Benefitting Farmers (4B-F), Energising Development, Information Sheet. 2018. Available online: https://endev.info/content/Biogas_Business_Boost_Benefitting_Farmers_(4B-F) (accessed on 1 June 2022).
- Cumbers, A. Remunicipalization, the Low-Carbon Transition, and Energy Democracy, in Can a City Be Sustainable? (State of the World); Island Press: Washington, DC, USA, 2016; pp. 275–289. [Google Scholar] [CrossRef]
- URA. Guidance on Tax Implications/Tax Exemptions for Projects under FIT Program. 2014. Available online: file:///C:/Users/Dasty/Downloads/EA%2020.1%20Guidance%20Implications%202014%20Tax%20Amendments%202015.pdf (accessed on 1 June 2022).
- UIA. A Guide on Tax Incentives/Exemptions Available to Investors in Uganda; Uganda Investment Authority: Kampala, Uganda, 2019; Available online: https://www.ugandainvest.go.ug/wp-content/uploads/2016/03/A-Guide-on-IncentivesExemptions-available-Ugandan-Investors.pdf (accessed on 1 June 2022).
- Deichmann, U.; Meisner, C.; Murray, S.; Wheeler, D. The economics of renewable energy expansion in rural Sub-Saharan Africa. Energy Policy 2011, 39, 215–227. [Google Scholar] [CrossRef]
- Kabyanga, M.; Balana, B.B.; Mugisha, J.; Walekhwa, P.N.; Smith, J.; Glenk, K. Are smallholder farmers willing to pay for a flexible balloon biogas digester? Evidence from a case study in Uganda. Energy Sustain. Dev. 2018, 43, 123–129. [Google Scholar] [CrossRef]
- Willis, K.; Scarpa, R.; Gilroy, R.; Hamza, N. Renewable energy adoption in an ageing population: Heterogeneity in preferences for micro-generation technology adoption. Energy Policy 2011, 39, 6021–6029. [Google Scholar] [CrossRef]
- Nkundabanyanga, S.K.; Muhwezi, M.; Musimenta, D.; Nuwasiima, S.; Najjemba, G.M. Exploring the link between vulnerability of energy systems and social acceptance of renewable energy in two selected districts of Uganda. Int. J. Energy Sect. Manag. 2020, in press. [Google Scholar] [CrossRef]
- Aarakit, S.M.; Ssennono, V.F.; Adaramola, M.S. Estimating market potential for solar photovoltaic systems in Uganda. Front. Energy Res. 2021, 36, 602468. [Google Scholar] [CrossRef]
- Kaunda, C.S. Energy situation, potential and application status of small-scale hydropower systems in Malawi. Renew. Sustain. Energy Rev. 2013, 26, 1–19. [Google Scholar] [CrossRef]
- Akenji, L.; Bengtsson, M. Making sustainable consumption and production the core of sustainable development goals. Sustainability 2014, 6, 513–529. [Google Scholar] [CrossRef]
- UN Africa-Sustainable Development Knowledge Platform. Implementation of the United Nations Convention to Combat Desertification in Those Countries Experiencing Serious Drought and/or Desertification, particularly in Africa: Report of the Second Committee (A/70/472/Add.5). 2015. Available online: https://sustainabledevelopment.un.org/topics/africa/decisions. (accessed on 14 January 2023).
- Tomala, J.; Mierzejewski, M.; Urbaniec, M.; Martinez, S. Towards sustainable energy development in sub-Saharan Africa: Challenges and opportunities. Energies 2021, 14, 6037. [Google Scholar] [CrossRef]
- UN General Assembly. Transforming Our World: The 2030 Agenda for Sustainable Development. (A/RES/70/1). 2015. Available online: http://undocs.org/A/RES/70/1 (accessed on 1 June 2022).
- Suberu, Y.; Bashir, N.; Wazir, M. Overuse of wood-based bioenergy in selected sub-Saharan Africa countries: Review of unconstructive challenges and suggestions. J. Clean. Prod. 2015, 96, 501–519. [Google Scholar]
- Nzila, C.; Dewulf, J.; Spanjers, H.; Kiriamiti, H.; Van Langenhove, H. Biowaste energy potential in Kenya. Renew. Energy 2010, 35, 2698–2704. [Google Scholar]
- Mohammed, Y.S.; Mokhtar, A.S.; Bashir, N.; Saidur, R. An overview of agricultural biomass for decentralized rural energy in Ghana. Renew. Sustain. Energy Rev. 2013, 20, 15–25. [Google Scholar] [CrossRef]
- Mohammed, Y.S.; Mustafa, M.W.; Bashir, N. Status of renewable energy consumption and developmental challenges in Sub-Sahara Africa. Renew. Sustain. Energy Rev. 2013, 27, 453–463. [Google Scholar] [CrossRef]
- Istituto Afari Internazionali (IAI). European Centre for Development Policy Management (ECDPM). A New EU Strategic Approach to Global Development, Resilience and Sustainability; IAI Working Papers; IAI: Rome, Italy, 2016; ISBN 978-88-98650-94-1. [Google Scholar]
- Emodi, N.V.; Boo, K. Sustainable Energy Development in Nigeria: Overcoming Energy Poverty. Int. J. Energy Econ. Policy 2015, 5, 580–597. [Google Scholar]
- Adeyemi, K.O.; Asere, A.A. A review of the energy situation in Uganda. Int. J. Sci. Res. Publ. 2014, 4, 1–4. Available online: https://www.academia.edu/11433645/A_REVIEW_OF_THE_ENERGY_SITUATION_IN_UGANDA (accessed on 14 January 2023).
- Subedi, M.; Matthews, R.; Pogson, M.; Abegaz, A.; Balana, B.; Oyesiku-blakemore, J.; Smith, J. Can biogas digesters help to reduce deforestation in Africa? Biomass Bioenergy 2014, 70, 87–98. [Google Scholar] [CrossRef]
- Agar, B.; Renner, M. Is 100 percent renewable energy in cities possible? In Can a City Be Sustainable? State of the World; Worldwatch Institute, Island Press: Washington, DC, USA, 2016; pp. 161–170. [Google Scholar]
- Yegorov, S.; Galiwango, R.M.; Ssemaganda, A.; Muwanga, M.; Wesonga, I.; Miiro, G.; Kaul, R. Low prevalence of laboratory-confirmed malaria in clinically diagnosed adult women from the Wakiso district of Uganda. Malar. J. 2016, 15, 1–8. [Google Scholar] [CrossRef]
- Bishop, R.C.; Heberlein, T.A.; Kealy, M.J. Contingent valuation of environmental assets: Comparison with a stimulated market. Nat. Resources J. 1983, 23, 619. [Google Scholar]
- Green, D.; Jacowitz, K.E.; Kahneman, D.; McFadden, D. Referendum contingent valuation, anchoring, and willingness to pay for public goods. Resour. Energy Econ. 1998, 20, 85–116. [Google Scholar] [CrossRef]
- Bateman, I.J.; Langford, I.H. Non-users’ willingness to pay for a National Park: An application and critique of the contingent valuation method. Reg. Stud. 1997, 31, 571–582. [Google Scholar] [CrossRef]
- Nielsen, J.B.; Gyrd-Hansen, D.; Kristiansen, I.S.; NexØE, J. Impact of Sociodemographic Factors on Willingness to Pay for the Reduction of a Future Health Risk. J. Environ. Plan. Manag. 2003, 46, 39–47. [Google Scholar]
- Alberini, A.; Bigano, A.; Ščasný, M.; Zvěřinová, I. Preferences for energy efficiency vs. renewables: What is the willingness to pay to reduce CO2 emissions? Ecol. Econ. 2018, 144, 171–185. [Google Scholar] [CrossRef]
- Alberini, A.; Ščasný, M.; Bigano, A. Policy-v. individual heterogeneity in the benefits of climate change mitigation: Evidence from a stated-preference survey. Energy Policy 2018, 121, 565–575. [Google Scholar] [CrossRef]
- Ma, C.; Rogers, A.A.; Kragt, M.E.; Zhang, F.; Polyakov, M.; Gibson, F.; Chalak, M.; Pandit, R.; Tapsuwan, S. Consumers’ willingness to pay for renewable energy: A meta-regression analysis. Resour. Energy Econ. 2015, 42, 93–109. [Google Scholar] [CrossRef]
- Sundt, S.; Rehdanz, K. Consumers’ willingness to pay for green electricity: A meta-analysis of the literature. Energy Econ. 2015, 51, 1–8. [Google Scholar] [CrossRef]
- Streimikienė, D.; Mikalauskiene, A. Lithuanian consumer’s willingness to pay and feed-in prices for renewable electricity. Amfiteatru Econ. J. 2014, 16, 594–605. [Google Scholar]
- Bigerna, S.; Polinori, P. Italian households’ willingness to pay for green electricity. Renew. Sustain. Energy Rev. 2014, 34, 110–121. [Google Scholar]
- Falk, A.; Becker, A.; Dohmen, T.; Enke, B.; Huffman, D.; Sunde, U. The Preference Survey Module: A Validated Instrument for Measuring Risk, Time, and Social Preferences; IZA Discussion Paper Series; IZA: Bonn, Germany, 2016. [Google Scholar]
- Falk, A.; Becker, A.; Dohmen, T.; Enke, B.; Huffman, D.; Sunde, U. Global Evidence on Economic Preferences. Q. J. Econ. 2018, 133, 1645–1692. [Google Scholar] [CrossRef]
- Oerlemans, L.A.; Chan, K.Y.; Volschenk, J. Willingness to pay for green electricity: A review of the contingent valuation literature and its sources of error. Renew. Sustain. Energy Rev. 2016, 66, 875–885. [Google Scholar] [CrossRef]
- Mayrhofer, J.P.; Gupta, J. The science and politics of co-benefits in climate policy. Environ. Sci. Policy 2016, 57, 22–30. [Google Scholar] [CrossRef]
- Kim, Y.; Kling, C.L.; Zhao, J. Understanding Behavioral Explanations of the WTP-WTA Divergence Through a Neoclassical Lens: Implications for Environmental Policy. Annu. Rev. Resour. Econ. 2015, 7, 168–187. [Google Scholar] [CrossRef]
- Fashina, A.; Mundu, M.; Akiyode, O.; Abdullah, L.; Sanni, D.; Ounyesiga, L. The Drivers and Barriers of Renewable Energy Applications and Development in Uganda: A Review. Clean Technol. 2019, 1, 9–39. [Google Scholar] [CrossRef]
- Soon, J.-J.; Ahmad, S.-A. Willingly or grudgingly? A meta-analysis on the willingness-to-pay for renewable energy use. Renew. Sustain. Energy Rev. 2015, 44, 877–887. [Google Scholar] [CrossRef]
- Fusch, P.; Fusch, G.E.; Ness, L.R. Denzin’s paradigm shift: Revisiting triangulation in qualitative research. J. Soc. Chang. 2018, 10, 2. [Google Scholar] [CrossRef]
- Claudy, M.C.; Michelsen, C.; O’Driscoll, A. The diffusion of microgeneration technologies—Assessing the influence of perceived product characteristics on home owners’ willingness to pay. Energy Policy 2011, 39, 1459–1469. [Google Scholar] [CrossRef]
- Loomis, J.; Brown, T.; Lucero, B.; Peterson, G. 1997. Evaluating the validity of the dichotomous choice question format in contingent valuation. Environ. Resour. Econ. 1997, 10, 109–123. [Google Scholar] [CrossRef]
- Shiroiwa, T.; Sung, Y.K.; Fukuda, T.; Lang, H.C.; Bae, S.C.; Tsutani, K. International survey on willingness-to-pay (WTP) for one additional QALY gained: What is the threshold of cost effectiveness? Health Econ. 2010, 19, 422–437. [Google Scholar] [CrossRef]
- Balistreri, E.; McClelland, G.; Poe, G.; Schulze, W. Can hypothetical questions reveal true values? A laboratory comparison of dichotomous choice and open-ended contingent values with auction values. Environ. Resour. Econ. 2001, 18, 275–292. [Google Scholar] [CrossRef]
- Farmer, M.C.; Lipscomb, C.A. Conservative dichotomous choice responses in the active policy setting: DC rejections below WTP. Environ. Resour. Econ. 2008, 39, 223–246. [Google Scholar] [CrossRef]
- Zhu, L.; Song, Q.; Sheng, N.; Zhou, X. Exploring the determinants of consumers’ WTB and WTP for electric motorcycles using CVM method in Macau. Energy Policy 2019, 127, 64–72. [Google Scholar] [CrossRef]
- Shi, L.; Xie, J.; Gao, Z. The impact of deal-proneness on WTP estimates in incentive-aligned value elicitation methods. Agric. Econ. 2018, 49, 353–362. [Google Scholar] [CrossRef]
- Mamkhezri, J.; Thacher, J.A.; Chermak, J.M.; Berrens, R.P. Does the solemn oath lower WTP responses in a discrete choice experiment application to solar energy? J. Environ. Econ. Policy 2020, 9, 447–473. [Google Scholar] [CrossRef]
- Idris, I.; Hoque, M.E.; Susanto, P. Willingness to pay for the preservation of urban green space in Indonesia. Cogent Econ. Financ. 2022, 10, 2008588. [Google Scholar] [CrossRef]
- Sievert, M.; Steinbuks, J. Willingness to pay for electricity access in extreme poverty: Evidence from sub-Saharan Africa. World Dev. 2020, 128, 104859. [Google Scholar] [CrossRef]
- Abdullah, S.; Jeanty, P.W. Willingness to pay for renewable energy: Evidence from a contingent valuation survey in Kenya. Renew. Sustain. Energy Rev. 2011, 15, 2974–2983. [Google Scholar] [CrossRef]
- Taale, F.; Kyeremeh, C. Households’ willingness to pay for reliable electricity services in Ghana. Renew. Sustain. Energy Rev. 2016, 62, 280–288. [Google Scholar] [CrossRef]
- Lee, C.Y.; Heo, H. Estimating willingness to pay for renewable energy in South Korea using the contingent valuation method. Energy Policy 2016, 94, 150–156. [Google Scholar] [CrossRef]
- Zografakis, N.; Sifaki, E.; Pagalou, M.; Nikitaki, G.; Psarakis, V.; Tsagarakis, K.P. Assessment of public acceptance and willingness to pay for renewable energy sources in Crete. Renew. Sustain. Energy Rev. 2010, 14, 1088–1095. [Google Scholar] [CrossRef]
- Ntanos, S.; Kyriakopoulos, G.; Chalikias, M.; Arabatzis, G.; Skordoulis, M. Public perceptions and willingness to pay for renewable energy: A case study from Greece. Sustainability 2018, 10, 687. [Google Scholar] [CrossRef]
- Monyei, C.G.; Adewumi, A.O.; Obolo, M.O.; Sajou, B. Nigeria’s energy poverty: Insights and implications for smart policies and framework towards a smart Nigeria electricity network. Renew. Sustain. Energy Rev. 2018, 81, 1582–1601. [Google Scholar] [CrossRef]
- Baulenas, E.; Sotirov, M. Cross-sectoral policy integration at the forest and water nexus: National level instrument choices and integration drivers in the European Union. For. Policy Econ. 2020, 118, 102247. [Google Scholar] [CrossRef]
- Bamwesigye, D. Hypothetical Willingness to Pay for Energy Alternatives in Uganda: Market Incentives and Policy Tools Towards Zero Deforestation and Climate Change. In Proceedings of the Public Recreation and Landscape Protection—with Environment Hand in Hand: Conference Proceedings, Mendelova univerzita v Brně, Brno, Czechia, 11 May 2022; pp. 171–176. [Google Scholar] [CrossRef]


Disclaimer/Publisher’s Note: The statements, opinions and data contained in all publications are solely those of the individual author(s) and contributor(s) and not of MDPI and/or the editor(s). MDPI and/or the editor(s) disclaim responsibility for any injury to people or property resulting from any ideas, methods, instructions or products referred to in the content. |
© 2023 by the author. Licensee MDPI, Basel, Switzerland. This article is an open access article distributed under the terms and conditions of the Creative Commons Attribution (CC BY) license (https://creativecommons.org/licenses/by/4.0/).