Article

The Negative Impact of Electrical Energy Subsidies on the Energy Consumption—Case Study from Jordan

by
Aiman Albatayneh
1,
Adel Juaidi
2,* and
Francisco Manzano-Agugliaro
3,*
1
Energy Engineering Department, School of Natural Resources Engineering and Management, German Jordanian University, Amman 11180, Jordan
2
Mechanical & Mechatronics Engineering Department, Faculty of Engineering & Information Technology, An-Najah National University, P.O. Box 7, Nablus 00970, Palestine
3
Department of Engineering, University of Almeria, ceiA3, 04120 Almeria, Spain
*
Authors to whom correspondence should be addressed.
Energies 2023, 16(2), 981; https://doi.org/10.3390/en16020981
Submission received: 20 December 2022 / Revised: 7 January 2023 / Accepted: 11 January 2023 / Published: 15 January 2023
(This article belongs to the Special Issue Electricity Markets: Modelling, Simulation and Analysis)

Abstract

:
Many developing countries subsidise energy (petroleum fuel products, natural gas and electricity), which was reflected in an extra pressure on the national budget, and this will support inefficient use of energy. In this study, the effects of electrical energy subsidies on the total electrical energy consumption in the residential sector were examined. Data on more than 260,000 Jordanian ordinary customers were collected, and the energy consumption of more than 1000 energy-extra subsidised Irbid District Electricity Distribution Company (IDECO) staff members was recorded over a 2-year period (2017 and 2018). These two groups were compared to examine the consequences of subsidising energy on the energy consumption and the consumption behaviour in the residential sector. The analysis revealed that ordinary householders consume around 296 kWh/month, while for the subsidised group 615 kWh/month was noted. Energy consumption increased during the summer and winter months, especially in the subsidised group, due to the heavy reliance on mechanical systems for cooling and heating. Electricity full price (without any subsidies) can be a very effective way to control the demand profile. It can be structured to encourage customers (generally those that have significant electricity demand) to reduce their total usage as well as peak demand (thus reducing the pressure on the grid and the power plant) by charging them full electricity prices.

1. Introduction

The International Energy Agency (IEA) reported in its 2018 annual report that global energy consumption rose at almost twice the average rate of growth since 2010. This increase was driven by a strong global economy following the financial crisis, as well as improvements in living standards in some areas that resulted in higher energy demand for heating and cooling. According to the IEA, the higher energy demand in 2018 caused global energy-related CO2 emissions to rise by 1.7% to a record high of 33.1 Giga-ton (Gt) CO2. Although emissions from all fossil fuels increased, the power sector was responsible for about two-thirds of the emissions growth. In recent years, the annual rate of growth in global primary energy intensity has been decreasing (from a high of almost 3% in 2015 to 1.9% in 2017), mainly due to the growth in renewable energy sources. In 2018 global electricity demand rose by 4%, nearly doubling total energy demand, and at the fastest rate since 2010. Most of the increase in demand was met by renewables and nuclear power, but there was also a significant increase in generation from coal and gas-fired power plants, which led to a 2.5% increase in CO2 emissions [1].

1.1. Energy Situation in Jordan

Jordan has two main challenges concerning its energy situation: the increasing energy demand and the very limited domestic fossil fuel energy resources to fulfill this demand. Jordan meets almost all of its energy essentials by importing oil and gas from the neighboring countries. Its energy sector faces increasing global oil and gas prices, increased domestic demand, and a fluctuating regional political situation that will affect the stability of the country’s reliance on energy imports, which drain nearly one-fifth of its Gross Domestic Product (GDP). With few fossil fuel natural resources (oil, gas and coal) Jordan has had to rely on foreign energy sources. More than 92% of energy resources were imported in 2018 in order to minimize its high energy bill, and so Jordan has invested seriously in local energy sources such as shale oil and renewable energy [2].
Jordan, shown on the world map in Figure 1, is located in the Middle East surrounded by Syria, Iraq, Saudi Arabia, Israel and the West Bank, and has suffered several mass influxes of refugees in the past decades; these millions of refugees consume nearly one-fifth of its GDP. Jordan meets almost all of its electricity requirements by importing gas. Its energy sector faces increasing worldwide gas prices as well as growing domestic demand, which creates huge challenges to its energy sector.
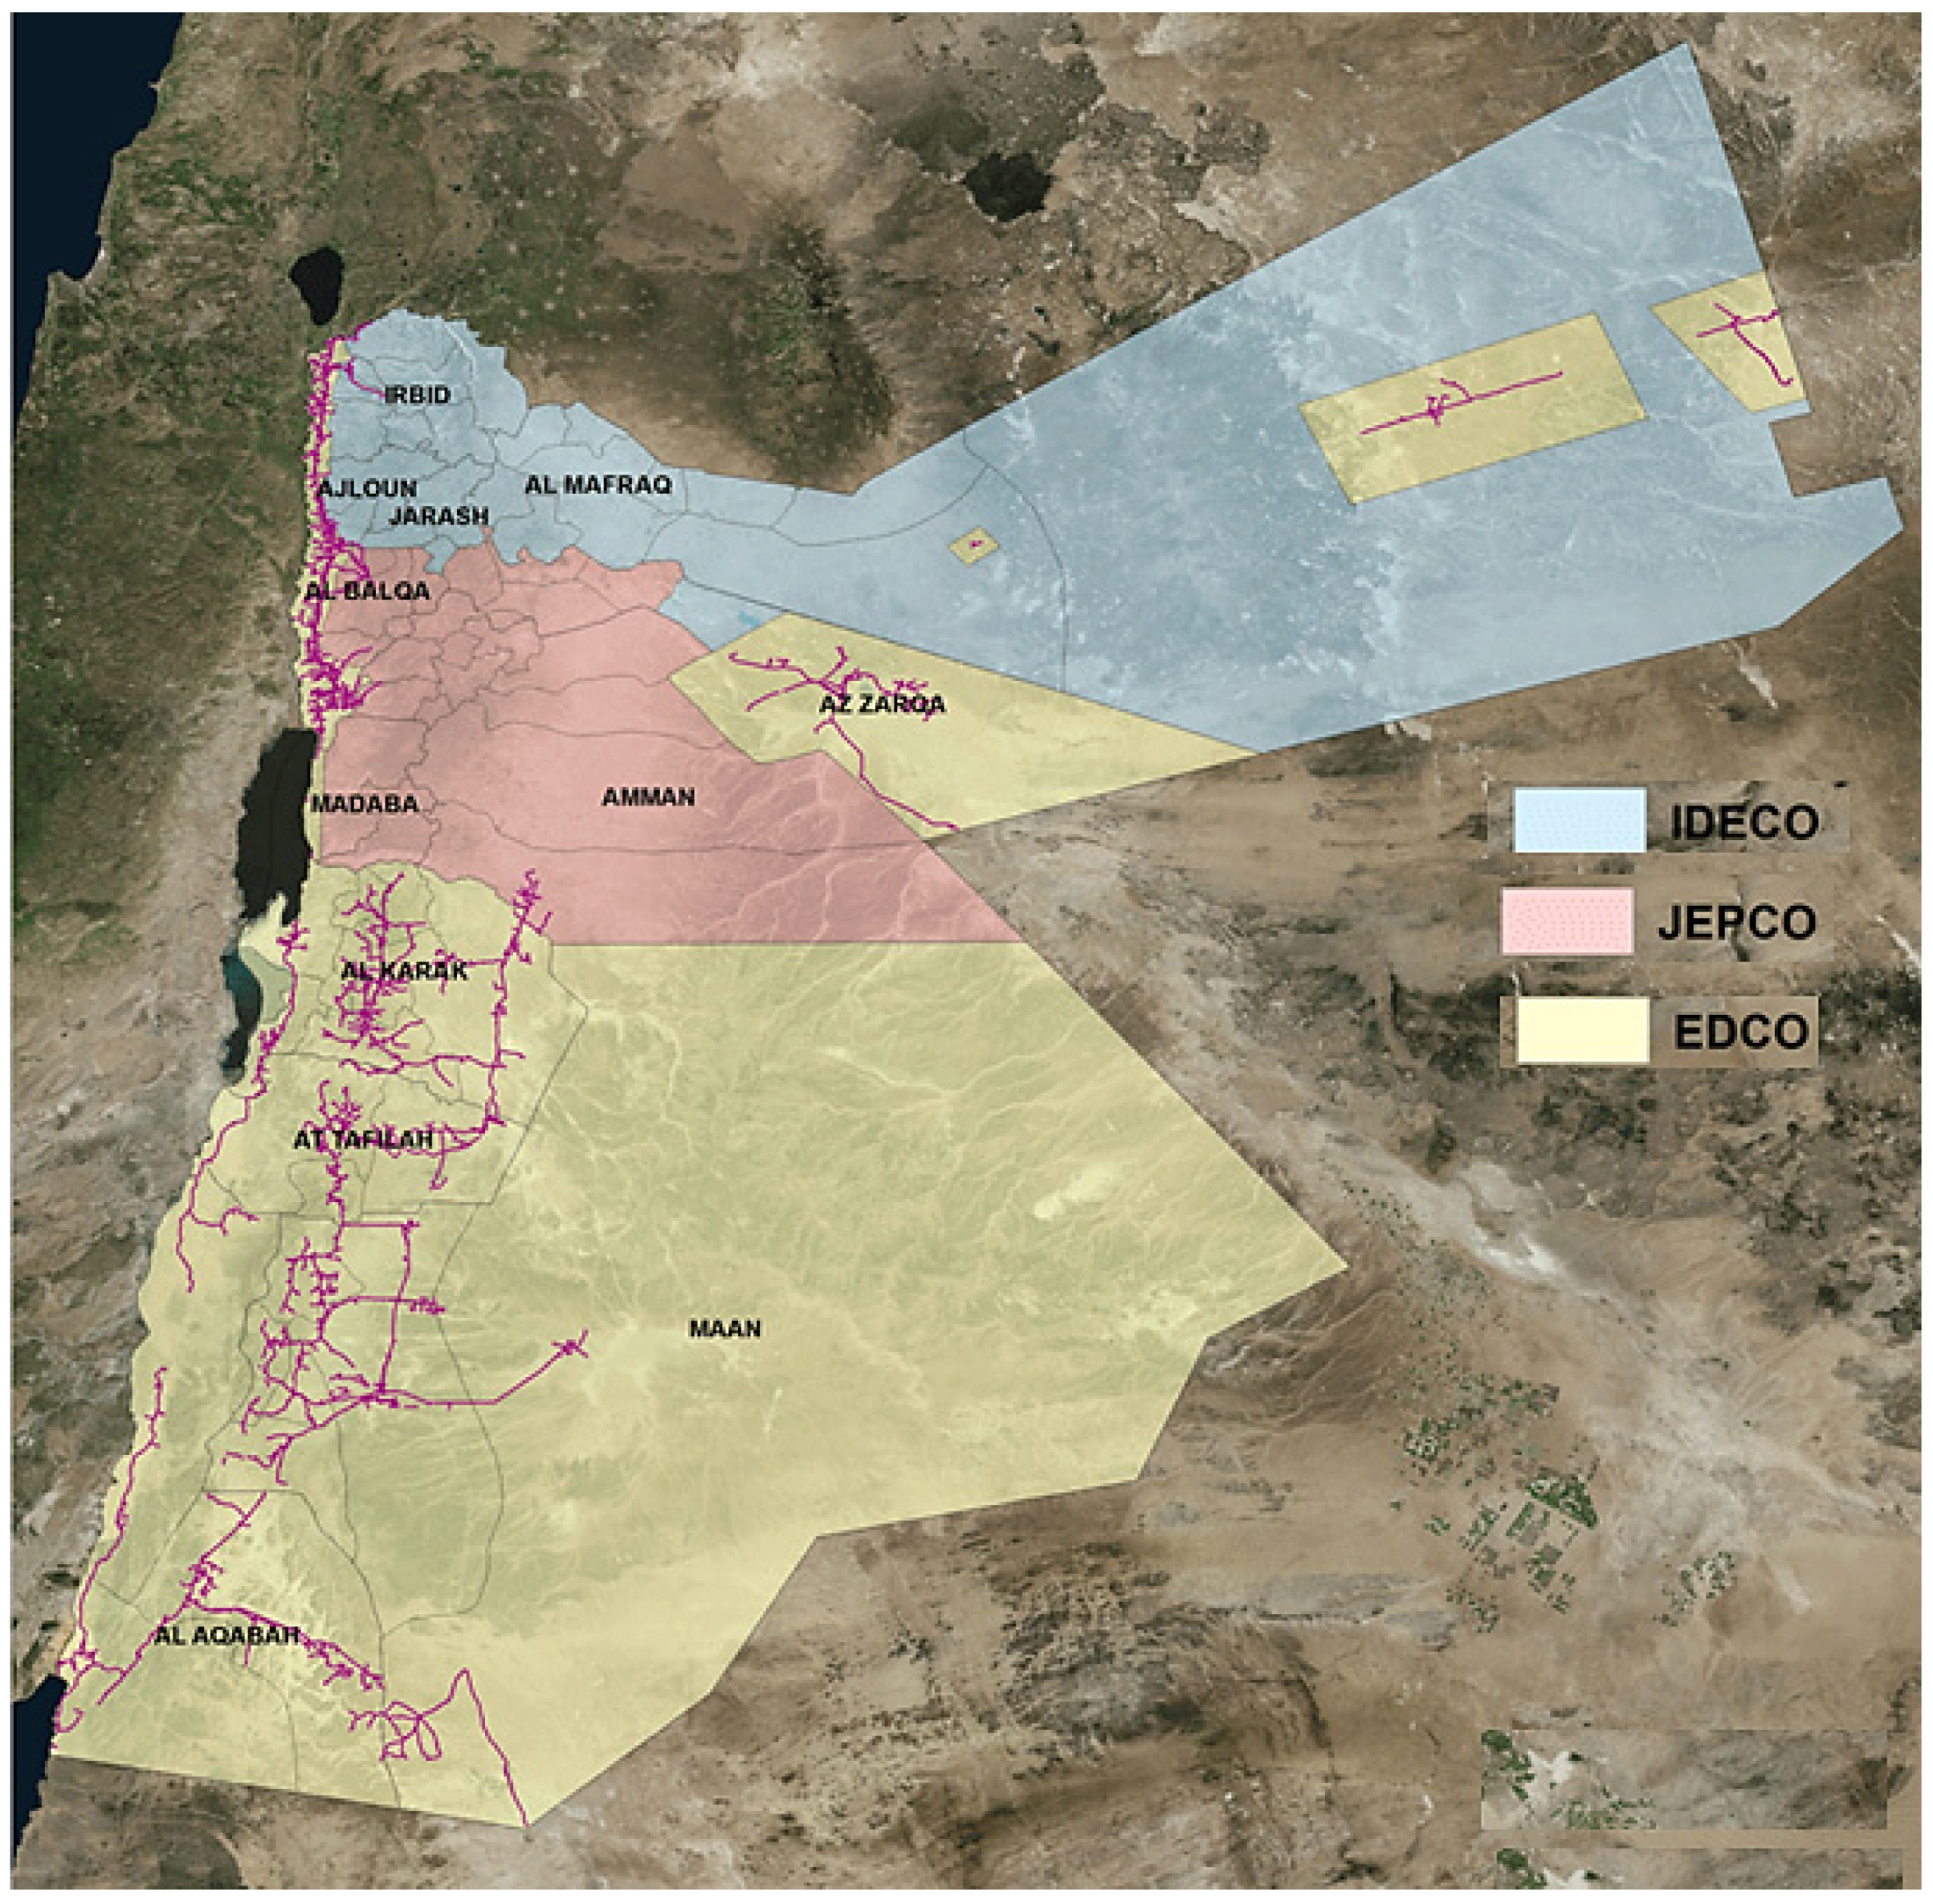
Jordan’s electricity sector is dominated by three distribution companies as shown in Figure 2: the Jordan Electric Power Company (JEPCO), the Electricity Distribution Company (EDCO), and the Irbid District Electricity Distribution Company (IDECO). JEPCO, a private company, holds a concession agreement to serve the middle areas of Jordan. EDCO, established in 1999 after the restructuring of the Jordan Engineers Association (JEA), is responsible for distributing electricity in the southern and eastern regions of the country. IDECO distributes electricity in the northern parts of Jordan. IDECO was privatised and licensed in 2008 when the government sold its 55.4% share but returned to the government ownership in 2011. The current energy mix in Jordan results in 675 g CO2e/kWh emissions on average.
The National Electric Power Company (NEPCO), a wholly governmental company, is responsible for the operation of all electricity transmission networks as well as bulk supply and system operation. Meanwhile, the Central Electricity Generating Company (CEGCO) and the Samra Electric Power Generation Company (SEPGCo) operate in the generation sector [4].
IDECO was established in 1957. It started the operations in the generation, transmission and distribution of electrical power to the entire concession area, which includes the governorates of Irbid, Mafraq Jerash, and Ajloun, with parts of Balqa Governorate added in 1961. Their services cover about 23,000 km2 of the Kingdom.
Since 1961, the company has witnessed a remarkable development in terms of the size of its coverage area and the number of towns and villages under their prerogative. At the end of 2017 it served 326 towns and villages as well as 1034 rural residential communities. As the company stopped electricity generation at the end of 1997, its work is presently limited to the transmission and distribution of electric power within the concession area, where electricity imported from the National Grid of the National Electricity Company is needed. In 2017 the company served 521,339 customers across all sectors (residential, commercial, industrial, etc.) who collectively consumed 3,051,060,515 kWh of energy. The IDECO has more than 1000 employees and they receive 80% discounts on their total electricity bills (subsidised electricity) for the rest of their lives as an incentive from the company.

1.2. Energy Subsidy

Through social policies and economic arguments the government continues to encourage these energy subsidies, as this ensures access to fuel and electricity for the poorest citizens. The governmental energy subsidies also aim to improve the local economy by encouraging manufacturing and diversification in order to create new jobs. In addition, subsidies are intended to constrain inflation, avoid price variations in global markets, and manage macroeconomic development.
However, energy subsidies are costly and are an unsustainable approach to achieve their socioeconomic purposes. The International Monetary Fund indicates that energy subsidies comprise a significant portion of the government budget, crowding out significant public sectors such as education, health and infrastructure.
Energy subsidies are also an obstacle for the development of renewable energies and the investment in energy-efficient technologies [5].
In fact, various researchers found that energy subsidies increase energy consumption, which is reflected in extra pressure on the national budget in non-oil producing countries and further Greenhouse Gas (GHG) emissions. For these reasons, energy subsidies reform is needed.
Governments market energy subsidies as a tool for fighting poverty. A study adopted the Auto Regressive Distributed Lag (ARDL) model and Error Correction Model (ECM) to estimate the impact of energy subsidies on welfare in India, based on the dataset spanning from 1970/71 to 2014/15. Their findings demonstrated that income elasticity is high despite the low elasticity in fossil fuel prices. These results indicate that energy subsidy reforms not only have a negative impact on welfare and energy consumption, but also result in a decline in real income [6]. In their investigation, a global computable general equilibrium (CGE) model was used to estimate imported refined oil, CO2 emissions, household consumption, firm’s performance, and actual GDP, considering the impact of removing fossil fuel subsidies in Ghana. The simulation results indicate that the subsidies reform not only increases prices, diminishes aggregate production and influences different sectors, but it also raises CO2 emissions due to the ‘green paradox’ [7].
The effect of a 50% increase in residential electricity prices due to the subsidies reform on household welfare in Turkey was analysed. The researchers conducted a partial equilibrium analysis and evaluated the short-term electricity needs of a sample of 8572 households. Their findings show that the impact on the low-income quintile in terms of welfare losses was 2.9 times greater than the impact on the high-income quintile [8]. Empirical evidence also indicates that energy subsidies have several adverse impacts on the justice in the distribution of the country’s capabilities. Identifying the main beneficiary groups from the energy subsidies applied to Nigerian households—using the Harmonized Living Standard Survey 2009/10 to extract households’ expenditure data and link those with annual subsidy estimates—the authors found that the high-income group enjoys the benefits of fuel subsidies the most, through petrol subsidy in particular [9].
The effects of energy subsidy removal on the household welfare in developing countries has also been investigated, suggesting that the subsidy reform will be unambiguously positive for the government. In addition, a compensating mechanism can reduce the negative effects on households while still achieving some fiscal profits [10]. The same recommendation was reached by using an economy-wide model and simulated scenarios to recognise the consequences of removing the fuel subsidy in Nigeria [11]. Considering the direct and indirect effects of energy subsidies reform to evaluate their impacts on household welfare in developing countries, these authors demonstrated that a removal of 0.25 cent/litre from the fossil fuel subsidy led to 5% income reduction in all income groups. This research also shows that the high-income group benefits from subsidies six times more than the low-income group [12]. A survey of economic experts about energy subsidies in Jordan similarly revealed that energy subsidies have negative impacts on the country’s economy, as they increase the deficit and result in an inequitable distribution of sources [13].
A study conducted in Jordan reveals that 40% of subsidies benefit 20% of the high-income households [14]. A partial equilibrium approach was used in Ghana to evaluate the impact of removing energy subsidies on poverty. It was discovered that the wealthiest households received 78% of the benefits from fuel subsidies, while the poorest households only received 3%. This led to a 2.1% reduction in consumption and a 1.5% increase in the poverty rate for the poorest households [15]. A small open economy model was developed to estimate the macroeconomic impact of energy subsidies in developing countries. The macroeconomic elements included welfare, consumption, and labour supply. The results indicate that those subsidies lead to greater oil consumption and inefficient labour distribution among sectors [16]. In their investigation of the impact of electricity subsidies removal on welfare in Zambia, the authors performed standard benefit incidence analysis [17] to estimate how the electricity subsidies benefit distribution among households. They also used a partial equilibrium price-shifting model [18] to simulate the direct and indirect effect of subsidies removal. Their results show that around 90% of electricity subsidies benefit the richest half of the households. Moreover, the simulation results show that increasing electricity price by 75% affects the poorest households’ expenditure three times more than the richest households [19]. An energy-extended input–output approach was also used to evaluate the cost of transferring one dollar of income to low-income groups through energy subsidies. It was found that in Latin America and the Caribbean, this would cost USD 12 [20].
Extant research shows that application of compensating programs may restrict the negative impact of subsidy reforms on low-incomes groups. For example, a CGE model was developed to evaluate the actual aspects of the subsidy reforms applied to the food and energy sectors in Iran. The results show that providing cash transfers to the low-income group can eliminate the adverse effects of subsidy without compromising the gains [21]. A statistical simulation model was developed [22] to evaluate the direct effect of fossil fuel subsidies reform in the local variability in Nigeria. This investigation indicates that subsidies without a compensating program result in a 3−4% rise in national poverty [23]. In their study of fuel subsidies and the potential impacts of removing them on fiscal balance and poverty in Indonesia, simulation analysis using the CGE-microsimulation model was performed and found that a removal of 25% fuel subsidies would lead to an increase in poverty incidence by 0.259%. However, if this saving is transferred to the low-income groups the poverty incidence decreases by 0.27% [24].
Empirical evidence shows that subsidy reforms generally improve the economy. A comprehensive analysis of the energy subsidy situation in the Middle East and North Africa shows that the fiscal burden energy subsidies impose on the government budgets leads to deformities in price signals and resource misallocations. Thus, energy subsidy reformation is an unavoidable issue despite its economically and politically delicate nature [2]. The same conclusion was reached through causality analysis between GDP and energy consumption in the Gulf Cooperation Council (GCC) [25]. A study of fossil fuel subsidy reform effects on the Middle East and North Africa (MENA) member economies demonstrated that their removal or reduction would raise the GDP per capita and increase job opportunities [26]. A study developed an input–output price model to analyse the main consequences of energy subsidies reform on income distribution of Chinese households. Their results indicate that the indirect impacts of these reforms would be greater than the direct impacts on households. Governments can reduce the negative impacts of fossil fuel subsidies removal by controlling the price [27]. These researchers applied a CGE model to estimate the fossil fuel subsidies redistribution impact in the context of decreased world oil prices. They considered South Africa as a case study and developed two scenarios for the reallocation: (1) direct reduction in the public transportation prices; and (2) development of the transportation station and network to serve poorer people. The CGE simulation results show that the second scenario is more beneficial for the economy and the environment [28]. An impact study was performed for energy subsidies removal on the welfare in Egypt. Intertemporal General Equilibrium Model results revealed that the negative effects of subsidies can be eliminated by adopting gradual elimination of tariffs to stimulate trade [29]. Similarly, researchers studied the effect of energy subsidies reform on the energy rebound effects in China through a modified input–output model. The empirical results show that the energy subsidies removal would decrease the rebound effect from 1.9% to 1.53% [30].
In addition to their economic and social effects, energy subsidies reforms have a notable impact on the environment. A comprehensive study of fossil fuel subsidy on a worldwide scale shows that subsidies account for 6.5% of the global GDP which amounted USD 5.3 trillion in 2015. The authors further noted that reforms to fossil fuel subsidies would have diminished global carbon emissions by 21% and fossil fuel air pollution mortality by 55% in 2013, while increasing the income by 4% and social welfare by 2.2% of global GDP [31]. A study of economic and CO2 emission impacts in decreasing the energy subsidies in Kuwait focused on the reduction in natural gas, oil, and electricity subsidies by 25% in two scenarios. The baseline scenario was formed by using the social accounting matrix (SAM), while a CGE model was developed to simulate the energy subsidy reduction effects. In the first scenario subsidy reduction was applied without cash transfers to the energy user, while the cash transfer was used in the second scenario. GDP decreased by 0.28% in the first scenario, while it increased by 1.01% in the second scenario. The energy price was increased by 255% and 245% in these two scenarios, respectively [32]. The CGE model was applied to estimate the impact of energy subsidies reform in Malaysia, including the removal of petroleum and gas subsidies. Their results show that this would result in a GDP increase, while enhancing the economic efficiency with a large reduction in the budget deficit. Moreover, CO2 emissions were estimated to decline by about 1.84–6.63% [33]. The CO2 reduction potential through fossil fuel subsidy reforms in the Middle Eastern and North African (MENA) countries was evaluated, focusing on fossil fuel intensive countries that have high-level subsidies in place. Their findings indicate that fossil fuel subsidy reforms can be a significant tool for both climate protection and economic development [34]. The influence of imported refined oil subsidies removal from an environmental and welfare point of view in Ghana was studied. In their experimental simulations, they adopted a multi-region CGE model, which revealed that the removal of fuel subsidies improved the overall environmental quality by 1.9%. However, welfare losses were inevitable even when the environmental benefits were considered [35]. The effect of removing fossil fuel subsidies on CO2 emission reduction in China was examined. Their dynamic adjustment model indicated that phasing out fossil fuel subsidies alone cannot yield the expected CO2 emission reduction. In addition, policies and work should be compared to subsidies reform in order to achieve the reduction target [36].
Removal of energy subsidies was also shown to have a positive influence on the energy consumption. An investigation of energy subsidies removal effects on the domestic economy in Malaysia, focusing on the high energy consumer sector, shows that the transportation sector will be highly influenced by subsidies, as the total output of land, water, and air transport would decrease [37]. The energy demand and potential energy savings were studied by researchers who applied three scenarios of energy subsidies in Malaysia, respectively considering removal of fuel subsidies, removal of fuel tax subsidies, and removal of both subsidies. The third scenario was shown to have the most powerful effect in meeting the energy efficiency national target plan [38]. The effect of energy subsidies reform on household energy consumption in Iran was investigated by adopting a generalised expenditure system model to estimate the energy expenditure in households at different income levels [39]. Their results indicate that the removal of energy subsidies alone cannot yield the desired impact on energy consumption and should be accompanied by an energy efficiency strategy [40].
The potential impacts of energy subsidy reforms utilising the price-gap method was investigated to evaluate China’s energy subsidies, while adopting the CGE model to explain the economic consequences of such reforms. The authors demonstrated that energy subsidies comprised 1.43% of the GDP in 2007, stating that their removal would lead to a meaningful reduction in energy demand and emissions [41]. The CGE model was used to estimate the environmental and economic impacts of fossil energy subsidies reform and its effect on energy consumption structure. Their analytical results indicate that removing coal or oil subsidies would have different impacts on the energy consumption structure [42]. The Kerosene subsidies and their effect on energy efficiency and improvement on a global scale were evaluated. They found that the direct and indirect value of Kerosene subsidies is USD 18 B/year (2016) and USD 34.7 B/year (2016), respectively. Moreover, Kerosene subsidies constitute a barrier to the achievement of energy consumption targets [43].
In Jordan, it is estimated that if all households receive the same government subsidies as those offered to the utility employees, electricity consumption will increase by twofold as will CO2 emissions. In addition, the subsidies will create a new peak in the electricity demand in winter months that will necessitate use of back-up technologies that generally cost more [44].
Many developing countries’ subsidised energy (petroleum fuel products, natural gas and electricity) is reflected in extra pressure on the national budget, and this will support inefficient use of energy. This research will investigate the effect of an electricity pricing tariff on the overall electrical energy consumption, to find the effects of electrical energy subsidies on the total electrical energy consumption in residential sector were studied.
In addition, it will investigate how the unsubsidized households’ occupants use lower energy by regulating their indoor air temperatures through behaviours like adjusting their clothing, opening windows, or using energy-efficient methods (like fans) to achieve their desired level of thermal comfort. This can reduce reliance on mechanical heating and cooling systems. Redesigning subsidies for residential electricity is important for the national economy, as it can help to better control electricity usage and its environmental impact.

2. Data Collection Methodology

In this study, the effects of electrical energy subsidies on the total electrical energy consumption in the residential sector were examined. Data on more than 260,000 ordinary customers were collected and the energy consumption of more than 1000 energy-subsidised Irbid District Electricity Company (IDECO) staff members was recorded over a 2-year period (2017 and 2018, a total of 24 months). These two groups were compared to examine the consequences of subsidising electricity on the total monthly energy consumption behaviour in the residential sector. We started by calculating the average electrical energy consumption and then the electrical energy consumption for each electrical energy tariff for each group.
The two groups were compared to examine the consequences of subsidising energy for the energy consumption and the consumption behaviour in the residential sector. Both studied groups live in a similar environment and are using similar equipment, while sharing the same background and traditional habits. As a part of this investigation, 6.3 million monthly electricity bills were analysed using the data provided by IDECO—the company responsible for distributing electricity in the northern part of Jordan.
The electricity tariff structure in Jordan is based on the total energy consumption as shown in Table 1 [45]. The subsidized group pay just 10% of the bill (subsidized). It is worth noting that the structure of electricity tariffs in Jordan helps low-income households, as according to Jordanian authorities the cost per kWh is around 0.14 USD. The ordinary households (unsubsidized) pay USD 0.05/kWh if the monthly electrical energy consumption is from 1 to 160 kWh and USD 0.1/kWh for the consumption from 161−300 kWh and USD 0.12/kWh for the consumption of 301−500 kWh, and around of 90% of the households used less than 500 kWh/Month.
Electricity tariffs can be a very effective way to control the demand profile. They can be structured to encourage customers (generally those that have significant electricity demand) to reduce their total demand as well as peak demand (thus putting less pressure on the grid and the power plant). Unfortunately, there is no proper building design implemented in Jordan. This results in higher heating and cooling energy consumption, which could be prevented by simple design modifications and retrofitting [46,47,48,49].
There are some limitations to this study by not taking into account several factors in more detail for each household, such as age, education, affiliation, marital status, household, employment, and income.

3. Results and Discussion

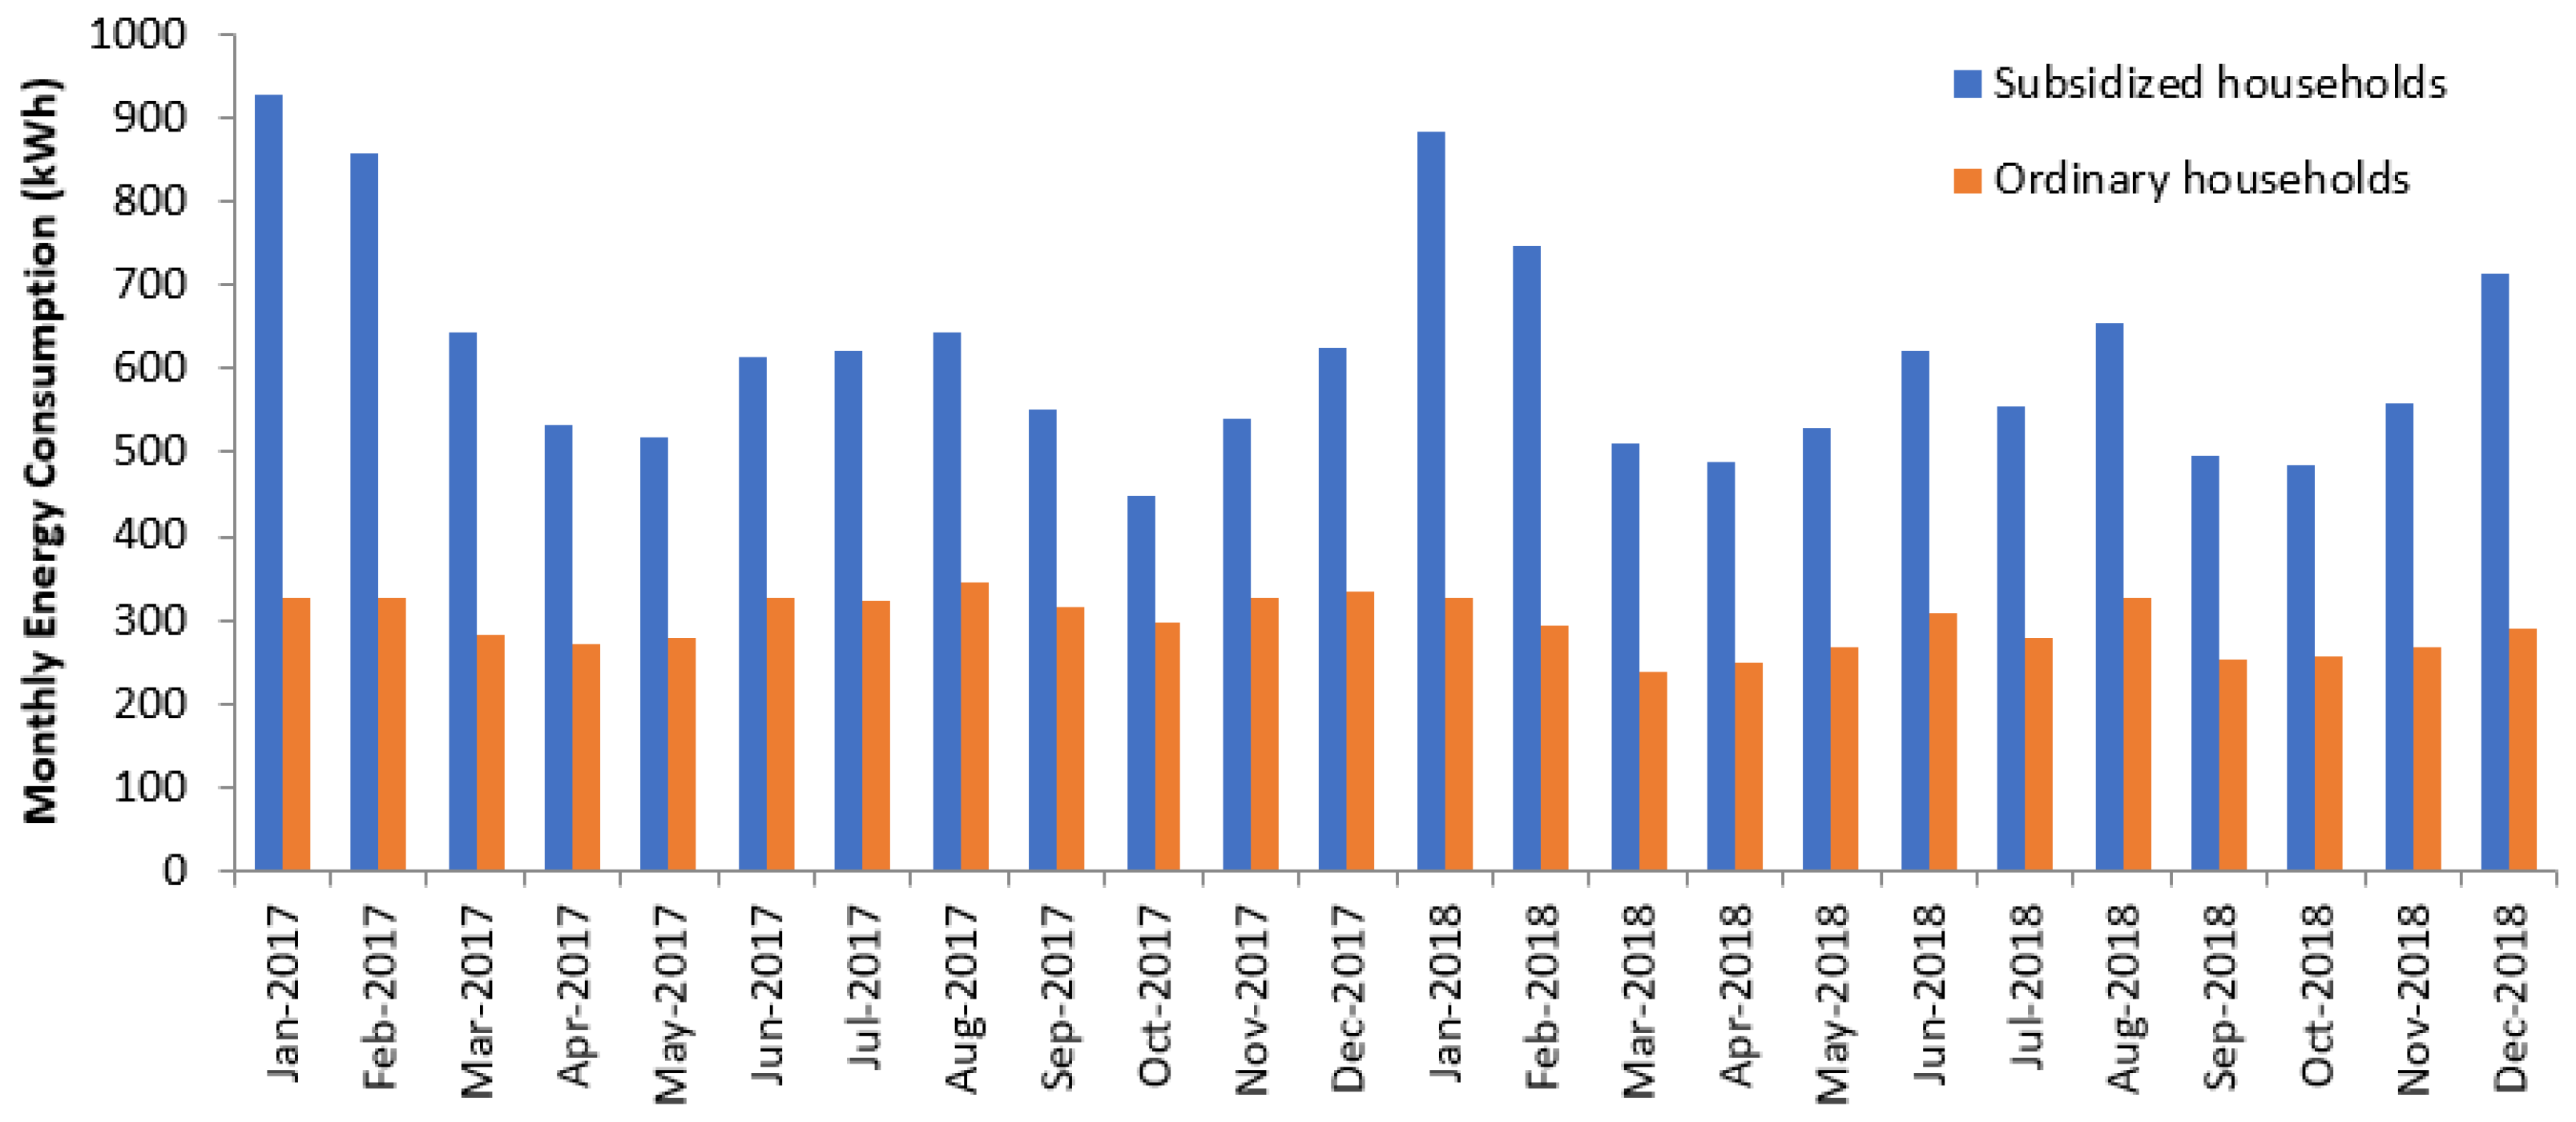
The average electrical energy consumption of an ordinary household is 296 kWh/month, while the subsidised group uses on average around 615 kWh/month. The highest energy consumption occurs during the summer and winter months due to the need for cooling and heating, as shown in Figure 3.
A comparison between the two curves suggests that maximum electrical energy consumptions occurred during the winter months, especially in January (the coldest month of the year) for the subsidized group; the ordinary consumers keep their electrical energy consumption at minimum and try to cover their heating demand through other energy sources (gas, diesel and coal) despite higher fossil fuel prices, to avoid paying a higher electricity tariff, while the utility employees can continue using electricity at a much lower cost.
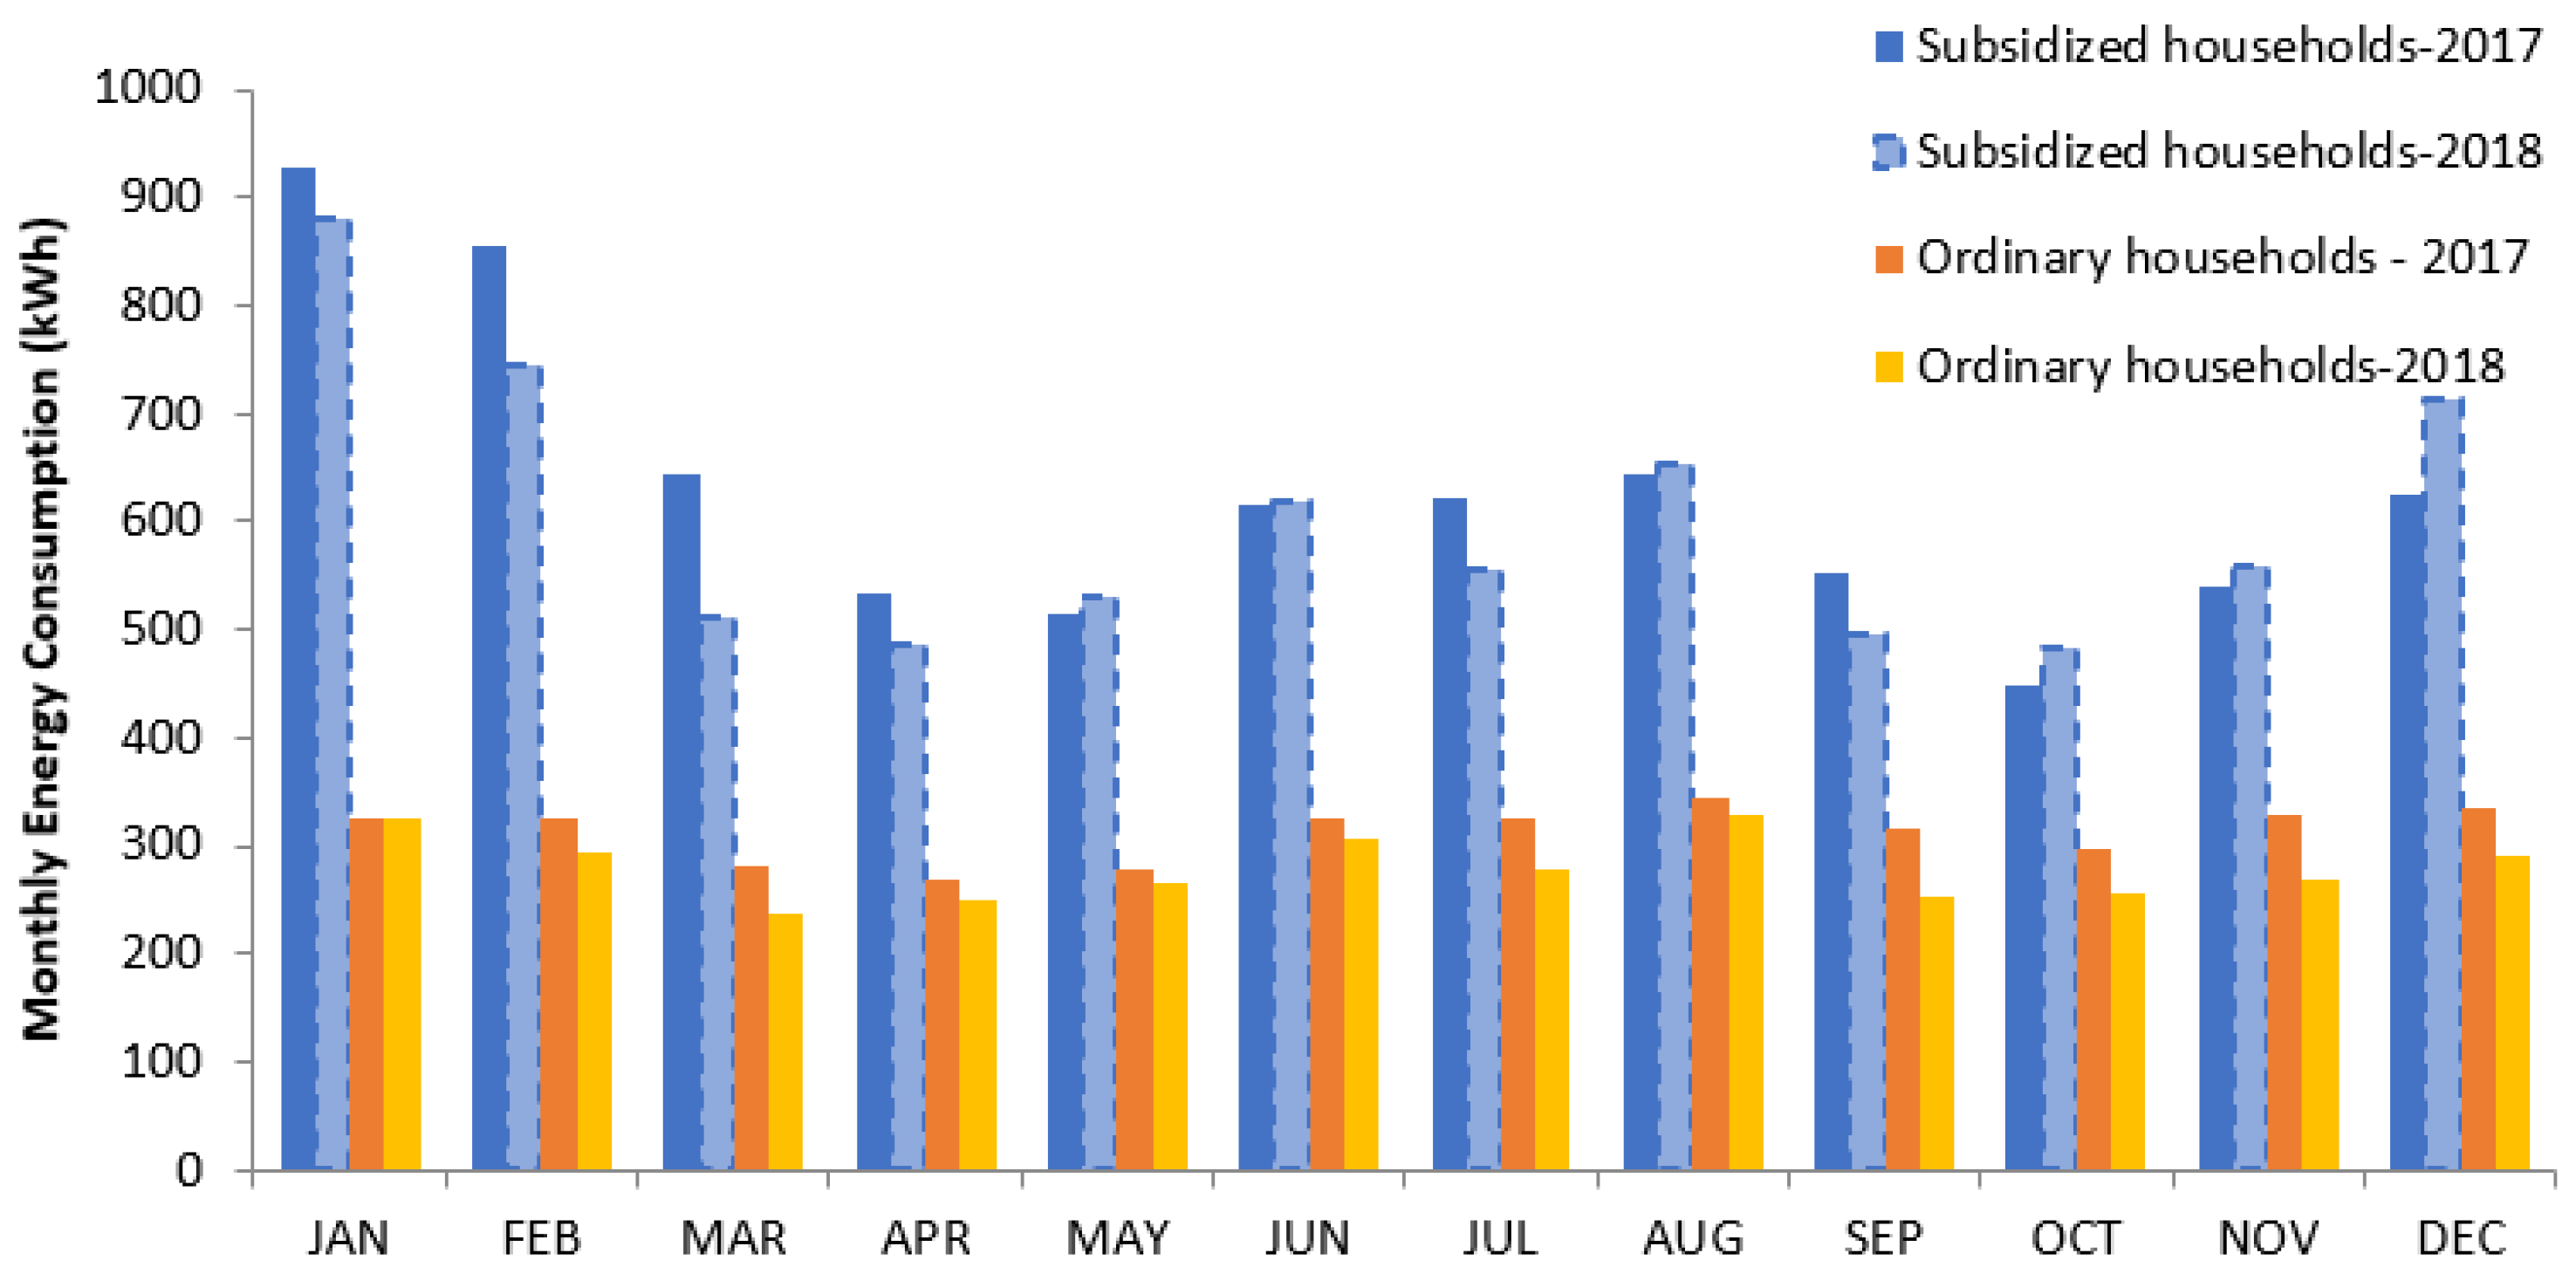
To examine the pattern of energy consumption each year compared with the previous year, as can be seen in Figure 4, the energy consumption over two years followed the same pattern for each group. The slight changes in the patterns each year were mainly due to the changes in weather conditions.
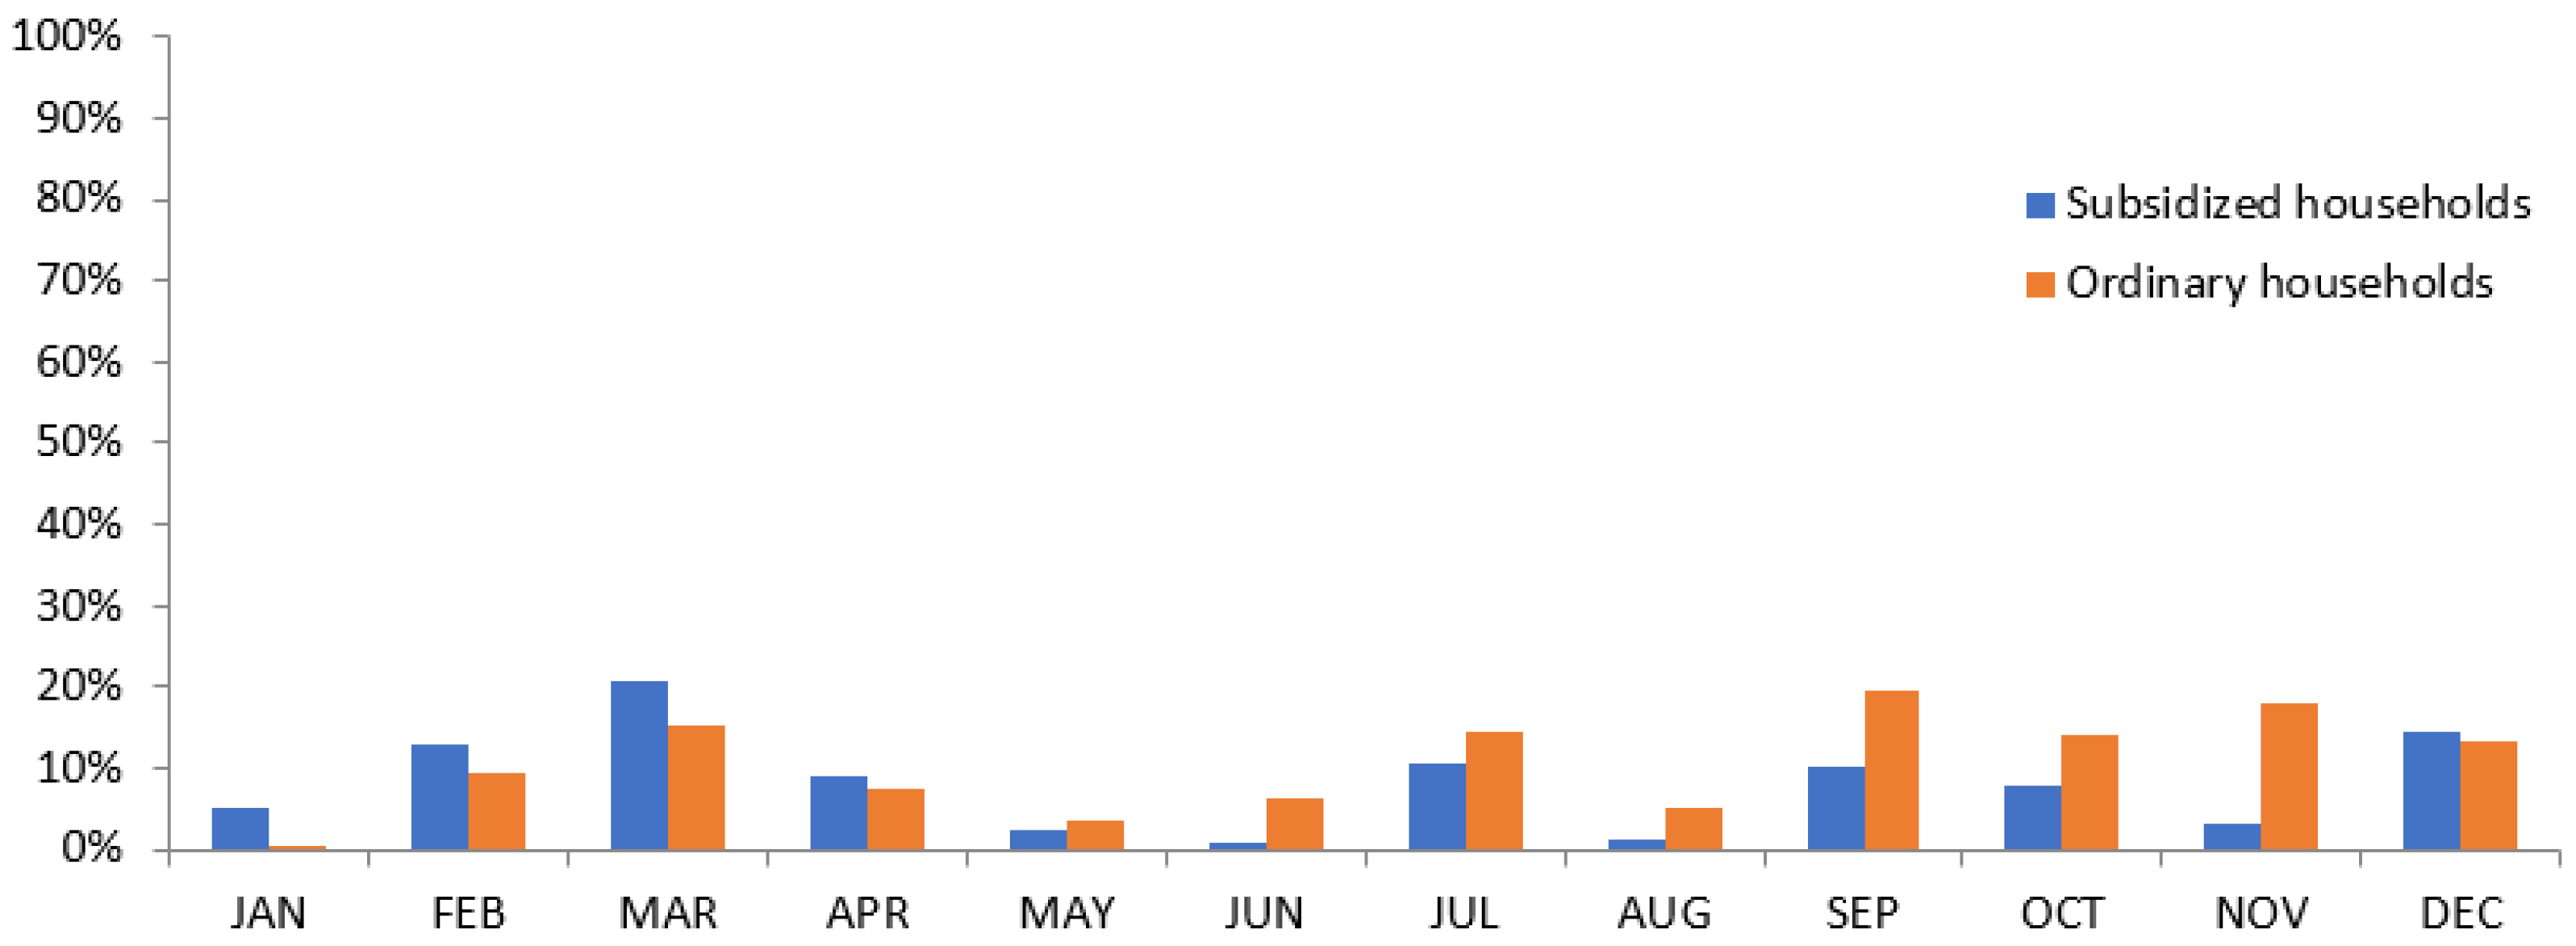
The monthly variations in the electrical energy consumption for the subsidised group were from 1% to 21% with an average of 8%, and from 0% to 20% (with an average of 11%) for the ordinary customers. The greatest differences occurred during March and September (see Figure 5), mainly due to unexpected changes in weather conditions. Giving the ordinary group households’ occupants greater involvement in energy saving enabled them to adopt alternative practices to obtain their thermal comfort such as: open windows for night ventilation in summer months; mid-day ventilation on warmer winter days; allowing the winter sun in and preventing the summer sun with shading devices; and wearing suitable clothes for the season.
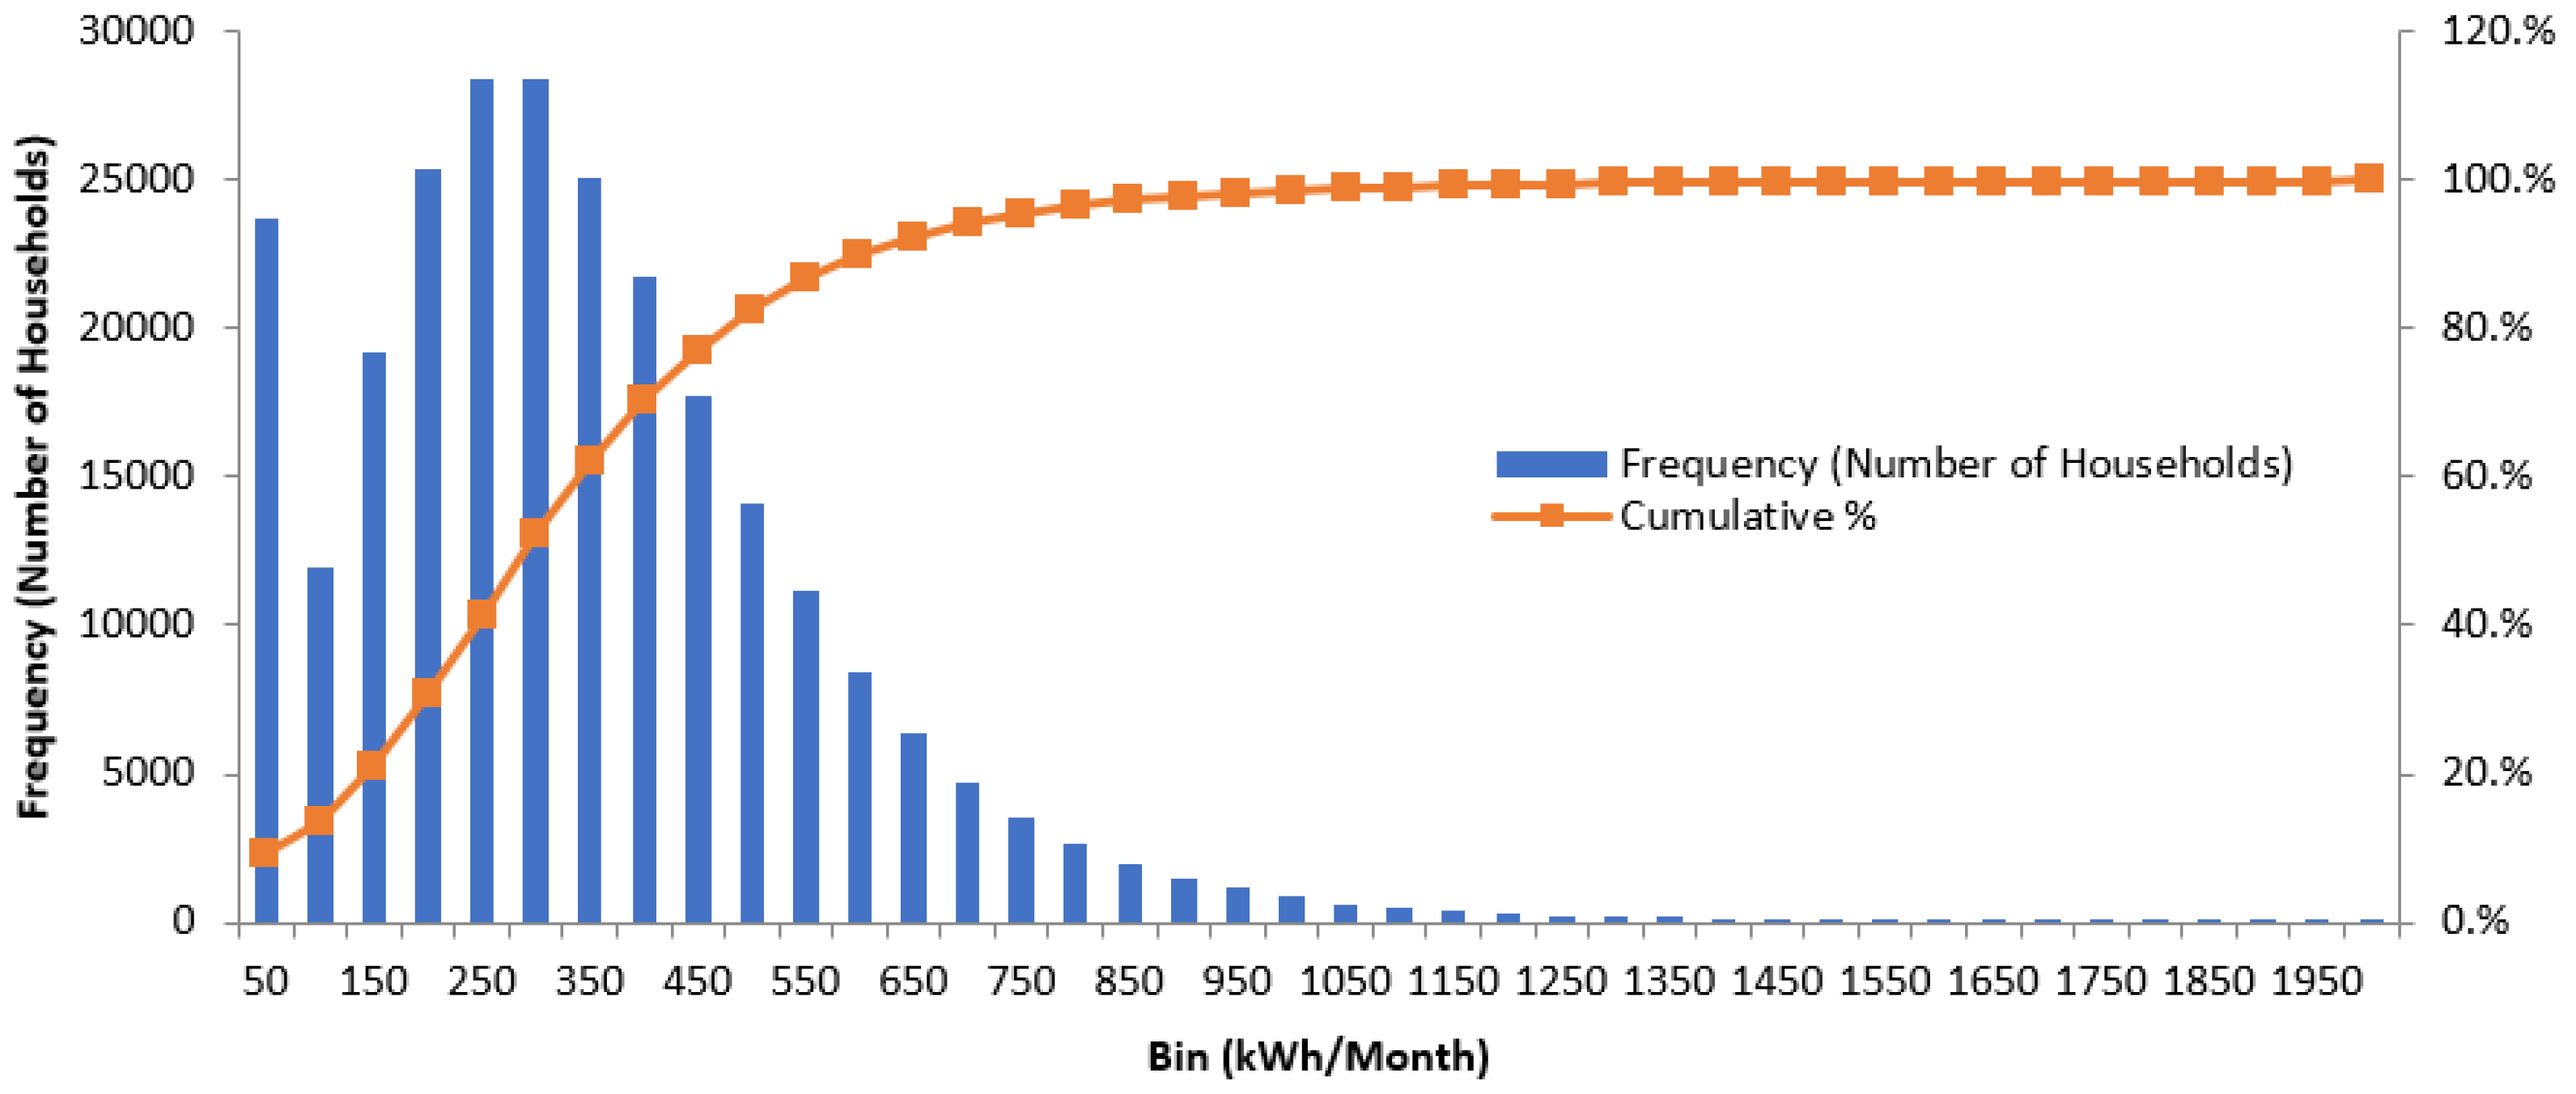
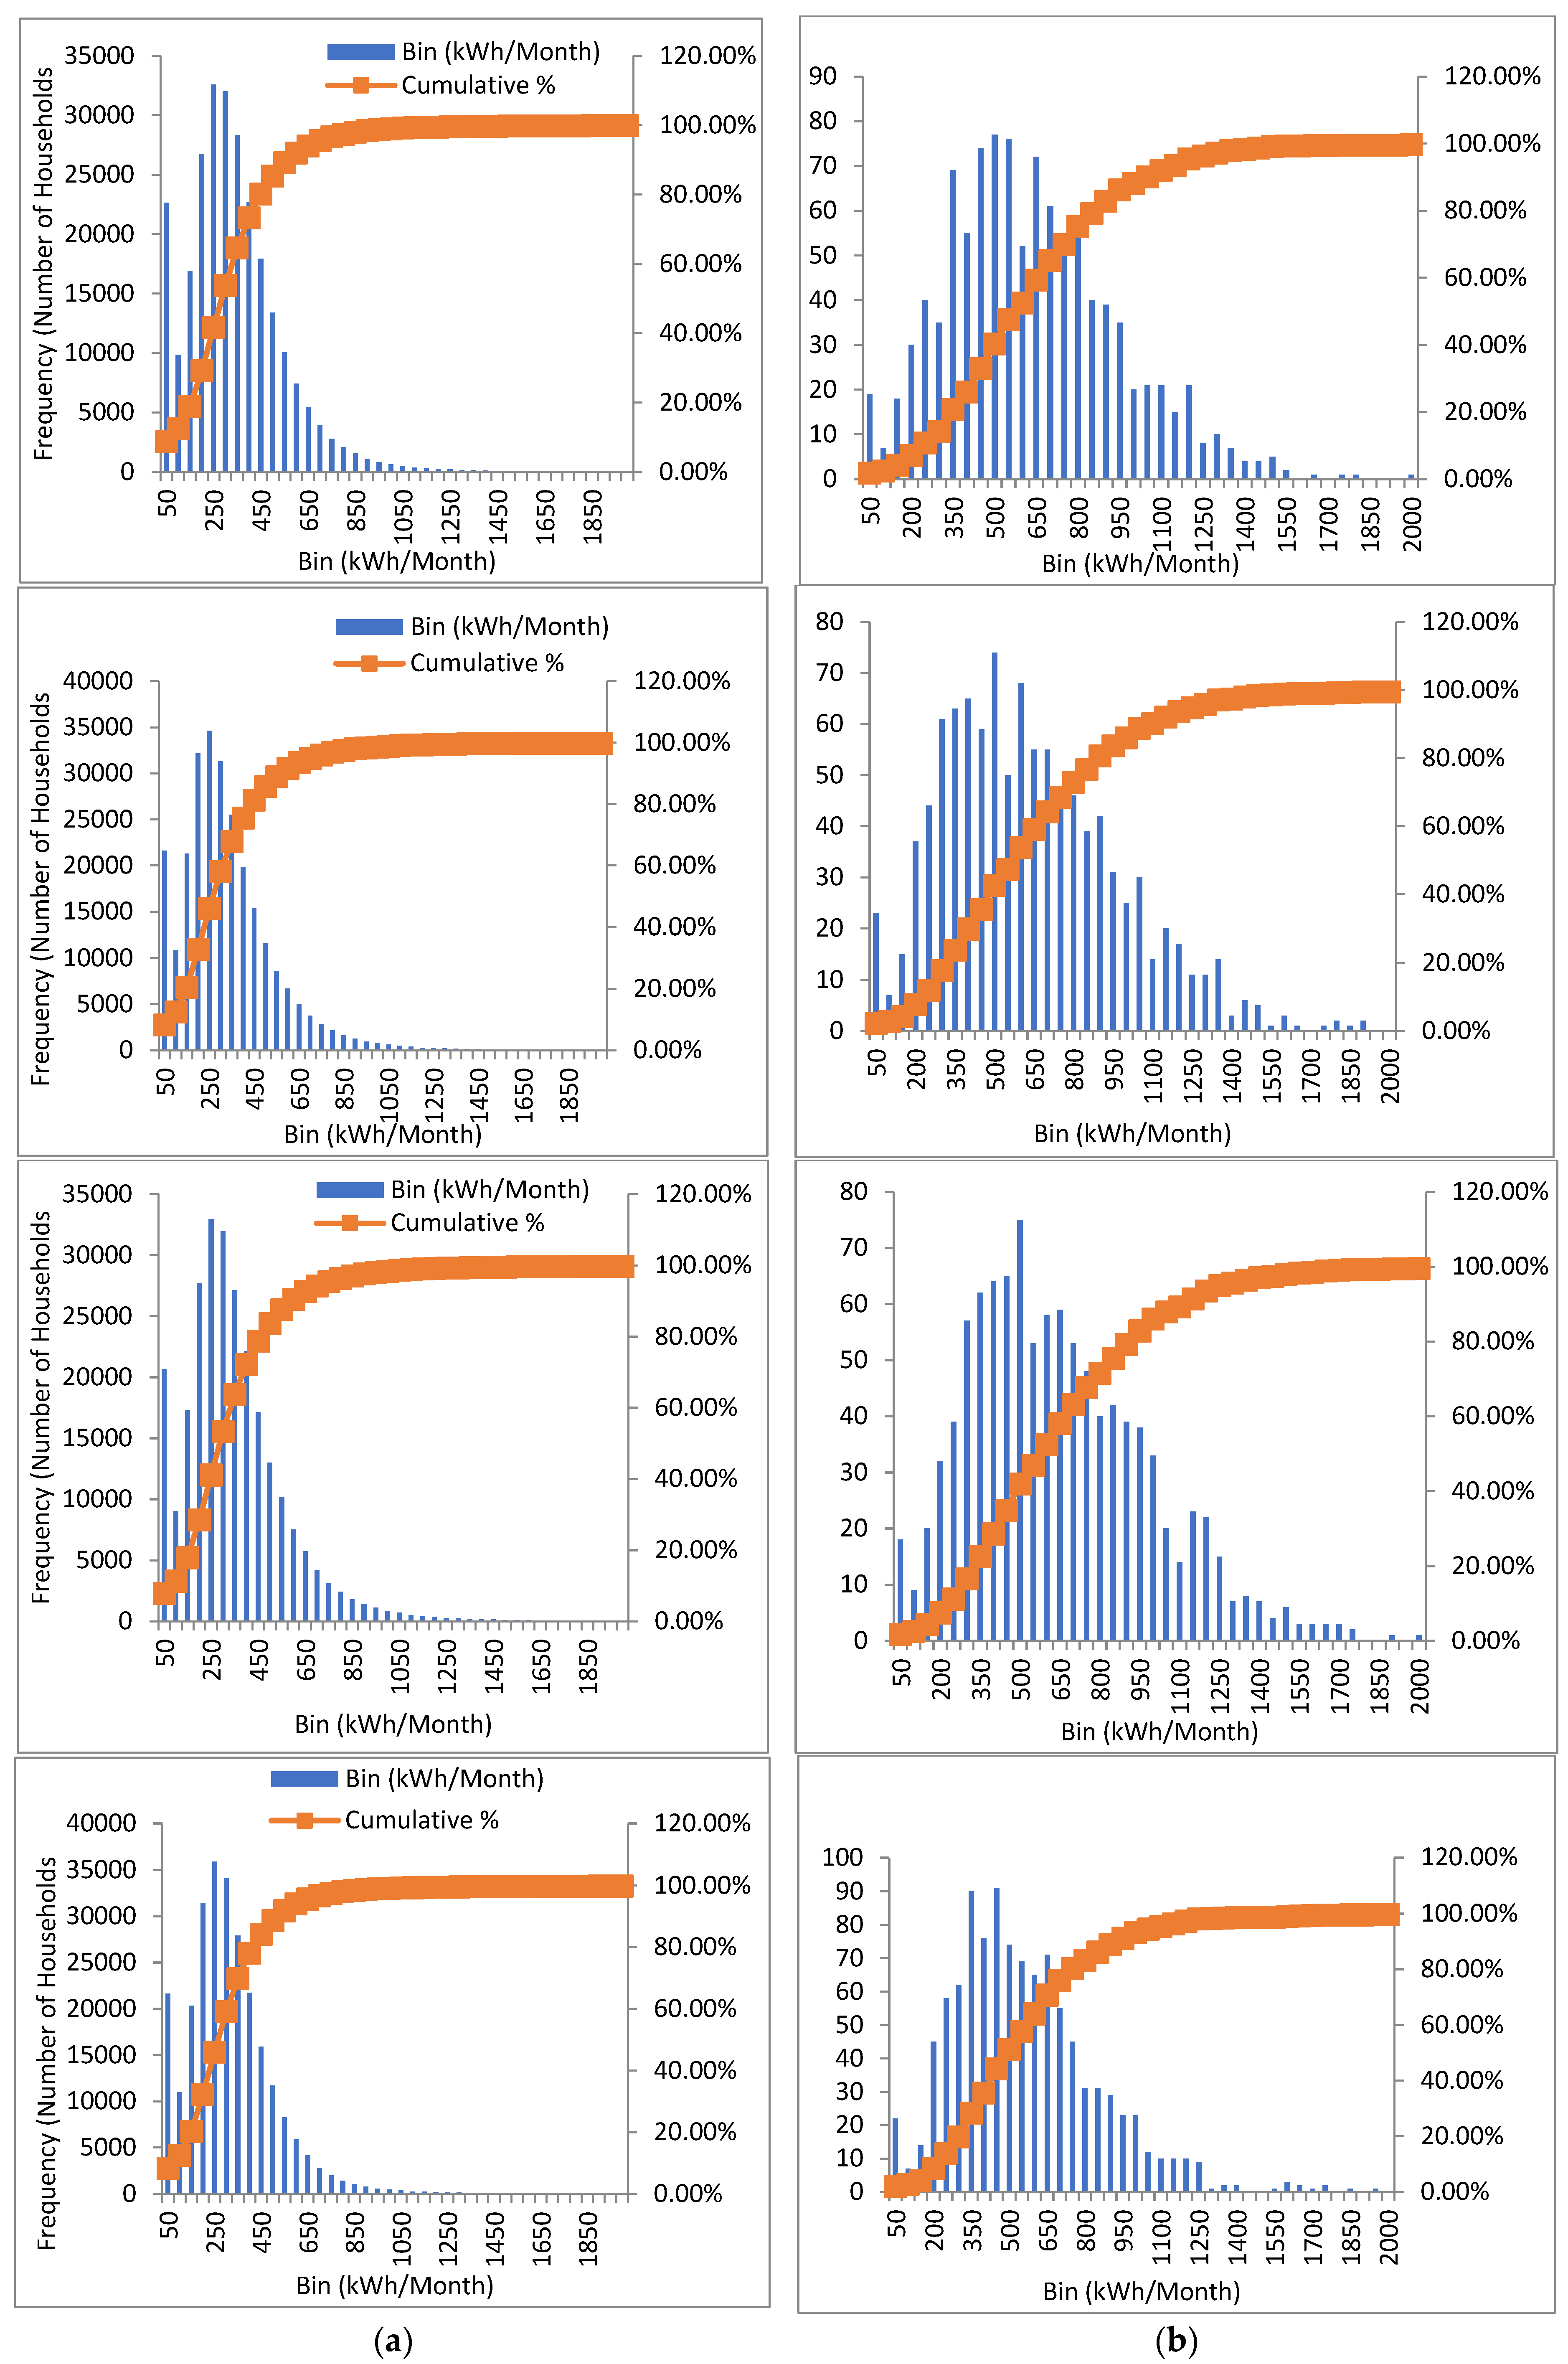
The data were divided into intervals, denoted as bins, with each bin representing a 50 kWh/month, starting at 0−50 kWh/month. Each bin contains the electrical energy consumption for each household with pertinent energy usage. From the above data, the frequencies in each bin have been presented along with the electrical energy consumption that contributed to the frequency (the number of households falling within the specific bin). For instance, for the month of January 23,707 ordinary households used less than 50 kWh and 11,924 ordinary households used from 50–100 50 kWh. Then, 19,184, 25,373, 28,363, 28,404, 25,122 and 21,711 ordinary households used from 100–150, 150–200, 200–250, 250–300, 300–350 and 350–400 kWh, respectively.
The cumulative % shows the percent of households that fill all the bins up to that point, allowing a comparison of different sets of data. For instance, from Figure 6 it can be seen that 62% of the ordinary households used less than 350 kWh in January.
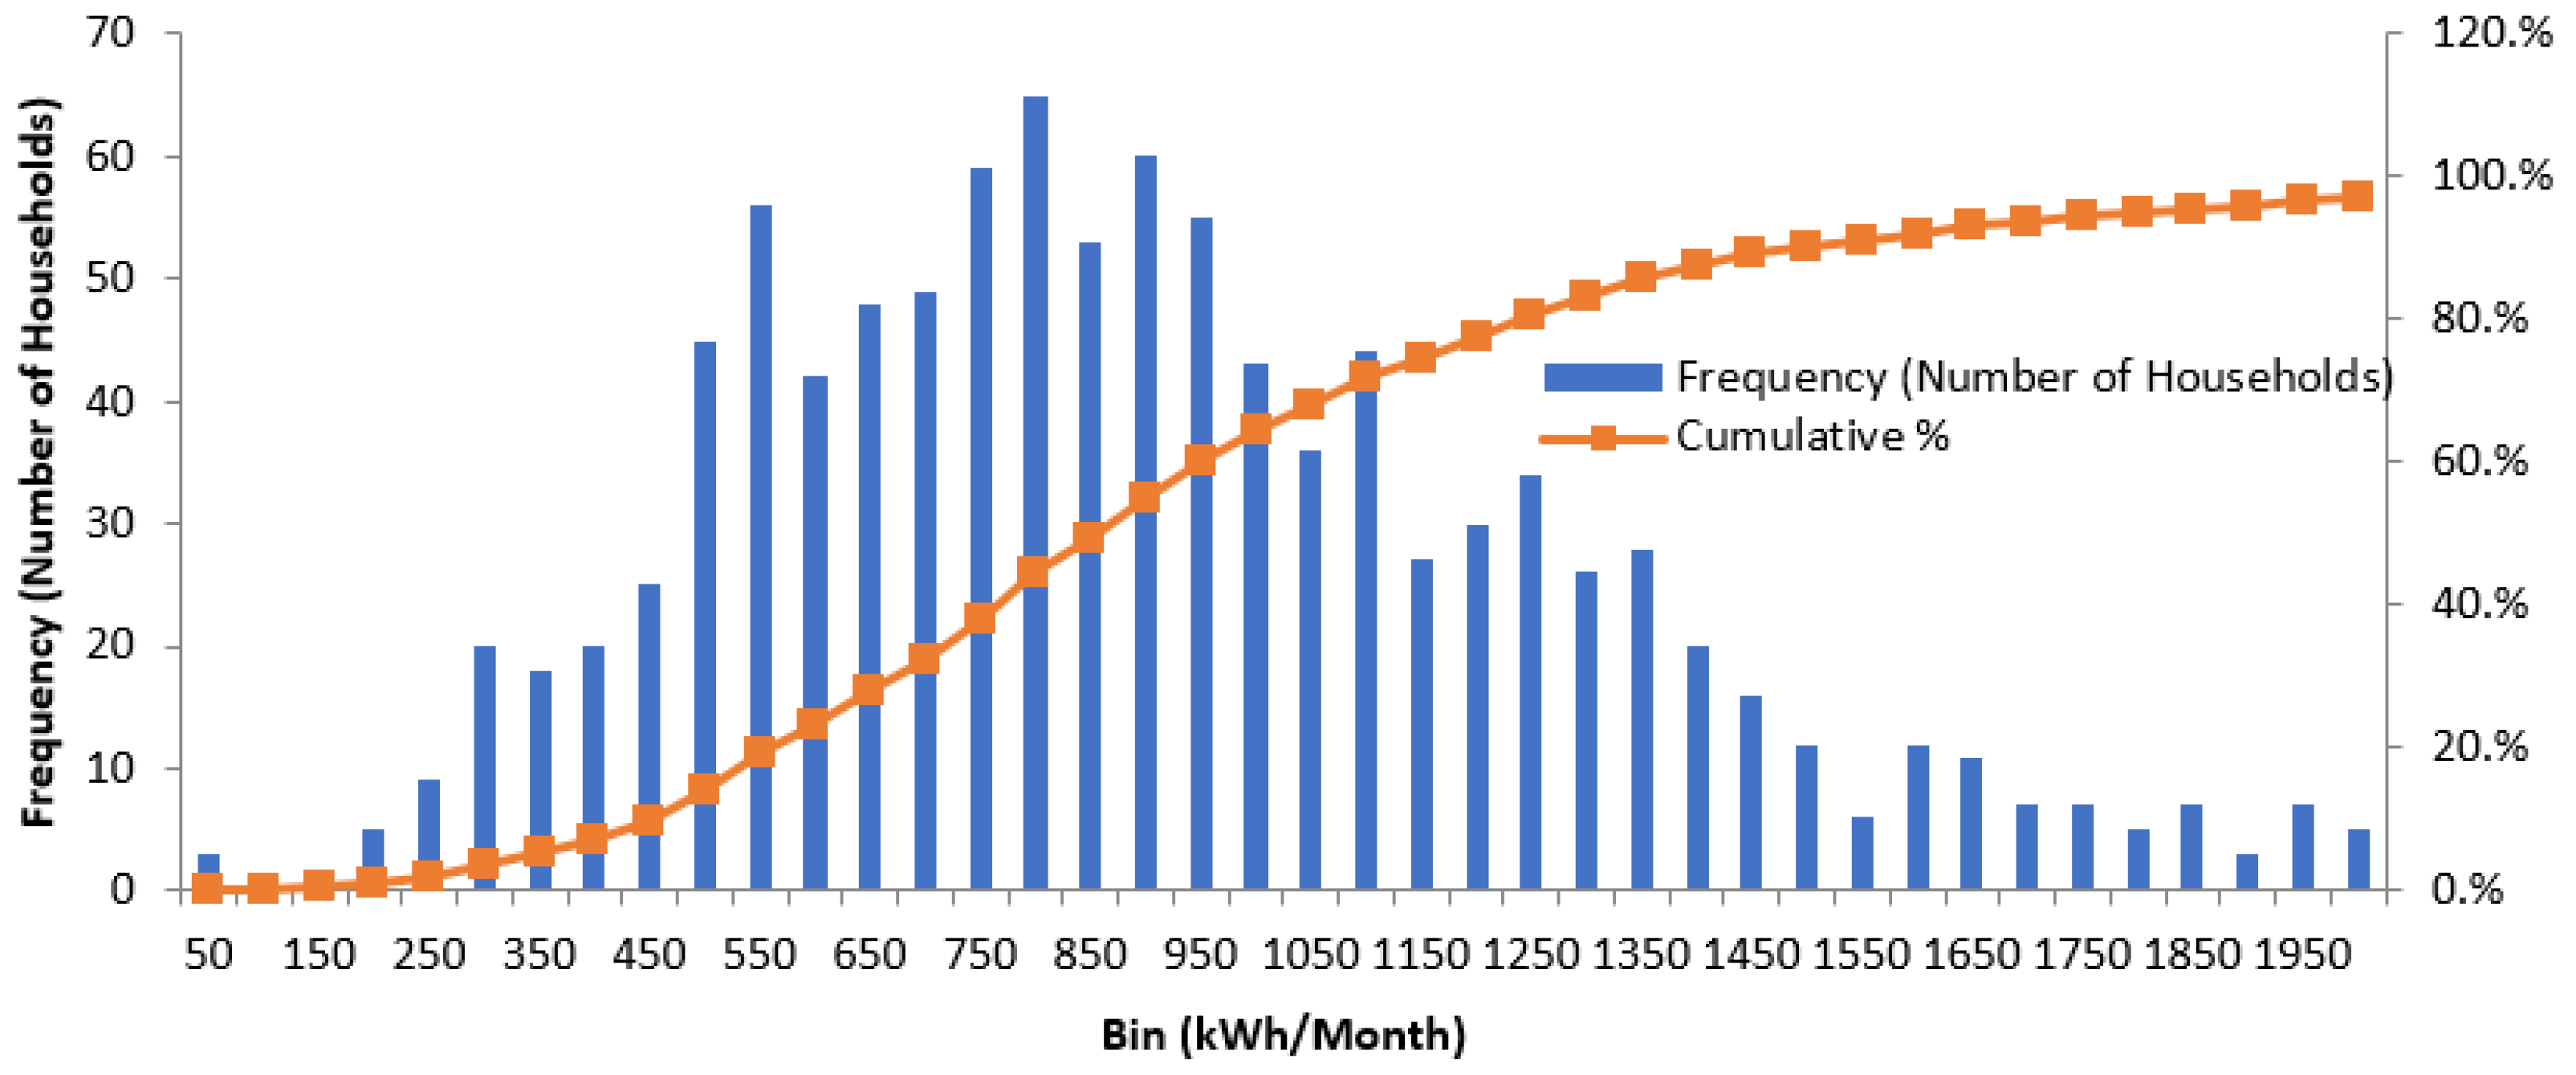
For the subsidized group less than 8% of the households used less than 400 kWh in the month of January (as shown in Figure 7), 90% of ordinary households used less than 600 kWh in January compared to just 23.3% of the subsidised group, where the 90% point for the subsidized households occurs at around 1500 kWh.
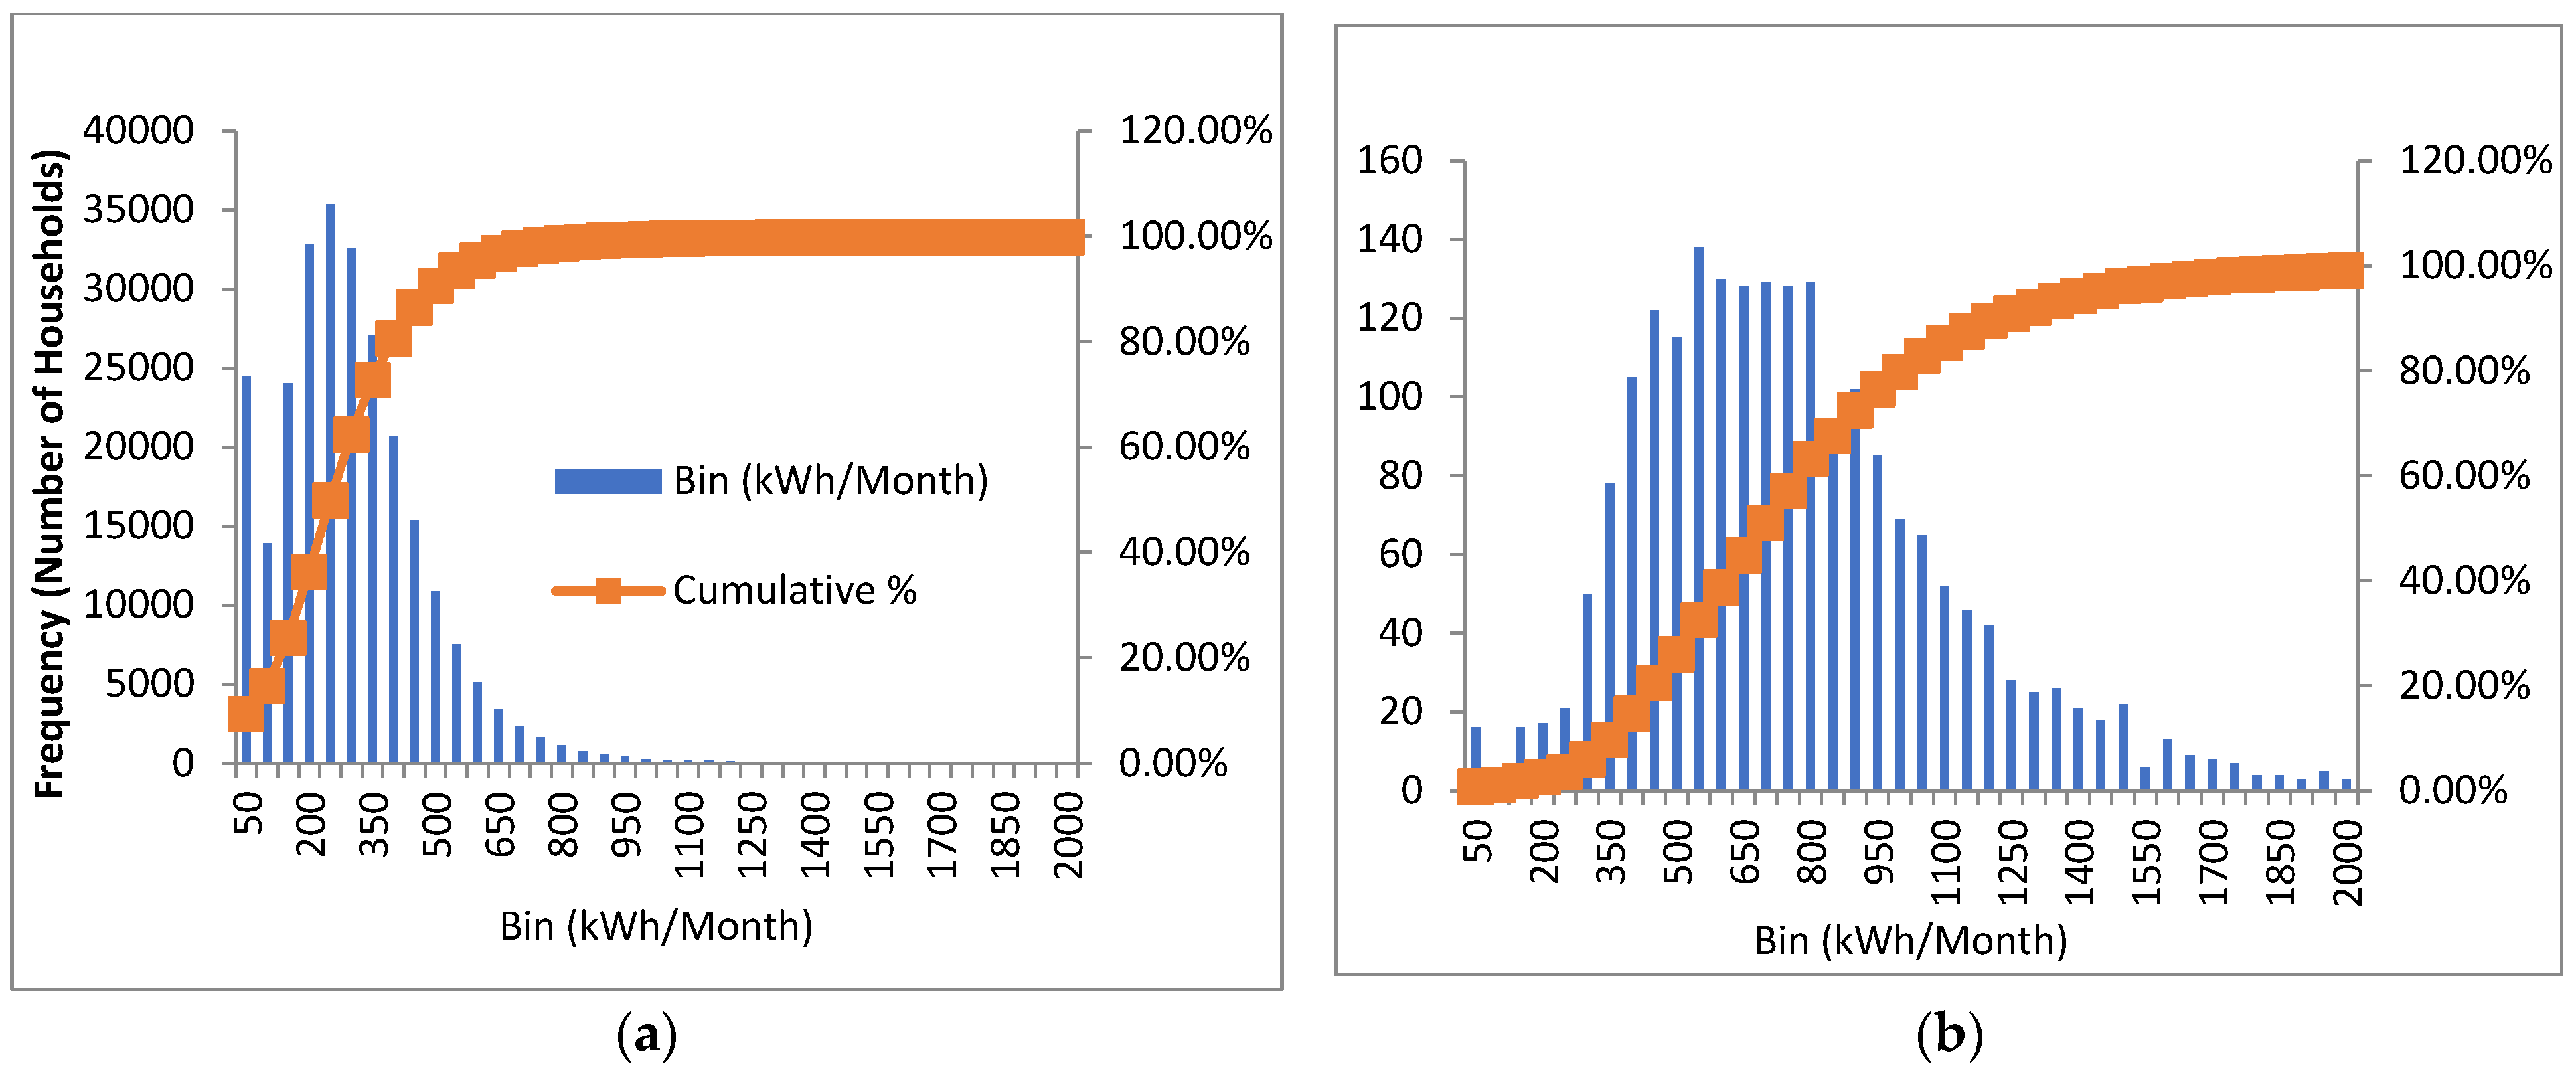
The consumption patterns of the studied groups show significant differences. In the ordinary group, 82.5% of households used less than 500 kWh and 52% used less than 300 kWh during the month of February. In the subsidised group, these figures are only 26% and 6%, as shown in Figure 8.
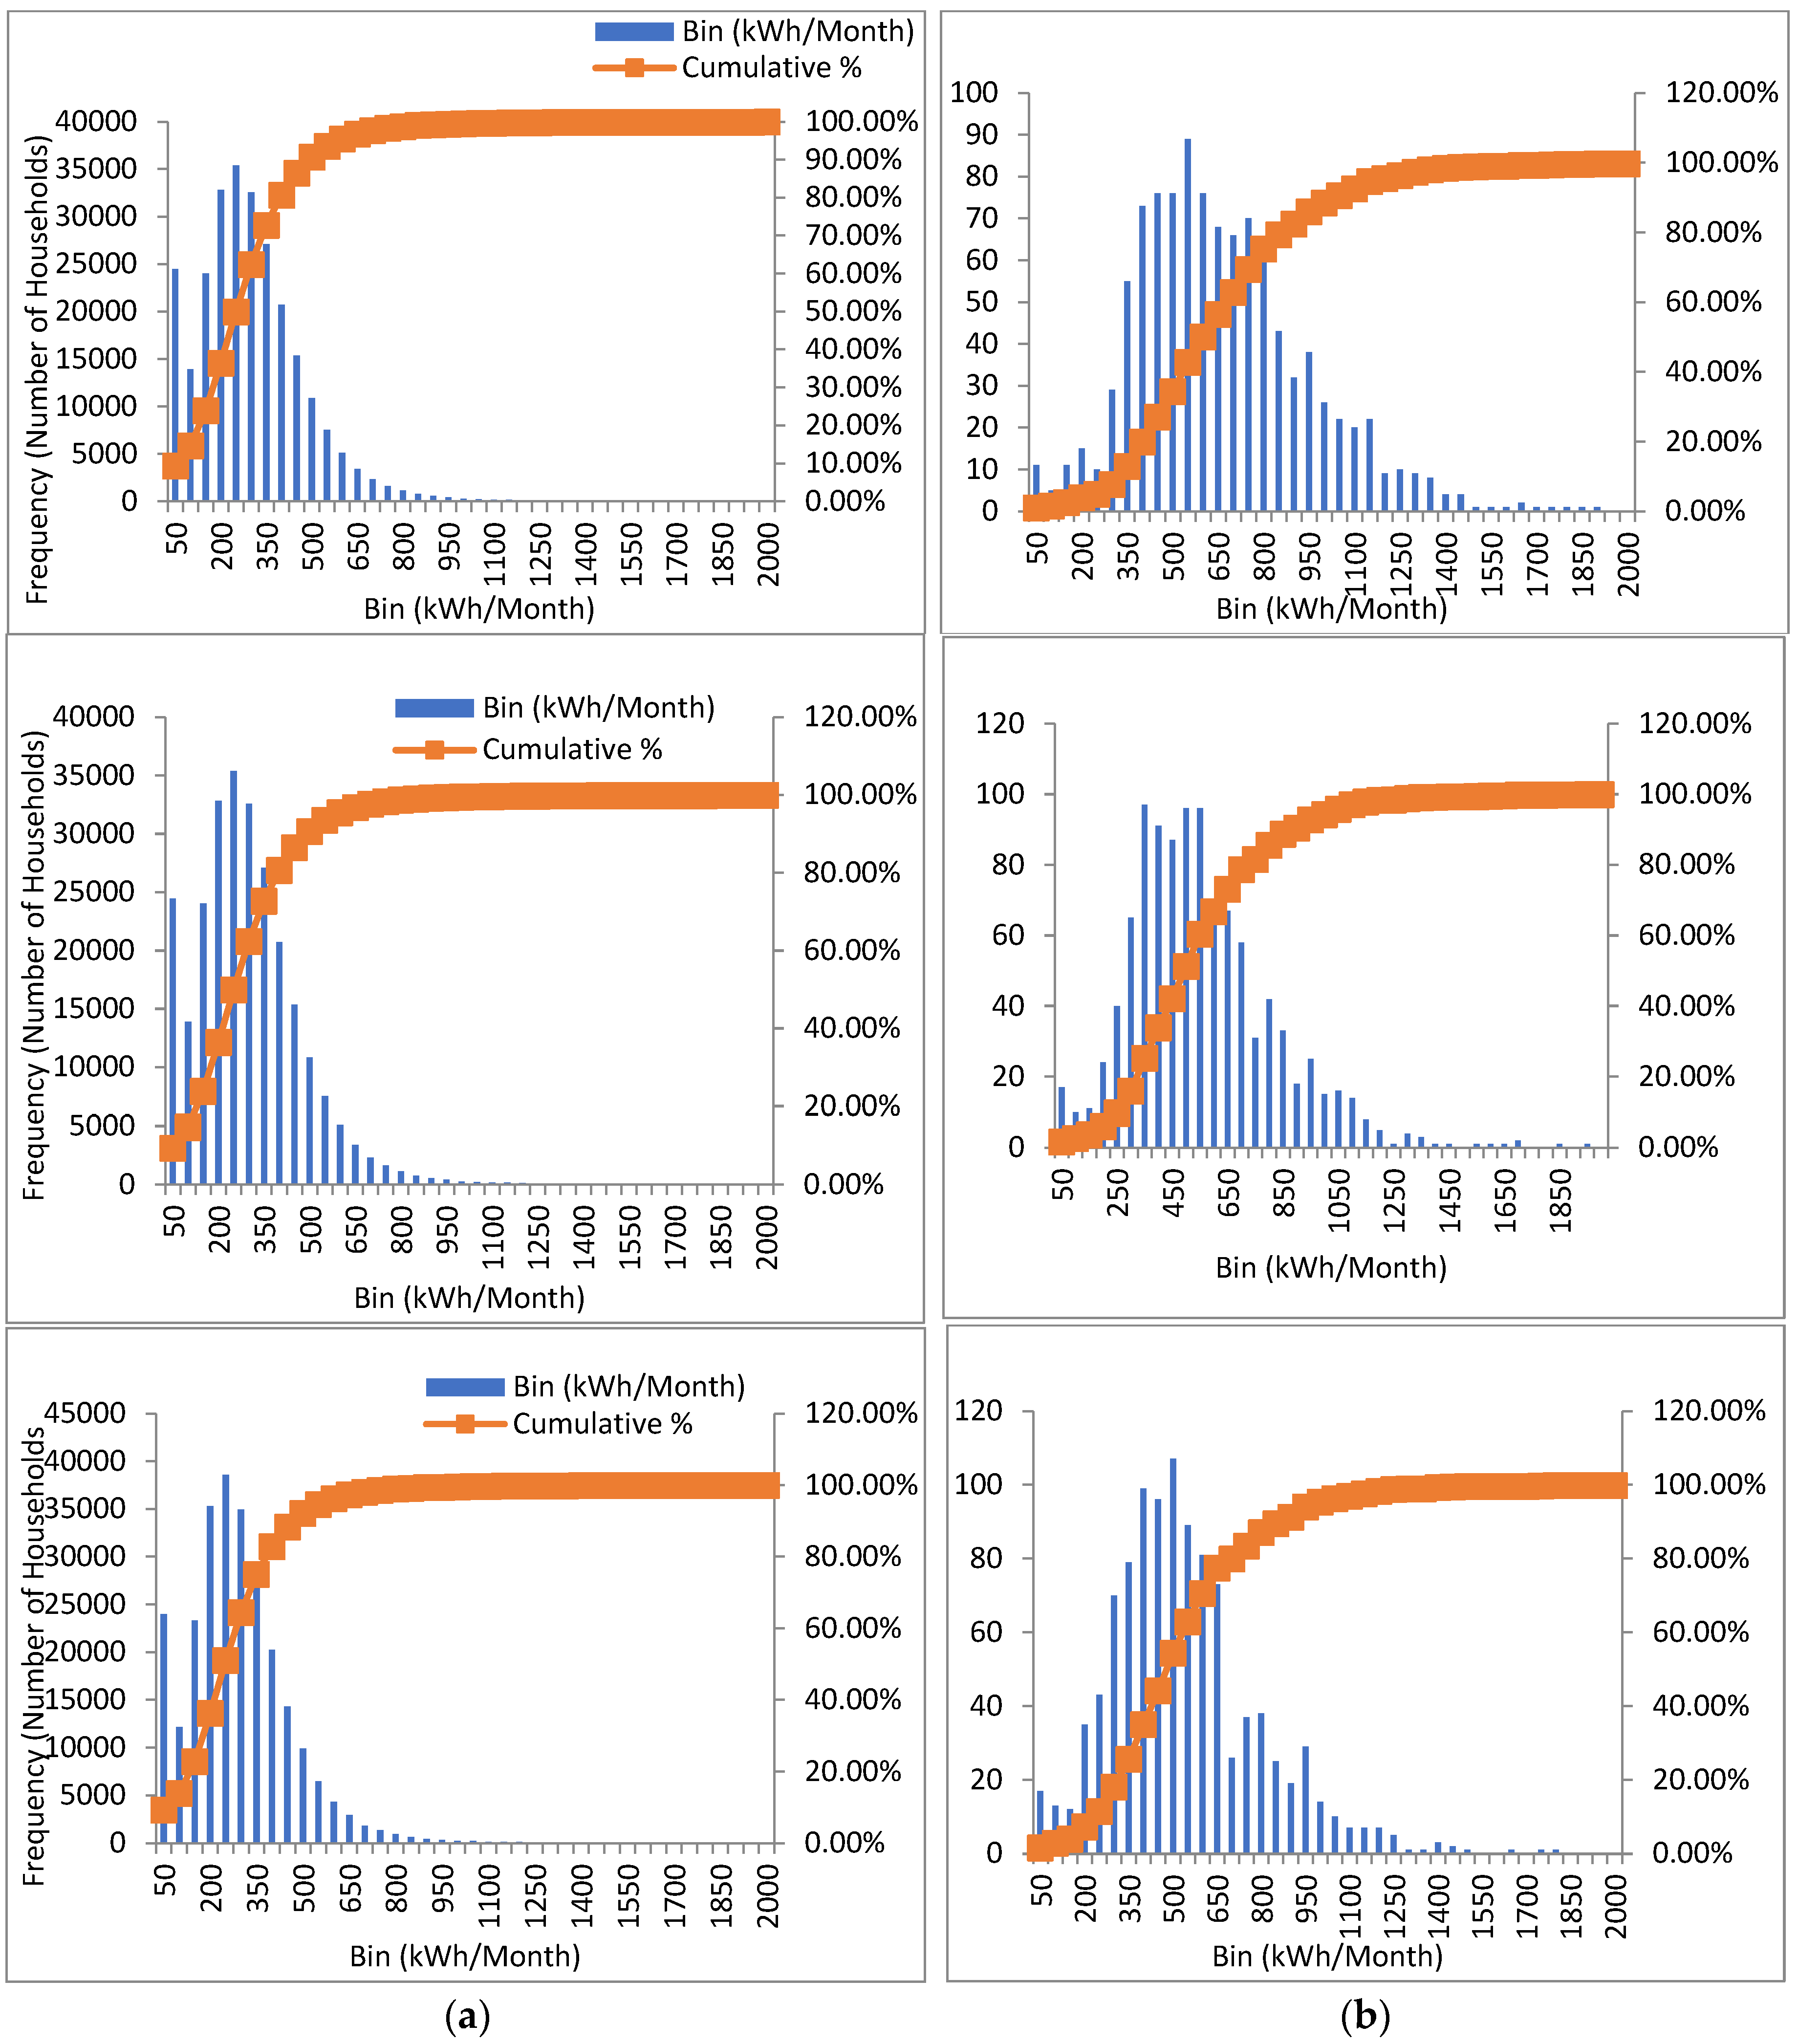
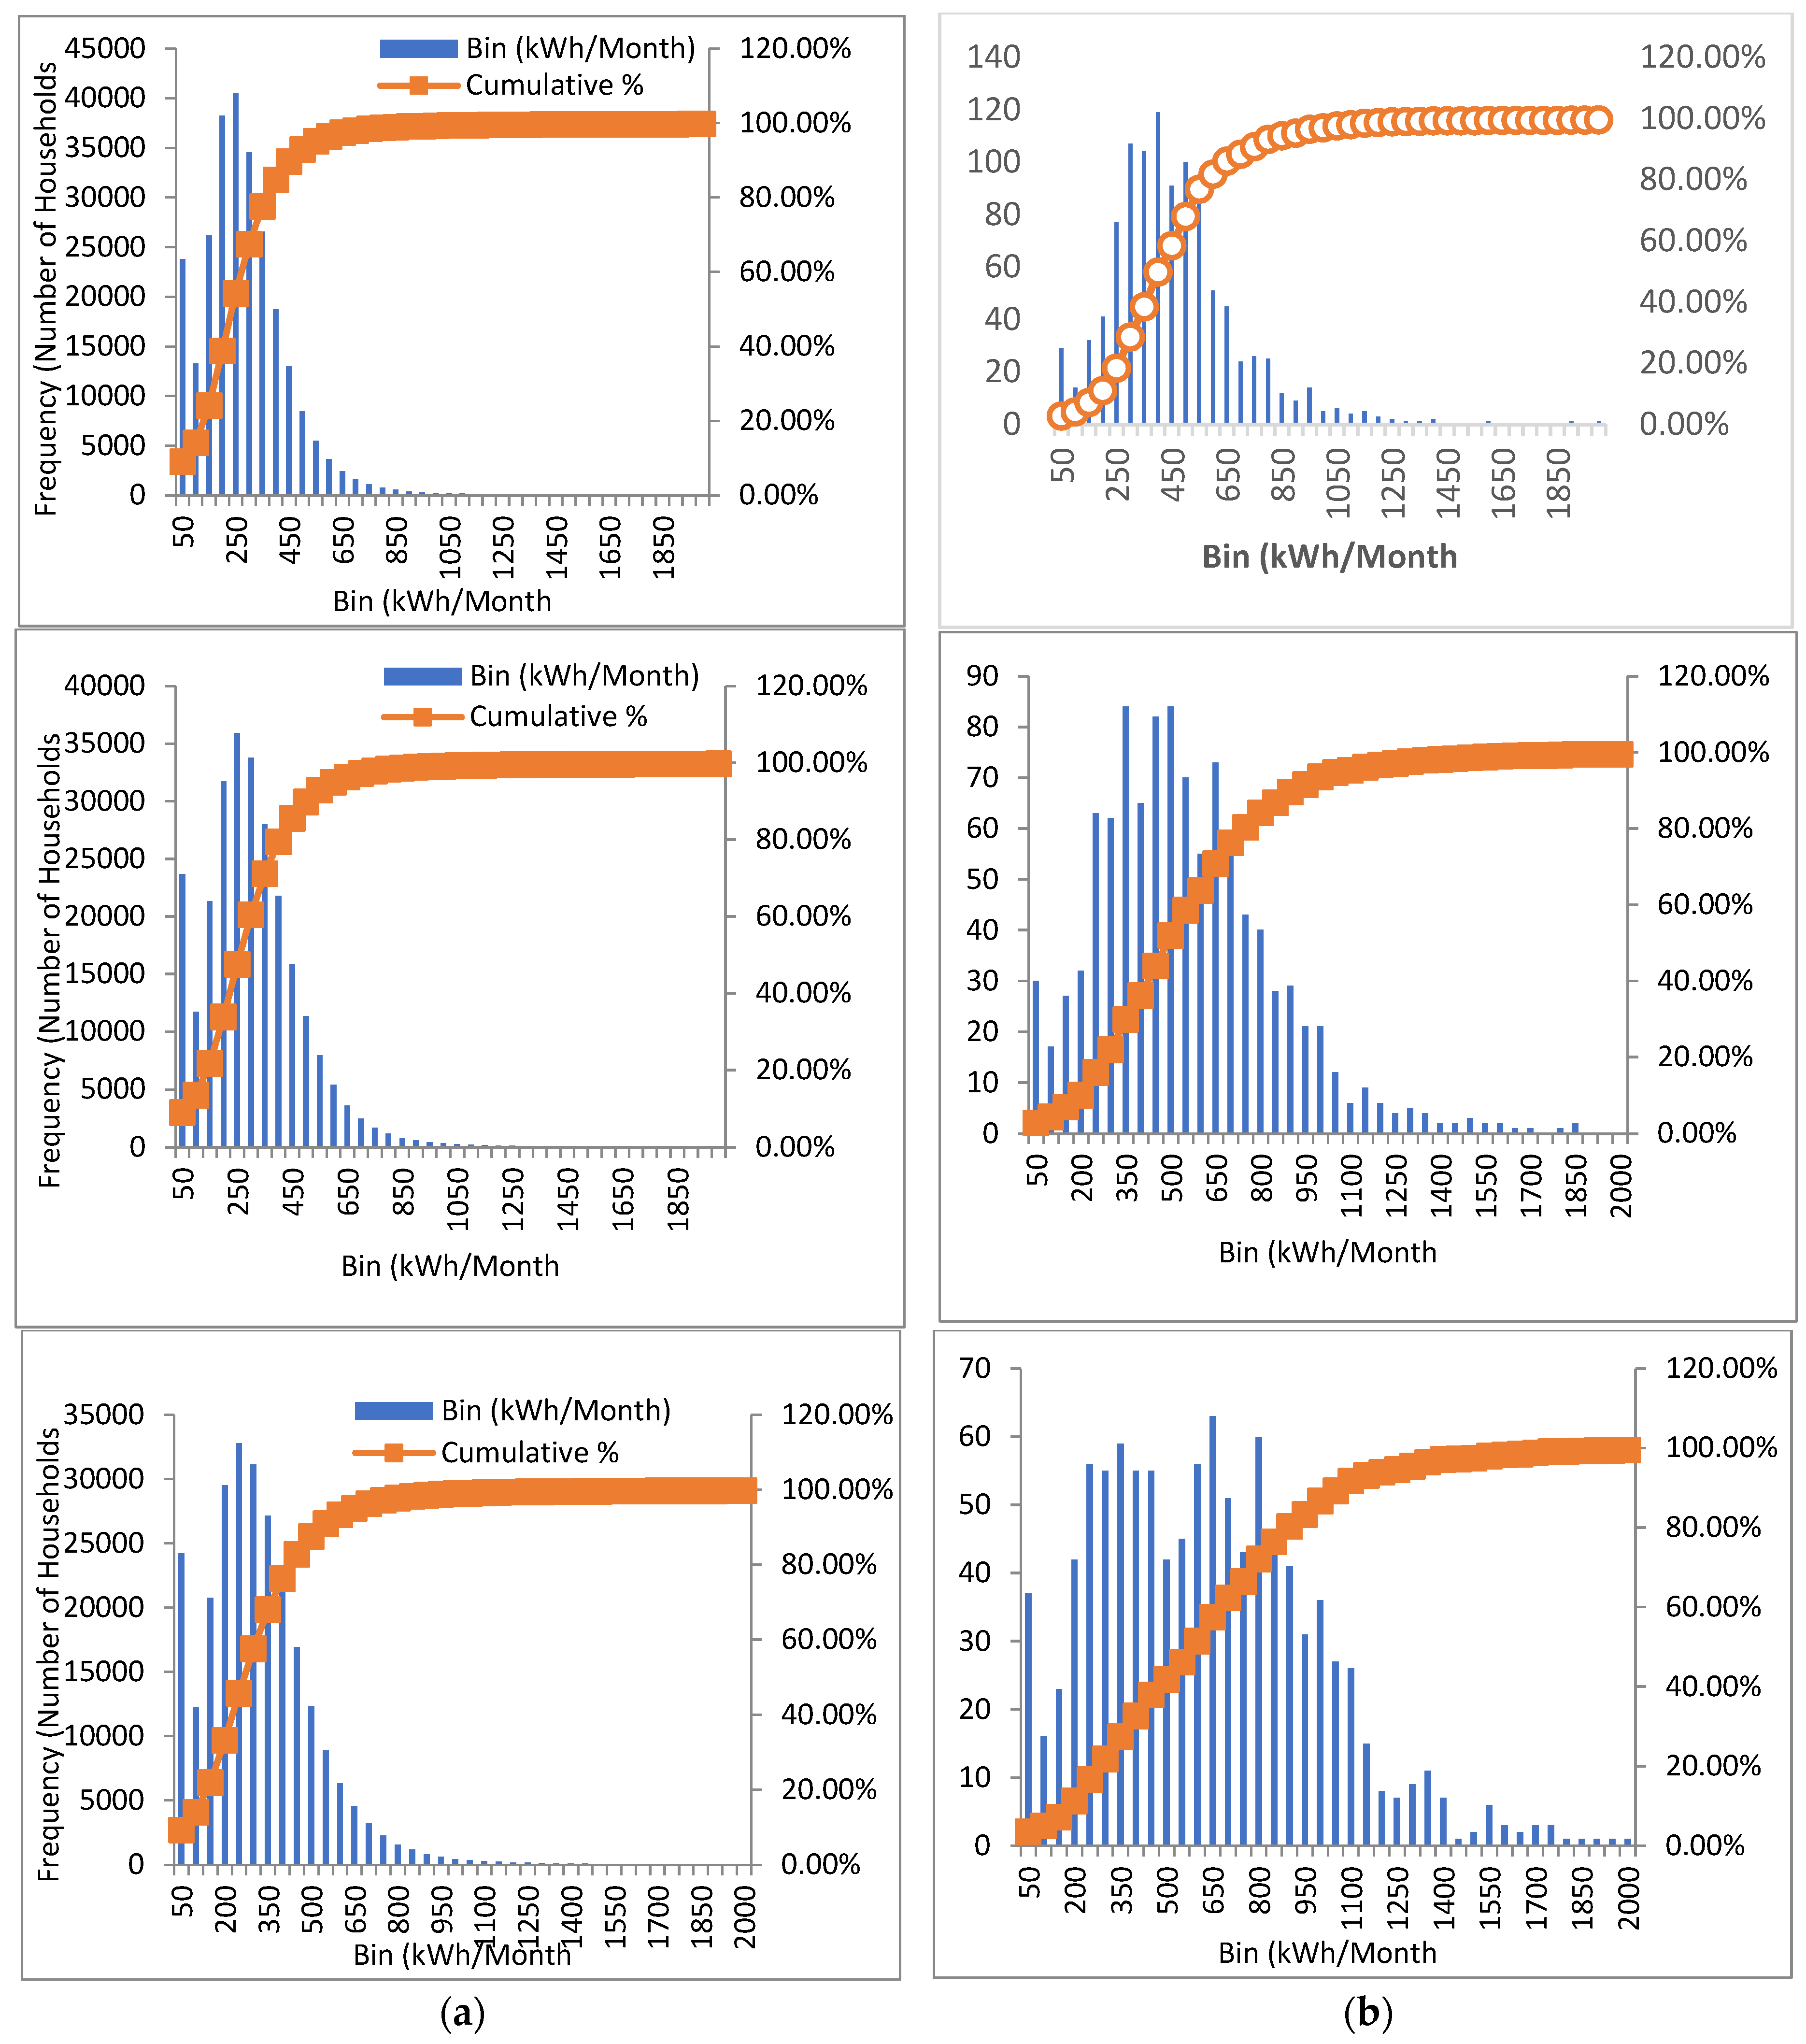
During the spring months of March, April, and May, the ordinary group had lower electrical energy usage. Specifically, 62%, 65%, and 64% consumed less than 300 kWh, and more than 91% of these households used less than 500 kWh, as shown in Figure 9. In contrast, only 8%, 16%, and 18% of the subsidized group consumed less than 300 kWh, and 34%, 51%, and 54% used less than 500 kWh during the same spring months, respectively. It is evident that the subsidised group does not fully interact with their external environment in terms of saving energy (by, for example, getting the maximum from the warm winter sun or cool summer breeze) and heavily relies on the mechanical heating and cooling all year around to sustain their thermal comfort.
During the summer months (June, July, August, and September), ordinary households follow the same pattern as in the winter months, whereby around 85% of this group use less than 500 kWh and around 54% consume less than 300 kWh, while 14%, 18%, 17% and 20% of the subsidised households use less than 300 kWh and less than 42% use less than 500 kWh in the same months, as shown in Figure 10.
Figure 11 similarly shows that in October, November and December, the subsidised group uses a significant amount of electrical energy, especially for heating, with 67%, 60% and 57% of the ordinary households using less than 300 kWh per October, November and December, respectively, while 28%, 21% and 21% used less than 300 kWh for the same period.
It was clear that lower electrical cost will discourage subsidised households from using sustainable and low-cost solutions that could minimize heating and cooling loads significantly, for instance by operating the air-conditioning on 26 °C for cooling and 21 °C heating in addition to wearing proper clothes for the season [50,51]. Jordan will need to increase the share in renewable energy, increase energy efficiency, and also synergise agreements with other countries [52].
From these findings, it is evident that electrical energy subsidies encourage energy consumption and place pressure on the government budget, especially in non-oil producing countries such as Jordan. This will also affect other governmental projects such as those in the education, health and the infrastructure sector, and will increase the GHG emissions. In addition, the need to implement policies to promote the use of renewable energy, the need to articulate the social bonus for the neediest people, and also to promote environmental education and awareness of energy use. Energy poverty is one of the major problems that we must address, not only the use of air conditioning equipment as a means of adaptation to extreme temperatures but also the need to promote the rehabilitation of housing to make them more efficient.

4. Conclusions

Policy makers in certain countries use social policies and economic incentives to provide electrical energy subsidies with the goal of making energy (i.e., electricity) more affordable for disadvantaged groups of citizens and certain industries or commercial sectors. This helps to create a more attractive local economy for the business sector, which can lead to job creation and improved competitiveness in the global market. As electrical energy subsidies comprise a significant share of government budgets, affecting other governmental projects in education, health and infrastructure, the higher cost of long-term electrical energy subsidies prevents the governments from achieving their socioeconomic purpose. In addition, subsidised electrical energy is one of the main barriers to renewable energy investment and promotion of energy efficiency [53].
This study compared two groups of electrical energy users (ordinary customers and subsidized IDECO employees) in Jordan to examine the effects of subsidizing electrical energy on energy consumption and consumption behaviour in the residential sector. The results showed that the average monthly electricity consumption of ordinary households was almost half that of the subsidized group, and that electricity consumption peaked during the summer and winter months. These results are in line with the recent report published by the Energy & Minerals Regulatory Commission (EMRC) website [54].
There are significant differences in the monthly consumption patterns for each studied group. In the ordinary group, 82.5% and 52% of the households used less than 500 kWh and 300 kWh, respectively, during February, in the subsidised group, only 26% and 6%. In spring (March, April and May) the ordinary group used less electrical energy, whereby 62%, 65%, and 64% consumed less than 300 kWh, and more than 91% of these households used less than 500 kWh. On the other hand, just 8%, 16%, and 18% of the subsidised group consumed less than 300 kWh, and 34%, 51%, and 54% used less than 500 kWh during the same spring months, respectively. It is evident that the subsidised group does not fully interact with their external environment in terms of saving energy (by, for example, getting the maximum from the warm winter sun or cool summer breeze) and heavily relies on the mechanical heating and cooling all year around to sustain their thermal comfort.
During the summer months (June, July, August, and September), ordinary households follow the same pattern as in the winter months, whereby around 85% of this group use less than 500 kWh and around 54% consume less than 300 kWh, while 14%, 18%, 17% and 20% of the subsidised households use less than 300 kWh and less than 42% use less than 500 kWh in the same months. From these findings it is evident that electrical energy subsidies encourage energy consumption and place pressure on the government budget, especially in non-oil producing countries such as Jordan. This will also affect other governmental projects, such as those in the education, health and infrastructure sector, as well.
Implementing an electricity pricing tariff can encourage sustainability by giving people the ability to regulate their indoor air temperatures through behaviours like adjusting their clothing, opening windows, or using energy-efficient methods (like fans) to achieve their desired level of thermal comfort. This can reduce reliance on mechanical heating and cooling systems. We therefore suggest that fair electricity tariffs should be adopted to control the demand profile. The price categories can be structured to encourage customers (generally those that have significant electricity demand) to reduce their total demand and peak demand. Redesigning subsidies for residential electricity is important for the national economy, as it can help to better control electricity usage and its environmental impact.
In conclusion, this research has shown that electrical energy subsidies can have a negative impact on energy consumption considering the possible limitations of the study, for example, not considering other variables in more detail for each household such as age, education, affiliation, marital status, household, employment, and income. By artificially lowering the price of electricity, subsidies can discourage conservation and encourage overuse. This can lead to increased energy demand and, ultimately, higher levels of energy-related CO2 emissions. In order to promote sustainable energy use and reduce the environmental impact of electricity consumption, it is important for governments to carefully consider the effects of energy subsidies and to consider alternative approaches that encourage conservation, efficient use of energy, and support more renewable energy projects to solve the challenges faces the country [54], as observed in MENA countries such as Qatar [55].

Author Contributions

Methodology, A.A.; Validation, A.A. and A.J.; Formal analysis, A.A.; Investigation, A.A. and F.M.-A.; Resources, A.A. and A.J.; Writing—original draft, A.A. and F.M.-A.; Writing—review and editing, A.A. and A.J.; Supervision, F.M.-A. All authors have read and agreed to the published version of the manuscript.

Funding

This work was funded by the Spanish Ministry of Science, Innovation and Universities under the program “Proyectos de I + D de Generacion de Conocimiento” of the national program for the generation of scientific and technological knowledge and strengthening of the R + D + I system with grant number PGC 2018-098813-B-C 33.

Data Availability Statement

Not applicable.

Acknowledgments

We are grateful to Irbid District Electricity Distribution Company (IDECO) in Jordan for supplying us with the data used in this research.

Conflicts of Interest

The authors declare no conflict of interest.

References

  1. Global Energy & CO2 Status Report—The Latest Trends in Energy and Emissions in 2018. International Energy Agency. Available online: https://www.iea.org/reports/global-energy-co2-status-report-2019 (accessed on 20 May 2022).
  2. Abu-Rumman, G.; Khdair, A.I.; Khdair, S.I. Current status and future investment potential in renewable energy in Jordan: An overview. Heliyon 2020, 6, e03346. [Google Scholar] [CrossRef] [PubMed]
  3. Google Maps. Available online: https://www.google.com/maps/@31.2798856,37.122627,4z (accessed on 22 May 2022).
  4. Nepco.com.jo. Nationl Electric Power Company—NEPCO HomePage. 2019. Available online: http://www.nepco.com.jo/en/electricity_sector_structure_en.aspx (accessed on 15 April 2019).
  5. Lipton, D. Energy Subsidy Reform: The Way Forward; Lipton, D., Ed.; International Monetary Fund: Washington, DC, USA, 2013. [Google Scholar]
  6. Acharya, R.H.; Sadath, A.C. Implications of energy subsidy reform in India. Energy Policy 2017, 102, 453–462. [Google Scholar] [CrossRef]
  7. Wesseh, P.K., Jr.; Lin, B. Refined oil import subsidies removal in Ghana: A ‘triple’ win? J. Clean. Prod. 2016, 139, 113–121. [Google Scholar] [CrossRef]
  8. Zhang, F. Energy Price Reform and Household Welfare: The Case of Turkey. Energy J. 2015, 36, 71–95. [Google Scholar] [CrossRef]
  9. Soile, I.; Mu, X. Who benefit most from fuel subsidies? Evidence from Nigeria. Energy Policy 2015, 87, 314–324. [Google Scholar] [CrossRef]
  10. Dennis, A. Household welfare implications of fossil fuel subsidy reforms in developing countries. Energy Policy 2016, 96, 597–606. [Google Scholar] [CrossRef]
  11. Siddig, K.; Aguiar, A.; Grethe, H.; Minor, P.; Walmsley, T. Impacts of removing fuel import subsidies in Nigeria on poverty. Energy Policy 2014, 69, 165–178. [Google Scholar] [CrossRef]
  12. del Granado, F.J.A.; Coady, D.; Gillingham, R. The Unequal Benefits of Fuel Subsidies: A Review of Evidence for Developing Countries. World Dev. 2012, 40, 2234–2248. [Google Scholar] [CrossRef] [Green Version]
  13. Abdelrahim, K.E. Economic impact of energy subsidy and subsidy reform measures: New evidence from Jordan. Int. J. Bus. Soc. Res. 2014, 4, 98–110. [Google Scholar]
  14. Sdralevich, M.C.A.; Sab, M.R.; Zouhar, M.Y.; Albertin, G. Subsidy Reform in the Middle East and North Africa: Recent Progress and Challenges Ahead; International Monetary Fund: Washington, DC, USA, 2014. [Google Scholar]
  15. Cooke, E.F.; Hague, S.; Tiberti, L.; Cockburn, J.; El Lahga, A.-R. Estimating the impact on poverty of Ghana’s fuel subsidy reform and a mitigating response. J. Dev. Eff. 2016, 8, 105–128. [Google Scholar] [CrossRef]
  16. Plante, M. The long-run macroeconomic impacts of fuel subsidies. J. Dev. Econ. 2014, 107, 129–143. [Google Scholar] [CrossRef]
  17. Demery, L. Benefit Incidence: A Practitioner’s Guide; The World Bank: Washington, DC, USA, 2000. [Google Scholar]
  18. Coady, D. The Distributional Impacts of Indirect Tax and Public Pricing Reforms: A Review of Methods and Empirical Evidence; Poverty and Social Impact Analysis by the IMF: Review of Methodology and Selected Evidence; International Monetary Fund: Washington, DC, USA, 2008. [Google Scholar]
  19. Maboshe, M.; Kabechani, A.; Chelwa, G. The welfare effects of unprecedented electricity price hikes in Zambia. Energy Policy 2019, 126, 108–117. [Google Scholar] [CrossRef]
  20. Feng, K.; Hubacek, K.; Liu, Y.; Marchán, E.; Vogt-Schilb, A. Managing the distributional effects of energy taxes and subsidy removal in Latin America and the Caribbean. Appl. Energy 2018, 225, 424–436. [Google Scholar] [CrossRef] [Green Version]
  21. Gharibnavaz, M.R.; Waschik, R. Food and energy subsidy reforms in Iran: A general equilibrium analysis. J. Policy Model. 2015, 37, 726–741. [Google Scholar] [CrossRef]
  22. Araar, A.; Verme, P. Reforming Subsidies A Tool-kit for Policy Simulations. World Bank Policy Res. Work. Pap. 2012, 6148. [Google Scholar] [CrossRef]
  23. Rentschler, J. Incidence and impact: The regional variation of poverty effects due to fossil fuel subsidy reform. Energy Policy 2016, 96, 491–503. [Google Scholar] [CrossRef] [Green Version]
  24. Dartanto, T. Reducing fuel subsidies and the implication on fiscal balance and poverty in Indonesia: A simulation analysis. Energy Policy 2013, 58, 117–134. [Google Scholar] [CrossRef]
  25. Al Iriani, M.A.; Trabelsi, M. The economic impact of phasing out energy consumption subsidies in GCC countries. J. Econ. Bus. 2016, 87, 35–49. [Google Scholar] [CrossRef]
  26. Mundaca, G. Energy subsidies, public investment and endogenous growth. Energy Policy 2017, 110, 693–709. [Google Scholar] [CrossRef] [Green Version]
  27. Jiang, Z.; Ouyang, X.; Huang, G. The distributional impacts of removing energy subsidies in China. China Econ. Rev. 2015, 33, 111–122. [Google Scholar] [CrossRef]
  28. Henseler, M.; Maisonnave, H. Low world oil prices: A chance to reform fuel subsidies and promote public transport? A case study for South Africa. Transp. Res. Part A Policy Pract. 2018, 108, 45–62. [Google Scholar] [CrossRef]
  29. Elshennawy, A. The implications of phasing out energy subsidies in Egypt. J. Policy Model. 2014, 36, 855–866. [Google Scholar] [CrossRef]
  30. Li, K.; Jiang, Z. The impacts of removing energy subsidies on economy-wide rebound effects in China: An input-output analysis. Energy Policy 2016, 98, 62–72. [Google Scholar] [CrossRef]
  31. Coady, D.; Parry, I.; Sears, L.; Shang, B. How Large Are Global Fossil Fuel Subsidies? World Dev. 2017, 91, 11–27. [Google Scholar] [CrossRef]
  32. Gelan, A.U. Kuwait’s energy subsidy reduction: Examining economic and CO2 emission effects with or without compensation. Energy Econ. 2018, 71, 186–200. [Google Scholar] [CrossRef]
  33. Li, Y.; Shi, X.; Su, B. Economic, social and environmental impacts of fuel subsidies: A revisit of Malaysia. Energy Policy 2017, 110, 51–61. [Google Scholar] [CrossRef]
  34. Mundaca, G. How much can CO2 emissions be reduced if fossil fuel subsidies are removed? Energy Econ. 2017, 64, 91–104. [Google Scholar] [CrossRef] [Green Version]
  35. Wesseh, P.K., Jr.; Lin, B.; Atsagli, P. Environmental and welfare assessment of fossil-fuels subsidies removal: A computable general equilibrium analysis for Ghana. Energy 2016, 116, 1172–1179. [Google Scholar] [CrossRef]
  36. Li, J.; Sun, C. Towards a low carbon economy by removing fossil fuel subsidies? China Econ. Rev. 2018, 50, 17–33. [Google Scholar] [CrossRef]
  37. Solaymani, S.; Kari, F. Impacts of energy subsidy reform on the Malaysian economy and transportation sector. Energy Policy 2014, 70, 115–125. [Google Scholar] [CrossRef]
  38. Yusoff, N.Y.B.M.; Bekhet, H.A. The Effect of Energy Subsidy Removal on Energy Demand and Potential Energy Savings in Malaysia. Procedia Econ. Finance 2016, 35, 189–197. [Google Scholar] [CrossRef]
  39. Baker, P.; Blundell, R.; Micklewright, J. Modelling Household Energy Expenditures Using Micro-Data. Econ. J. 1989, 99, 720. [Google Scholar] [CrossRef]
  40. Moshiri, S. The effects of the energy price reform on households consumption in Iran. Energy Policy 2015, 79, 177–188. [Google Scholar] [CrossRef]
  41. Lin, B.; Jiang, Z. Estimates of energy subsidies in China and impact of energy subsidy reform. Energy Econ. 2011, 33, 273–283. [Google Scholar] [CrossRef]
  42. Liu, W.; Li, H. Improving energy consumption structure: A comprehensive assessment of fossil energy subsidies reform in China. Energy Policy 2011, 39, 4134–4143. [Google Scholar] [CrossRef]
  43. Mills, E. Global Kerosene Subsidies: An Obstacle to Energy Efficiency and Development. World Dev. 2017, 99, 463–480. [Google Scholar] [CrossRef]
  44. Hussein, N. Greenhouse Gas Emissions Reduction Potential of Jordan’s Utility Scale Wind and Solar Projects. Jordan J. Mech. Ind. Eng. 2016, 10, 199–203. [Google Scholar]
  45. Nepco.com.jo. Nationl Electric Power Company—NEPCO Homepage. 2020. Available online: https://www.nepco.com.jo/en/default_en.aspx (accessed on 19 October 2020).
  46. AlFaris, F.; Juaidi, A.; Manzano-Agugliaro, F. Energy retrofit strategies for housing sector in the arid climate. Energy Build. 2016, 131, 158–171. [Google Scholar] [CrossRef]
  47. Albatayneh, A.; Alterman, D.; Page, A.; Moghtaderi, B. Renewable Energy Systems to Enhance Buildings Thermal Performance and Decrease Construction Costs. Energy Procedia 2018, 152, 312–317. [Google Scholar] [CrossRef]
  48. Albatayneh, A.; Alterman, D.; Page, A.; Moghtaderi, B. Alternative Method to the Replication of Wind Effects into the Buildings Thermal Simulation. Buildings 2020, 10, 237. [Google Scholar] [CrossRef]
  49. Albatayneh, A.; Jaradat, M.; AlKhatib, M.; Abdallah, R.; Juaidi, A.; Manzano-Agugliaro, F. The Significance of the Adaptive Thermal Comfort Practice over the Structure Retrofits to Sustain Indoor Thermal Comfort. Energies 2021, 14, 2946. [Google Scholar] [CrossRef]
  50. Muhaidat, J.; Albatayneh, A.; Assaf, M.N.; Juaidi, A.; Abdallah, R.; Manzano-Agugliaro, F. The Significance of Occupants’ Interaction with Their Environment on Reducing Cooling Loads and Dermatological Distresses in East Mediterranean Climates. Int. J. Environ. Res. Public Health 2021, 18, 8870. [Google Scholar] [CrossRef]
  51. Sandri, S.; Hussein, H.; Alshyab, N. Sustainability of the Energy Sector in Jordan: Challenges and Opportunities. Sustainability 2020, 12, 10465. [Google Scholar] [CrossRef]
  52. Albatayneh, A.; Juaidi, A.; Abdallah, R.; Peña-Fernández, A.; Manzano-Agugliaro, F. Effect of the subsidised electrical energy tariff on the residential energy consumption in Jordan. Energy Rep. 2022, 8, 893–903. [Google Scholar] [CrossRef]
  53. Energy & Minerals Regulatory Commission (EMRC). Available online: https://emrc.gov.jo/Pages/viewpage?pageID=368 (accessed on 31 December 2022).
  54. Albatayneh, A.; Hindiyeh, M.; AlAmawi, R. Potential of Renewable energy in Water-Energy-Food Nexus in Jordan. Energy Nexus 2022, 7, 100140. [Google Scholar] [CrossRef]
  55. Hussein, H.; Lambert, L. A Rentier State under Blockade: Qatar’s Water-Energy-Food Predicament from Energy Abundance and Food Insecurity to a Silent Water Crisis. Water 2020, 12, 1051. [Google Scholar] [CrossRef]
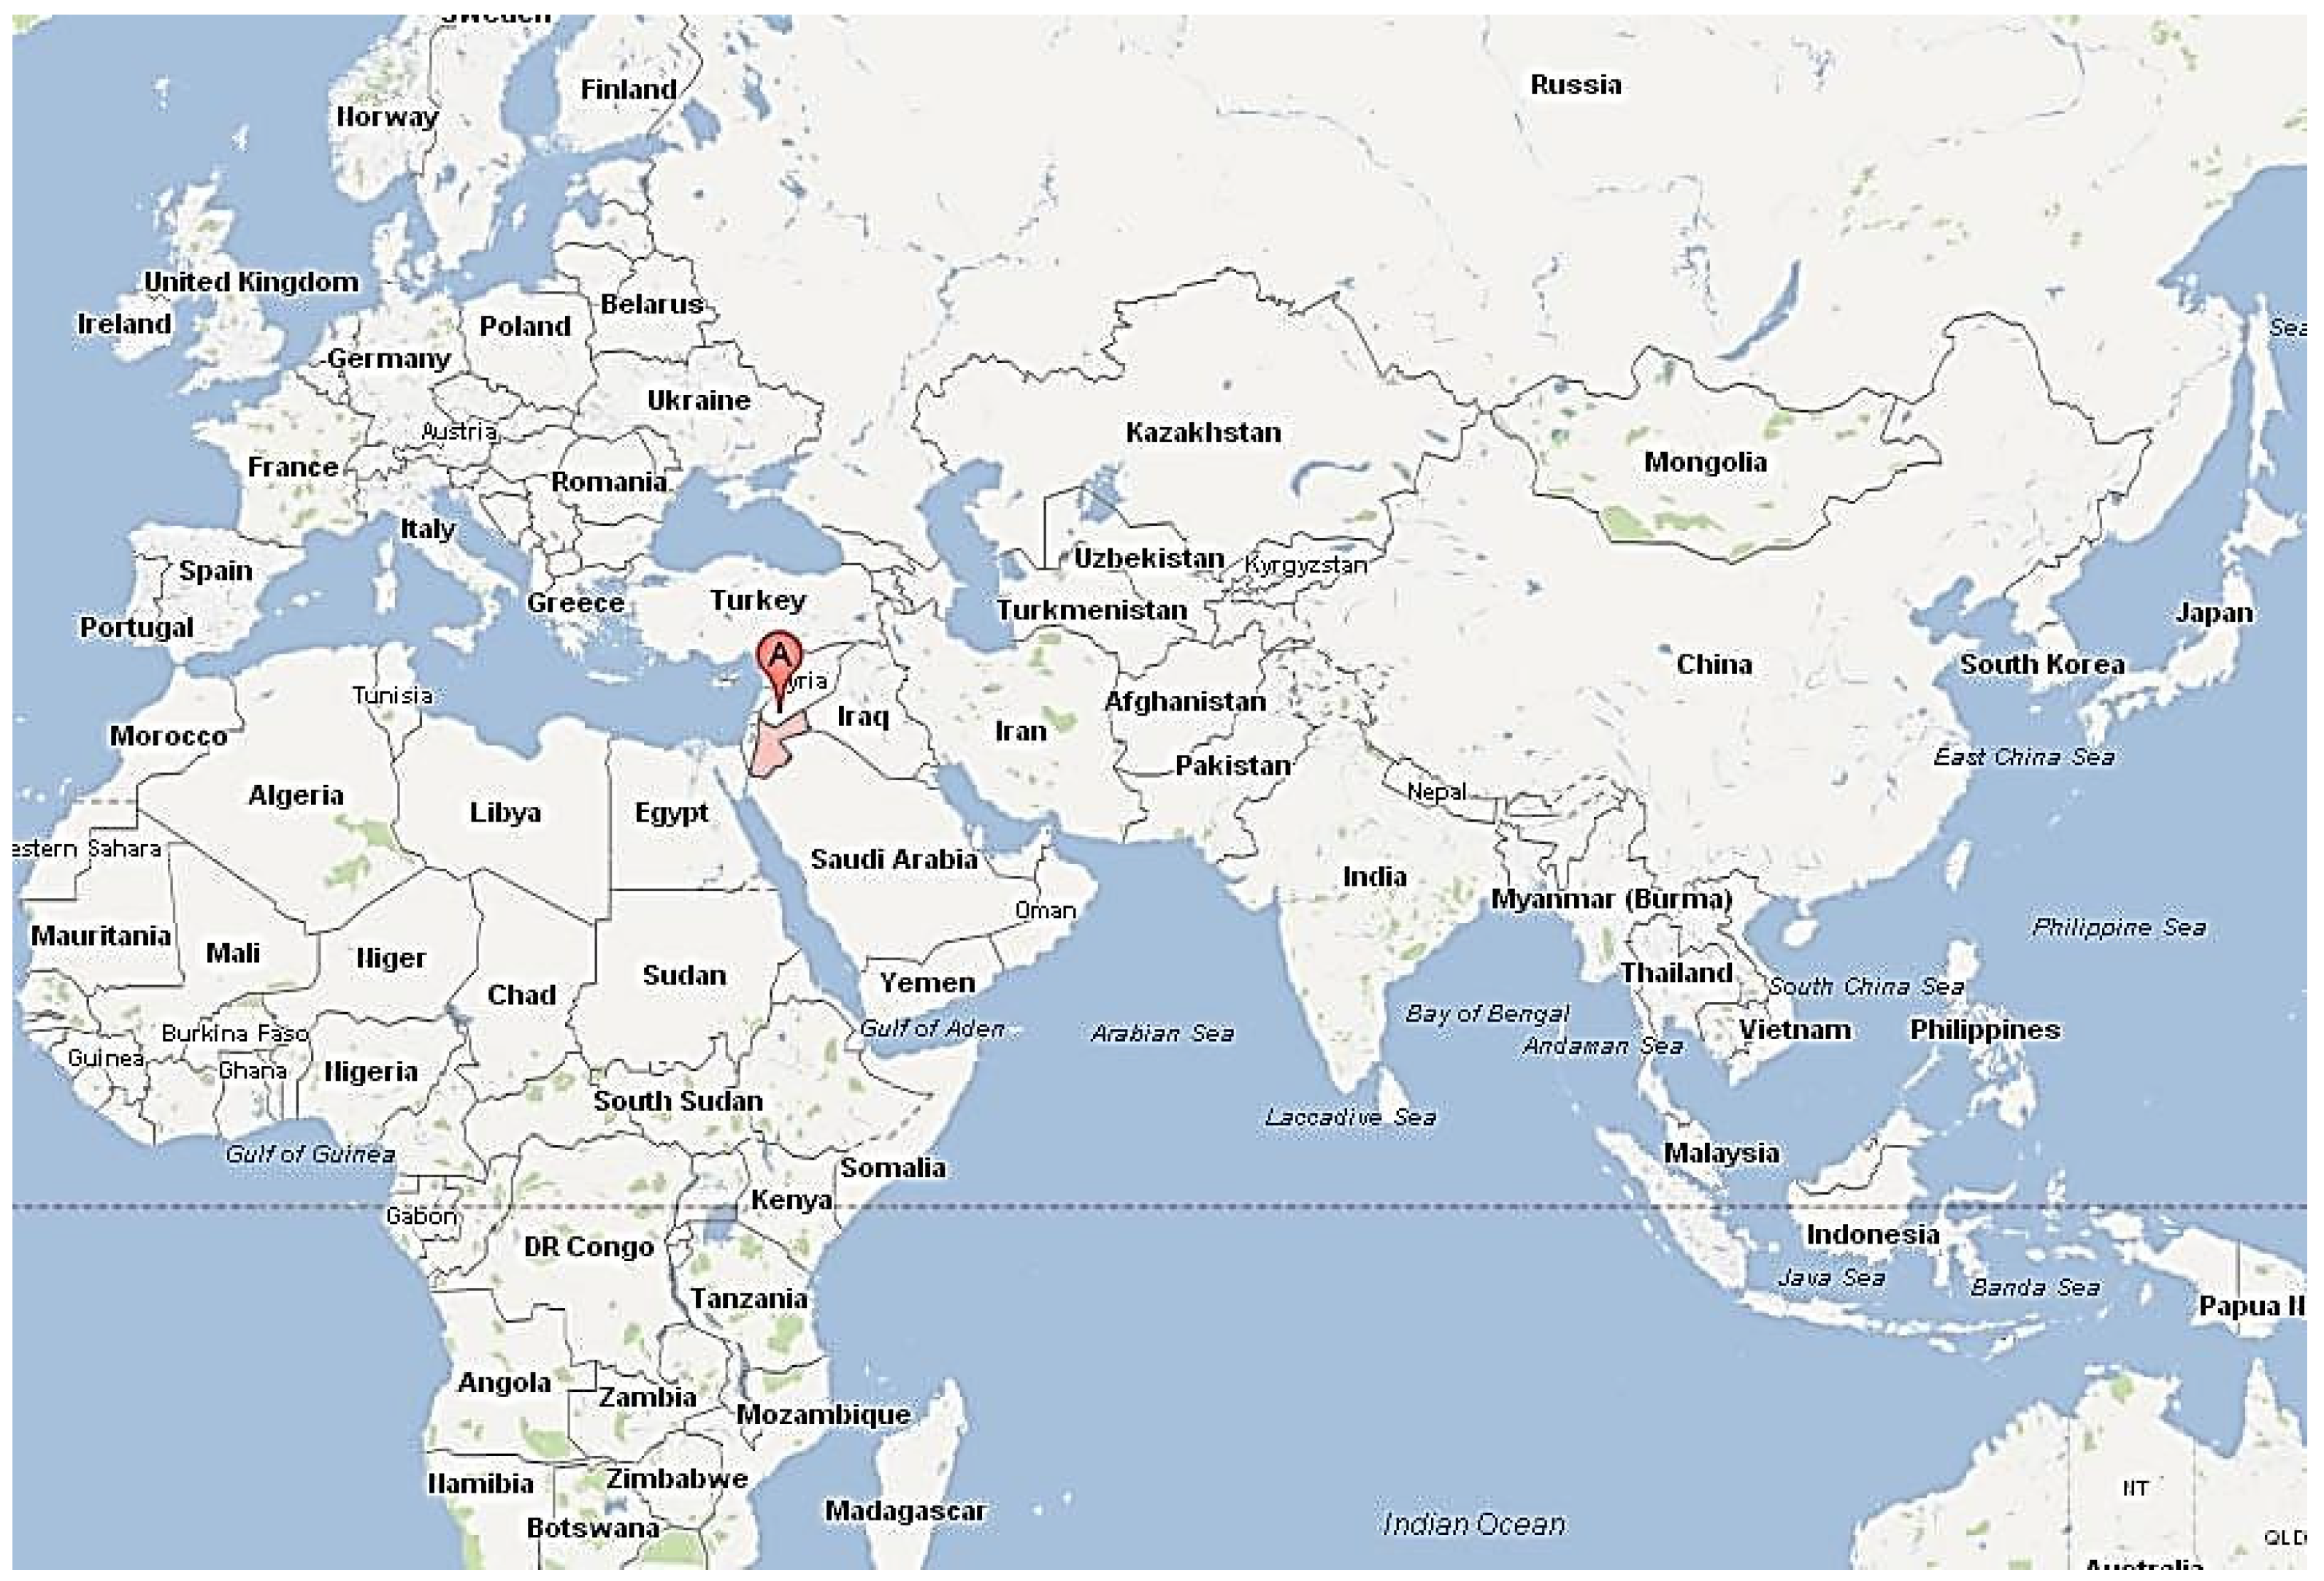
Figure 1. Location of Jordan (Google Maps) [3].
Energies 16 00981 g001
Figure 2. The JEPCO, EDCO and IDECO electricity distribution regions in Jordan.
Energies 16 00981 g002
Figure 3. The average monthly electricity consumption for ordinary and subsidised households.
Energies 16 00981 g003
Figure 4. Monthly electrical energy consumption for ordinary and subsidised households over a two-year period.
Energies 16 00981 g004
Figure 5. Oscillations in the energy consumption for ordinary and subsidised households.
Energies 16 00981 g005
Figure 6. Cumulative % for the ordinary households in January.
Energies 16 00981 g006
Figure 7. Cumulative % for the subsidised households in January.
Energies 16 00981 g007
Figure 8. Energy consumption in February: (a) Ordinary households; and (b) Subsidised households.
Energies 16 00981 g008
Figure 9. Energy consumption in March, April, and May: (a) Ordinary households; and (b) Subsidized households.
Energies 16 00981 g009
Figure 10. Energy consumption June, July, August, and September: (a) Ordinary households; and (b) Subsidized households.
Energies 16 00981 g010
Figure 11. Energy consumption October, November and December: (a) Ordinary households; and (b) Subsidized households.
Energies 16 00981 g011
Table 1. Tariffs for monthly energy consumption by households.
Household TariffUSD/kWh
1–160 kWh/Month0.05
161−300 kWh/Month0.10
301−500 kWh/Month0.12
501−600 kWh/Month0.16
601−750 kWh/Month0.22
751−1000 kWh/Month0.26
>1000 kWh/Month0.37
Disclaimer/Publisher’s Note: The statements, opinions and data contained in all publications are solely those of the individual author(s) and contributor(s) and not of MDPI and/or the editor(s). MDPI and/or the editor(s) disclaim responsibility for any injury to people or property resulting from any ideas, methods, instructions or products referred to in the content.