Abstract
Climate change and the depletion of fossil fuels make it urgent to find an alternative to oil-based fuels, especially in machines powered by internal combustion engines. Biomass is currently a poorly used source of energy and meets the necessary conditions to replace a large part of oil-based fuels. However, current engines cannot burn solid biomass and a specific engine needs to be developed. This work proposes the thermodynamic cycle of a biomass-fueled internal combustion engine. The cycle is significantly different from the Otto cycle, since compression and heat absorption occur simultaneously, in a single stage. Since it is not possible to find a function that relates pressure to volume at this stage, an approximate method is proposed to solve the cycle without resorting to numerical methods. The results show that the maximum pressure and temperature of a biomass-fueled engine cycle are somewhat higher than those of the equivalent Otto cycle. However, more significantly, the cycle efficiency does not increase continuously with the compression ratio. There is an optimum compression ratio value for which the cycle efficiency is at its maximum. This fact will condition the design of the motors.
1. Introduction
Fossil fuels are currently a fundamental pillar of society. Food production, mining and transportation depend on energy obtained from internal combustion engines that use oil-based fuels. The substitution of these fuels is an essential task since: (1) As the latest IPCC (Intergovernmental Panel on Climate Change) report warns, the emission of greenhouse gases causes climate change that is seriously affecting society [1]; (2) The location of oil reserves generates serious geopolitical problems [2]; and (3) Oil is a finite energy source that, at current consumption rates, will be depleted before the end of the century [3].
Numerous studies address this problem, on the one hand, by evaluating alternative fuels [4], on the other hand, through the electrification of motor machines [5]. However, the alternatives proposed so far have only succeeded in replacing fossil fuels in specific applications and present strong drawbacks for large-scale implementation. The fundamental reason is that oil is a source of energy and can only be replaced by another source of energy. The problem must, therefore, be approached from an energy point of view.
In the case of ethanol, despite its widespread use in mixture with gasoline [6], several studies indicate that the classical process of alcoholic fermentation is not energetically viable. Producing ethanol requires 29% more energy than ethanol itself contains as fuel [7]. Recent research [8,9,10] contemplates the production of ethanol from the cellulose of agricultural by-products and indicates that improvement in the hydrolysis stage is necessary to achieve a viable and sustainable process.
The production of biogas, obtained from the anaerobic digestion of organic matter, is another source of renewable fuel. With a methane content of 60% [11], it can be used as fuel in generator sets for the production of electrical energy [12]. The usefulness of anaerobic digestion as a waste treatment process is undeniable, but the slowness of the process, the low yield (less than 45% under laboratory conditions) [13,14] and its sensitivity to the digested matter properties [15] prevent biogas’s use as a fuel on a large scale.
The production of biodiesel from energy crops is considered energetically viable [16,17,18], generating about three to four times more fuel than contained in the crop itself. However, the production of biodiesel requires the use of farmland that could be used for food production. This can lead to a problem if there is not enough wasteland. As an example, in the case of Spain, to cover its gasoline and diesel needs [19], approximately 38.63 × 10⁶ ha (76% of the national territory) should be allocated to sunflower cultivation. Thus, the large amount of land needed makes biodiesel an alternative to only partially replace fuels.
Pyrolysis oils are a product obtained through the decomposition of organic matter when subjected to high temperatures. The energy efficiency of the process to obtain pyrolysis oils is high, from 70% to 80% [20]. However, several studies have pointed out that pyrolysis oils are not a suitable fuel for diesel engines [21], which are very sensitive to the quality of the fuel used [22].
Hydrogen obtained from the electrolysis of water is being considered as a possible substitute for fossil fuels [23]. Its production requires large amounts of electrical energy from renewable sources [24]. As long as the price of electricity is not drastically reduced, hydrogen from natural gas through steam reforming will continue to be used [25]. In addition, several authors have pointed out the danger associated with hydrogen [26,27] due to its flammable nature, high storage pressures [28] and the embrittlement it can cause in metals [29].
In recent years, the electrification of automotive machines has been considered one of the strongest alternatives to reduce dependence on oil [30]. Electric batteries allow the accumulation of electrical energy and its subsequent use in machines that use electric motors. However, they have several limitations: (1) The low energy density of the batteries, 1000 kJ/kg [30], limits the autonomy of vehicles and increases their unladen mass, which decreases their payload; (2) Recharging is a slow process that requires powerful electrical connection points,; and (3) Renewable energy sources are not always available and, as long as energy storage systems are not improved, batteries should be charged only when power is available [31]. Therefore, the use of batteries is, for now, limited to light machines [32].
All the alternatives presented above are helping to achieve independence from oil, but their implementation is slow due to the difficulties already mentioned. If we focus on the use of biomass (untransformed) as an energy source, we can observe several qualities that make it an appropriate candidate to replace fossil fuels in some applications. (1) It can be obtained in large quantities from agricultural or forestry residues [33]. (2) It is considered a renewable energy source. The CO2 emitted in combustion is reabsorbed in plant growth. (3) Its energy density is high, around 15,000 kJ/kg [34], although lower than that of oil-based fuels. (4) It is handled with ease and it can be stored safely. (5) Its use allows the reduction in energy dependence of many countries because, unlike oil, most countries have sources of biomass in their territory. (6) Additionally, it is a source of energy that is not properly used [35] and is compatible with food production [36].
Biomass is currently a fuel widely used in boilers [37] for heat production, but it is not used in internal combustion engines. Biomass burns in a solid state and current engines run on liquid or gaseous fuels [22]. However, until the popularization of oil-based fuels, gas from wood gasification was a fuel used in spark-ignition engines [38]. Moreover, as early as 1924, a solid fuel internal combustion engine was patented [39], proving that biomass could be used as fuel in the form of granules (see Figure 1).
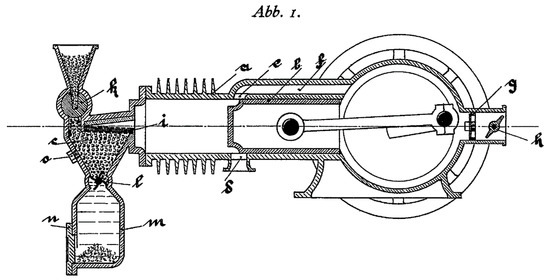
Figure 1.
Patented engine schematic (patent no. DE000000398997A).
Subsequently, there have been other patents in this regard [40,41]. Additionally, attempts to use biomass as fuel by finely pulverizing it have also been made [42,43], but have been unsuccessful.
Climate change, geopolitical tensions and the increase in the price of raw materials make it necessary to advance in the energy transition and, because of this, the use of biomass as fuel in internal combustion engines can be a key alternative. These engines would allow the use of energy from agricultural and forestry by-products, abundant in practically every part of the world.
For the correct development of a biomass engine, it is convenient to know its thermodynamic cycle, which, although similar to that developed by old hot-bulb engines [44], is significantly different from that developed for spark ignition engines or diesel engines. Compared to the Otto cycle, the cycle has one less stage; compression and heat absorption (combustion) occur simultaneously.
The proposed engine has several important differences from other internal combustion engines. The main difference is the use of a combustion chamber separated from the cylinder by a perforated grille. The grille allows gas exchange between the chamber and the cylinder, but retains the fuel in the combustion chamber. In other engines, the fuel is dosed exactly so that approximately stoichiometric combustion occurs. If excess fuel is introduced, it is expelled without being burned, along with the exhaust gases. However, in the proposed engine, the fuel pellets remain in the chamber at a temperature higher than the ignition temperature.
During compression, oxygen entry into the chamber resumes combustion. The combustion occurs whenever oxygen is present in the chamber. The fuel pellets burn in parallel layers for several cycles, until they are so small that they pass through the grille and are expelled along with the exhaust gases. Similarly, the power delivered by the engine is limited by restricting the amount of air entering the cylinder.
This paper has the following objectives: (1) Define the thermodynamic cycle of a biomass-fueled internal combustion engine, establishing its different stages; (2) Represent the cycle in p–V and T–s diagrams; (3) Obtain approximate equations that allow the study of the cycle directly, without resorting to iterative methods; and (4) Compare the proposed cycle with the Otto cycle.
2. Methods
2.1. Introduction
2.1.1. Engine Diagram and Duty Cycle Characterization
Most of the components of a biomass-fueled engine are common with other internal combustion engines (Figure 2), but it does have characteristic components. For example, the feeder introduces the fuel pellets directly into the combustion chamber, preventing the gases present in it from leaving. Fuel feeding is not synchronized with the thermodynamic cycle. To replenish the fuel consumed, fuel can be introduced at any time during engine operation.
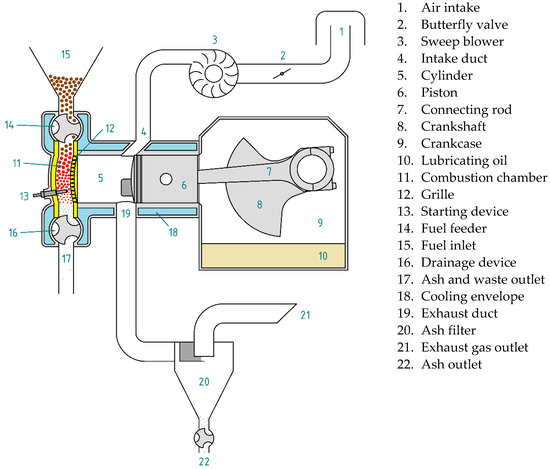
Figure 2.
Main components of a biomass-fueled engine.
For cold starting, an auxiliary device is necessary to raise the temperature of the fuel present in the combustion chamber above the flash point, so that combustion starts spontaneously as soon as oxygen enters the chamber. While the engine is running, the combustion chamber walls and the grille reach very high temperatures. For this reason, they must be made of refractory materials. In addition, it is necessary to equip the combustion chamber with a device for extracting ash or other unburned solids. Moreover, because the exhaust gases drag the ash resulting from combustion and other waste, it is essential to install a filter that retains them to prevent their emission into the atmosphere. An external blower can be used for gas sweeping. In this way, the crankcase can be used to contain the lubricating oil.

Table 1.
Stages of the duty cycle of a biomass-fueled engine.
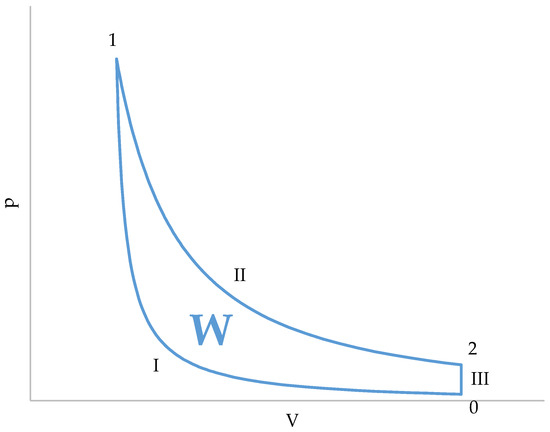
Figure 3.
Graphical representation of the cycle in a p–V diagram.
A characteristic of this cycle is that the compression and absorption of heat (combustion) occur simultaneously, in a single stage (I, Figure 3). During compression, the gases contained in the cylinder gradually enter the combustion chamber. At the end of compression (I, Figure 3), the volume of the cylinder is zero and all gases are contained in the combustion chamber. Since combustion is supposed to occur instantaneously as soon as air enters the combustion chamber, combustion (and, therefore, heat absorption) will be finished at the end of compression.
The other two stages of the cycle are simpler. The expansion (II, Figure 3) is an adiabatic transformation, and pressure and temperature of the gases present in the combustion chamber and in the cylinder are the same. This is explained by the fact that all the gases come from the combustion chamber and, therefore, they start from the same initial conditions.
The third stage (III, Figure 3) is an isochoric heat release. What actually occurs is that the piston uncovers the exhaust port. Then, the gases undergo a free expansion () and, after that, the gases contained in the cylinder are replaced by air taken from the atmosphere. An important detail is that only the gases in the cylinder are replaced, while those in the combustion chamber remain in the conditions they were in after free expansion. This means that the temperature of the gases present in the combustion chamber after expansion is an initial condition of the compression stage.
The above description corresponds to a two-stroke engine, in which a cycle is completed with a decrease and a subsequent increase in cylinder volume. In a four-stroke engine, it is necessary to decrease and increase the additional volume to evacuate the gases present in the cylinder and replace them with air. In these additional variations of the cylinder volume, the pressure remains low and no work is done, so it does not influence the thermodynamic cycle. Another difference is that, at the end of the expansion time, instead of uncovering the exhaust port, the exhaust valve opens to allow the gases to exit.
2.1.2. System Setup
A distinctive feature of the duty cycle of a biomass-fueled engine is that it occurs in two separate but interrelated chambers: the cylinder and the combustion chamber (Figure 4).
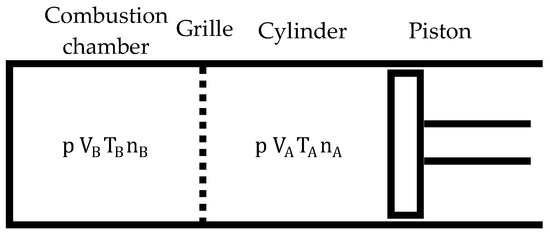
Figure 4.
Layout for duty cycle study.
The cylinder is a variable volume chamber, while the combustion chamber volume is fixed, that is, . The grille allows gas exchange between both chambers when the pressures in them are different (until the pressure differences between them balance) but prevents the mixing of gases between the chambers. The gases contained in both chambers may have different compositions and temperatures, so that:
Pressure is identical in both chambers.
In contrast, temperatures may be different.
2.1.3. Assumed Simplifications
To carry out the study, the following simplifications were assumed:
- The gases present in the chambers are considered to respond to the ideal diatomic gas laws. The engines run on air, which is mainly composed of nitrogen. Under working conditions, at relatively low pressures and well above its boiling point, nitrogen, and, therefore, air, behaves practically like a diatomic ideal gas.
- Nitrogen is considered an inert gas throughout the cycle. It does not react on combustion.
- The specific heats of the gases, and , are considered constant throughout the pressure and temperature range of the cycle.
- There are no thermal exchanges between the gases present in the chambers and their walls, or with the outside. Actually, there is considerable heat loss through the walls of the chambers. To obtain more realistic results, a lower value for the calorific value of the fuel (C) can be chosen.
- Combustion is considered an instantaneous phenomenon. Oxygen entering the combustion chamber is immediately consumed in combustion, producing heat.
- All the heat produced in combustion is used to heat the gases present in the combustion chamber.
- The total number of moles of gas remains constant after combustion, that is, . Actually, the number is increased a little by fuel breakdown.
- The volume of the combustion chamber occupied by the fuel remains constant., that is, . Actually, combustion produces a small decrease in the volume occupied by the fuel.
- Volume variations of the combustion chamber caused by the fuel supply system are not considered, .
- At the end of the compression stroke, the volume of the cylinder is considered to be reduced to zero. All the gases present in the cylinder enter the combustion chamber.
Furthermore, the combustion chamber is full of fuel pellets at all times, so the volume that must be taken for the study () is less than its total volume (). Although the chamber is completely filled with fuel granules, there are gaps between the granules through which the gases can flow. The sum of the volume of these gaps gives . The volume filled by the fuel pellets is approximately half the total volume of the combustion chamber. The fill factor () is the amount of the combustion chamber volume occupied by the fuel. is obtained from the following equation:
Hereinafter, the value of will be considered constant due to simplifications 8 and 9 listed above.
2.2. Compression Stage Study
Compression is the most particular stage of the cycle. The expansion and sweeping of gases are identical to those of the Otto cycle and are already defined in thermodynamics books. It is necessary to obtain an equation that relates the pressure to the volume of the cylinder during compression. Subsequently, the equation will be integrated to obtain the work done by compression (). Once is known, it can be added to and divided by the absorbed heat to obtain the cycle efficiency ().
During the compression stage, both chambers have the same pressure, but different temperatures. Additionally, there is a transfer of the gases present from to that ends when . This transfer of gases determines the rate of combustion and, therefore, the rate of heat absorption. It is considered that the heat is fully absorbed by the gases present in the combustion chamber, raising its temperature (Figure 5). Compression in the cylinder is an adiabatic process. There is no heat exchange in it.
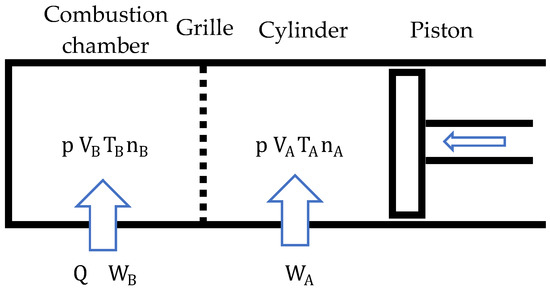
Figure 5.
Cycle compression stage schematics.
The sign criterion taken in the study, applied to the first principle of thermodynamics, is as follows:
Heat is positive when it is added to the system. Work is negative when it is added to the system, so that:
During compression, both the gases present in the cylinder () and those in the combustion chamber () do work. It seems contradictory that work can be done in the combustion chamber, whose volume is constant (). Work is done because, during compression, gases from the cylinder enter the combustion chamber, compressing those that are already inside.
For simplicity and so that the results can be extrapolated to any motor, the study has been carried out on a molar basis. The moles of gas present in the chambers add up to 1 kmol at all times. Then:
In this way, the volume of the cylinder and the combustion chamber is indifferent. Only the relationship between them matters, which is fixed by the compression ratio ().
2.2.1. Initial Conditions
The initial conditions of the cycle are the following:
- Pressure at the beginning of compression;
- Temperature in the cylinder at the beginning of compression;
- Compression ratio;
- Heating value of the fuel per kmol of air consumed.
In addition to these conditions, the initial temperature of the combustion chamber () is needed to start the calculation of the compression process, but this requires solving the entire cycle. Thus, we need to estimate a value for . Once the cycle is resolved, another value of is obtained. Then, it can be compared with the value used to start the calculation. If the values are different, the value of obtained must be taken to recalculate the cycle, obtaining another value of closer to the true value. In this case, it has been considered that the calculation is valid when the estimated value of and the value obtained differ by less than 0.1%.
Fortunately, the initial value of has little influence on the calculation. This is because, in practice, is always greater than 5, so is much greater than . Furthermore, it is always true that , so at the beginning of the compression, . There is very little gas in the combustion chamber, so its initial temperature has little influence on the calculation. Thus, the following value of for the first calculation is recommended:
The value will be corrected in successive calculations until a value with an acceptable error is obtained.
2.2.2. Calculation of Chamber Volumes
Once the initial conditions have been defined, the next step is to calculate both the initial volume of the cylinder () and that of the combustion chamber (), assuming a total of 1 kmol of gases. The system of equations to be solved is as follows:
Solving for , and , and substituting in :
Now we can solve for the value of :
Substituting in the other equations, we obtain the volumes of the chambers:
2.2.3. Obtaining the p(v) Equation of Compression
To define the equation that relates pressure to volume during compression, the dimensionless variable , which is a number between 0 and 1, is assumed. At the beginning of compression, and, at the end, . Therefore, x defines the value of the volume of the cylinder:
is not a required variable. could be used directly in the calculation, but using allows the unbinding of the results from the volume and its units, relating the compression progress to a dimensionless number. In short, the use of simplifies the calculation.
Assuming that the pressure is the same in both chambers, the equations that define the state of the gases are the following:
These equations must be written as a function of and , which is the number of moles of gas that, in this state of compression, have been transferred from to . Then:
In contrast, depends on not only , but also on and . According to the first law of thermodynamics:
Knowing that:
is a function of and according to the following equation:
Then:
However, depends on the value that has taken since the beginning of the compression:
This fact has an important consequence: it is not possible to determine the pressure in a compression state without first determining the pressure of all the previous states from the beginning of the compression. That is, the different states of compression must be calculated from the beginning of the compression. In addition, the work done by compression has to be calculated together with the pressure in the chambers, because both quantities are related. Therefore, there is not an equation that links pressure to volume during the compression stage of the cycle. The same goes for the work done.
2.3. Iterative-Numerical Method for Cycle Calculation
Since it is not possible to obtain the equation for the cycle compression, the following calculation procedure is proposed (see Figure 6). The value of will be obtained through numerical integration.
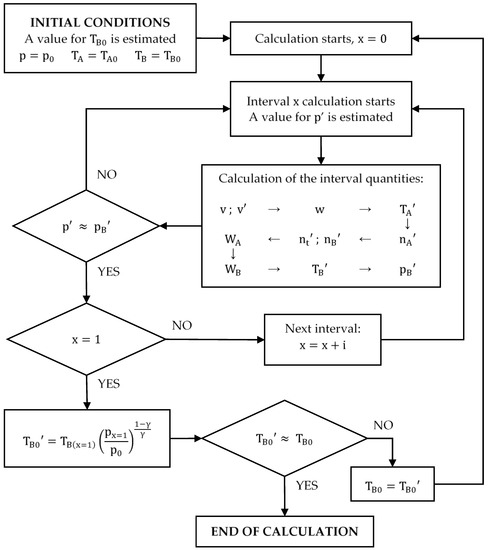
Figure 6.
Diagram of the calculation process of the compression cycle.
- The pressure depends on the work done from the beginning of the compression. Thus, the calculation must start at:The values of and are known and the value of is estimated. For the first iteration, . All of them allow values for and to be obtained:
- The compression process must be divided into small intervals (for example: ; ; ; etc.) so that it can be assumed that the quantities involved (, , and ) vary linearly within each of the intervals. This allows the calculation of the work done in each interval by applying the trapezoidal rule, considering only the pressure and the number of moles at the beginning and at the end of each of them.
- First, the pressure at the end of the interval must be estimated, always satisfying because the pressure increases continuously during compression.
- The work done is calculated with the trapezoidal rule using the estimated pressure value:where and take the following values:
- Since the compression in the cylinder is adiabatic, the value of can be calculated using the following equation:
- Then, , and can be calculated:
- The work done by the cylinder () can also be determined analytically. Since the number of moles of gas present in the cylinder decreases as compression progresses, the calculation considers the average between the moles present in the cylinder at the beginning and at the end of the interval. Therefore, the expression of is as follows:
- Then, the work done by the gases present in the combustion chamber () is:
- Once is known, the temperature can be calculated by applying the first law of thermodynamics:
- Finally, knowing , a value of the pressure in the combustion chamber () can be calculated.One of the conditions of the calculation is that the pressure must be the same in both chambers. If the estimated value for the pressure is correct, it will be true that . If it is not, the calculation must be repeated from point 3 with a different value of :
- If , must be increased.
- If , must be reduced.
As shown, the calculation of the final pressure of the considered interval is iterative. It is necessary to try several values of p’ until the correct one is found. An allowable error must be determined before an interval calculation can be considered complete. For example, the following criteria may be used:
Once the calculation of an interval is finished, the next one can be calculated. The initial conditions of the following interval are the final conditions calculated for the previous:
The calculation will continue until . The work done by the compression () will be the sum of the work done by the cylinder and the combustion chamber for all the intervals.
Finally, it must be remembered that the value of had been estimated at the beginning of the calculation. Once the compression calculation is finished, the cycle must be completely resolved, adiabatically expanding the gases contained in the combustion chamber in the volume of the cylinder, to obtain a value of closer to the true value.
If the value of obtained is very different from the value taken initially, the calculation must be repeated until the difference between the value of with which the calculation began and the value obtained at the end is less than the error that has been set as admissible. Figure 6 shows a diagram of the calculation process of the compression cycle.
This calculation was programmed in a Microsoft Excel workbook. Once , and are known, expansion stage work (), absorbed heat () and cycle efficiency () can be calculated as in the approximate method.
2.4. Approximate Method for Cycle Calculation
2.4.1. Fitted Equation for Compression Stage
Due to the complexity of calculating the compression stage of the cycle, it is advisable to find an equation that best approximates the pressure to volume relationship at that stage. Said equation must allow the cycle to be solved without the need to resort to computerized means. In addition, it is desirable that the equation allows the differential equation of work to be solved analytically to obtain the work done in the stage. Since the line drawn by the compression stage in Figure 7 is reminiscent of a hyperbola branch, it is proposed to fit an equation as follows:
in which , , and are coefficients that will adapt the equation to the different initial conditions: , , and . To obtain the dependence of the coefficients, it is necessary to analyze how their value varies when one of the initial conditions changes, maintaining the value of the others. Five different values were selected for each initial condition, which are considered to cover the practical application range of an engine.
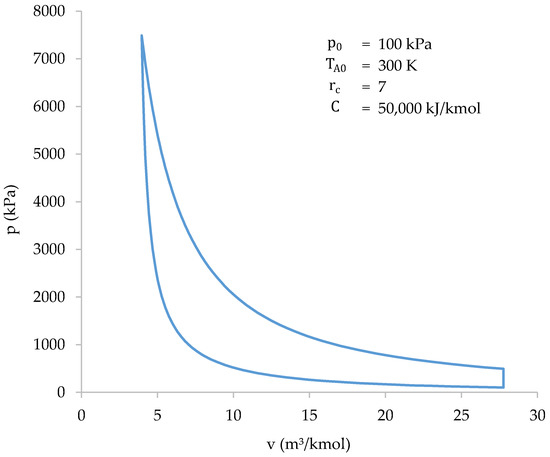
Figure 7.
Cycle solved with the iterative-numerical method.
The starting data will be obtained by solving the compression stage of the cycle, using the iterative-numerical method described above, for all combinations of initial conditions. Subsequently, an equation of the exposed form will be fitted to each combination. As a result, a value for , ., and can be set for the different combinations of initial conditions. The results of the calculations carried out are shown in Table 2.
Table 2.
Ideal values of , , and for each combination of initial conditions.
A power curve has been fitted to each coefficient (see Appendix A). The coefficients , , and are proposed to be related to the initial conditions as follows:
Finally, the constant of each coefficient has been adjusted, seeking to minimize the errors in the most important parameters of the cycle: , , and .
2.4.2. Cycle Resolution
The characteristic values of the cycle can be obtained from the approximate equation. The value of can be calculated from :
Afterwards, the values of the quantities at the end of the compression can be obtained:
Then, the value of the quantities at the end of the expansion are:
Finally, the values of and are:
2.4.3. Obtaining Work and Cycle Efficiency
The proposed approximate equation can be integrated to solve the differential equation of work:
Substituting:
Solving the equation:
As :
The specific work of the expansion can be obtained since it is an adiabatic expansion.
As :
For the calculation of the cycle efficiency, it can be considered that all the gases take part in the combustion, so . However, the error made in calculating the efficiency can be significantly reduced if the actual value of is calculated:
Therefore, the cycle efficiency is:
3. Results
3.1. Iterative-Numerical Method Results
The initial conditions shown in Table 3 were chosen to solve the thermodynamic cycle using the iterative-numerical method described in this work.
Table 3.
Cycle initial conditions.
To ensure the accuracy of the results, a total of 75 different values of were taken. The results are plotted in Figure 7. Table 4 shows a summary of the results.
Table 4.
Results obtained with the iterative-numerical method.
It should be noted that the intervals in the calculation are not regular. At the beginning of compression, the pressure increments per interval are very small, so the intervals taken for the calculation can be larger. From about , the pressure starts to grow much faster, so the intervals must be smaller. Moreover, the work done is also higher, and smaller intervals reduce integration errors.
3.2. Approximate Method Results
The approximate method gives best results when the coefficients , , and are defined as follows:
which are valid in the intervals shown in Table 5.
Table 5.
Intervals of initial conditions for which the approximate method gives accurate results.
Provided that the initial conditions are within the above intervals, the difference between the results of the approximate method and the iterative-numerical method described above is less than 12%. This error is considered assumable for calculation purposes, especially in solving exercises in the academic field. Obtaining the values of , , and for the initial conditions shown in Table 3, the approximate equation of compression stage results as follows:
Figure 8 shows the cycle resolved using both the iterative-numerical method and the approximate method.
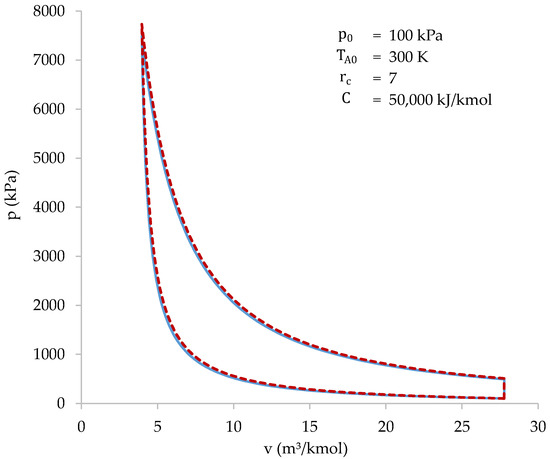
Figure 8.
Cycle solved with the iterative-numerical method (blue) and with the approximate method (dotted red).
As shown in Figure 8, the results of both methods are practically the same. The characteristic values of the cycle, obtained with both methods, are shown in Table 6.
Table 6.
Cycle characteristic values calculated using the iterative-numerical method and the approximate method.
The highest difference between the methods occurs when calculating the value of the initial volume (): 5.78%. Higher differences may appear when initial conditions are near the limits of the intervals shown in Table 5. In most cases, the highest differences appear at the initial volume, peak pressure or efficiency values. Despite the differences, the approximate method allows the cycle to be easily studied in a wide range of initial conditions. After that, more accurate results can be obtained using the iterative-numerical method.
3.3. Compression Stage Features
Figure 9 represents the values of and as a function of . Since combustion, and, therefore, heat absorption, is correlated with , Figure 9 shows combustion progress.
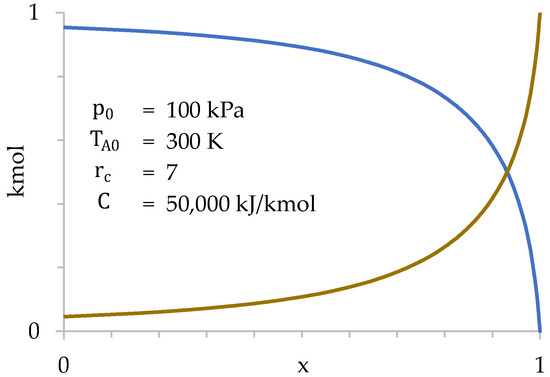
Figure 9.
Values of (blue) and (dark yellow) as a function of during compression stage.
Figure 9 shows how the transfer of gases from the cylinder to the combustion chamber is very slow at first, taking place especially at the end of compression. This occurs because the gases suffer a strong increase in temperature when passing through the grille, which increases their specific volume. This increase in volume tends to take them back to the cylinder, limiting the amount of gases that enter the combustion chamber. In other words, the cylinder gases are “reluctant” to enter the combustion chamber, so they do so basically at the end of compression when . Only 28% of the gases in the cylinder have been transferred when .
Furthermore, it is verified that the number of moles present in the combustion chamber at the beginning of compression is very small (4.6% of the total). Therefore, the influence of the initial value of in the calculation is also very small. Next, the values of , and are represented as a function of (Figure 10).
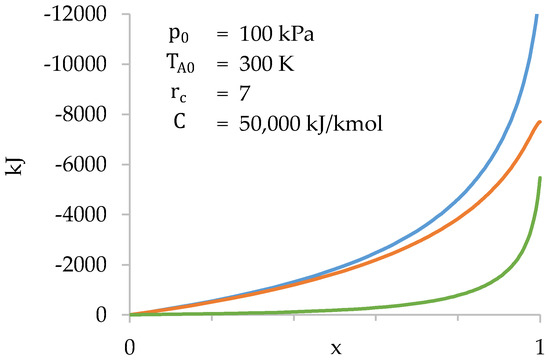
Figure 10.
Values of (blue), (orange) and (green) as a function of during compression stage.
Figure 10 shows that the gases present in the cylinder do most of the work. The work done in the combustion chamber is only significant towards the end of compression.
3.4. Comparison with the Otto Cycle
Comparison with the Otto cycle helps to highlight the differences in performance between a biomass-fueled engine and engines currently in service. Both cycles are represented in a p–v diagram below (Figure 11). Initial conditions are the same for both cycles.
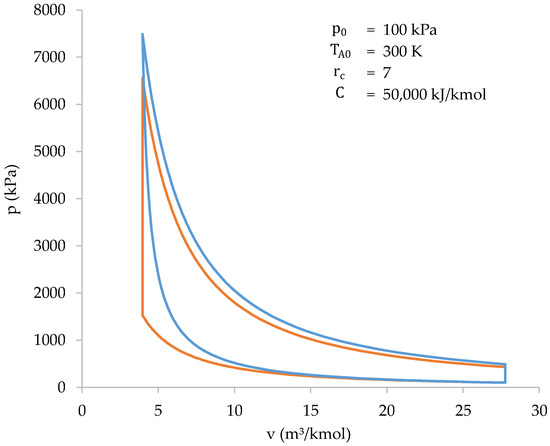
Figure 11.
Graphical comparison between the cycle of a biomass-fueled engine (blue) and the Otto cycle (orange).
Table 7.
Characteristic values of the cycles represented in Figure 11.
Thus, the information in Figure 11 and Table 7 shows how both cycles (biomass-fueled engine cycle and Otto cycle) are very similar to each other. However, there are some differences that should be highlighted:
- The compression work of a biomass-fueled engine cycle, in absolute value, is higher. This is because compression and heat absorption occur at the same time;
- The peak pressure and temperature of the biomass-fueled engine cycle are higher than those of the Otto cycle. This is because the higher compression work heats the gases more during compression. As a result, at the end of compression stage, the final temperature, and, therefore, the pressure, is higher;
- The heat absorbed during the biomass-fueled engine cycle is less than the heat absorbed during the Otto cycle. This is because only the gases present in the cylinder are involved in combustion. In the Otto cycle, all the gases take part in combustion, and, therefore, the heat absorbed is higher.
However, the most interesting result appears when plotting the efficiency of both cycles as a function of . Figure 12 shows that the efficiency of the biomass-fueled engine cycle is higher than that of the Otto cycle when is low. The higher compression work increases the combustion temperature and the Carnot factor. However, from a value of (in this case at 14.2), the efficiency of the cycle starts to decrease because the higher compression work is not balanced by the higher expansion work. In contrast, the efficiency of the Otto cycle increases steadily with . The value of that maximizes the cycle efficiency is not a fixed value. It depends on , and .
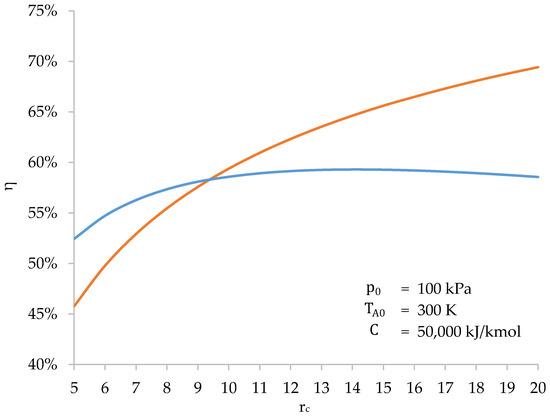
Figure 12.
Efficiency of the biomass-fueled engine cycle (blue) and the Otto cycle (orange) as a function of the compression ratio ().
Therefore, there is an upper limit to the cycle efficiency of a biomass-fueled engine. For engine design, this sets a practical limit for the compression ratio, beyond which there is no benefit.
3.5. Cycle Representation in a T–s Diagram
The representation of the cycle in a T–s diagram (Figure 13) has several peculiarities:
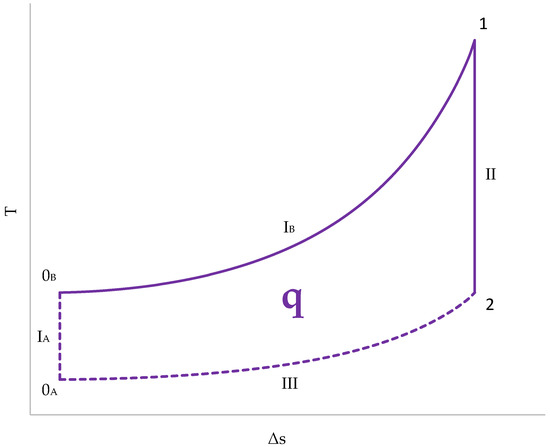
Figure 13.
Cycle representation in a T–s diagram.
- The initial temperature is different for the gases from the cylinder (0A) and for those from the combustion chamber (0B);
- The absorption of heat, and, therefore, the generation of entropy, occurs in the combustion chamber. Therefore, line IB represents the compression stage in the combustion chamber. The gases in the cylinder undergo adiabatic compression and remain vertical to 0A (IA);
- Expansion (II) is an adiabatic transformation for both chambers. Since there is no heat exchange, the entropy does not change;
- Heat release (III) takes place exclusively in the cylinder. The gases in the cylinder are swept out and replaced by fresh gases. The combustion chamber gases are not replenished and remain at a high temperature.
4. Conclusions
The development of biomass-fueled internal combustion engines can be a solution to reduce the use of and dependence on fossil fuels. This work studies the thermodynamic cycle of a biomass-fueled internal combustion engine. The cycle, which combines compression and heat absorption in a single stage, was solved using an iterative-numerical method. Then, in order to simplify the study of the cycle and obtain an equation to estimate the work, an approximate method was proposed. Both methods result in consistent and accurate results.
The p–v and T–s diagrams have been represented and compared with Otto cycle diagrams. The pressure and the final combustion temperature of the biomass-fueled internal combustion cycle are a bit higher than Otto’s. The most significate result is that, unlike the Otto cycle, the proposed thermodynamic cycle presents an optimum compression ratio value to obtain the highest efficiency. This fact will directly affect the design of future biomass-fueled engines. Their combustion chambers will be larger (to lower the compression ratio) compared to equivalent Otto or diesel engines, in order to achieve the maximum efficiency.
Author Contributions
Conceptualization, G.S. and D.B.; methodology, G.S.; software, G.S.; validation, G.S., D.B. and A.C.; formal analysis, D.B. and A.C.; investigation, G.S.; resources, G.S.; data curation, G.S.; writing—original draft preparation, G.S.; writing—review and editing, G.S. and D.B.; visualization, G.S.; supervision, D.B.; project administration, D.B. and A.C.; funding acquisition, G.S., D.B. and A.C. All authors have read and agreed to the published version of the manuscript.
Funding
This research received no external funding.
Data Availability Statement
The data that support the findings of this study are available on request from the corresponding author.
Conflicts of Interest
The authors declare no conflict of interest.
Abbreviations
| Exponent of adiabatic transformation | |
| Cycle efficiency | |
| Air/fuel ratio of a combustion | |
| Calorific value of fuel per kmol of air consumed | |
| Specific heat of an ideal diatomic gas at constant pressure | |
| Specific heat of an ideal diatomic gas at constant volume | |
| Constant | |
| Combustion chamber filling factor | |
| Coefficients of the approximate equation | |
| Number of moles present in the cylinder volume | |
| Number of moles present in the combustion chamber | |
| Number of moles transferred from the cylinder to the combustion chamber | |
| Pressure of the gases present in the chambers | |
| Pressure obtained in the combustion chamber in the calculation | |
| Heat | |
| Ideal gas constant | |
| Compression ratio | |
| Entropy | |
| Temperature of the gases present in the cylinder volume | |
| Temperature of the gases present in the combustion chamber | |
| Internal energy | |
| Volume | |
| Cylinder volume (variable volume chamber) | |
| Useful volume of the combustion chamber | |
| Volume of the combustion chamber | |
| Work | |
| Work done by the gases present in the volume of the cylinder | |
| Work done by the gases present in the combustion chamber | |
| Dimensionless variable indicating compression progression: 0 onset; 1 final. |
The numbers or letters in brackets, as well as the subscripts of the different magnitudes, refer to the state or transformation listed in the figures. The quantities or variables followed by a quotation mark (‘) indicate that they correspond to the end of the integration interval considered. Extensive quantities () are usually shown in uppercase. However, when referring to a kmol of gases, they are represented as lowercase ().
Appendix A
This appendix shows the relations of coefficients , , and (found in Equation (50)) with every single initial condition: , , and . Before proposing Equation (51) to fit the values of the coefficients, all relations were plotted in graphs and a function was fitted to each relation. A power function was the best option in almost all cases. Therefore, Equation (51) was developed.
The figures in graphs are not exactly the same as in Equations (71)–(74). The exact figures were obtained using the Excel Solver tool. The objective was to minimize the differences between both methods. Figure A1 shows the relations of . As shown, is linearly dependent on and fairly dependent on , and .

Figure A1.
Relations of with: (a) ; (b) ; (c) ; and (d) .
Figure A1.
Relations of with: (a) ; (b) ; (c) ; and (d) .

Figure A2 shows the relations of . As shown, is strongly dependent on , and , and slightly dependent on .

Figure A2.
Relations of with: (a) ; (b) ; (c) ; and (d) .
Figure A2.
Relations of with: (a) ; (b) ; (c) ; and (d) .

Figure A3 shows the relations of . As shown, is inversely dependent on and , fairly dependent on , and slightly dependent on .

Figure A3.
Relations of with: (a) ; (b) ; (c) ; and (d) .
Figure A3.
Relations of with: (a) ; (b) ; (c) ; and (d) .

Figure A4 shows the relations of . As shown, is almost independent of and slightly dependent on , and .

Figure A4.
Relations of with: (a) ; (b) ; (c) ; and (d) .
Figure A4.
Relations of with: (a) ; (b) ; (c) ; and (d) .

References
- Masson-Delmotte, V.; Zhai, P.; Pörtner, H.O.; Roberts, D.; Skea, J.; Shukla, P.R.; Pirani, A.; Moufouma-Okia, W.; Péan, C.; Pidcock, R.; et al. Global Warming of 1.5 °C. IPCC 2019, 1, 175. [Google Scholar]
- Chowdhury, A.; Corendea, C. Russia-Ukraine war could derail a renewable energy future. Hindustan Times 2022, 1, 3. [Google Scholar]
- Jaffe, A.M.; Medlock, K.B., III; Soligo, R. The status of world oil reserves: Conventional and unconventional resources in the future supply mix. James A Bak. III Inst. Public Policy Rice Univ. 2011, 1, 40. [Google Scholar]
- Stančin, H.; Mikulčić, H.; Wang, X.; Duić, N. A review on alternative fuels in future energy system. Renew. Sustain. Energy Rev. 2020, 128, 109927. [Google Scholar] [CrossRef]
- Zhang, R.; Fujimori, S. The role of transport electrification in global climate change mitigation scenarios. Environ. Res. Lett. 2020, 15, 034019. [Google Scholar] [CrossRef]
- De Borbón, J.C. Real Decreto 61/2006, de 31 de enero. BOE 2006, 12. [Google Scholar]
- Pimentel, D. Ethanol fuels: Energy balance, economics, and environmental impacts are negative. Nat. Resour. Res. 2003, 12, 127–134. [Google Scholar] [CrossRef]
- Kumari, D.; Singh, R. Pretreatment of lignocellulosic wastes for biofuel production: A critical review. Renew. Sustain. Energy Rev. 2018, 90, 877–891. [Google Scholar] [CrossRef]
- Gupta, A.; Verma, J.P. Sustainable bio-ethanol production from agro-residues: A review. Renew. Sustain. Energy Rev. 2015, 41, 550–567. [Google Scholar] [CrossRef]
- Brethauer, S.; Wyman, C.E. Review: Continuous hydrolysis and fermentation for cellulosic ethanol production. Bioresour. Technol. 2010, 101, 4862–4874. [Google Scholar] [CrossRef]
- Sala-Lizarraga, J.M.; López-González, L.M. Plantas de Valorización Energética de la Biomasa; Editorial Ochoa: Logroño, Spain, 2002; p. 311. ISBN 84-7359-545-91. [Google Scholar]
- Bacenetti, J.; Negri, M.; Fiala, M.; González-García, S. Anaerobic digestion of different feedstocks: Impact on energetic and environmental balances of biogas process. Sci. Total Environ. 2013, 463, 541–551. [Google Scholar] [CrossRef] [PubMed]
- Sawatdeenarunat, C.; Surendra, K.C.; Takara, D.; Oechsner, H.; Khanal, S.K. Anaerobic digestion of lignocellulosic biomass: Challenges and opportunities. Bioresour. Technol. 2015, 178, 178–186. [Google Scholar] [CrossRef] [PubMed]
- Pohl, M.; Heeg, K.; Mumme, J. Anaerobic digestion of wheat straw–Performance of continuous solid-state digestion. Bioresour. Technol. 2013, 146, 408–415. [Google Scholar] [CrossRef] [PubMed]
- Ahring, B.K.; Angelidaki, I.; de Macario, C.C.; Gavala, H.N.; Hofman-Bang, J.; Elfering, S.O.; Raskin, L.; Stams, A.J.; Westermann, P.; Zheng, D. Biomethanation I; Springer: Berlin, Germany, 2003; p. 231. [Google Scholar]
- Fore, S.R.; Porter, P.; Lazarus, W. Net energy balance of small-scale on-farm biodiesel production from canola and soybean. Biomass Bioenergy 2011, 35, 2234–2244. [Google Scholar] [CrossRef]
- Kallivroussis, L.; Natsis, A.; Papadakis, G. RD—Rural Development: The Energy Balance of Sunflower Production for Biodiesel in Greece. Biosyst. Eng. 2002, 81, 347–354. [Google Scholar] [CrossRef]
- Smith, E.G.; Janzen, H.H.; Newlands, N.K. Energy balances of biodiesel production from soybean and canola in Canada. Can. J. Plant Sci. 2007, 87, 793–801. [Google Scholar] [CrossRef]
- CORES. Informe Estadístico Anual 2019. CORES 2019, 1. [Google Scholar]
- Martinez Thomas, L. Producción de Combustibles de Emergencia a Partir de Biomasa; ESPOL: Madrid, Spain, 2015; p. 342. [Google Scholar]
- Chiaramonti, D.; Bonini, M.; Fratini, E.; Tondi, G.; Gartner, K.; Bridgwater, A.V.; Grimm, H.P.; Soldaini, I.; Webster, A.; Baglioni, P. Development of emulsions from biomass pyrolysis liquid and diesel and their use in engines—Part 2: Tests in diesel engines. Biomass Bioenergy 2003, 25, 101–111. [Google Scholar] [CrossRef]
- Arias-Paz, M. Manual de Automóviles; Cie Inversiones Editoriales Dossat: Madrid, Spain, 2004; p. 1199. [Google Scholar]
- Sazali, N. Emerging technologies by hydrogen: A review. Int. J. Hydrog. Energy 2020, 45, 18753–18771. [Google Scholar] [CrossRef]
- Martins, J.; Brito, F.P. Alternative fuels for internal combustion engines. Energies 2020, 13, 4086. [Google Scholar] [CrossRef]
- Bae, C.; Kim, J. Alternative fuels for internal combustion engines. Proc. Combust. Inst. 2017, 36, 3389–3413. [Google Scholar] [CrossRef]
- Moradi, R.; Groth, K.M. Hydrogen storage and delivery: Review of the state of the art technologies and risk and reliability analysis. Int. J. Hydrog. Energy 2019, 44, 12254–12269. [Google Scholar] [CrossRef]
- Rivard, E.; Trudeau, M.; Zaghib, K. Hydrogen Storage for Mobility: A Review. Materials 2019, 1, 22. [Google Scholar] [CrossRef] [PubMed]
- Praxair. Compressed hydrogen safety data sheet. Available online: https://www.praxair.co.in/gases/buy-compressed-hydrogen-gas-or-liquid-hydrogen (accessed on 10 November 2022).
- González, M.S.; Rojas-Hernández, I. hydrogen embrittlement of metals and alloys in combustion engines. Tecnol. En Marcha 2018, 31, 3–13. [Google Scholar]
- Wen, J.; Zhao, D.; Zhang, C. An overview of electricity powered vehicles: Lithium-ion battery energy storage density and energy conversion efficiency. Renew. Energy 2020, 162, 1629–1648. [Google Scholar] [CrossRef]
- Sarkar, T.; Bhattacharjee, A.; Mukhopadhyay, K.; Bhattacharya, K.D.; Saha, H. Energy non-availability in distribution grids with heavy penetration of solar power: Assessment and mitigation through solar smoother. Energies 2018, 11, 709. [Google Scholar] [CrossRef]
- Farmann, A.; Waag, W.; Marongiu, A.; Sauer, D.U. Critical review of on-board capacity estimation techniques for lithium-ion batteries in electric and hybrid electric vehicles. J. Power Sources 2015, 281, 114–130. [Google Scholar] [CrossRef]
- Cabrera, M.; Vera, A.; Cornejo, J.M.; Ordás, I.; Tolosana, E.; Ambrosio, Y.; Martínez, I.; Vignote, S.; Hotait, N.; Lafarga, A.; et al. Evaluación del Potencial de Energía de la Biomasa; Estudio técnico PER 2011–2020; IDAE: Madrid, Spain, 2011; p. 196.
- IDAE. Poderes caloríficos inferiores de las principales fuentes energéticas. Available online: https://view.officeapps.live.com/op/view.aspx?src=https%3A%2F%2Fwww.idae.es%2Fsites%2Fdefault%2Ffiles%2Festudios_informes_y_estadisticas%2Fpoderes-calorificos-inferiores_pci_v_1-00_2020.xlsx&wdOrigin=BROWSELINK (accessed on 10 November 2022).
- Ortega, M.A.C.; Alpírez, G.M.; González, C.G.; Sánchez, A.P.; Pelayo, L.J.P. Emisiones de las quemas de residuos agrícolas en el Valle de Mexicali, 1987–2010. SIIR 2011, 1, 5. [Google Scholar]
- Camia, A.; Robert, N.; Jonsson, K.; Pilli, R.; Garcia, C.S.; Lopez, L.R.; Van, D.; Ronzon, T.; Gurria, A.P.; M’Barek, R. Biomass production, supply, uses and flows in the European Union: First results from an integrated assessment. JRC Publ. Repos. 2018, 1, 47–67. [Google Scholar]
- 400.000 Viviendas Usan en España Calderas y Estufas de Biomasa; EUROPA PRESS Castilla y León; Europapress: London, UK, 2021.
- Clugniac, J.C. Gasógenos para Automotores; Aristides Quillet S.A.: Buenos Aires, Argentina, 1944; p. 270. [Google Scholar]
- Schnürle, A. Verbrennungskraftmaschine. U.S. Patent DE000000398997A.
- Firey, J.C. Char and oil burning engine. U.S. Patent 4,412,511, 1 November 1983. [Google Scholar]
- Firey, J.C. Untimed refuel, and ash removal for char burning engines. U.S. Patent 4,653,436, 31 March 1987. [Google Scholar]
- Piriou, B.; Vaitilingom, G.; Veyssière, B.; Cuq, B.; Rouau, X. Potential direct use of solid biomass in internal combustion engines. Prog. Energy Combust. Sci. 2013, 39, 169–188. [Google Scholar] [CrossRef]
- Fritts, D.K. Particulate deflagration combustion engine. U.S. Patent 7,784,435, 31 August 2010. [Google Scholar]
- Klöpperpieper, R. Von Glühkopf-, Halbdiesel- und Volldieselmotoren. Landwirtsch. Wochenbl. 2006, 31, 28–29. [Google Scholar]


Disclaimer/Publisher’s Note: The statements, opinions and data contained in all publications are solely those of the individual author(s) and contributor(s) and not of MDPI and/or the editor(s). MDPI and/or the editor(s) disclaim responsibility for any injury to people or property resulting from any ideas, methods, instructions or products referred to in the content. |
© 2023 by the authors. Licensee MDPI, Basel, Switzerland. This article is an open access article distributed under the terms and conditions of the Creative Commons Attribution (CC BY) license (https://creativecommons.org/licenses/by/4.0/).