Abstract
This publication discusses the experiments and findings of project ROCCS (Establishing a Research Observatory to Unlock European Coal Seams for Carbon Dioxide Storage), which aimed to investigate the potential for carbon dioxide storage in coal seams. The project involved large-scale ex situ laboratory tests, where CO2 was injected into an experimental coal seam using a high-pressure reactor at the Central Mining Institute in Poland. The reactor simulated underground conditions, and the experimental coal seam measured 3.05 m in length with a cross-section of 0.4 × 0.4 m. Parameters such as gas flow, temperatures, and pressures were monitored during the experiments. In the study conducted, the sorption capacity of coal from the Polish mine “Piast-Ziemowit” for CO2, at a sorption pressure of 30 bar, was determined to be 4.8% by weight relative to the raw coal mass. The data collected from these ex situ tests can support the design of a potential commercial-scale CO2 storage installation.
1. Introduction
CO2 is considered one of the main causes of the occurrence of global climate change [1]. Adverse environmental changes such as rising sea levels, melting glaciers droughts, and hurricanes can be observed in many parts of the world [2]. Over the past few decades, an increase in the amount of carbon dioxide in the air has contributed to rising global temperatures [3]. Many countries are leaning into the problem of global warming and trying to find ways to slow down the process [4,5]. CO2 is emitted mainly from the combustion of fossil fuels, both in large combustion units, such as those used to generate electricity, and in smaller, distributed sources, such as car engines and furnaces used in residential and commercial buildings.
To improve the climate situation, it is necessary to reduce the amount of CO2 in the atmosphere [6,7]. It is possible to reduce levels. However, this involves changing energy technologies, which is an expensive undertaking.
One way to solve the problem of excess CO2 is to collect and locate it in geological structures. In the study [8], the possibilities of placing CO2 in oil or gas deposits and saline aquifers were shown. The high potential for CO2 storage in coal seams is also known—coal’s inherent adsorption properties, derived from its porous structure and abundant micropores, enable it to effectively bind and store various gases on its internal surfaces [9,10,11]. Carbon Dioxide-Enhanced Coal Bed Methane (CO2-ECBM) is a technology where CO2 is injected into coal seams to displace and enhance the production of methane while simultaneously storing the CO2 underground. The process leverages coal’s higher affinity for CO2 over methane, facilitating both methane recovery and carbon sequestration [12,13,14,15]. In their study, a team led by Zheng showed a designed large-scale device to simulate CO2-ECBM technology. The results of the study were that dynamic injection of CO2 into the reservoir results in more efficient CH4 recovery and CO2 sequestration [16,17]. Similar studies were conducted by the Bai team [18]. The research was aimed at learning the relationship between CO2 injection and CH4 desorption. It was observed that, in the process of CH4 displacement by CO2, the temperature of the coal seam increases. In the study conducted by Wang [4], investigations on changes in the coal structure during CO2 injection tests were conducted. The effect of CO2 intrusion on the properties of coal as a result of changes in molecular structure and CO2 capture mechanisms was also investigated.
Another attempt to explain the complex CO2 sorption process was made by Harinandan Kumar [19]. His study attempted to investigate the sorption capacity of Indian coals. The result was the development of a sorption isotherm. The study showed that sorption capacity increased with increasing pressure, but decreased at higher temperatures.
In the study [20], the impact of underground CO2 storage on a coal deposit was investigated using computer simulations. The research focused on hydro–mechanical interactions concerning Polish coals located in the Upper Silesian Energy Region. Computer simulations showed that, under certain conditions, the CO2 injection process is safe and has no negative environmental effects. However, when the CO2 injection pressure exceeded 1.5 times the hydrostatic pressure, environmental hazards such as fault reactivation could emerge. The consequence of this phenomenon could lead to damage to surface infrastructure.
In the paper [21], it was found that, in the case of attempts to store CO2 in a coal bed, the problem of coal swelling arises. This is an unfavorable phenomenon that leads to the formation of a zone of high CO2 concentration near the injection well.
In the project with the acronym CO2RINA (CO2 Storage Risk Integrated Analysis), risks associated with the storage of CO2 in underground coal deposits were analyzed. With this approach, it is possible to study in more detail the complex processes occurring in deposits when storing CO2. More information on this subject can be found in reference [22].
The ROCCS project builds upon prior research, including the RECOPOL project conducted by the Central Mining Institute and funded by the European Commission [23,24]. The experiment, which lasted several months, involved the injection of 760 tons of CO2 into a coal seam using a vertical injection well. The main objective of the research was to determine whether the injected CO2 was adsorbed onto the coal or remained as a free gas. The results presented indicate that CO2 was adsorbed onto the coal—however, it was found that the required CO2 injection pressures were higher than anticipated, with CO2 injection only possible through cycles of pressure build-up and fall-off. The permeability of the coal seam reduced with time due to CO2 sorption-induced coal swelling, and it was only possible to maintain continuous injection after hydraulic fracturing was completed. ROCCS acts on the recommendation of RECOPOL that “other well completions, such as horizontal or ‘fishbone’ drilling, need to be researched to assess their impact on injectivity and productivity”.
Several projects have highlighted a significant theoretical potential of CO2 storage and usage for coal bed methane (CBM) recovery [25,26]. They have also indicated that this potential is constrained by the fact that European coal seams are significantly less permeable than those in the USA, where the largest field trials have taken place. Combined with permeability losses due to CO2 sorption-induced coal swelling, a principal concern is therefore the need to over-pressurize coal seams to sustain injection, leading to concerns over caprock integrity and leakage. ROCCS acts on these constraints by determining the potential of horizontal injection wells to deliver sustained injection rates, circumventing the need for significant over-pressurization.
The reliability of experimental assessment and practical application scenarios of in situ experiments to assess the adsorption capacity of coal depends on various factors such as the quality of the data, the accuracy of the measurements, and the validity of the assumptions made during the experiments. The results of these experiments can be used to estimate the amount of carbon dioxide that can be stored in coal seams, but they are subject to uncertainty and variability. Some studies have shown that the adsorption capacity of coal can vary depending on factors such as temperature, pressure, and coal type [27,28]. Other studies have suggested that the adsorption capacity of coal can be affected by factors such as SO2 and pH concentration [29]. Overall, while in situ experiments can provide valuable information about the adsorption capacity of coal, they should be interpreted with caution and used in conjunction with other methods to estimate carbon storage potential.
To complement the in situ experiment, which exhibited the aforementioned limitations, a controlled laboratory test was conducted. The high-pressure laboratory installation enabled the simulation of CO2 injection in underground conditions at the surface (ex situ) into an experimental coal seam. This setup aimed to determine the coal’s sorption capacity and observe the dynamics of CO2 migration. The large coal blocks were placed inside the insulated reactor, preventing gas losses outside the experimental zone. The size of the experimental coal seam, combined with the reactor’s capability to operate at a high pressure of 30 bar, allowed for the simulation of coal–gas interactions. A longitudinal sorption channel was cut in the lower part of the prepared coal seam to emulate the design of a horizontal injection well. Inlet and outlet gas flow, temperatures, and pressures were also monitored as crucial operational parameters.
The results of the ex situ CO2 injection test, combined with other laboratory investigations and numerical modeling, offer valuable insights. Together with in situ tests, they can guide the design of a commercial-scale installation. This installation could potentially be located within one of the Polish mines for large-scale CO2 storage purposes.
2. Materials and Methods
2.1. Coal Properties and Sample Preparation
The material used for sorption testing was hard coal from the “Piast-Ziemowit” mine. The results of proximate and ultimate analyses for the coal sample under study are presented in Table 1. All analyses were carried out by the Department of Solid Fuels Quality Assessment of the Central Mining Institute (PN-EN ISO/IEC 17025:2018-2 accreditation certificate [30]) in Katowice. The hard coal used is characterized by a moderate moisture and ash content, approximately 8.50% and 7.56%, respectively, (as received).

Table 1.
Proximate and ultimate characteristics of “Piast-Ziemowit” coal (unit is % by weight if not printed otherwise).
Before the coal was used as a sorbent in a pressurized vessel (a reactor), the acquired coal blocks had to be properly cut. Longitudinal sorption channels were cut in the lower part of the prepared coal blocks to allow the gas to be sorbed to penetrate. The cross-section of the cut coal blocks was 0.4 × 0.4 m, and the sorption channel was approximately 0.15 × 0.15 m. Five blocks of coal were cut to lengths of 0.31, 0.74, 0.70, 0.60, and 0.70 m, respectively, based on the initial size and shape of the acquired coal samples. These blocks were combined to form an artificial coal seam with a total length of 3.05 m. The weight of all the blocks was 631 kg.
The procedure of cutting coal blocks is presented in Figure 1, while the arrangement and shapes of the used coal blocks are shown in Figure 2 (the proportions of sides were maintained).
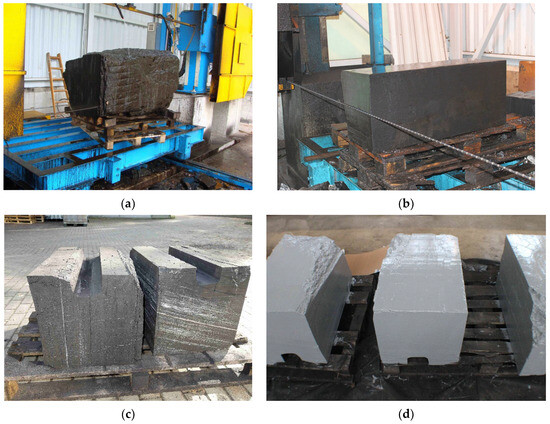
Figure 1.
Preparation of artificial coal seam for sorption tests: (a,b) sample cutting, (c) cut blocks of coal with a sorption channel, (d) fully painted blocks of coal prepared for sorption testing.

Figure 2.
Characteristics of an artificial coal seam for sorption testing. The lengths of coal blocks 1 to 5 are 0.31 m, 0.74 m, 0.70 m, 0.60 m, and 0.70 m, respectively.
The dimensions, weights of the coal blocks, and their volume are given in Table 2. The volumes of coal blocks were calculated after subtracting the volume of the excised sorption channel. The total volume of the coal blocks inserted into the reactor was 458 dm3.
Table 2.
Dimensions and weights of coal blocks used.
Following this, with the exception of the sorption channels, all surfaces of each coal block were painted several times (Figure 1d) with a gas- and moisture-impermeable varnish. The objective was to ensure that the sorption process occurred exclusively through the sorption channel. The type of coating used was selected based on preliminary studies. For each test, small blocks of coal were painted with different types of lacquer. After drying, their permeability was assessed by immersing the painted blocks in water for 24 h. The best isolation was achieved using a chloride–rubber varnish produced by a Polish company. This varnish is commonly used to protect car chassis from corrosion.
2.2. Experimental Setup
A scheme of the installation used for sorption testing is shown in Figure 3, while cross-sections and a view of the reactor are shown in Figure 4.
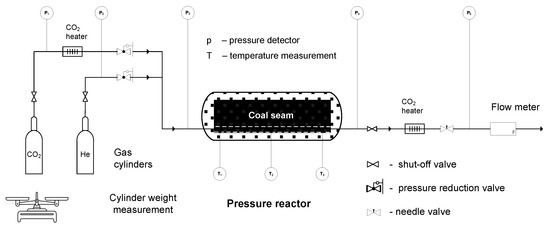
Figure 3.
Scheme of the ex situ pressure sorption installation.
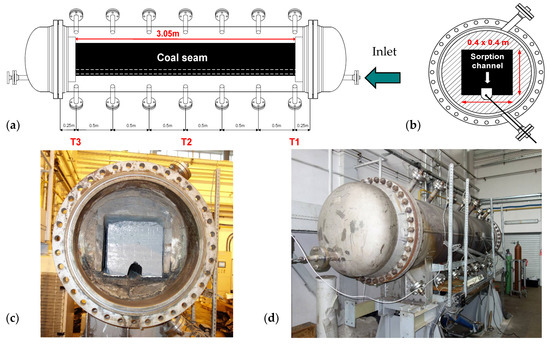
Figure 4.
Pressure reactor for sorption testing: (a) side cross-section, (b) vertical cross-section, (c) reactor with coal seam inside, (d) reactor ready for the CO2 sorption test.
The measuring elements of the thermocouples were placed so that they measured temperatures in the center of the sorption channel. The measurement accuracy of analog pressure sensors P1–P3 was ±1 bar, while that of sensor P5 was ±0.1 bar. The measurement accuracy of digital pressure sensor P4 was 0.01 bar, while that of digital temperature sensors T1–T3 was 0.01 °C, respectively. Digital data values were recorded automatically every 20 s. A bellows gas meter from ELSTER, type BK-G10M, was used to measure the amount of gas flowing out of the reactor. The P5 pressure sensor was used to control the expansion pressure released from the helium or carbon dioxide reactor. The scale seen in Figure 3 was used to control the weight of the gas cylinders before and after sorption. The difference in the weight of the cylinders gave information about the amount of gas released from the cylinder. The accuracy of the cylinder weight measurement was 0.1 kg. The expansion of the compressed CO2 causes a temperature drop—as a result, valves placed in the path of the gaseous CO2 might have frozen. The use of dedicated heaters prevented this adverse effect.
2.3. Experimental Procedure
The experimental procedure consisted of two stages. Stage I involved determining the free volume in the reactor using helium introduced into the reactor at selected pressures of 3 and 6 bar. In Stage II, the sorption capacity of raw coal for absorbing carbon dioxide was measured under a pressure of 30 bar.
The following activities and measurements were required for Stage I and II:
Stage I—helium tests:
- Installation of the measurement system and helium filling system (from gas cylinder) to the reactor,
- Measurement of the temperature and pressure prevailing in the gas cylinder before filling the reactor with helium,
- Filling the reactor with helium to a pressure of 3 bar and waiting until the gas pressure in the reactor is established,
- Depressurization of the reactor to atmospheric by opening the outlet and needle valves and releasing helium into the atmosphere,
- Measuring the volume of helium released from the reactor with a flow meter,
- Re-measuring the temperature and pressure of the remaining helium in the gas cylinder,
- Repeating the procedure for a higher pressure of 6 bar.
Stage II—carbon dioxide test:
- Connection of the measurement system and CO2 filling system (gas cylinder) to the reactor,
- Measuring the mass of a liquid CO2 cylinder before filling the reactor with carbon dioxide,
- Filling the reactor with CO2 to a starting pressure of 30 bar. Close the gas cylinder valve and wait until the gas pressure in the pressurized reactor is established,
- Calculating, from the difference in the weight of the cylinder, the volume of CO2 let into the reactor at 30 bar. Reducing the pressure in the reactor to atmospheric by opening the outlet needle valve and releasing the CO2 into the atmosphere,
- Measuring the volume of CO2 released into the atmosphere with a flow meter,
- Calculating the difference in the mass of CO2 contained in a full and used gas cylinder and converting the mass to gas volume. The difference in CO2 volume calculated in is the amount of CO2 adsorbed.
3. Results
3.1. Helium Tests
3.1.1. Measurement of the Free Volume of the Reactor without the Coal Block Located Inside
The equation of state of a perfect gas (1) and Clapeyron’s Equation (2) were used to determine the free volume in the reactor:
where: p—pressure, V—volume, T—temperature, R—universal gas constant, n—number of moles.
First, the volume of helium taken from the gas cylinders during the filling of the pressurized reactor was calculated. Two measurement tests were performed at 3 and 5 bar. Each test was performed using a separate helium gas cylinder. Due to insufficient gas contained in the helium cylinder during the second test, the planned reactor pressure of 6 bar needed to be lowered to 5 bar. The results of the measurements and calculations converted to standard conditions (T = 273.15 K, p = 1013 hPa) are shown in Table 3.
Table 3.
Calculation of helium volume taken from gas cylinders.
From the data presented in Table 3, the helium volume taken for the test at pressures of 3 and 5 bar was 5269 Ndm3 and 8560 Ndm3, respectively (under standard conditions). The gas taken from the helium cylinder was introduced into a pressure reactor of unknown free volume. This volume was calculated using data on the amount of helium introduced, the pressure, and the temperature prevailing in the reactor. The results of the measurements and calculations are shown in Table 4. The temperature and pressure values recorded in the pressure reactor, immediately after the introduction of helium, were used for the calculations.
Table 4.
Measurement of the free volume of the reactor based on the amount of helium taken from the gas cylinder and introduced into the reactor without coal.
The difference in the resulting free volume of 54.4 dm3 is relatively small and is probably due to measurement errors in pressure and temperature. The volume of free space inside the reactor can also be calculated by measuring the amount of helium released from the reactor to the outside. These volumes were measured with a gas meter, and, under the measured conditions, they were 5807 dm3 and 9342 dm3 for the No. 1 and No. 2 tests, respectively. The results, converted to standard conditions, are shown in Table 5.
Table 5.
Measurement of the free volume of the reactor based on the amount of helium released into the atmosphere from the reactor without coal.
The obtained results of the free volume calculated by this method are 1724 Ndm3 and 1690 Ndm3. They are slightly lower than the values calculated by the previous method. In order to obtain the value closest to the real value, the average value of all these four measurements was calculated. The averaged value of the free volume of the reactor without the inserted coal blocks was 1768.3 Ndm3.
To calculate the free volume inside the reactor after inserting the coal blocks, the coal blocks’ volume of 458 dm3 was subtracted from the reactor’s total volume of 1768.3 Ndm3. The value sought was therefore ~1319 dm3.
3.1.2. Measurement of the Free Volume of the Reactor with the Coal Block Located Inside
Measurements of the free volume in the reactor were also carried out after the coal blocks were placed in the reactor. The measurement procedure was the same as for the empty reactor. The results of the tests are shown in Table 6, Table 7 and Table 8.
Table 6.
Calculation of helium taken from gas cylinders.
Table 7.
Measurement of the free volume of the reactor based on the amount of helium taken from the gas cylinder and introduced into the reactor with coal.
Table 8.
Measurement of the free volume of the reactor based on the amount of helium released into the atmosphere from the reactor with coal.
From the data shown in Table 6, the volume of helium taken for testing at 3 and 6 bar is 3836 Ndm3 and 7514 Ndm3, respectively, under standard conditions. The gas taken from the helium cylinder was introduced into a pressure reactor with coal blocks inserted. The free volume in the pressure reactor was calculated analogously to the measurements without the inserted coal blocks. The results obtained are shown in Table 7.
The difference in the resulting free volumes of 27 dm3 is relatively low and is probably due to measurement errors in pressure and temperature measurements. As before, the volume of free space inside the reactor was calculated by the second method by measuring the amount of helium released from the reactor. These volumes under measured conditions were 3861 dm3 and 7442 dm3 for test No. 3 and test No. 4, respectively. The obtained results converted to standard conditions are shown in Table 8.
The obtained free volume results are close to each other, with a difference of 39 Ndm3. It should be noted that there are slight differences between the data shown in Table 7 and Table 8. The average value of the free volume of the reactor, calculated based on four measurements with coal blocks located inside, is 1314 dm3.
3.1.3. Summary of Reactor Free-Volume Measurement Results
Measurements of the reactor’s free volume based on tests with an empty reactor and a reactor filled with coal show minimal differences. The empty reactor had a free volume of 1319 dm3, while after inserting the coal, the volume decreased to 1314 dm3. For further calculations, it was assumed that the free volume of the reactor is 1319 dm3.
Based on this, it is possible to estimate the maximum measurement error. From the calculations conducted, the maximum volume deviation is determined is 34 dm3 (Table 8). In percentage terms, the measurement error is not significant and is approximately 2.6%.
3.2. CO2 Sorption Test
In the next stage of the work, the pressurized reactor with coal placed inside was filled with carbon dioxide to the final pressure of 30.00 bar. The filling time was 7 h and 50 min. Three cylinders of liquid CO2 were used for this purpose. Two days were allowed to pass while a gradual drop in CO2 gas pressure was observed, indicating CO2 sorption by the coal. When the carbon dioxide level decreased, it was recharged to a pressure of 30 bar, and the system was left until the pressure dropped again. The carbon dioxide replenishment process was repeated a total of three times. Then, after a sorption test lasting total 240 h, CO2 was slowly released from the reactor into the atmosphere. During the test, graphs of pressure and temperature changes were plotted. The relations obtained are presented in Figure 5 and Figure 6.
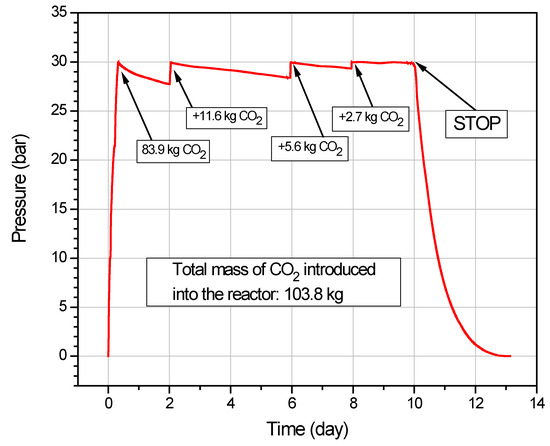
Figure 5.
Pressure changes inside the reactor as a function of time during CO2 sorption and desorption.
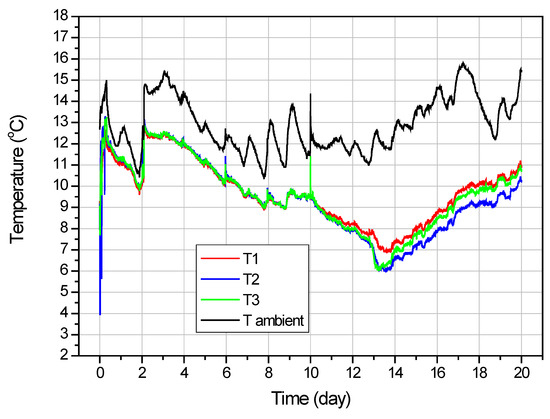
Figure 6.
Temperature variation inside the reactor as a function of time.
It can be seen from Figure 5 that, with each successive addition of CO2 gas, there was a decreasing trend in the reactor’s pressure drop, and the volume of CO2 introduced during each cycle also reduced. The total amount of CO2 introduced into the reactor was 103.8 kg. The total sorption time was 10 days. After the outlet valves were opened, the time for the pressure in the reactor to drop to atmospheric was 3 days. The amount of CO2 released from the reactor was measured with a gas meter at all times. Despite the fact that the pressure in the reactor equalized to atmospheric levels, carbon dioxide continued to escape from the reactor, as indicated by increasing values on the gas meter. It was determined that desorption would end if three consecutive CO2 volume measurements, taken approximately every 8 h at the exit from the reactor, showed no increase in the amount of desorbed gas. This time was 7 days. The total time for carbon dioxide to be released from the reactor was therefore 3 + 7 = 10 days.
From the graph in Figure 6, it can be seen that the temperatures T1–T3 for the duration of the test are very close to each other and their changes are proportional to changes in ambient temperature. It can be seen that the temperature in the reactor increased with each cycle of carbon dioxide introduction. This occurred because the ambient temperature and the temperature of the introduced CO2 were higher than the temperature inside the pressurized reactor. The apparent fluctuation in ambient temperature is due to the 24-hour cycle of heating up the air during the day and cooling down at night. The average temperature inside the reactor during CO2 sorption test was 11.6 °C.
Calculations of the Sorption Capacity of Coal in Relation to the Sorption of Gaseous CO2
Based on knowledge of the total volume of CO2 introduced into the reactor and the free volume of the reactor (which should be subtracted), the amount of carbon dioxide adsorbed by the coal seam was calculated. The relevant calculations are shown below.
The total amount of carbon dioxide introduced into the reactor, as measured by the mass change of three cylinders of this gas, was 103.8 kg of CO2. The amount of carbon dioxide (in moles) that filled the free volume of 1319 Ndm3 at a pressure of 30.00 bar was calculated from the transformed Equation (2). After substituting the measured data into Equation (2), the amount of CO2 filling the free volume was 1671.36 moles. Upon converting 1671.36 moles to the mass of CO2, a value of 73.54 kg is obtained. By subtracting the 73.54 kg of CO2 that occupies the free volume in the reactor from the 103.8 kg of CO2 introduced, the amount of CO2 adsorbed by the coal can be determined. This value is 30.26 kg. In percentage terms, relative to 631 kg of raw coal, the amount of CO2 adsorbed was 4.8 wt%.
Figure 7 shows the relationship between time and the volume of pressurized carbon dioxide released from the reactor into the atmosphere. The measurements continued from the opening of the reactor outlet valves until the gas meter stopped indicating a volume increase. This time lasted 10 days.
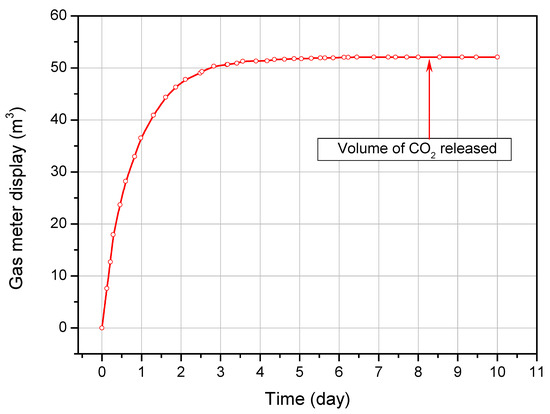
Figure 7.
The volume of CO2 released from the reactor as a function of time.
The average ambient air temperature at the time calculated from the data in Figure 6 was 13.1 °C, while the average ambient pressure was 954 hPa (0.942 bar). The total amount of CO2 discharged from the reactor under the measured conditions was 52.094 dm3, which—converted to standard conditions—gives a value of 46.186 Ndm3. Since 52.844 Ndm3 of CO2 (103.8 kg) was introduced into the reactor, this means that 6.658 Nm3 of CO2 (13.1 kg) remained adsorbed in the coal blocks. In relation to the total amount of adsorbed CO2 (30.26 kg), this value represents 43.3% of its mass.
4. Discussion and Conclusions
- Ex situ experiments allow us to assess the sorption capacity of coal. Such information allows us to quantify CO2 storage capacity when designing commercial-scale installations. For coal from the Polish coal mine “Piast-Ziemowit”, the sorption capacity measured at a pressure of 30 bar was 4.8% by weight relative to the raw coal mass.
- In the research study conducted, CO2 injection followed a multi-stage process where the vessel was repeatedly refilled with gas to achieve a pressure of 30 bar. With each successive CO2 addition, there was a diminishing trend in the reactor’s pressure drop. Concurrently, the amount of CO2 introduced during each cycle decreased. This suggests that, as CO2 migrated and was adsorbed into the coal seam pores, the available sorption capacity progressively diminished.
- Ex situ tests allow simulation of desorption processes following the adsorption phase. Such experiments performed on taken coal samples are essential to determine the total amount of CO2 that remains adsorbed in the coal even after lowering the pressure. This information is crucial, and the method is recommended for risk management. In the event of an emergency leading to leakage, this allows for an estimation of how much of the injected CO2 would remain within the coal seam.
- Based on the known geometry of the artificial seam, it is possible to assess the dynamics of CO2 migration. This knowledge can be transferred to in situ conditions and may prove helpful during an assessment of the feasible injection rates when designing commercial installations.
Author Contributions
Conceptualization, M.W., K.K., K.S., S.M., S.S. and H.R.T.; methodology, M.W. and K.K.; investigation, M.W. and M.S.; validation, S.M., S.S. and H.R.T.; formal analysis, K.K.; writing—original draft preparation, M.W. and M.S.; writing—review and editing, M.W., K.S., S.M., S.S. and H.R.T.; visualization, M.W.; supervision, K.K.; project administration, K.S., S.M. and H.R.T.; funding acquisition, K.S. and H.R.T. All authors have read and agreed to the published version of the manuscript.
Funding
The research was conducted as part of the “Establishing a Research Observatory to Unlock European Coal Seams for Carbon Dioxide Storage (ROCCS)” project and co-financed by the program of the Minister of Science and Higher Education entitled “PMW” in the years 2020–2023; (agreement No. 5144/FBWiS/2020/2). The ROCCS project has received funding from the Research Fund for Coal and Steel under Grant Agreement No. 899336. The financial support is gratefully acknowledged.
Data Availability Statement
The data presented in this study are available on request from the corresponding author.
Conflicts of Interest
The authors declare that they have no known competing financial interest or personal relationships that could have appeared to influence the work reported in this paper. The funders had no role in the design of the study; in the collection, analyses, or interpretation of data; in the writing of the manuscript; or in the decision to publish the results.
References
- Ochedi, F.O.; Liu, Y.; Adewuyi, Y.G. State-of-the-art review on capture of CO2 using adsorbents prepared from waste materials. Process Saf. Environ. Prot. 2020, 139, 1–25. [Google Scholar] [CrossRef]
- Ochedi, F.O.; Yu, J.; Yu, H.; Liu, Y.; Hussain, A. Carbon dioxide capture using liquid absorption methods: A review. Environ. Chem. Lett. 2021, 19, 77–109. [Google Scholar] [CrossRef]
- Rashidi, N.A.; Yusup, S. An overview of activated carbons utilization for the post-combustion carbon dioxide capture. J. CO2 Util. 2016, 13, 1–16. [Google Scholar] [CrossRef]
- Wang, X.; Liu, H.; Zhang, D.; Yuan, X.; Zeng, P.; Zhang, H. Effects of CO2 adsorption on molecular structure characteristics of coal: Implications for CO2 geological sequestration. Fuel 2022, 321, 124155. [Google Scholar] [CrossRef]
- Metz, B.; Davidson, O.; de Coninck, H.; Loos, M.; Meyer, L. IPCC Special Report on Carbon Dioxide Capture and Storage; IPPC: Rome, Italy, 2005. [Google Scholar]
- Mukherjee, A.; Okolie, J.A.; Abdelrasoul, A.; Niu, C.; Dalai, A.K. Review of post-combustion carbon dioxide capture technologies using activated carbon. J. Environ. Sci. 2019, 83, 46–63. [Google Scholar] [CrossRef]
- Liu, E.; Lu, X.; Wang, D. A Systematic Review of Carbon Capture, Utilization and Storage: Status, Progress and Challenges. Energies 2023, 16, 2865. [Google Scholar] [CrossRef]
- Vo Thanh, H.; Yasin, Q.; Al-Mudhafar, W.J.; Lee, K.K. Knowledge-based machine learning techniques for accurate prediction of CO2 storage performance in underground saline aquifers. Appl. Energy 2022, 314, 118985. [Google Scholar] [CrossRef]
- Zhang, Q. Adsorption mechanism of different coal ranks under variable temperature and pressure conditions. J. China Univ. Min. Technol. 2008, 18, 395–400. [Google Scholar] [CrossRef]
- Lyu, X.; Liu, Q.; Yang, K.; Duan, M.; Fang, J. Experimental study of adsorption characteristics and deformation of coal for different gases. ACS Omega 2022, 7, 11415–11421. [Google Scholar] [CrossRef]
- Jia, L.; Cheng, P.; Yu, Y.; Chen, S.; Wang, C.; He, L.; Nie, H.; Wang, J.; Zhang, J.; Fan, B.; et al. Regeneration mechanism of a novel high-performance biochar mercury adsorbent directionally modified by multimetal multilayer loading. J. Environ. Manag. 2023, 326, 116790. [Google Scholar] [CrossRef]
- Zhao, X.; Liao, X.; He, L. The evaluation methods for CO2 storage in coal beds, in China. J. Energy Inst. 2016, 89, 389–399. [Google Scholar] [CrossRef]
- Hol, S.; Peach, C.J.; Spiers, C.J. A new experimental method to determine the CO2 sorption capacity of coal. Energy Procedia 2011, 4, 3125–3130. [Google Scholar] [CrossRef]
- Zhang, C.; Wang, E.; Li, B.; Kong, X.; Xu, J.; Peng, S.; Chen, Y. Laboratory experiments of CO2-enhanced coalbed methane recovery considering CO2 sequestration in a coal seam. Energy 2022, 262, 125473. [Google Scholar] [CrossRef]
- Asif, M.; Wang, L.; Wang, R.; Wang, H.; Hazlett, R.D. Mechanisms in CO2-enhanced coalbed methane recovery process. Adv. Geo-Energy Res. 2022, 6, 531–534. [Google Scholar] [CrossRef]
- Shi, J.Q.; Durucan, S. CO2 Storage in Deep Unminable Coal Seams. Oil Gas Sci. Technol. Rev. IFP 2005, 60, 547–558. [Google Scholar] [CrossRef]
- Wen, H.; Hao, J.; Ma, L.; Zheng, X. Experimental Study on Replacing Coal Seam CH4 with CO2 Gas. ACS Omega 2022, 7, 1395–1403. [Google Scholar] [CrossRef]
- Bai, G.; Su, J.; Zhang, Z.; Lan, A.; Zhou, X.; Gao, F.; Zhou, J. Effect of CO2 injection on CH4 desorption rate in poor permeability coal seams: An experimental study. Energy 2021, 238, 121674. [Google Scholar] [CrossRef]
- Kumar, H. Effect of sorption isotherm on CO2 storage capacity in Indian coal seam. Arab. J. Geosci. 2023, 16, 75. [Google Scholar] [CrossRef]
- Wetzel, M.; Otto, C.; Chen, M.; Masum, S.; Thomas, H.; Urych, T.; Bezak, B.; Kempka, T. Hydromechanical Impacts of CO2 Storage in Coal Seams of the Upper Silesian Coal Basin (Poland). Energies 2023, 16, 3279. [Google Scholar] [CrossRef]
- Fujioka, M.; Yamaguchi, S.; Nako, M. CO2-ECBM field tests in the Ishikari Coal Basin of Japan. Int. J. Coal Geol. 2010, 82, 287–298. [Google Scholar] [CrossRef]
- Kahnt, R.; Kutzke, A.; Martin, M.; Eckart, M.; Schlüter, R.; Kempka, T.; Tillner, E.; Hildenbrand, A.; Krooss, B.M.; Gensterblum, Y.; et al. “CO2RINA”—CO2 Storage Risk Integrated Analysis. Geological Storage of CO2—Long Term Security Aspects. GEOTECHNOLOGIEN Sci. Rep. 2015, 22, 139–166. [Google Scholar] [CrossRef]
- van Bergen, F.; Winthaegen, P.; Pagnier, H.; Krzystolik, P.; Jura, B.; Skiba, J.; van Wageningen, N. Assessment of CO2 storage performance of the Enhanced Coalbed Methane pilot site in Kaniow. Energy Procedia 2009, 1, 3407–3414. [Google Scholar] [CrossRef][Green Version]
- van Bergen, F.; Krzystolik, P.; van Wageningen, N.; Pagnier, H.; Jura, B.; Skiba, J.; Winthaegen, P.; Kobiela, Z. Production of gas from coal seams in the Upper Silesian Coal Basin in Poland in the post-injection period of an ECBM pilot site. Int. J. Coal Geol. 2009, 77, 175–187. [Google Scholar] [CrossRef]
- Alves Dias, P.; Kanellopoulos, K.; Medarac, H.; Kapetaki, Z.; Miranda Barbosa, E.; Shortall, R.; Czako, V.; Telsnig, T.; Vazquez Hernandez, C.; Lacal Arantegui, R.; et al. EU Coal Regions: Opportunities and Challenges Ahead; Report number: JRC112593; Publications Office of the European Union: Luxembourg, 2018; ISBN 978-92-79-89884-6 (online), 978-92-79-89883-9 (print). doi: 10.2760/064809 (online), 10.2760/668092 (print). [Google Scholar]
- Vangkilde-Pedersen, T.; Anthonsen, K.L.; Smith, N.; Kirk, K.; Neele, F.; van der Meer, B.; Le Gallo, Y.; Bossie-Codreanu, D.; Wojcicki, A.; Le Nindre, Y.-M.; et al. Assessing European capacity for geological storage of carbon dioxide–the EU GeoCapacity project. Energy Procedia 2009, 1, 2663–2670. [Google Scholar] [CrossRef]
- Kumar, H. An overview of characterization and sorption capacity of coal for CO2 sequestration. Arab. J. Geosci. 2022, 15, 1364. [Google Scholar] [CrossRef]
- Zheng, S.; Sang, S.; Liu, S.; Wang, M.; Cao, L.; Jin, X.; Feng, G.; Yang, Y. Measurement of CO2 adsorption capacity with respect to different pressure and temperature in sub-bituminous: Implication for CO2 geological sequestration. Front. Earth Sci. 2023. [Google Scholar] [CrossRef]
- Huy, P.Q.; Sasaki, K.; Sugai, Y.; Kiga, T.; Fujioka, M.; Adachi, T. Effects of SO2 and pH Concentration on CO2 Adsorption Capacity in Coal Seams for CO2 Sequestration with Considerations for Flue Gas from Coal-Fired Power Plants. J. Can. Pet. Technol. 2009, 48, 58–63. [Google Scholar] [CrossRef]
- PN-EN ISO/IEC 17025:2018-2; Ogólne Wymagania Dotyczące Kompetencji Laboratoriów Badawczych i Wzorcujących. General Requirements for the Competence of Testing and Calibration Laboratories. ISO: Geneva, Switzerland, 2018. Available online: https://www.iso.org/files/live/sites/isoorg/files/store/en/PUB100424.pdf (accessed on 27 August 2023).
- PN-G-04560:1998 Standard; Paliwa Stałe—Oznaczanie Zawartości Wilgoci, Części Lotnych Oraz Popiołu Analizatorem Automatycznym. Solid Fuels—Determination of Moisture, Volatile Matter and Ash by Automatic Analyzer. Polish Committee for Standardization: Warsaw, Poland, 1998. (In Polish)
- PN-G-04516:1998 Standard; Paliwa Stałe—Oznaczanie Zawartości Części Lotnych Metodą Wagową. Solid Fuels—Gravimetric Determination of Volatile Matter. Polish Committee for Standardization: Warsaw, Poland, 1998. (In Polish)
- PN-G-04584:2001 Standard; Paliwa Stałe—Oznaczanie Zawartości Siarki Całkowitej i Popiołowej Automatycznymi Analizatorami. Solid Fuels—Determination of Total and Ash Sulfur Content with Automatic Analyzers. Polish Committee for Standardization: Warsaw, Poland, 2001. (In Polish)
- PN-G-04513:1981 Standard; Paliwa Stałe—Oznaczanie Ciepła Spalania i Obliczanie Wartości Opałowej. Solid Fuels—Determination of the Calorific Value and Calorific Value Calculation. Polish Committee for Standardization: Warsaw, Poland, 1991. (In Polish)
- PN-G-04571:1998 Standard; Paliwa Stałe—Oznaczanie Zawartości Węgla, Wodoru i Azotu Automatycznymi Analizatorami—Metoda Makro. Solid Fuels—Determination of Carbon, Hydrogen and Nitrogen Content with Automatic Analyzers—Macro Method. Polish Committee for Standardization: Warsaw, Poland, 1998. (In Polish)
Disclaimer/Publisher’s Note: The statements, opinions and data contained in all publications are solely those of the individual author(s) and contributor(s) and not of MDPI and/or the editor(s). MDPI and/or the editor(s) disclaim responsibility for any injury to people or property resulting from any ideas, methods, instructions or products referred to in the content. |
© 2023 by the authors. Licensee MDPI, Basel, Switzerland. This article is an open access article distributed under the terms and conditions of the Creative Commons Attribution (CC BY) license (https://creativecommons.org/licenses/by/4.0/).