Article

Enhancing Energy Power Quality in Low-Voltage Networks Integrating Renewable Energy Generation: A Case Study in a Microgrid Laboratory

by
Edisson Villa-Ávila
1,2,
Paul Arévalo
2,
Roque Aguado
2,
Danny Ochoa-Correa
1,
Vinicio Iñiguez-Morán
1,
Francisco Jurado
2,* and
Marcos Tostado-Véliz
2,*
1
Department of Electrical, Electronics and Telecommunications Engineering (DEET), University of Cuenca, Balzay Campus, Cuenca 010107, Ecuador
2
Department of Electrical Engineering, University of Jaén, 23700 Linares, Spain
*
Authors to whom correspondence should be addressed.
Energies 2023, 16(14), 5386; https://doi.org/10.3390/en16145386
Submission received: 24 May 2023 / Revised: 5 July 2023 / Accepted: 12 July 2023 / Published: 14 July 2023
(This article belongs to the Special Issue Challenges of Renewable Energy in Developing Countries)

Abstract

:
Nowadays, energy decarbonization due to integrating renewable energy sources presents important challenges to overcome. The intermittent nature of photovoltaic systems reduces power quality by producing voltage variations and frequency deviations in electrical system networks, especially in weak and isolated distribution systems in developing countries. This paper presents a power smoothing method for improving the low-pass filter and moving average for grid-connected photovoltaic systems. This novel method includes state-of-charge monitoring control of the supercapacitor’s energy storage system to reduce the fluctuations of photovoltaic power at the point of common coupling. A case study for a microgrid in a high-altitude city in Ecuador is presented with exhaustive laboratory tests using real data. This research aims to improve energy power quality in electrical distribution systems to cope with the growth of renewable penetration. The results demonstrate significant power quality and stability improvements achieved through the proposed method. For instance, the power smoothing method effectively reduced power fluctuations by 16.7% with the low-pass filter, 14.05% with the ramp-rate filter, and 9.7% with the moving average filter.

Graphical Abstract

1. Introduction

Nowadays, the generation of electrical energy with renewable sources is increasingly widespread, with the aim of decarbonizing the current and future economy [1]. Photovoltaics (PV) energy is considered one of the most promising renewable sources. However, the fluctuating nature of large-scale grid-connected solar PV seriously affects power quality [2]. The impact of power fluctuations over long distances is further intensified, making large PV plants a threat to the safe operation of the system. To address grid stability concerns, some power companies or research studies have imposed ramp-rate restrictions on PV plants [3]. Therefore, it is necessary to control PV output power that exceeds grid connection criteria [4]. Integrating fast-response energy storage systems, e.g., supercapacitor energy storage system (SC-ESS), to reduce power fluctuations can significantly improve the grid penetration rate of PV. High power density storage systems that smooth out PV power fluctuations can significantly reduce the impact of a solar farm’s power output on the grid [5]. The feasibility study presented in [5] explores three power smoothing methods for a PV–hydrokinetic system using a hybrid storage system with SC-ESS and lithium-ion batteries. The results demonstrate the effectiveness of these methods in reducing power fluctuations and optimizing the point of common coupling voltage. Sensitivity studies indicate that the capacity of the batteries and SC-ESS can influence the energy exchange with the utility grid [5]. There are several power smoothing techniques applied to PV systems, e.g., low-pass filtering (LP) [6], moving average (MA) filtering [7], corrective predictive methods [7,8], heuristic approaches [9], and multiobjective optimization systems [10]. For example, in [6], a two-stage low-pass filter control strategy with a variable filter time constant is designed to suppress power fluctuations of the DC bus. This strategy uses Improved Particle Swarm Optimization (IPSO) and fuzzy control to dynamically adjust the filtering time constants, improving the load power fluctuation smoothing effect and preventing battery overcharge and over-discharge, but a critical analysis is needed to evaluate their effectiveness in terms of SC-ESS operability control and meeting grid connection requirements while preserving system lifespan. Another approach presented in [7] combines MA and ramp-rate (RR) techniques with hybrid storage systems (SC-ESS/batteries) to reduce PV power fluctuations. Experimental results demonstrate the effectiveness of this method in reducing SC-ESS operations and detecting failures in PV systems [7]. However, a deeper examination is required to assess the limitations and drawbacks of MA filtering, particularly regarding SC-ESS operability control and its impact on meeting grid connection requirements without compromising lifespan. Power smoothing techniques using SC-ESS and batteries in a renewable grid-connected system are discussed in [8]. The study analyzes power quality, energy management, and self-consumption, while highlighting the operability of SC-ESS. The results reveal the advantages of the power smoothing RR method in reducing SC-ESS operations and the varying requirements of SC-ESS and batteries based on the capacity of renewable sources [8]. However, a critical analysis is necessary to evaluate their advantages and disadvantages compared with other approaches, specifically regarding SC-ESS operability control and their compatibility with grid connection requirements. Moreover, Ref. [9] proposes a novel power smoothing method for grid-connected PV systems using SC-ESS. The method utilizes a predictor–corrector approach with a k-means algorithm for cycle estimation and RR algorithms for correction. Laboratory experiments demonstrate the effectiveness of the proposed method in reducing energy losses and technical violations. A more comprehensive analysis is needed to assess the effectiveness of these heuristics in terms of SC operability control and their ability to meet grid connection requirements without compromising the lifespan of the energy storage system. A coordinated control scheme is developed for a hybrid energy storage system (HESS) in [10] to mitigate the power variations of a PV plant. A multiobjective optimization model is established to dispatch the output power of batteries and SC-ESS, considering overall losses and the state-of-charge (SoC) deviation of the SC-ESS. However, a critical evaluation is required to determine the strengths and limitations of these optimization systems in terms of SC operability control and their impact on meeting grid connection requirements while ensuring the longevity of the HESS. To address the gaps found in the aforementioned references, this paper focuses on providing a specific and innovative power smoothing method using SC-ESS, aiming to improve energy power quality, minimize fluctuations, and meet grid connection requirements. The challenge lies in controlling the operability of the SC-ESS in order to meet the grid connection requirements and make the storage system operate within certain permitted limits without compromising its lifespan.
In the literature, there are various methods of reducing PV output power fluctuations using SC-ESSs, e.g., Ref. [11] proposes an SC-ESS-based power smoothing methodology using a Karlman filter; the results show that the method is effective to smooth the power, minimizing the stress on the converter. A multiobjective optimization model to limit the PV energy through SC-ESS and batteries is presented in [12] to prevent the SC-ESS from operating at its lower limits; the authors propose an SoC correction strategy, and the results of the simulation indicate that the proposed method is more economical than conventional methods. Ref. [13] adopts a novel control strategy for an HESS with batteries and SC-ESS; the LP scheme maintains control in terms of power balance at the output of the fluctuating renewable system. The application of SC-ESS as a power fluctuation reduction element is also studied in Ref. [14]; the results of the fuzzy logic algorithm show that SC-ESS achieves a resulting profile of smoothed voltage and a constant current. Ref. [15] proposes an optimal control strategy for an independent PV system with SC-ESS and batteries combining the LP method and a fuzzy logic controller. The results of the proposed system reduce the operating current of the battery and reduce the dynamic stress, prolonging the lifespan of the energy storage system. The authors in [6] present a study on the use of an SC-ESS and batteries to smooth the output power by adjusting the parameters of the filter time constant of the system in real time according to the SoC. However, it is not possible to dynamically control the SoC of the SC-ESS by dynamically effectively stabilizing the operability of the SC-ESS.
A comparative study of power smoothing control methods has shown that the MA and RR methods are the most used in this application due to their simplicity and high accuracy [16]. After performing exhaustive simulations, the authors conclude that the MA and RR methods are useful to have a comparative frame of reference with new algorithms proposed by researchers. Ref. [17] presents a PV smoothing control method using the spline function; the authors carry out comparative simulations with the MA method to demonstrate the validity of the new method. Researchers have widely chosen low-pass filter power smoothing and MA methods; in Ref. [18], the authors present a review where the advantage of applying this algorithm is discussed, and these suggestions will contribute to decreasing the storage capacity and degradation of energy, causing an increase in the lifespan of the battery and the SC-ESS. Among other relevant results, an optimization based on Ref. [19] is proposed to smooth voltage fluctuations due to various intermittent sources. To increase the lifespan of storage systems, the authors control the minimum SoC of batteries by applying an improved MA method, which eliminates the lag problem of the conventional MA algorithm. Moreover, one can be referred to the works conducted in [20], where the authors present a novel optimization strategy to reduce the power losses in a wind farm and PV system; a numerical method based on a genetic algorithm is deployed to smooth the output power using an MA method to generate the reference signal. The results along with a case study are used to verify the usefulness of the proposed power smoothing approach. The suppression of PV output fluctuation to smooth the power delivered to the grid is presented in [21]; the authors proposed a model predictive control to manage the SoC in batteries. A moving average filter is used to generate the output reference signal; the simulation results show that the proposed method is able to improve the output power efficiently. Furthermore, the RR control method has been developed to mitigate power fluctuations in renewable energy systems with interface converters. The RR method has been validated in experimental settings and compared with existing approaches, such as the one proposed in [22], where the authors propose an enhanced RR method in conjunction with SC-ESS. The results demonstrate a slight improvement in the lifespan of SC-ESS when utilizing this strategy, but the authors acknowledge the method’s strong dependence on the capacity of SC-ESS. In another study [9], the authors combine RR and MA techniques to reduce fluctuations in a PV system employing SC-ESS. Despite promising technical outcomes, the implementation complexity of RR entails additional costs. The RR method has been extensively investigated in the literature, alongside the MA and LP methods, owing to its effective system stabilization and notable enhancement of energy quality [23]. Consequently, RR serves as a suitable benchmark for comparing novel methods.
The available literature predominantly applies the MA, RR, and LP filters for power smoothing in PV systems. While these methods offer interesting features, such as reducing PV output power fluctuations, several crucial aspects remain unaddressed, such as the control of the SoC of the SC-ESS. To fill these gaps and advance the state of the art, this paper presents a comparative study that evaluates the effectiveness of power smoothing methods, focusing on a novel approach based on the integration of MA, RR, and LP filters for a grid-connected PV/SC-ESS system. A key novelty introduced in this research is the dynamic control feature of the supercapacitor’s SoC, ensuring its safe operation within designated charge limits and enhancing the overall reliability of the energy storage system. The primary objective of this study is to enhance power smoothing techniques, particularly through the effective utilization of the LP method to manage the supercapacitor’s SoC and prevent it from operating at its limits. By refining widely employed methods, the overarching goal is to mitigate power fluctuations in grid-connected PV systems.
To comprehensively investigate this matter, extensive laboratory tests have been conducted to validate the proposed approach. The experimentation site chosen for this purpose is the city of Cuenca, Ecuador, which is characterized by sunny days accompanied by persistent cloud cover, a common scenario in many Andean regions. Additionally, the presence of the Micro-Grid laboratory at the University of Cuenca adds to the significance of this location for conducting rigorous experiments.
By bridging the gaps identified in the literature and introducing novel control features, this research aims to improve energy power quality in electrical distribution systems, particularly to cope with the challenges posed by the increasing penetration of renewable energy sources. The extensive experimental results obtained from real-world data provide valuable insights and contribute to the advancement of power smoothing techniques using SC-ESSs and control algorithms. In summary, this study not only addresses the limitations of previous research but also offers practical solutions and insights for enhancing power smoothing in renewable energy systems.
This paper is structured into five main sections. Section 2 provides a description of the materials and methods used, including a detailed explanation of the SC-ESS and the presentation of three power smoothing algorithms. In Section 3, a case study is presented, highlighting the implementation of the power smoothing system and the types of daily photovoltaic power curves used. Section 4 showcases the results and discussions, comparing the outcomes of the different power smoothing methods. Finally, Section 5 presents the conclusions derived from the study.

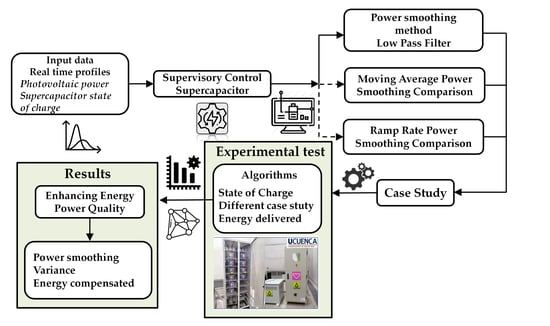
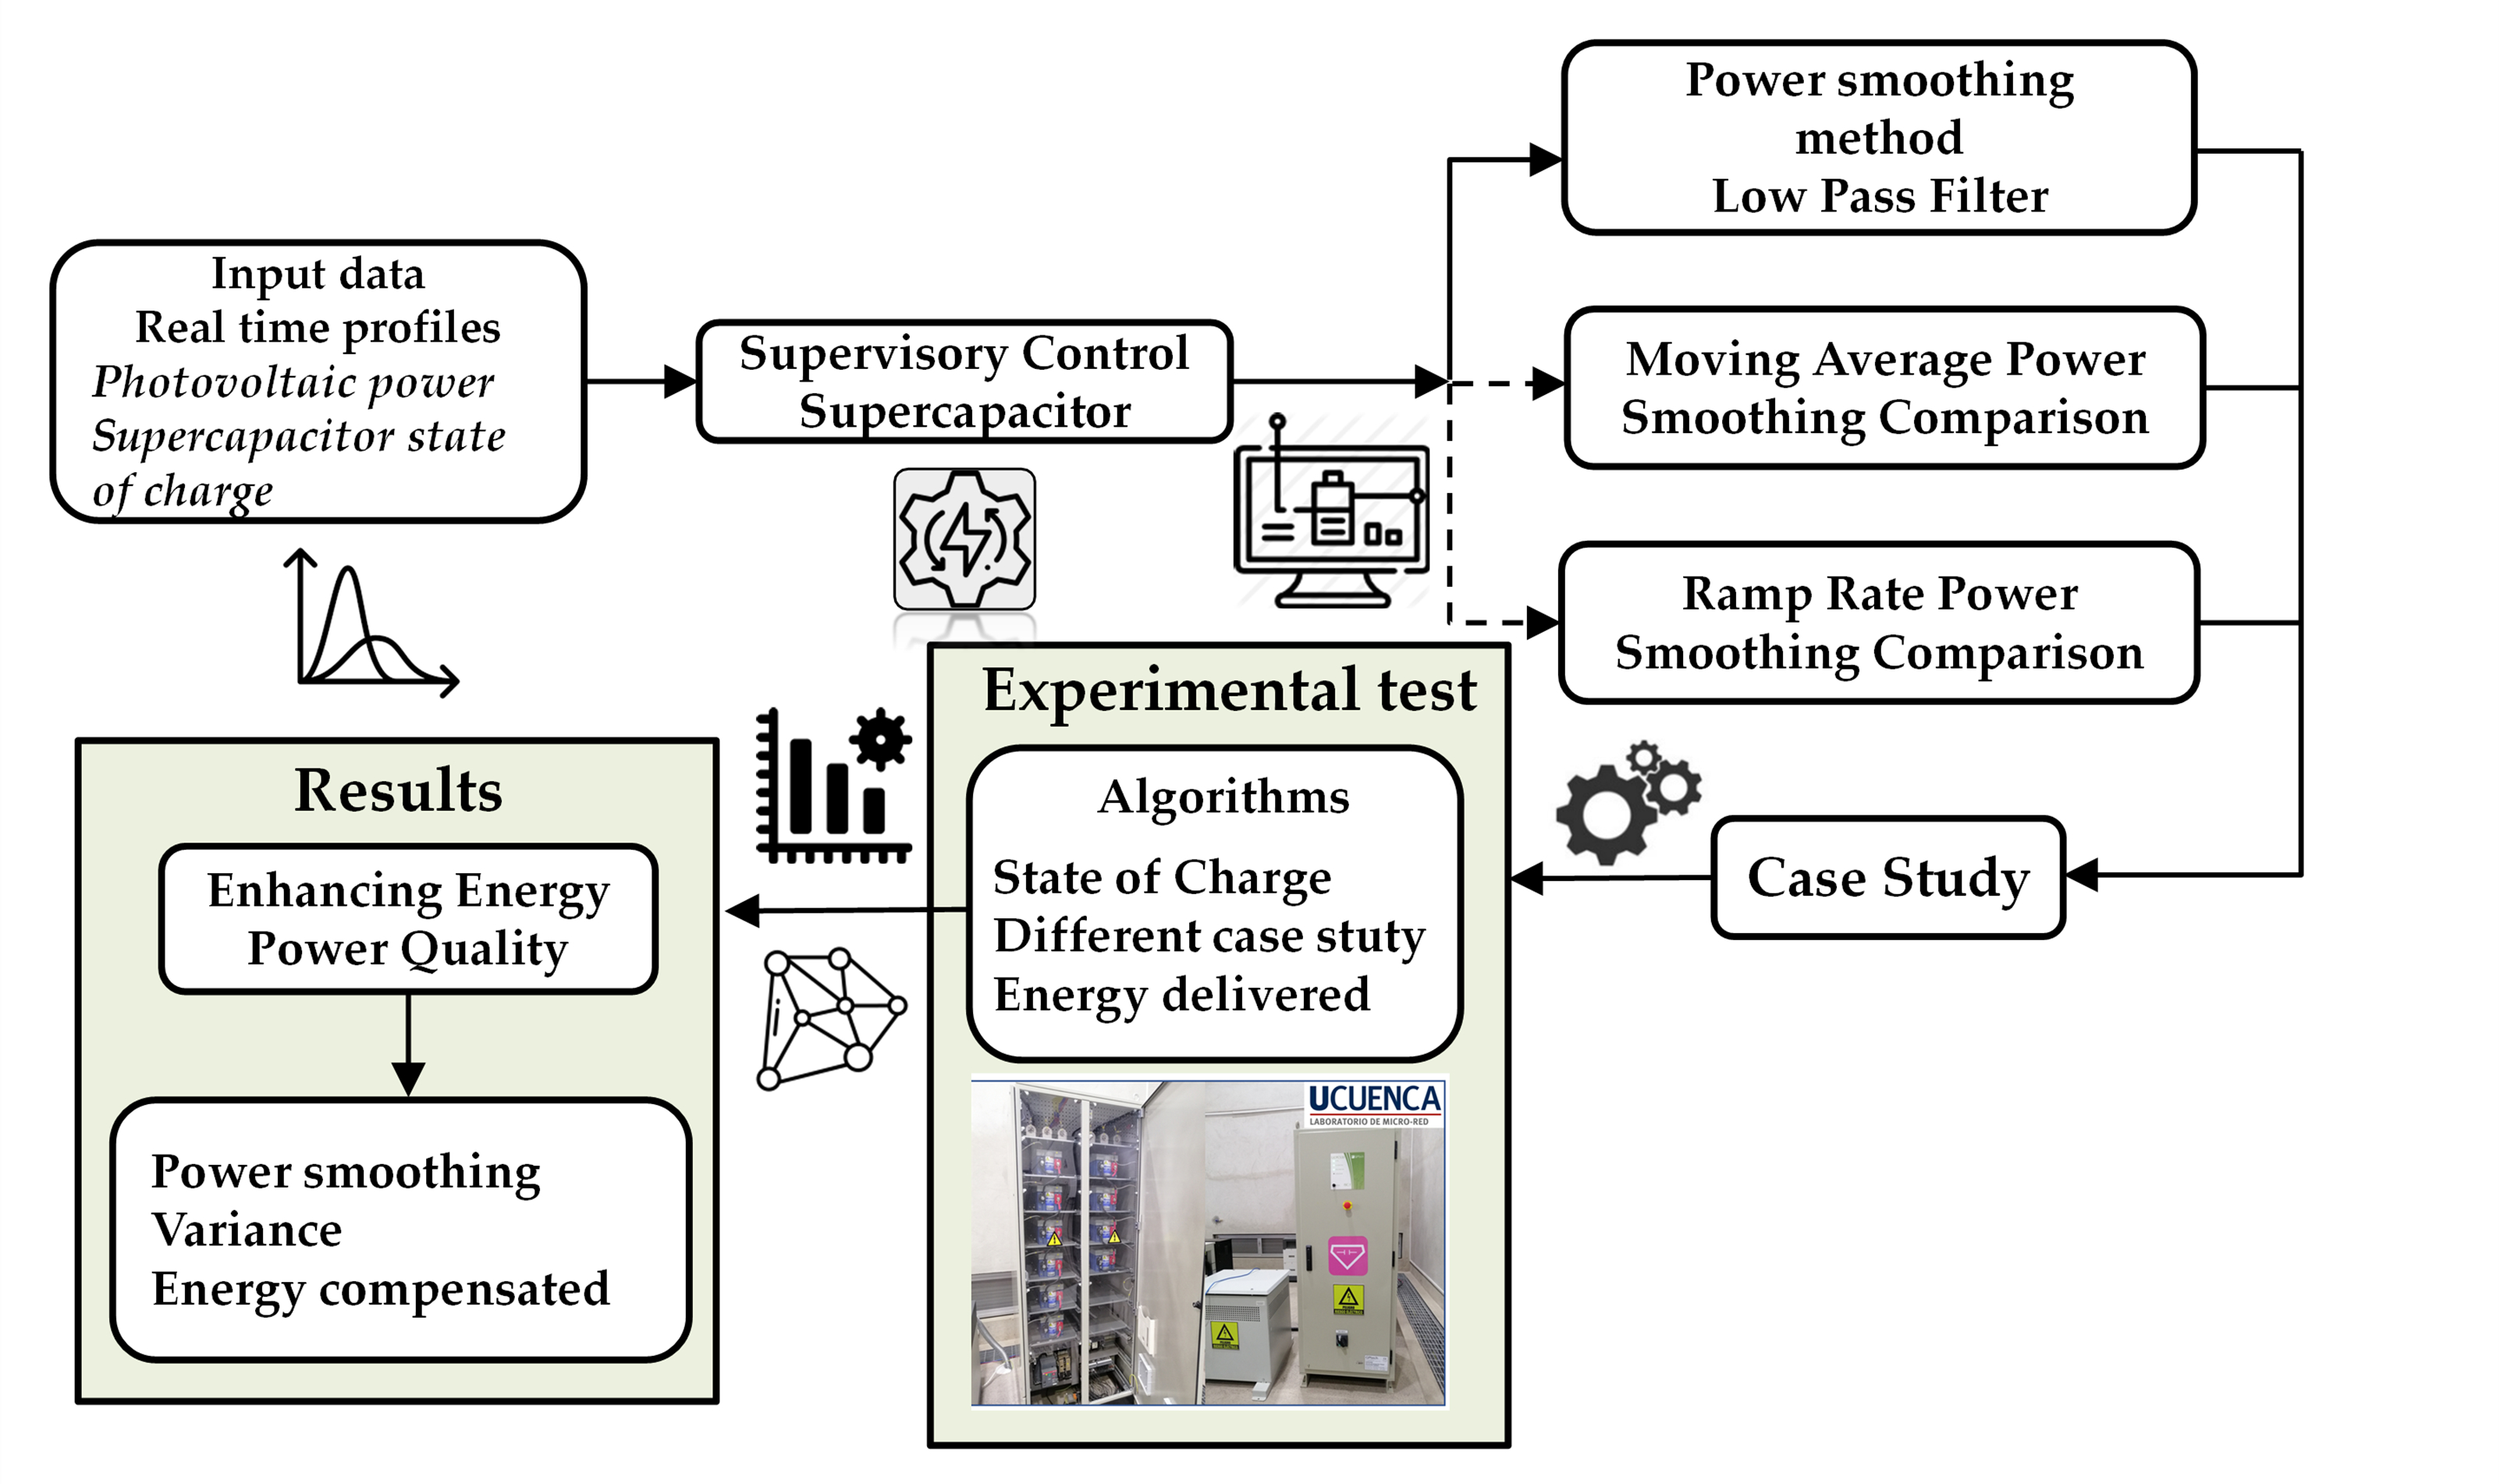
2. Materials and Methods

Figure 1 shows the methodology proposed to lead this study. The input data are the real PV output power measured in the laboratory on a conventional day. In the first place, the methods for power smoothing are as follows: LP filtering, MA, and RR were presented and defined. From the data logger of the experimental microgrid, the supervisory control of the energy storage system is studied, and the novel method applied at this stage is used in each LP, MA, and RR power smoothing method comparatively. In this document, the energy storage system is proposed to take advantage of the high power density storage of the SC-ESS to achieve the desired performance. The results are experimentally validated under several technical and economic criteria. Finally, an analysis of variability and energy is presented.

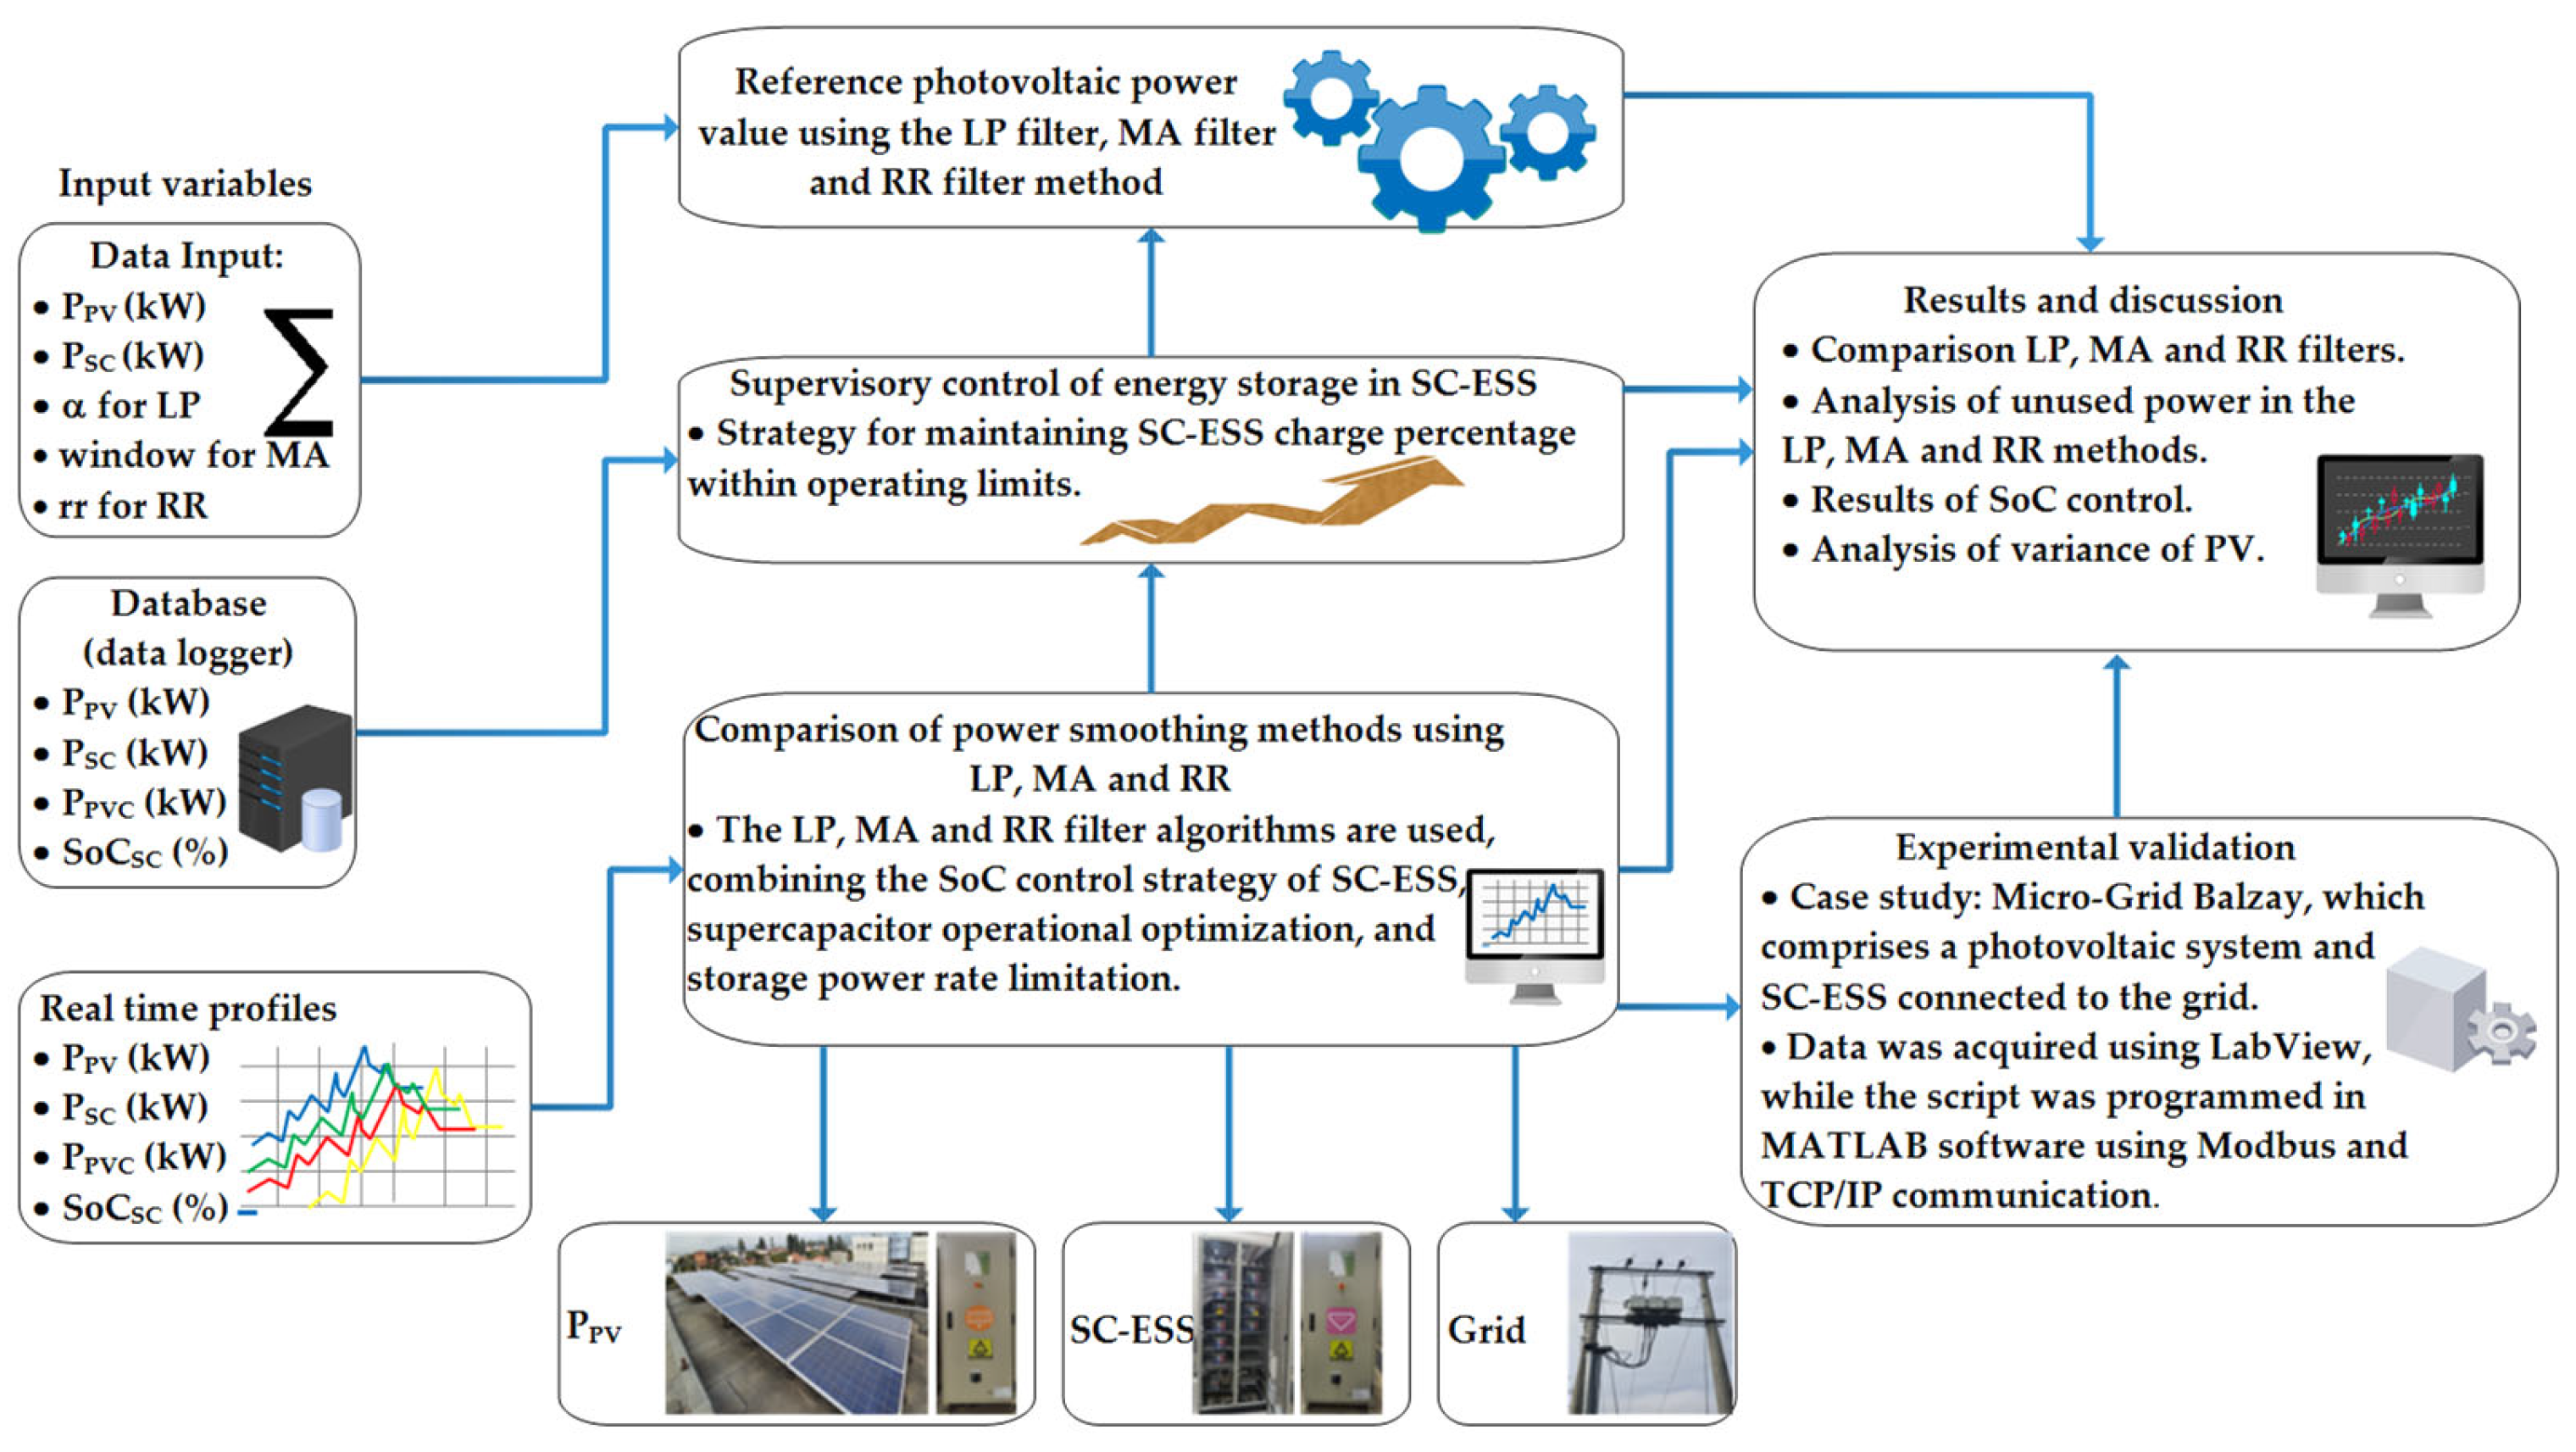
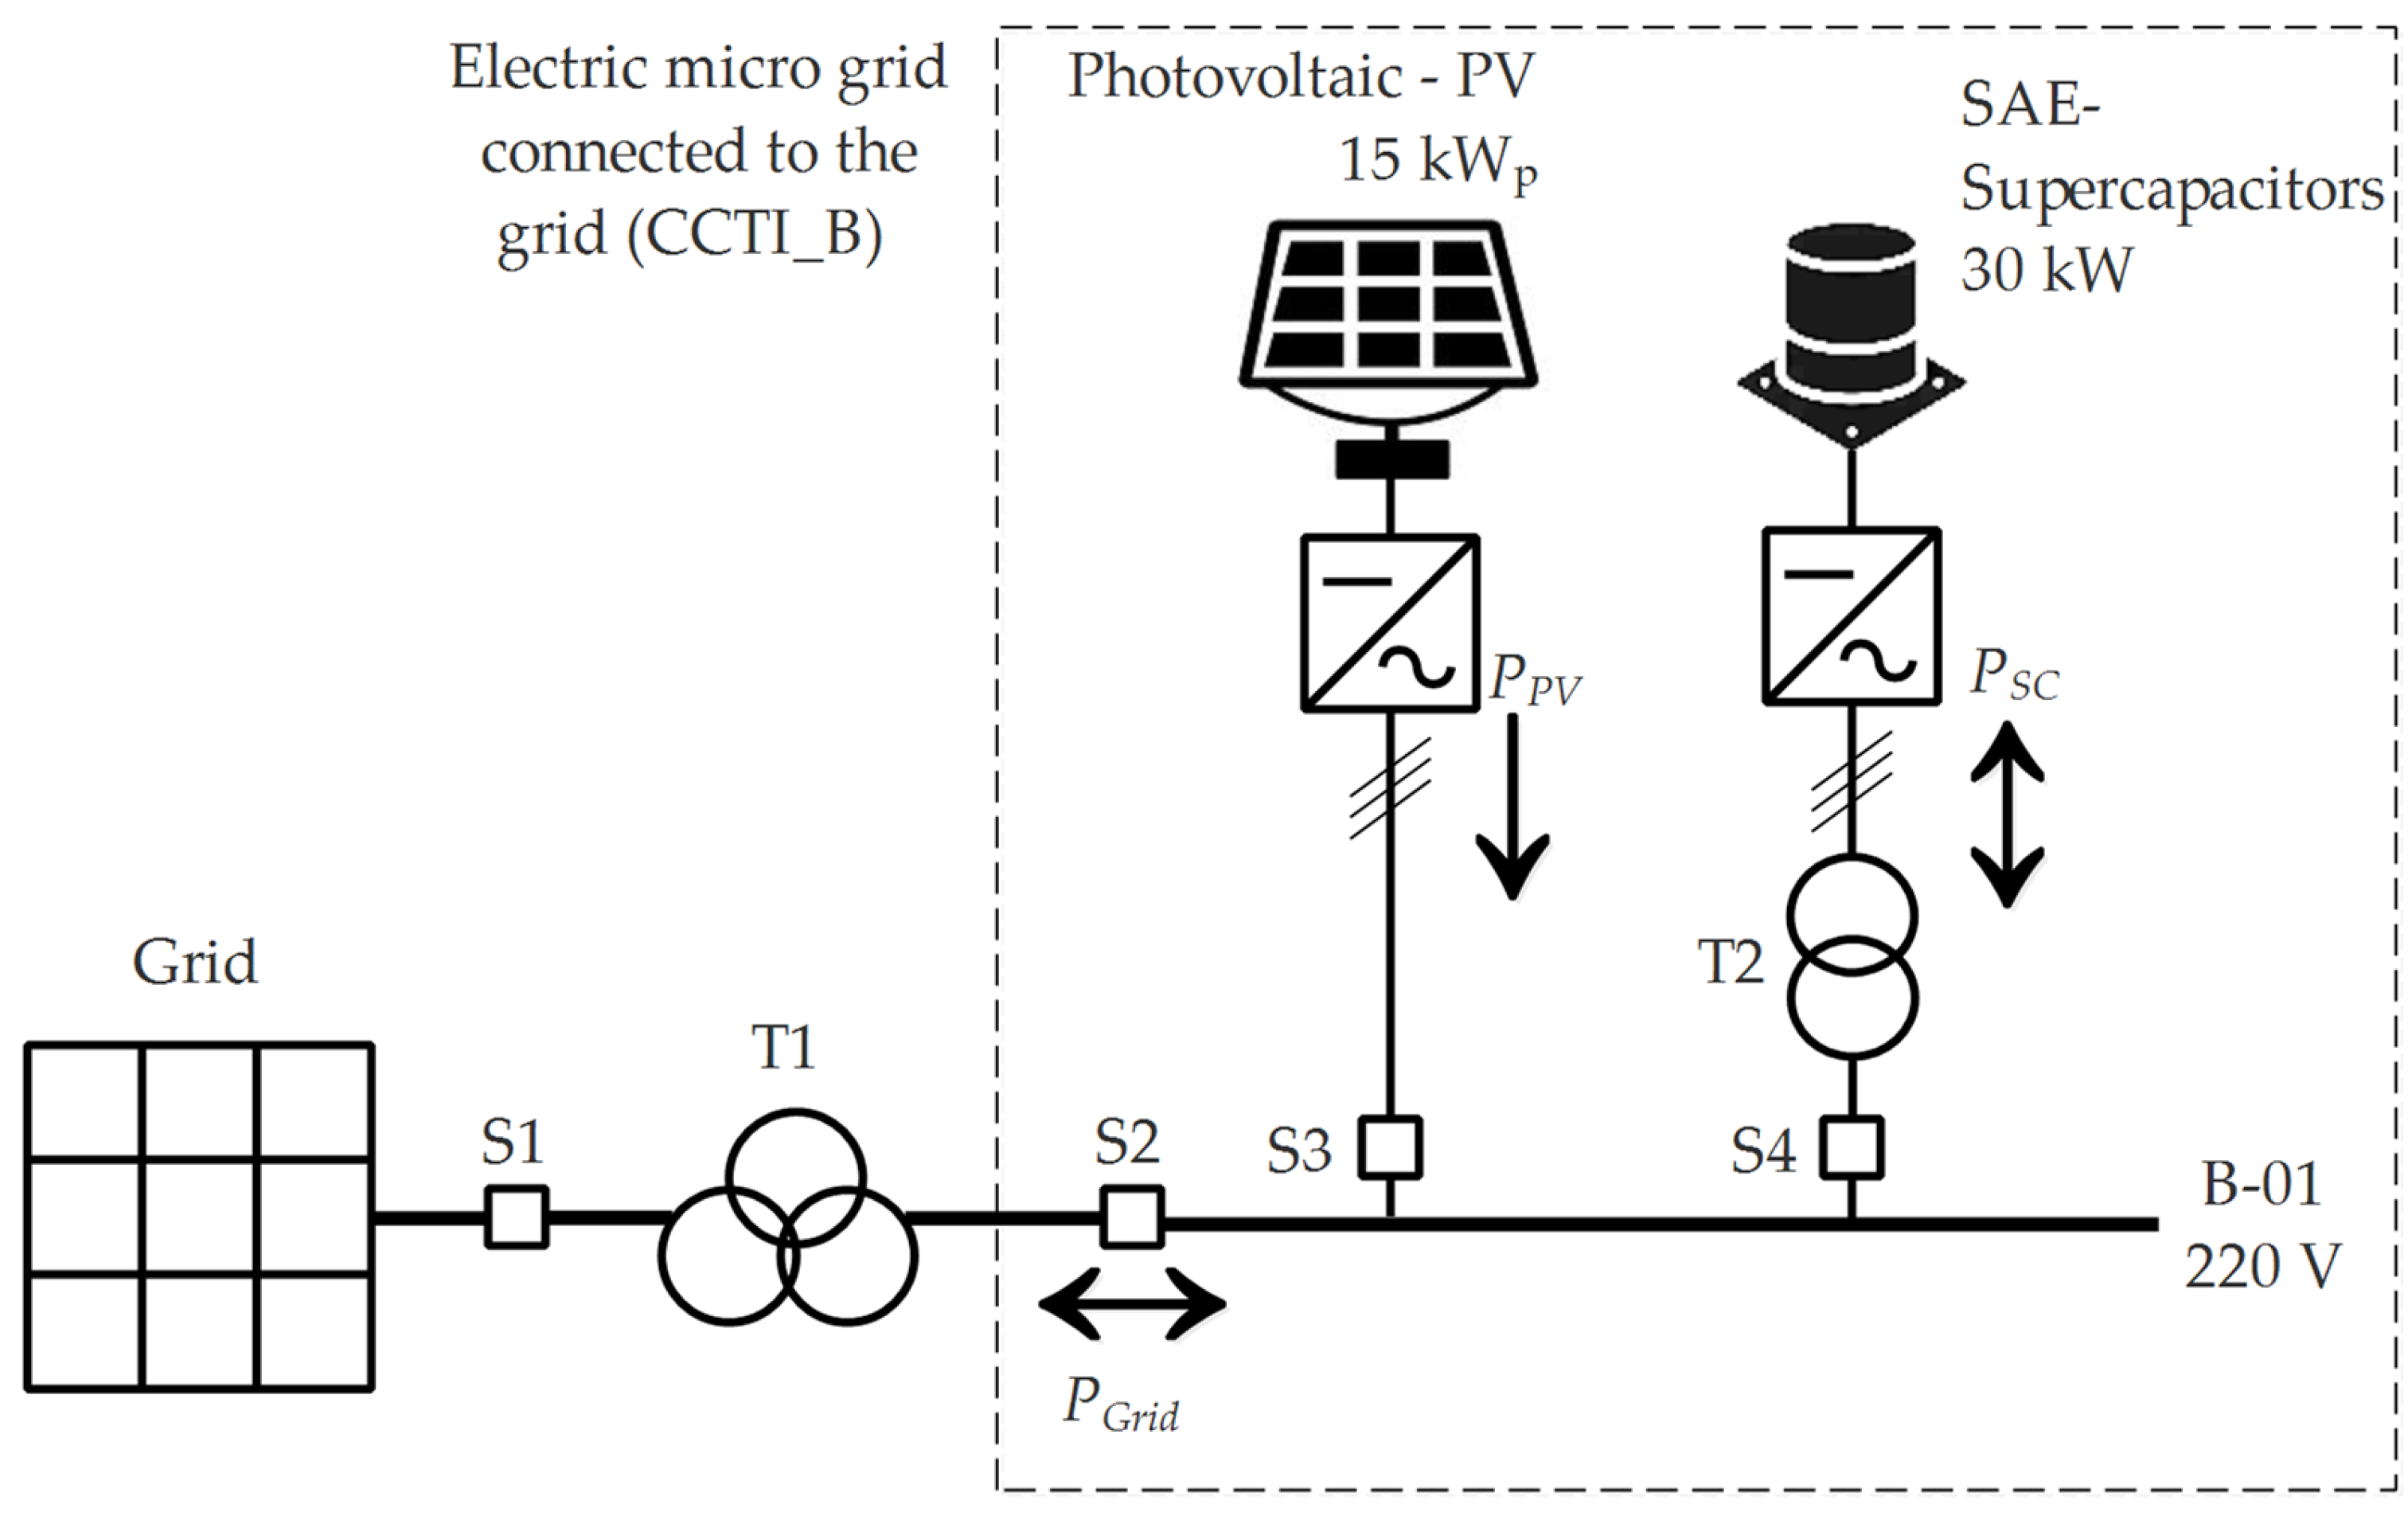
2.1. Description of the SC-ESS of the Micro-Grid Laboratory

Supercapacitors are passive electrical devices that store more energy than a conventional capacitor and give it back faster than an electrochemical battery. These characteristics, combined with their high number of charge/discharge cycles and long-term stability, make them suitable for implementing energy storage systems (ESS). The Micro-Grid Laboratory of Universidad de Cuenca has a bank of ten electric double-layer supercapacitors (EDLC) from the USA manufacturer Maxwell Technologies, BOOSTCAP model BMOD0130, of 130 F and 56 VDC each. The devices are connected in series, providing 560 VDC in the bank’s terminals, which in turn are connected to a bidirectional three-phase inverter of 30 kW to constitute an ESS based on SC-ESS. The energy storage capacity of the SC-ESS is around 0.60 kWh, its maximum efficiency, according to actual measurements, is 92%, and the energy density is 34 Wh/kg. The rest of the SC-ESS nameplate data are provided in Appendix A.
Figure 2a provides a picture of the SC-ESS prototype in the laboratory, whose software hosts the algorithms studied in this survey. In addition, Figure 2b shows an example of the SC-ESS inverter operation as a current source converter (CSC) under a variable active power setpoint profile. The results show the correct operation of the inverter in CSC mode for our research purposes and reveal how the resulting dynamic of the SoC is in response to the active power request.

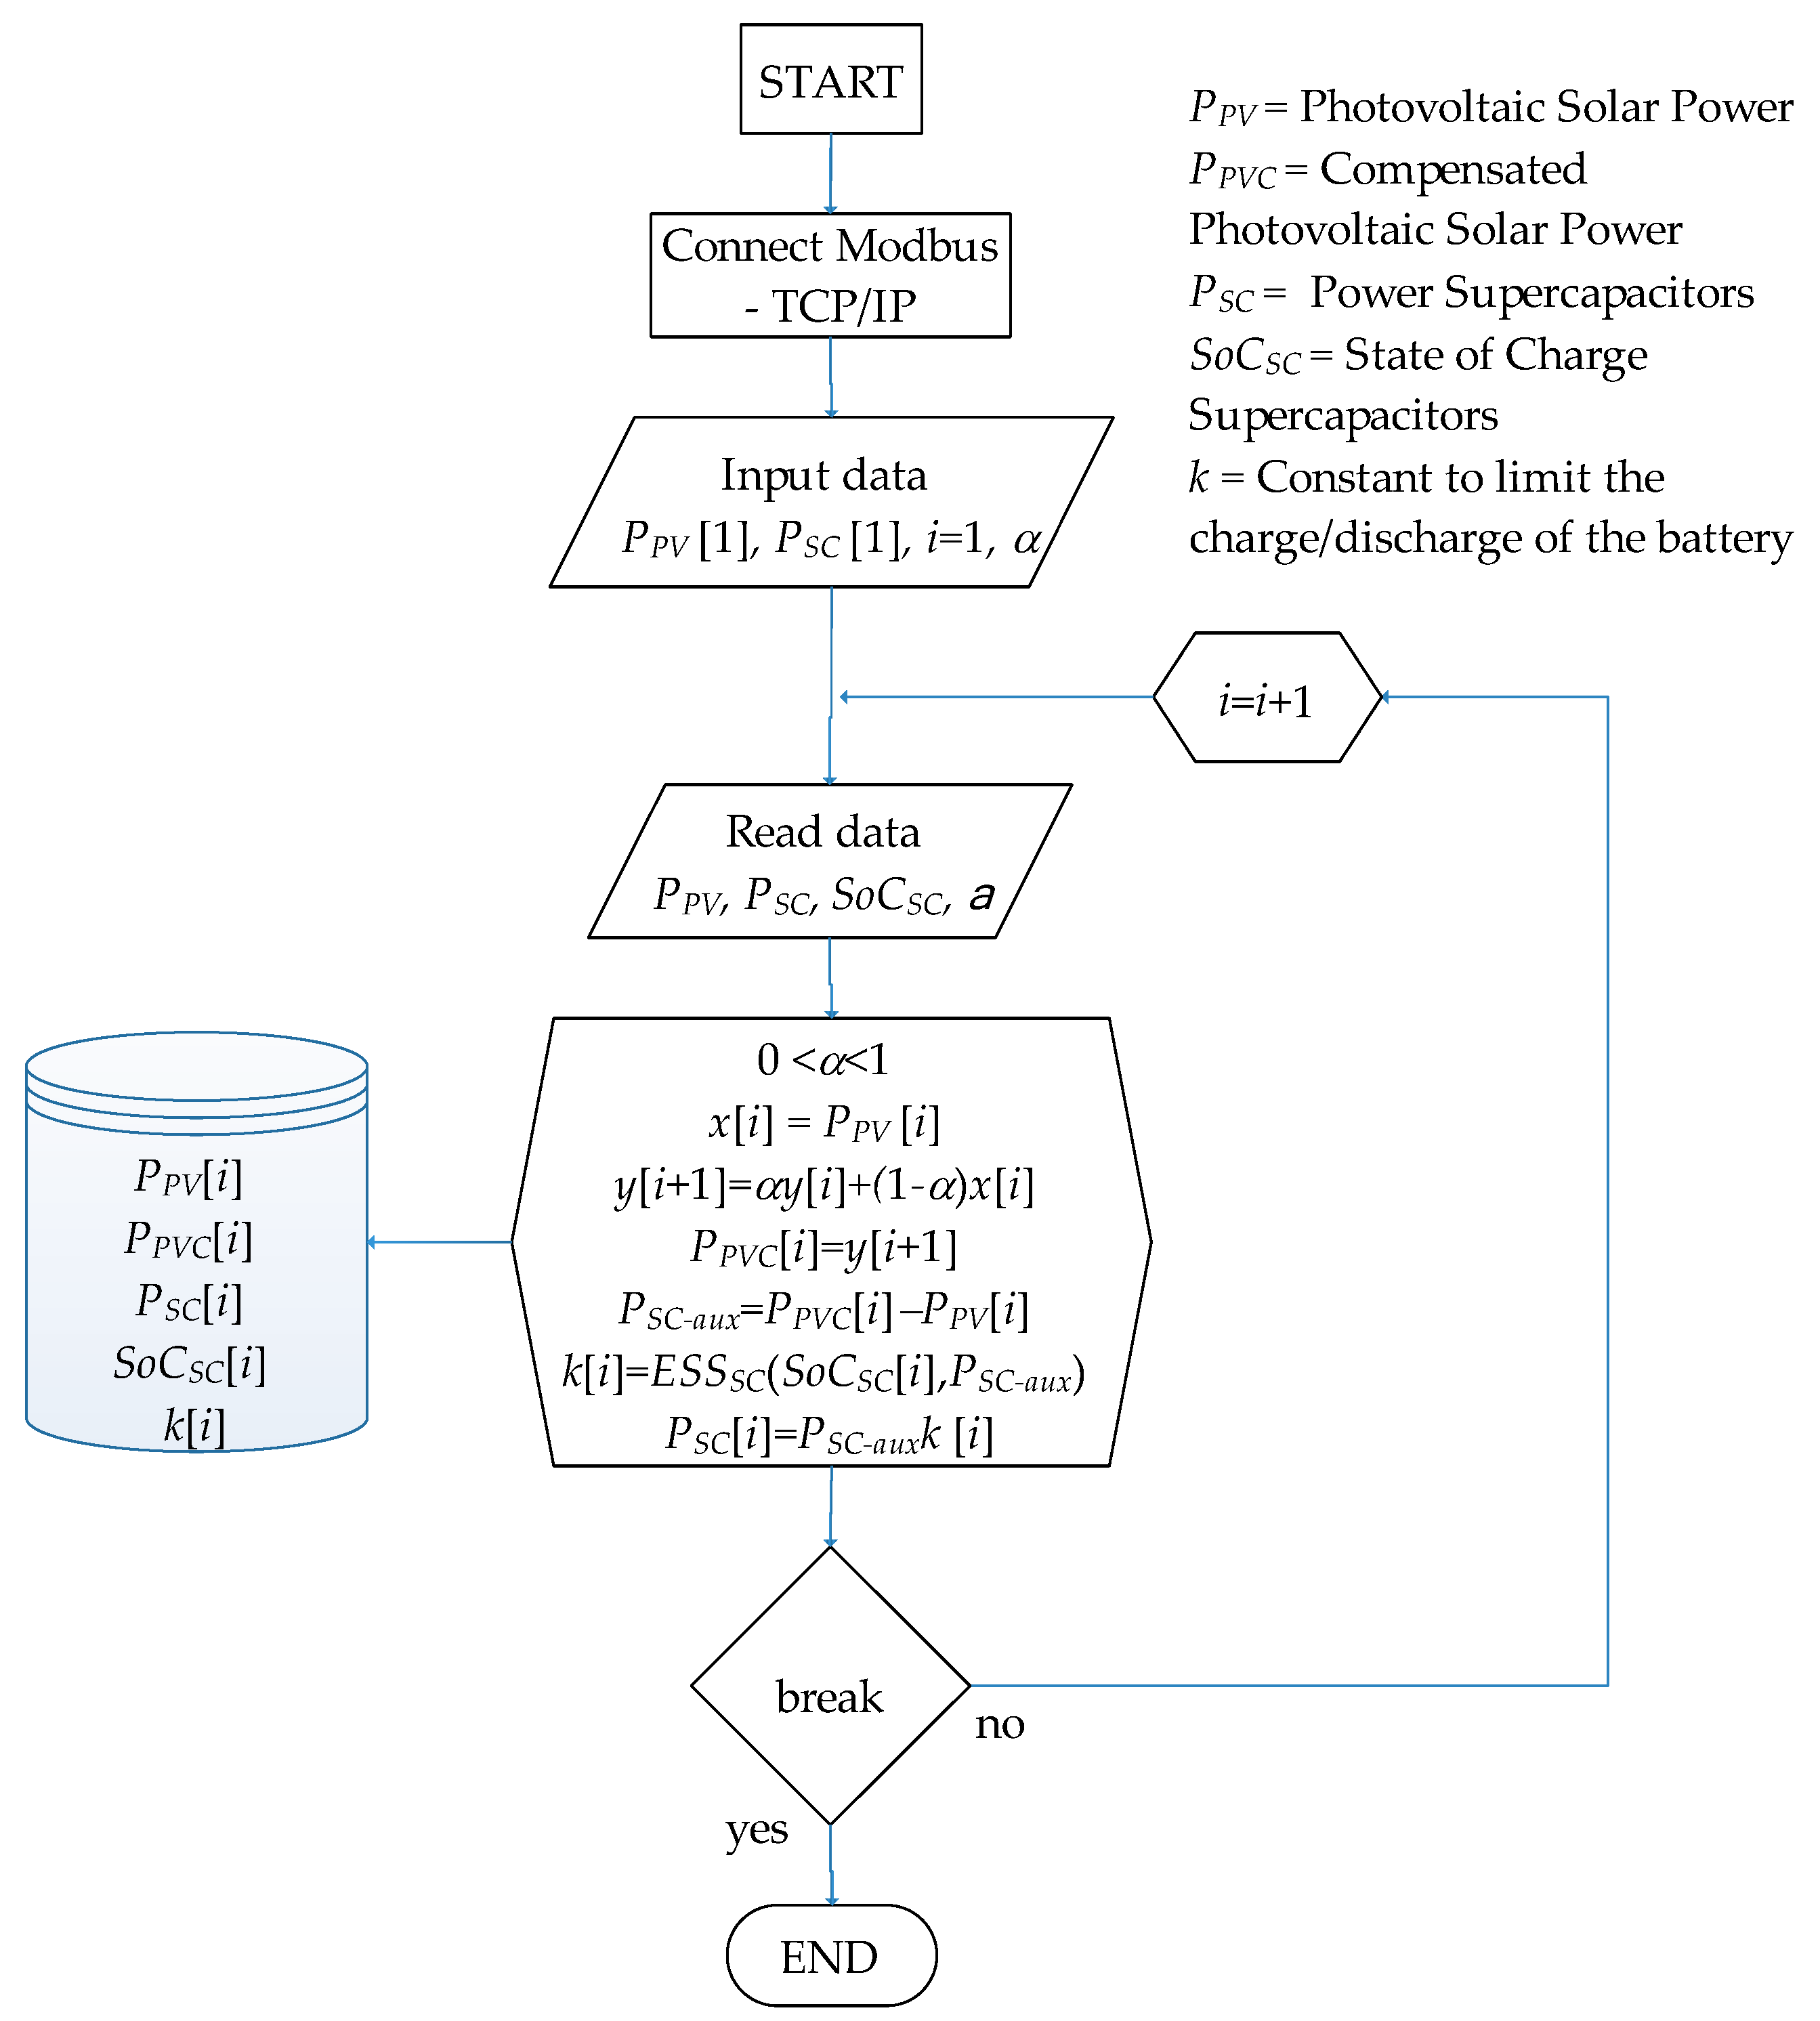
2.2. Design of Power Smoothing Algorithm Based on a Low-Pass Filter

Typically, the LP power smoothing method is used in signal processing to remove high frequency from signals [24], which can be helpful to reduce the power fluctuations in solar farms. Therefore, this paper constructs a mathematical design of LP to smooth the power peaks of PV system with 15 kW of capacity. Equation (1) shows the typical form of the voltage at the terminals of a capacitor in a series RC circuit in the frequency domain. In this expression, which corresponds to that of a first-order low-pass filter, Vo and Vi denote the output and input voltages to the RC circuit, respectively, R and C are the resistance and capacitance values, respectively, and s is the Laplace operator. Then, this equation is rearranged to obtain a transfer function G(s) as expressed in (2) the voltage concerning capacitance and resistance. In order to have an expression that allows the digital implementation of the filter, Equations (3)–(6) show the conversion process of the transfer function G(s) in the discrete space. In order to control the dynamics behavior to the filter proposed, it is necessary to express Equations (2)–(6) in the time domain by applying the Z-transform [25].
V o s = 1 C s R + 1 C s V i s = 1 1 + R C s V i s
G s = V o s V i s = 1 1 + R C s
G z = 1 z 1 z 1 s 1 + R C = 1 e T R C z 1 1 e T R C z 1
τ = R C
v o k + 1 = e T τ   v o k + 1 e T τ v i k
α = e T τ
Equation (7) expresses the voltage in terms of its time constant, where α can be adjusted according to the smoothing requirements. By definition (6), this parameter is within the range 0 < α < 1 ( 0 < α < 1 ) .
v o k + 1 = α v o k + 1 α v i k
In this context, the variable v i is substituted with the PV input power P P V , while the variable v o is replaced with the filtered power output of the PV system. The disparity between the filtered power and the input power determines the amount of power to be injected by the SC-ESS, denoted as P S C . It is important to note that the parameter α governs the extent of power smoothing to be applied, wherein higher values of α approach unity, signifying a more pronounced smoothing effect, while lower values tend towards zero, indicating minimal smoothing. To provide a visual representation of this power smoothing process and its associated variables, Figure 3 depicts the corresponding flowchart.
-
First, the inputs variables are collected from the microgrid ( P P V , P S C , α, S o C S C ), then auxiliary variables are assigned (aux,i). Both SC-ESS overcharged and over-discharged produce severe effects on the lifespan.
-
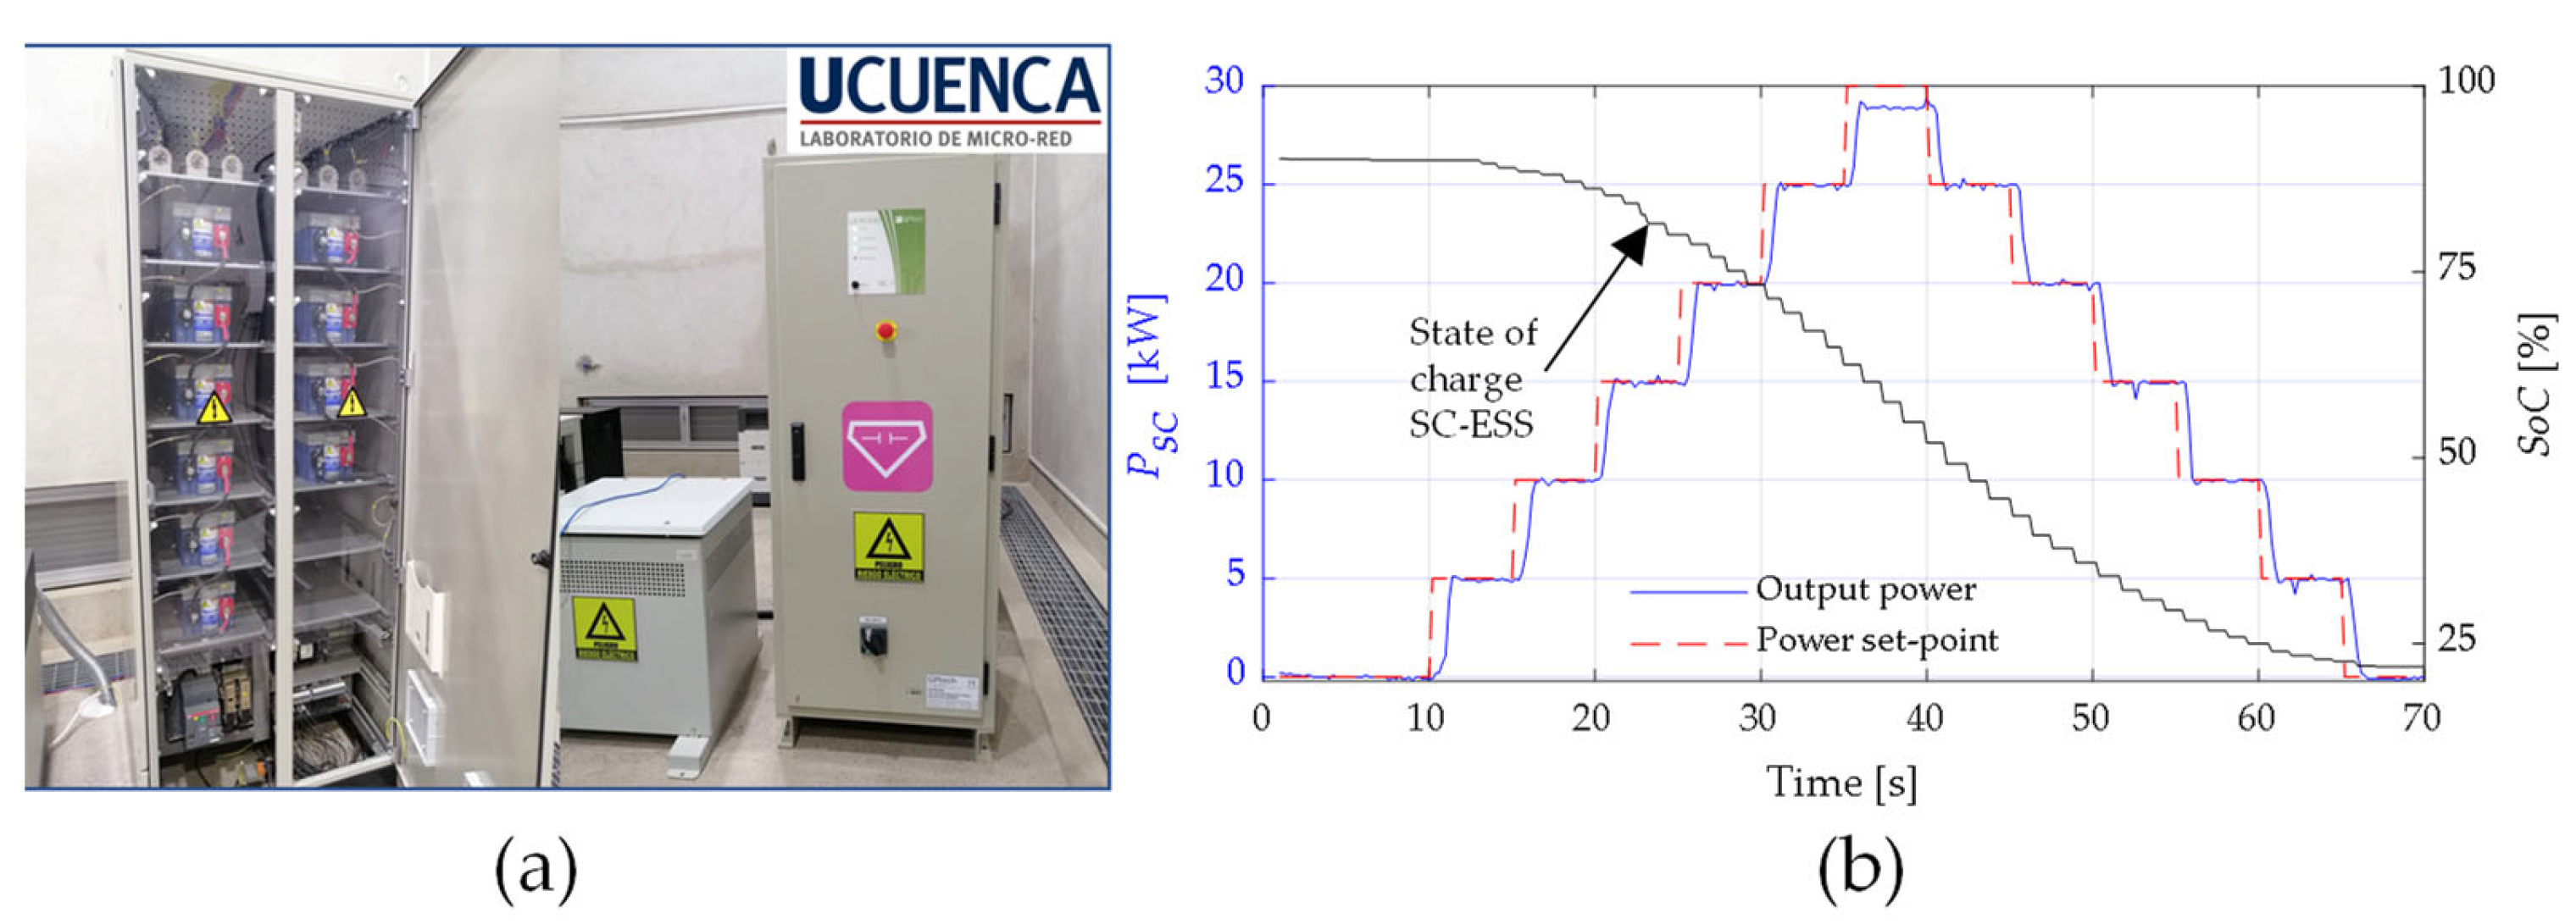
Then, in order to avoid these issues, the SoC of SC needs to be limited. If during the smoothing actions provided by the SC-ESS its SoC approaches its lower threshold, the proposed method will prioritize the SC-ESS load until the SoC is raised to a safe level to continue the control tasks. Analogous reasoning explains what would happen if the SoC reaches its upper limit. This feature is achieved by a supervisory control of the energy storage, which generates the value of the limit constant k shown in the diagram in Figure 3. Further details of this supervisory control are presented in Section 2.4. The constraints of SC-ESS depend on α. Therefore, if the SoC of SC-ESS is lower than the minimum SoC ( S o C S C ), the energy generation of PV charges the SC-ESS until reaching the upper limit, as show in Figure 3. Is important to mention that all variables are stored separately for further analysis.
Figure 3. Flowchart to the LP-filter-based power smoothing method implementation.
Energies 16 05386 g003

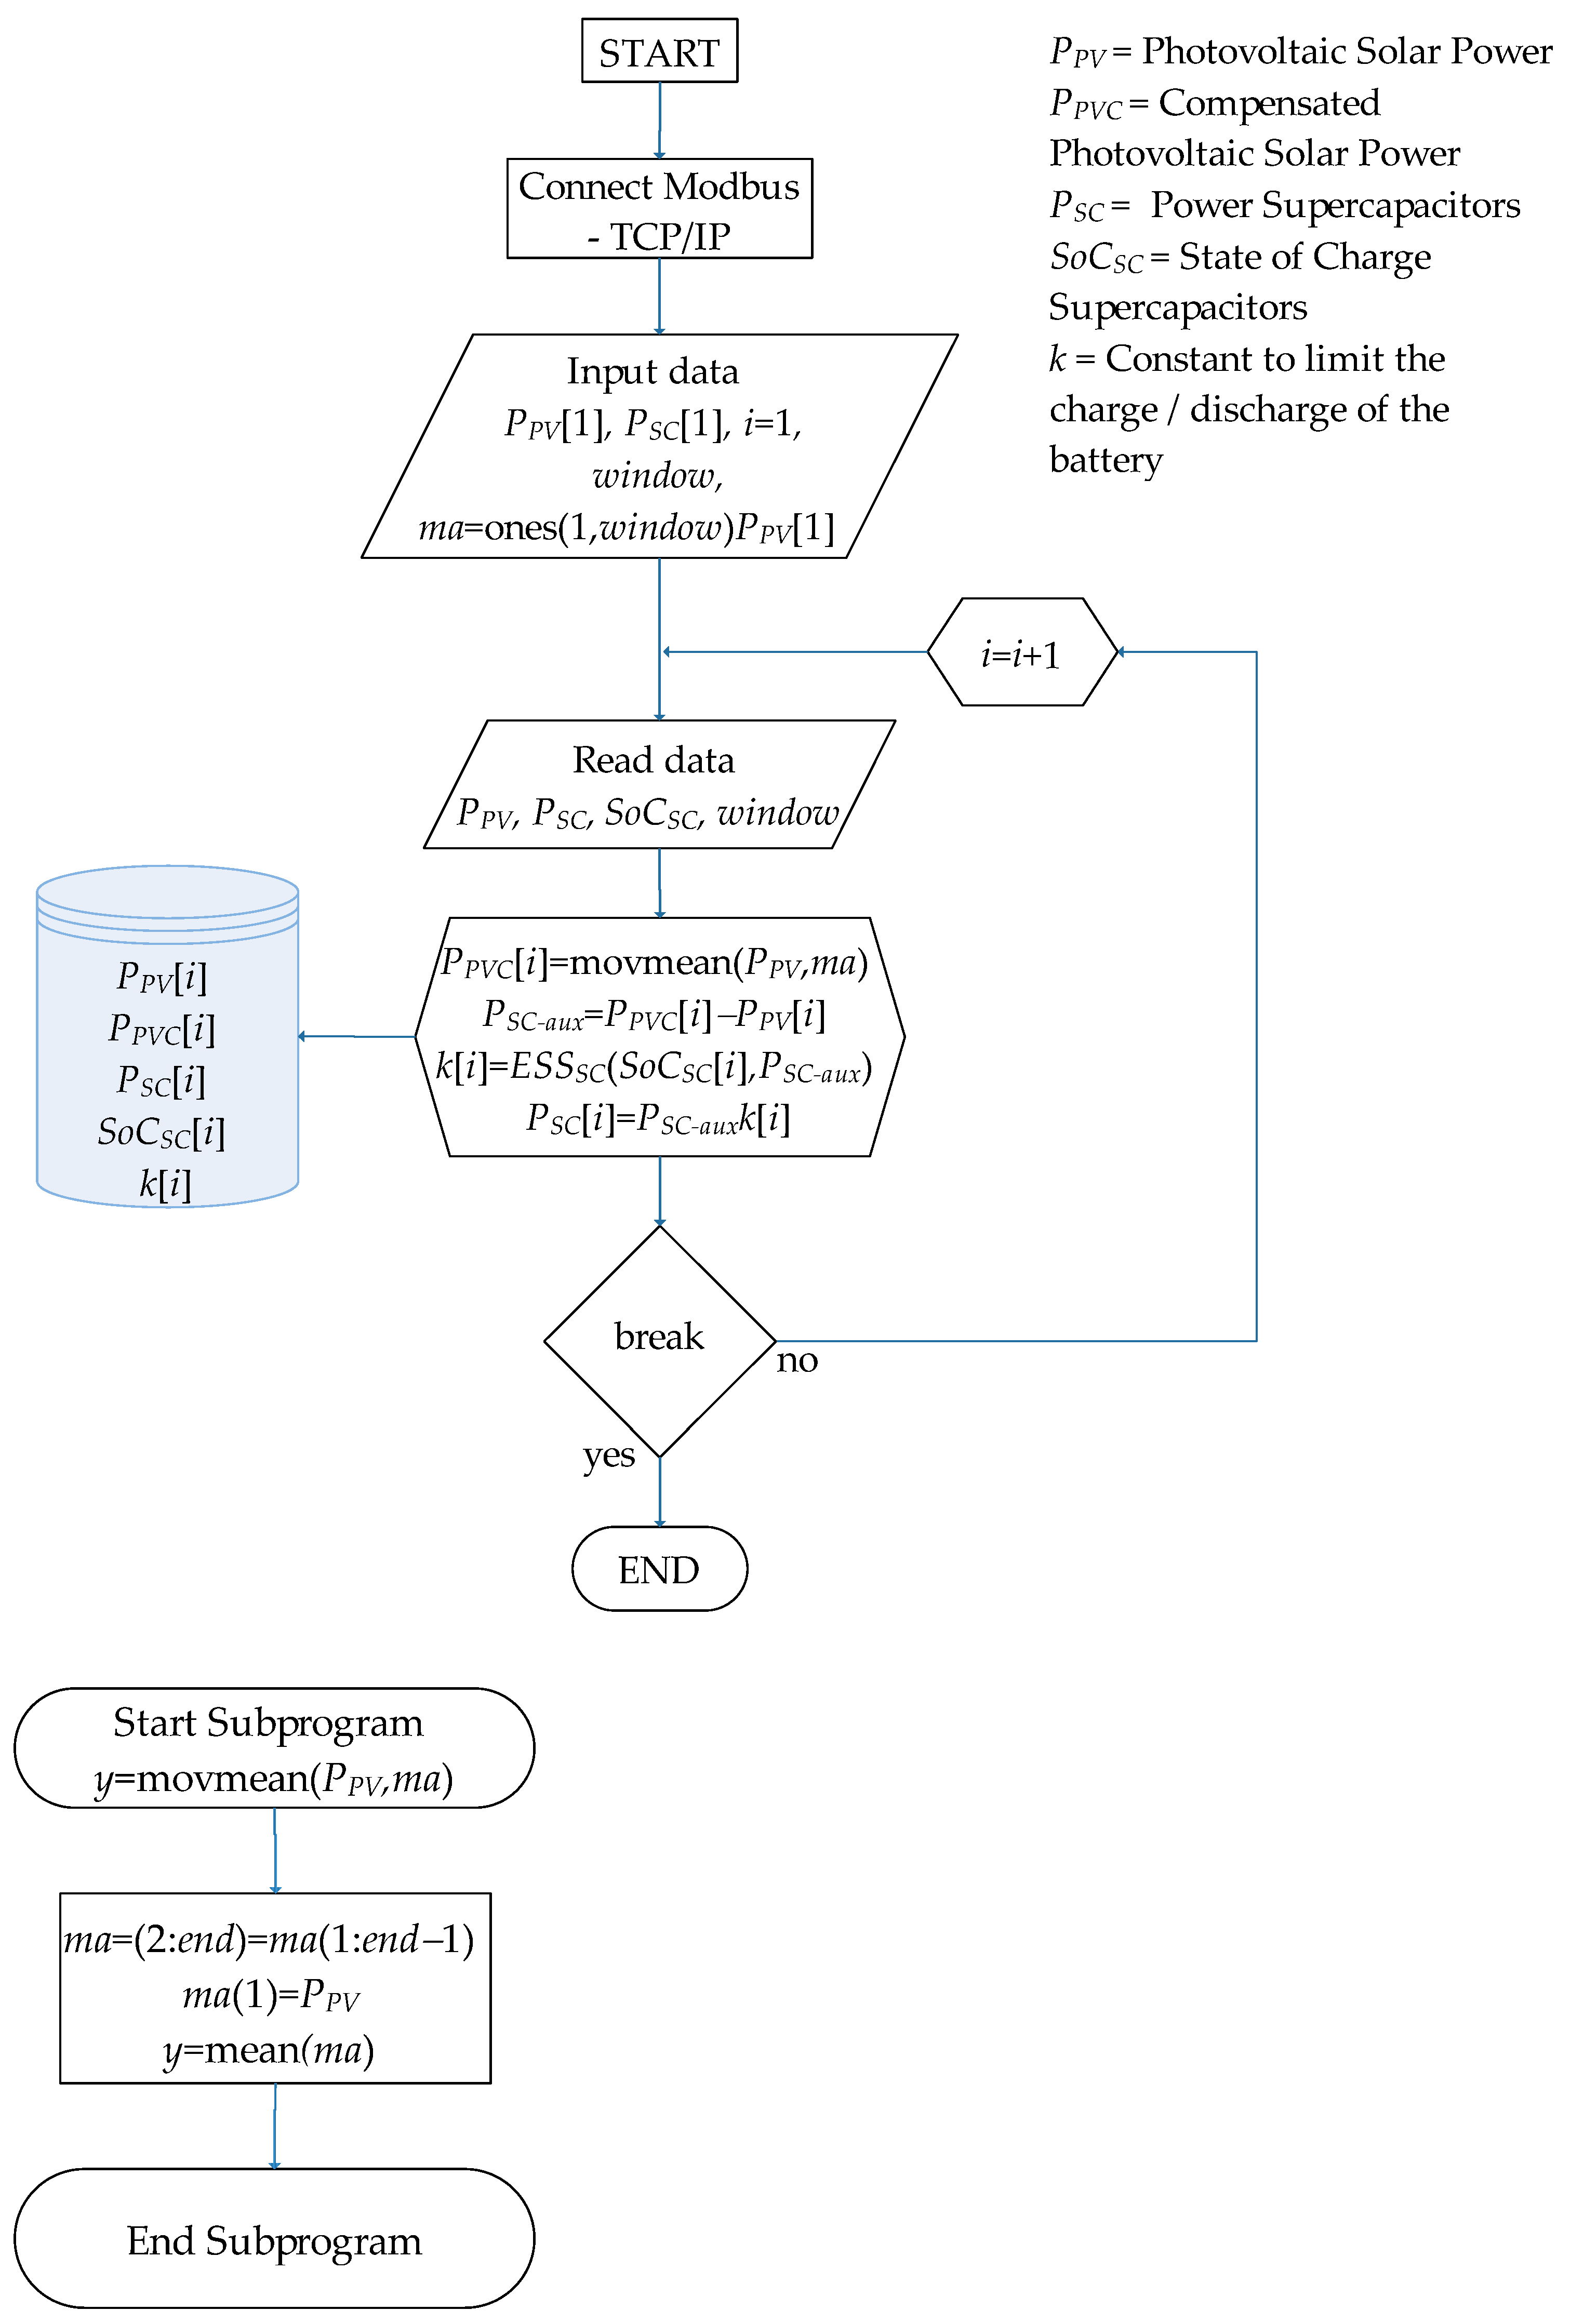
2.3. Design of Power Smoothing Algorithm Based on MA

The moving average method is a statistical method based on time series analysis [26]. The core idea of the algorithm is to determine the average of a group. Equation (8) represents the MA filter presented in this paper [27].
P P V C k = 1 N P P V k + P P V k 1 + + P P V k N + 1
where P P V is the PV output power, P P V C is the output power of the moving average filter, and N is the samples inside the time windows. After the specified number of iterations, the variable P P V is replaced by the smoothing power of the PV P P V C . The difference between the smoothed power and the input power is the result of the P S C power flow sent to the grid. The specific process shown in Figure 4 is as follows:
-
First, the input variables are defined P P V , P S C , N , S o C S C , and similarly to the previous case, the input variables are assigned their auxiliary variables a u x , i .
-
Then, the individual extreme values of each target function corresponding to the minimum and maximum state of charge in SC are found, where N is defined by the number of samples in time windows by the power smoothing. The calculations are performed by obtaining the output value P T = P P V + P S C that can be seen in the system.
-
Finally, as in the previous case, the SoC of the SC-ESS is maintained at safe levels thanks to the implementation of a supervisory control of energy storage described in the following subsection.
Figure 4. Flowchart to the moving average filter based power smoothing method implementation.
Energies 16 05386 g004

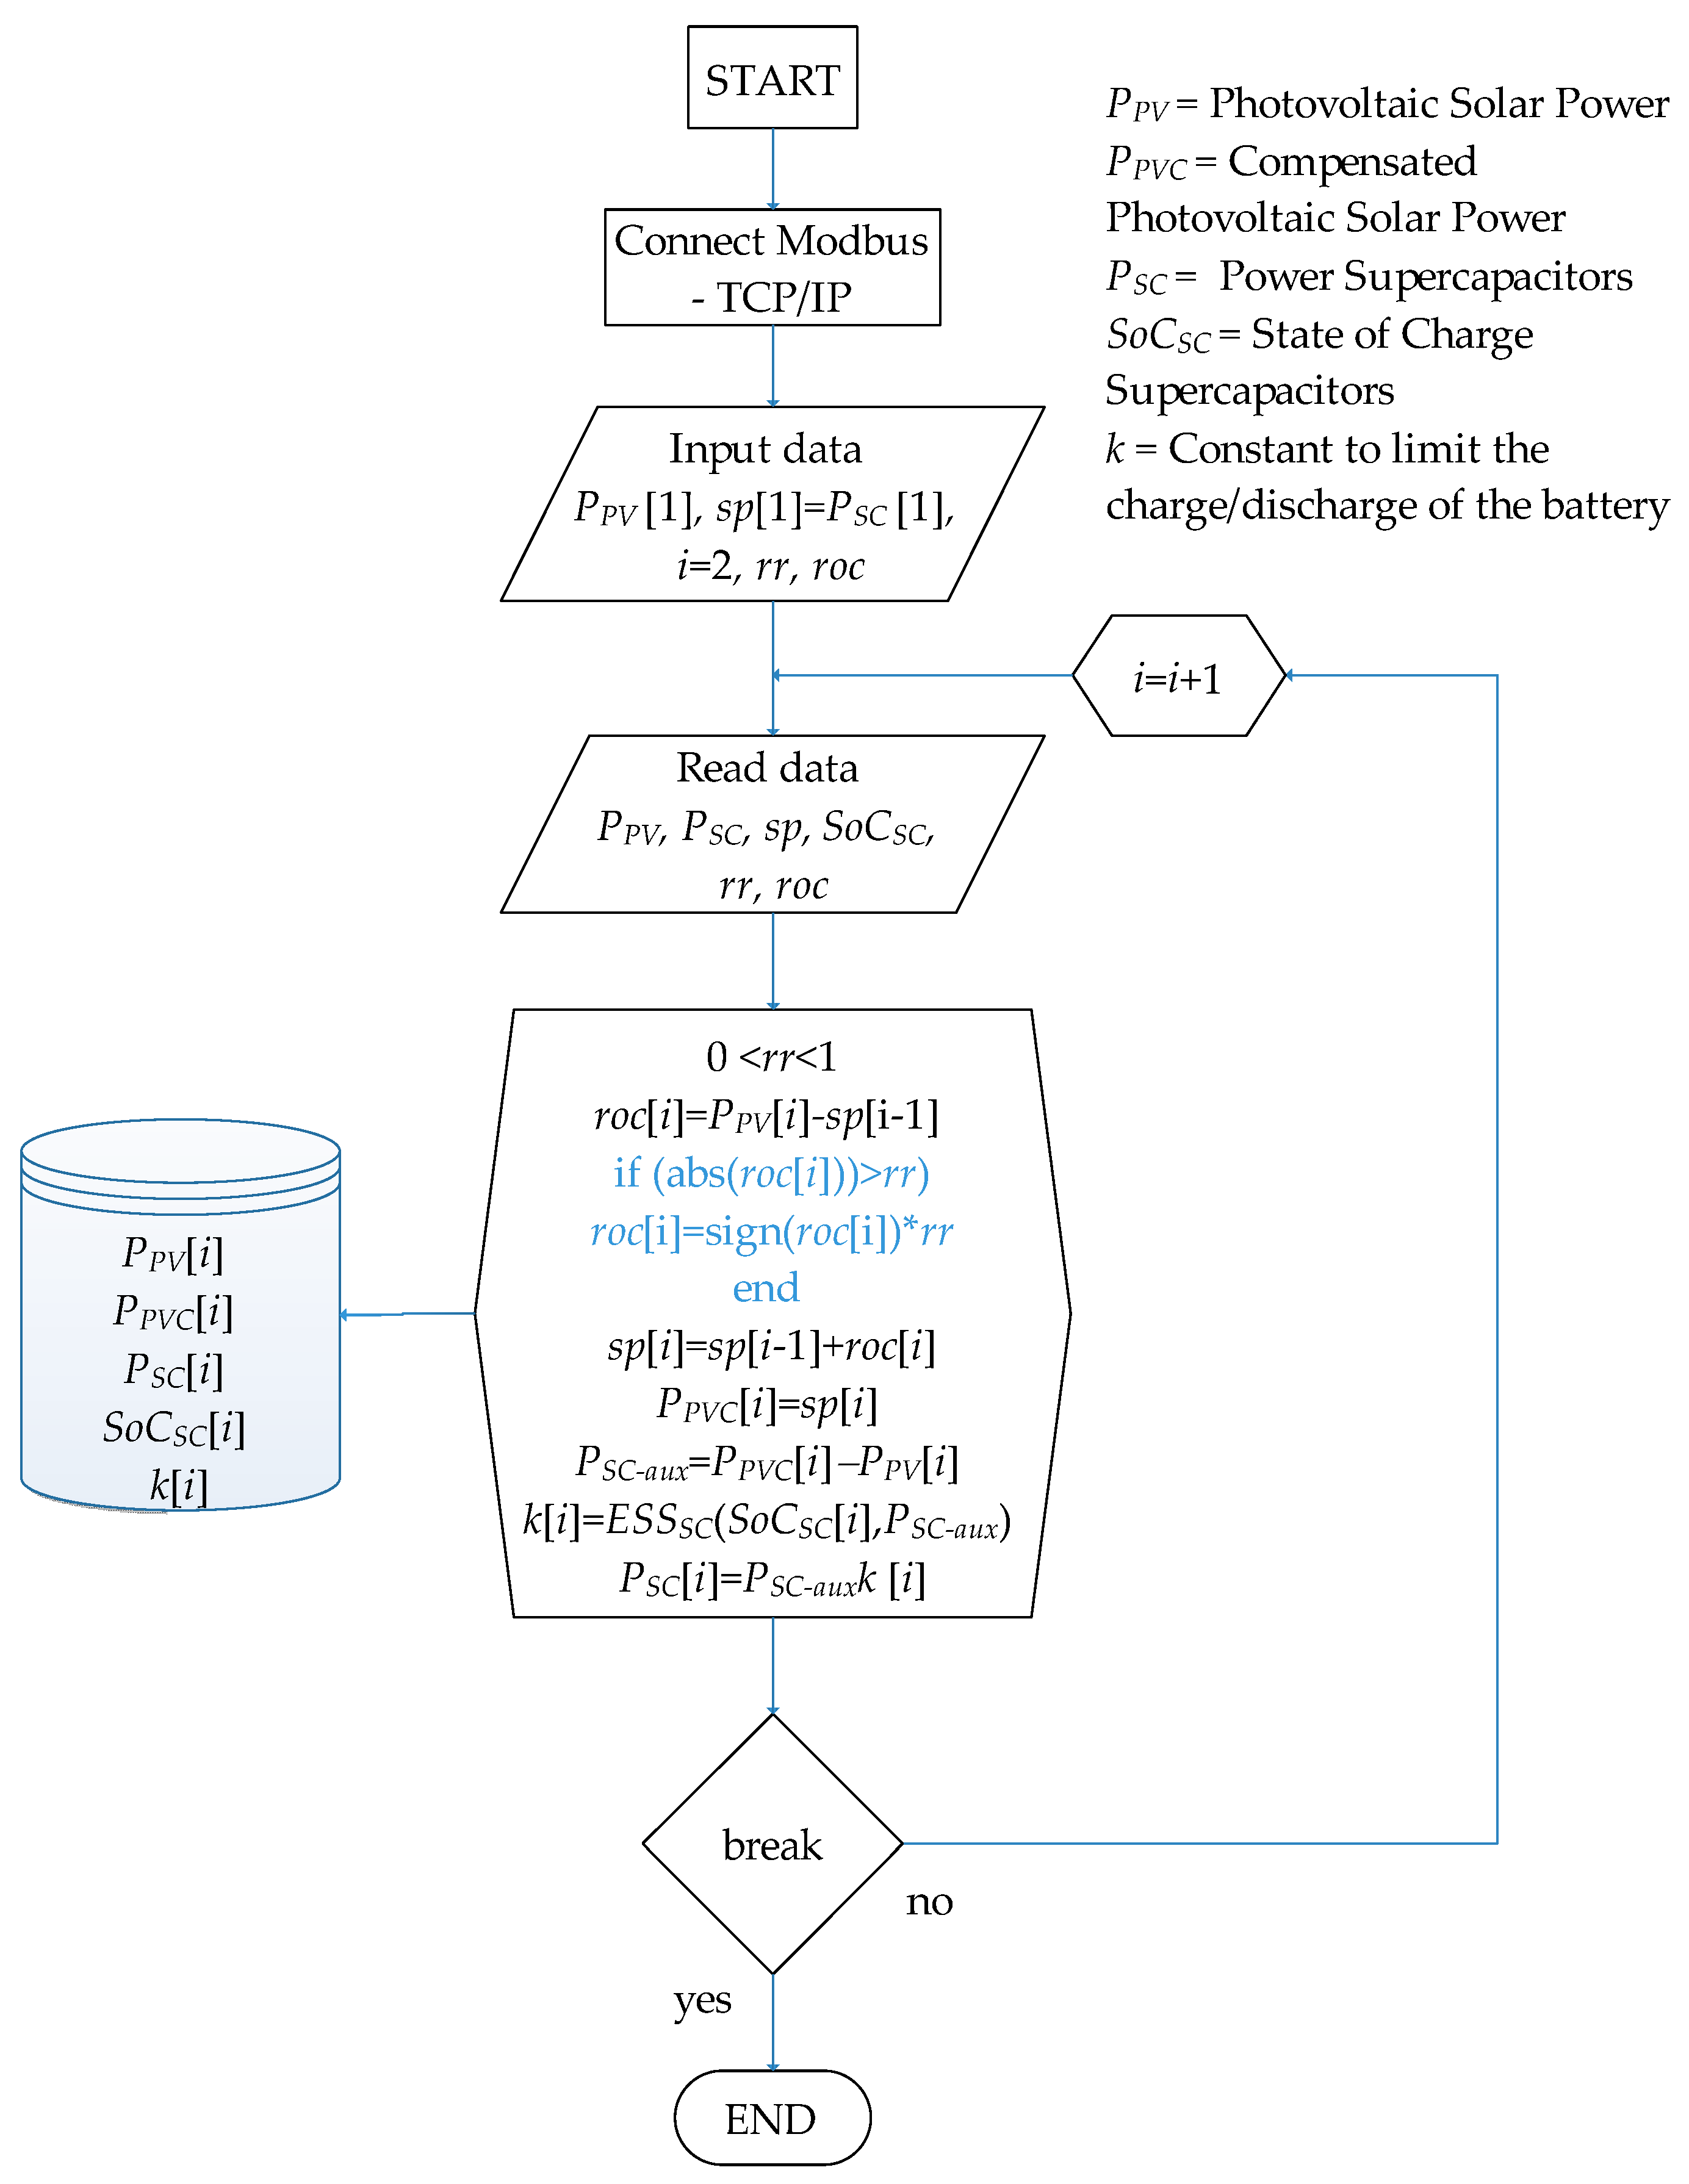
2.4. Design of Power Smoothing Algorithm Based on RR Method

The ramp rate method is used in power generation systems, such as PV or wind turbines, to reduce abrupt fluctuations and improve power output stability by applying a gradual and controlled rate of power change [18].
The main idea behind the RR method is to establish upper and lower limits for the allowed rate of power change [28] so that any changes in power are carried out gradually within that range. The rate of power change at time instant i is calculated as the difference between the current PV output power P P V i and the previous power value P P V i 1 , already smoothed, as expressed in Equation (9) [18].
R R i = d P P V d t i = P P V i P P V i 1 t i t i 1 = P P V i s p i t i t i 1
The control algorithm is performed at equal time intervals of Δ t seconds. In our study, Δ t = t i t i 1 = 0.1   s . Equation (10) calculates the rate of power change ( r o c ) by subtracting the previous smoothed power from the current power value. This variation activates or deactivates the conditional of the algorithm if it falls within the assigned variable limit, and it is adjusted accordingly.
r o c i = P P V i P P V i 1
Next, the values are adjusted as, P P V C i = P P V i 1 + r o c i o P P V C i = P P V i 1 r o c i .
Figure 5 illustrates the flowchart used for this method. In this case, P P V represents the PV input power, and P P V C is the smoothed output power of the RR filter. After a specific number of iterations, the variable P P V is replaced by the smoothed power P P V C . The difference between the smoothed power and the input power corresponds to the power P S C delivered by SC-ESS to the grid. The specific process for implementing this method is shown in Figure 5 and is as follows:
-
First, the input variables ( P P V , P S C , sp, S o C S C ) are defined similarly to the previous case, and their auxiliary variables (roc,i) are assigned—the percentage value of the ramp rate (0 < rr <1) is also assigned.
-
The rate of power change (roc) is calculated as the difference between the current power P P V (i) and the previous power sp(i).
-
The initial rate of power change is stored in roc(i) before applying any limitations.
-
If the rate of power change exceeds the ramp limit (rr), it is adjusted by limiting it to the established limit while maintaining its original di-rection (positive or negative) using the sign function [28].
-
The smoothed power sp for the current sample is calculated by adding the limited rate of power change to the previous smoothed power. This ensures that the smoothed power changes gradually and stays within the ramp limits. A variable change is then made to store the com-pensated power ( P P V C (i) = sp(i)), followed by the calculation of P S C .
-
Finally, as in the previous case, the SoC of the SC-ESS is ensured to be maintained at safe levels though the implementation of an energy storage supervision control.
Figure 5. Flowchart to the RR-filter-based power smoothing method implementation.
Energies 16 05386 g005

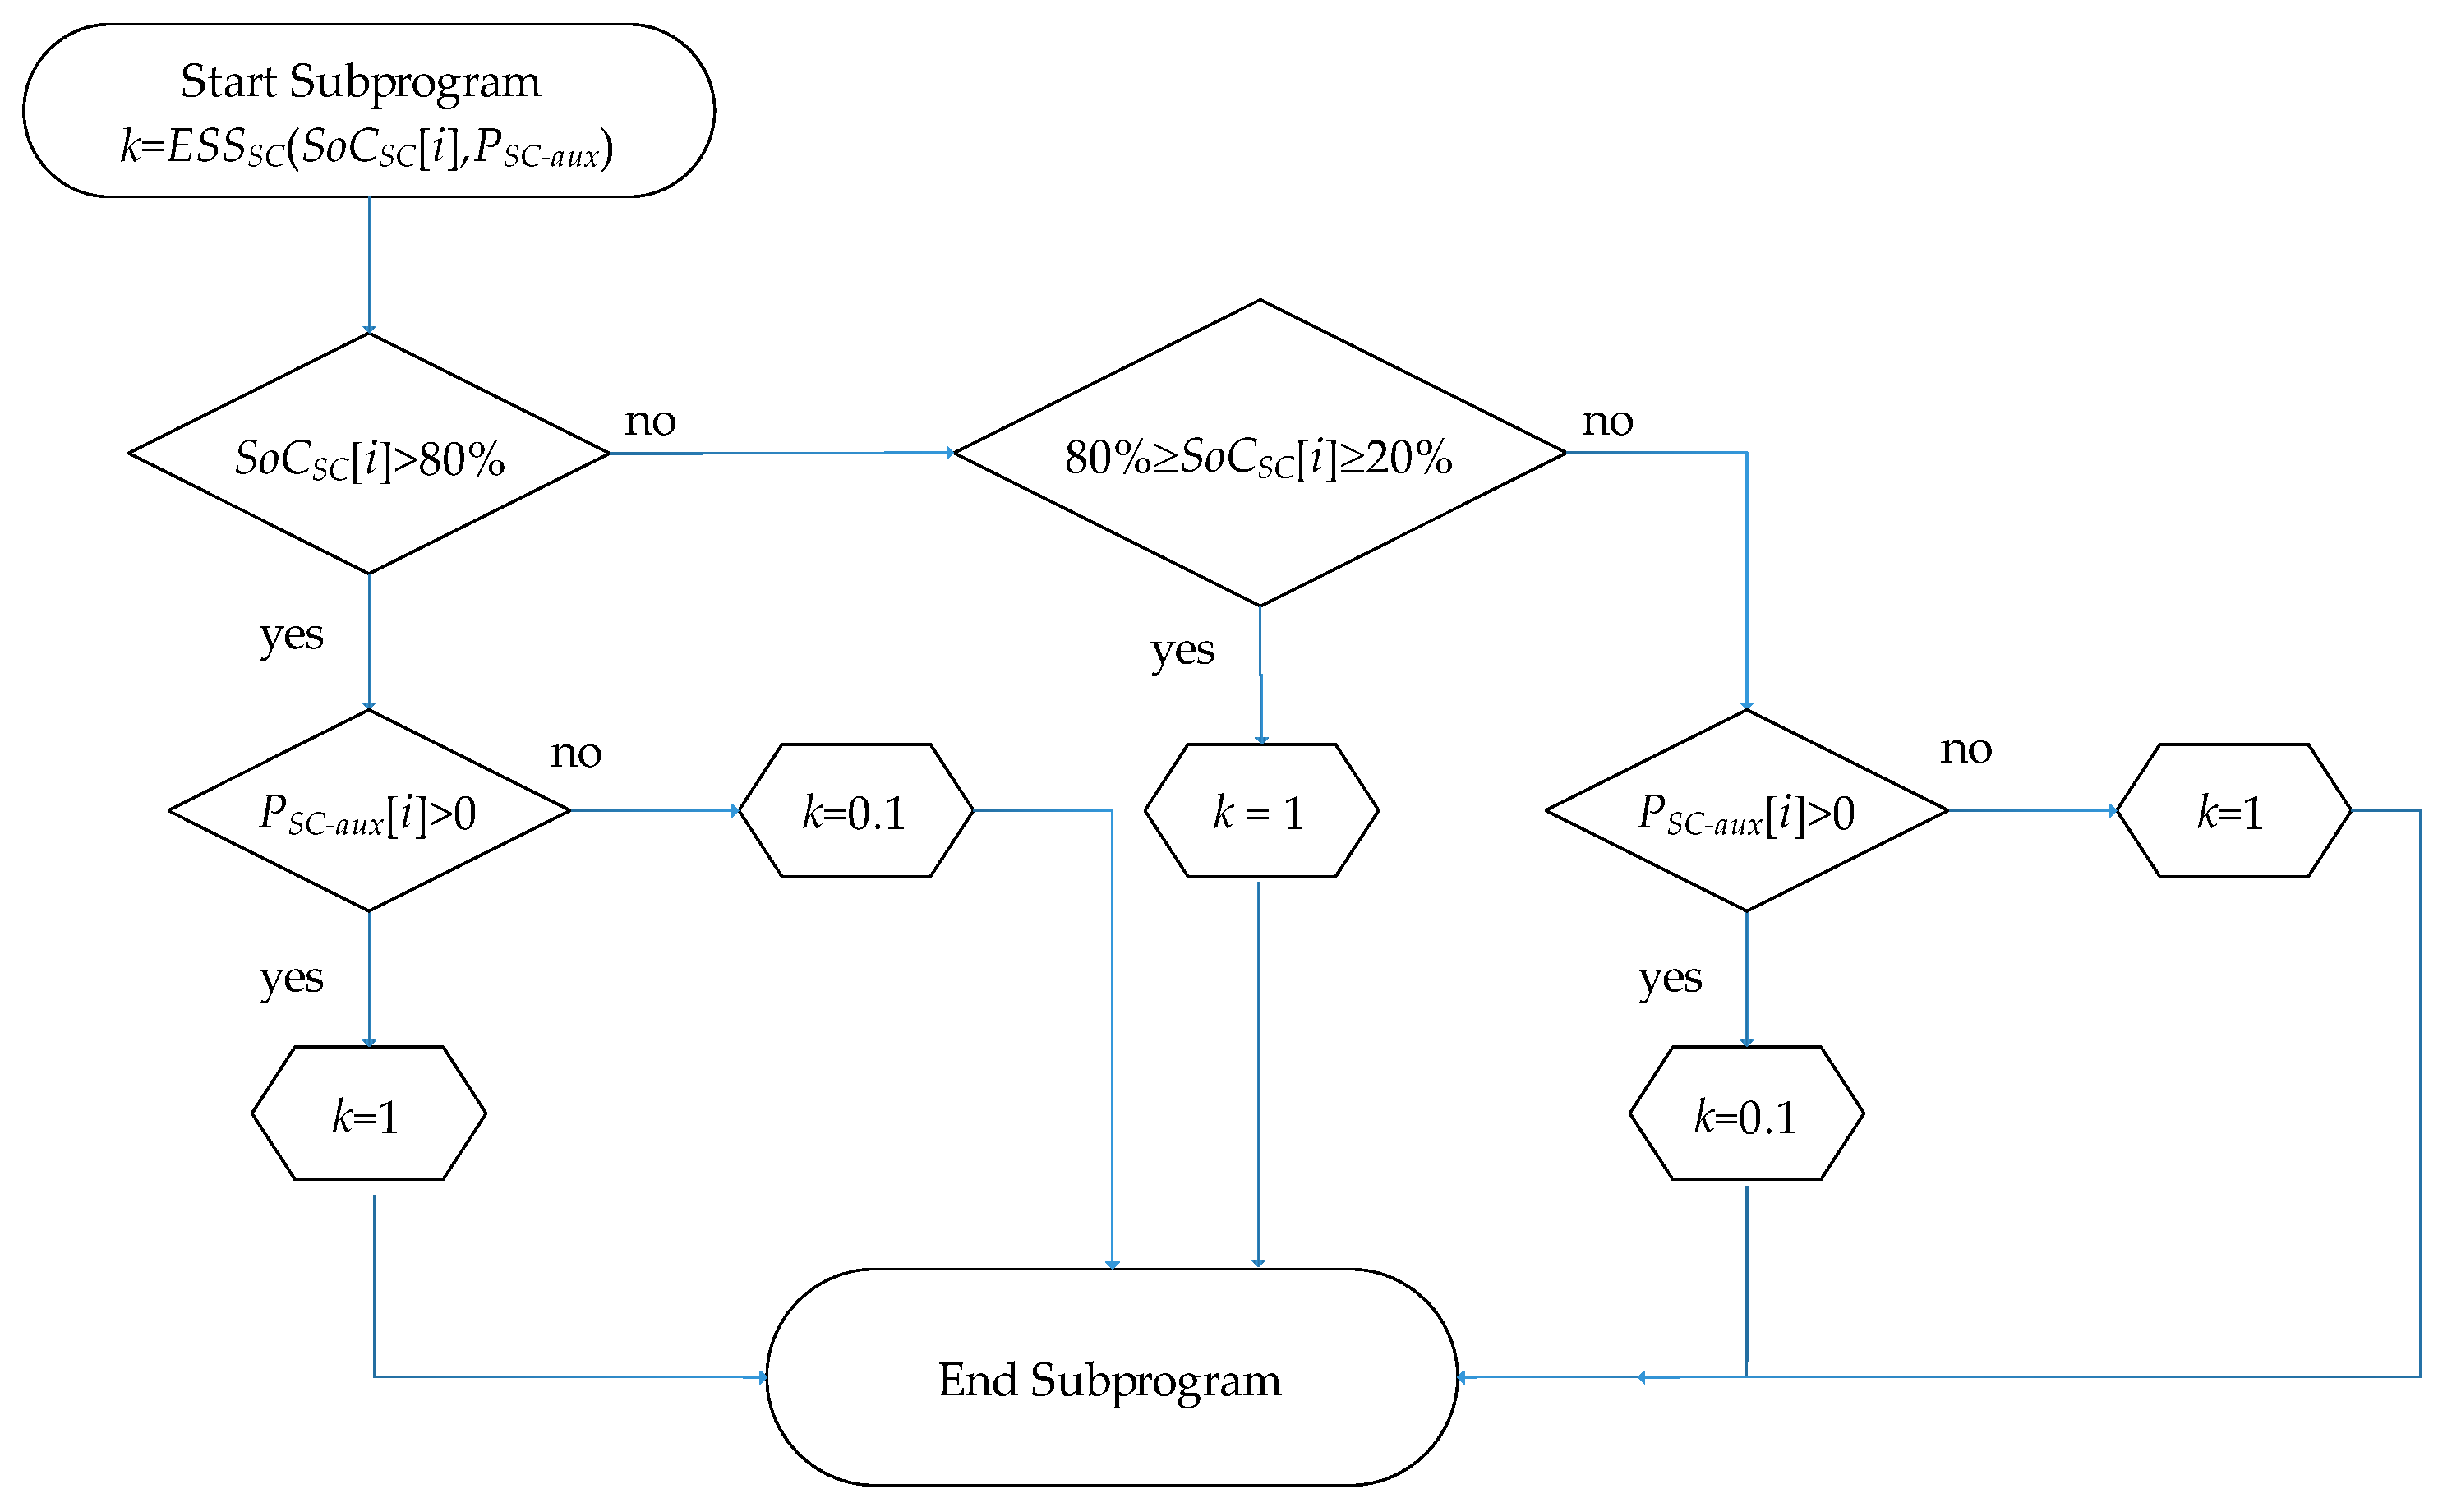
2.5. Supervisory Control of SC-ESS

To consider the constraint values in the supervisory control, it is important to monitor the SoC of the SC-ESS, S o C S C , and regulate the charge and discharge process through an auxiliary variable (k) that can be inside the interval (0 < k < 1), which is multiplied by the power value P sc aux before sending it to the SC-ESS. The proposed control rules under charging state are shown in Table 1. The rules presented in this section are defined to improve the performance of the in LP and MA filters while preserving the integrity of the SC-ESS by forcing it to operate within the safe limits of its SoC. The conditionals for supervision of the percentage of SOCSC are explained below:
-
When the SOCSC < 80%, the SC-ESS absorbs a power limited by the constant (k = 0.1); however, the SC-ESS is able to deliver its maximum power capacity if k = 1.
-
If 20% < SOCSC < 80%, the SC-ESS operates normally, delivering or absorbing the full power with k = 1.
-
If the percentage of charge of the SC falls below 20%, the storage system is considered to be in a low range, and priority is given to its charging to maintain its operation. For power values of the SC ( P s c aux ) greater than zero, a minimum value is assigned to the constant “k” in order to minimize the discharge of the SC (k = 0.1). For power values lower than zero ( P s c aux ), a maximum value of the constant “k” equal to 1 is assigned to ensure its charging and achieve normal operating values (see Figure 6). These conditions within the algorithms ensure that the SC remains within its safe operating range, thereby preserving its SoC and extending its lifespan.
Table 1. Rules for output power control and S o C S C in power smoothing.
Condition S o C S C P S C a u x k
S o C S C > 80   and   P s c a u x > 0 > 80 > 0 1
S o C S C > 80   and   P s c a u x 0 > 80 0 0.1
80 S o C S C 20 20 80 - 1
S o C S C < 20   and   P s c a u x > 0 < 20 > 0 0.1
S C S O C < 20   and   P s c a u x 0 < 20 0 1

3. Case of Study

In this paper, algorithms developed in MATLAB were utilized to carry out tests on a real-time grid-connected microgrid. The microgrid consisted of polycrystalline solar panels with an installed capacity of 15 kWp (PV) and a 30 kW SC-ESS. The Micro-Grid laboratory for microgrids at the University of Cuenca (CCTI-B), Ecuador was used for this specific case study [29]. The equipment was configured to create a network. Figure 7 illustrates the presence of a main protection breaker (S1), a transformer connected to CCTI-B with a capacity of 150 kW, a secondary protection breaker (S2) specific to CCTI-B, a protection breaker for the PV array (S3), and a protection breaker for the SAE-SC (S4), along with its respective three-phase transformer (T2). It is important to note that the inverter operates at a different voltage (440 VAC) compared with the main grid (220 VAC). All of these components are connected to the public distribution grid network (B-01).

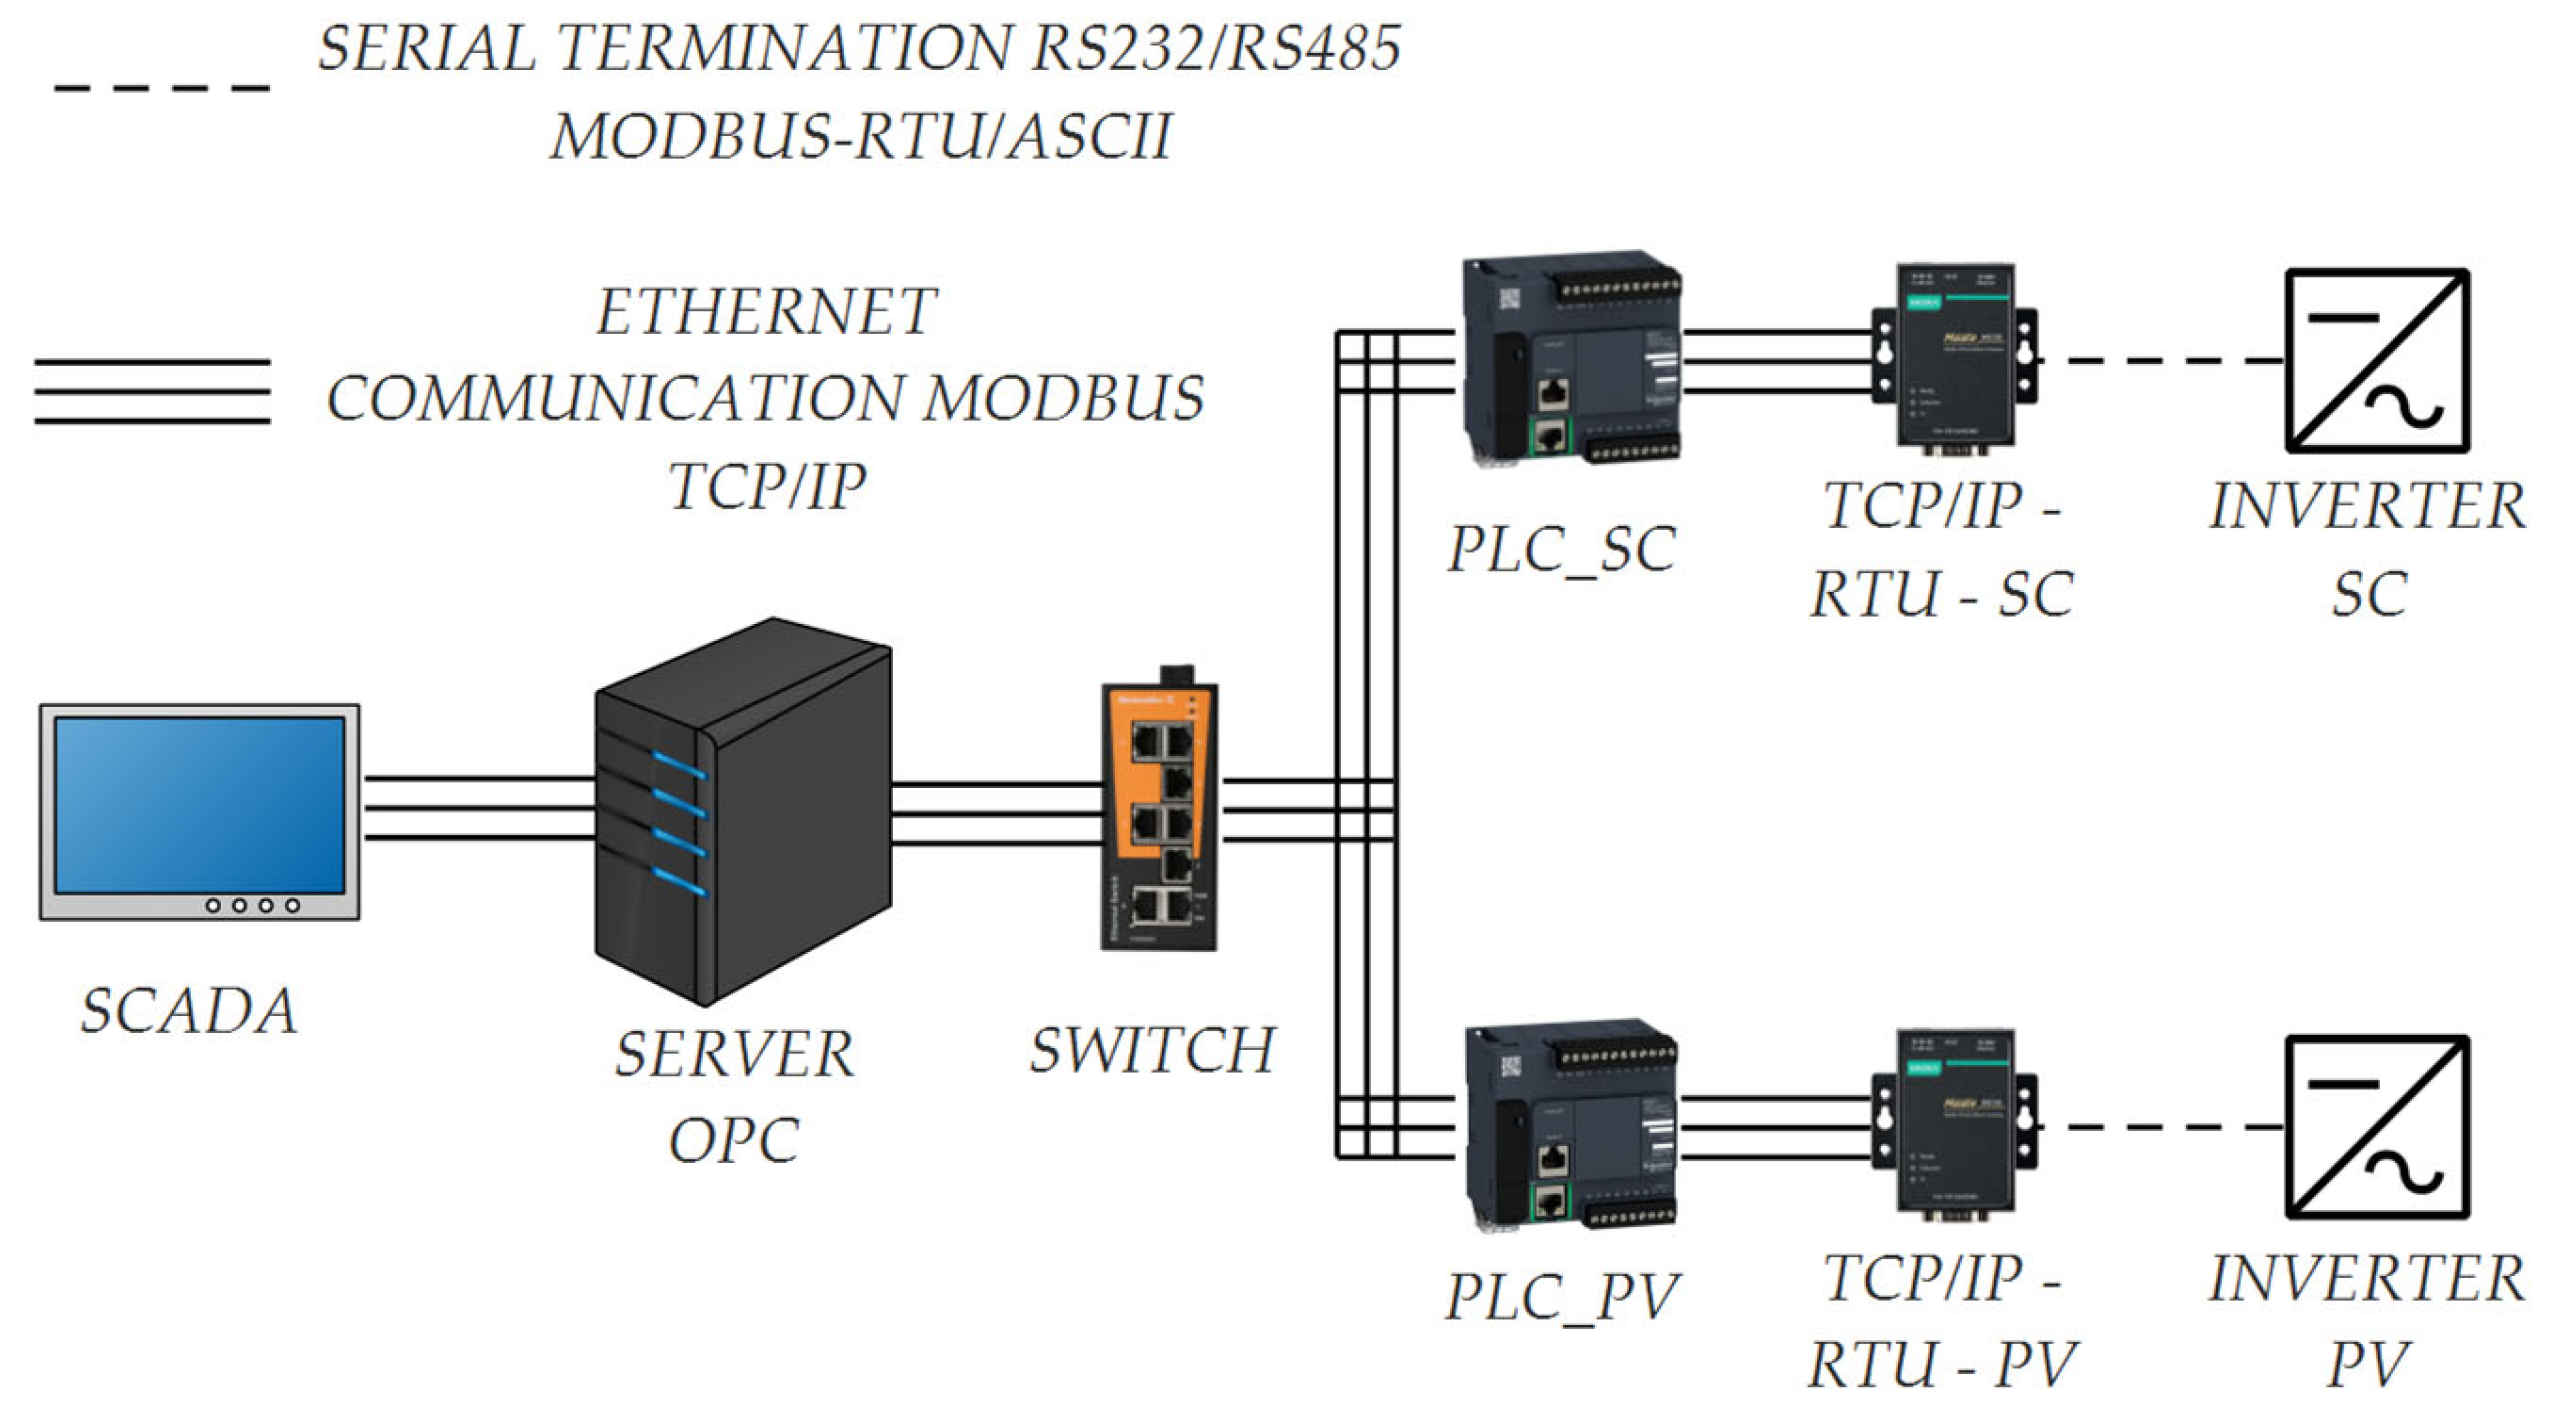
3.1. Implementation of the Power Smoothing System in the Experimental Platform (CCTI-B)

The system consists of PV and SC-ESS, designed to store excess energy generated by PV and compensate for variations in energy generation. This stored energy is utilized to mitigate fluctuations in energy generation. To achieve efficient and accurate communication among the equipment, a configuration and MATLAB code were designed for Ethernet Modbus TCP/IP connection and communication (see Figure 8). The control and monitoring of the system are carried out from the Micro-Grid Laboratory at CCTI-B, utilizing a SCADA system with an interface developed in LabVIEW [26].

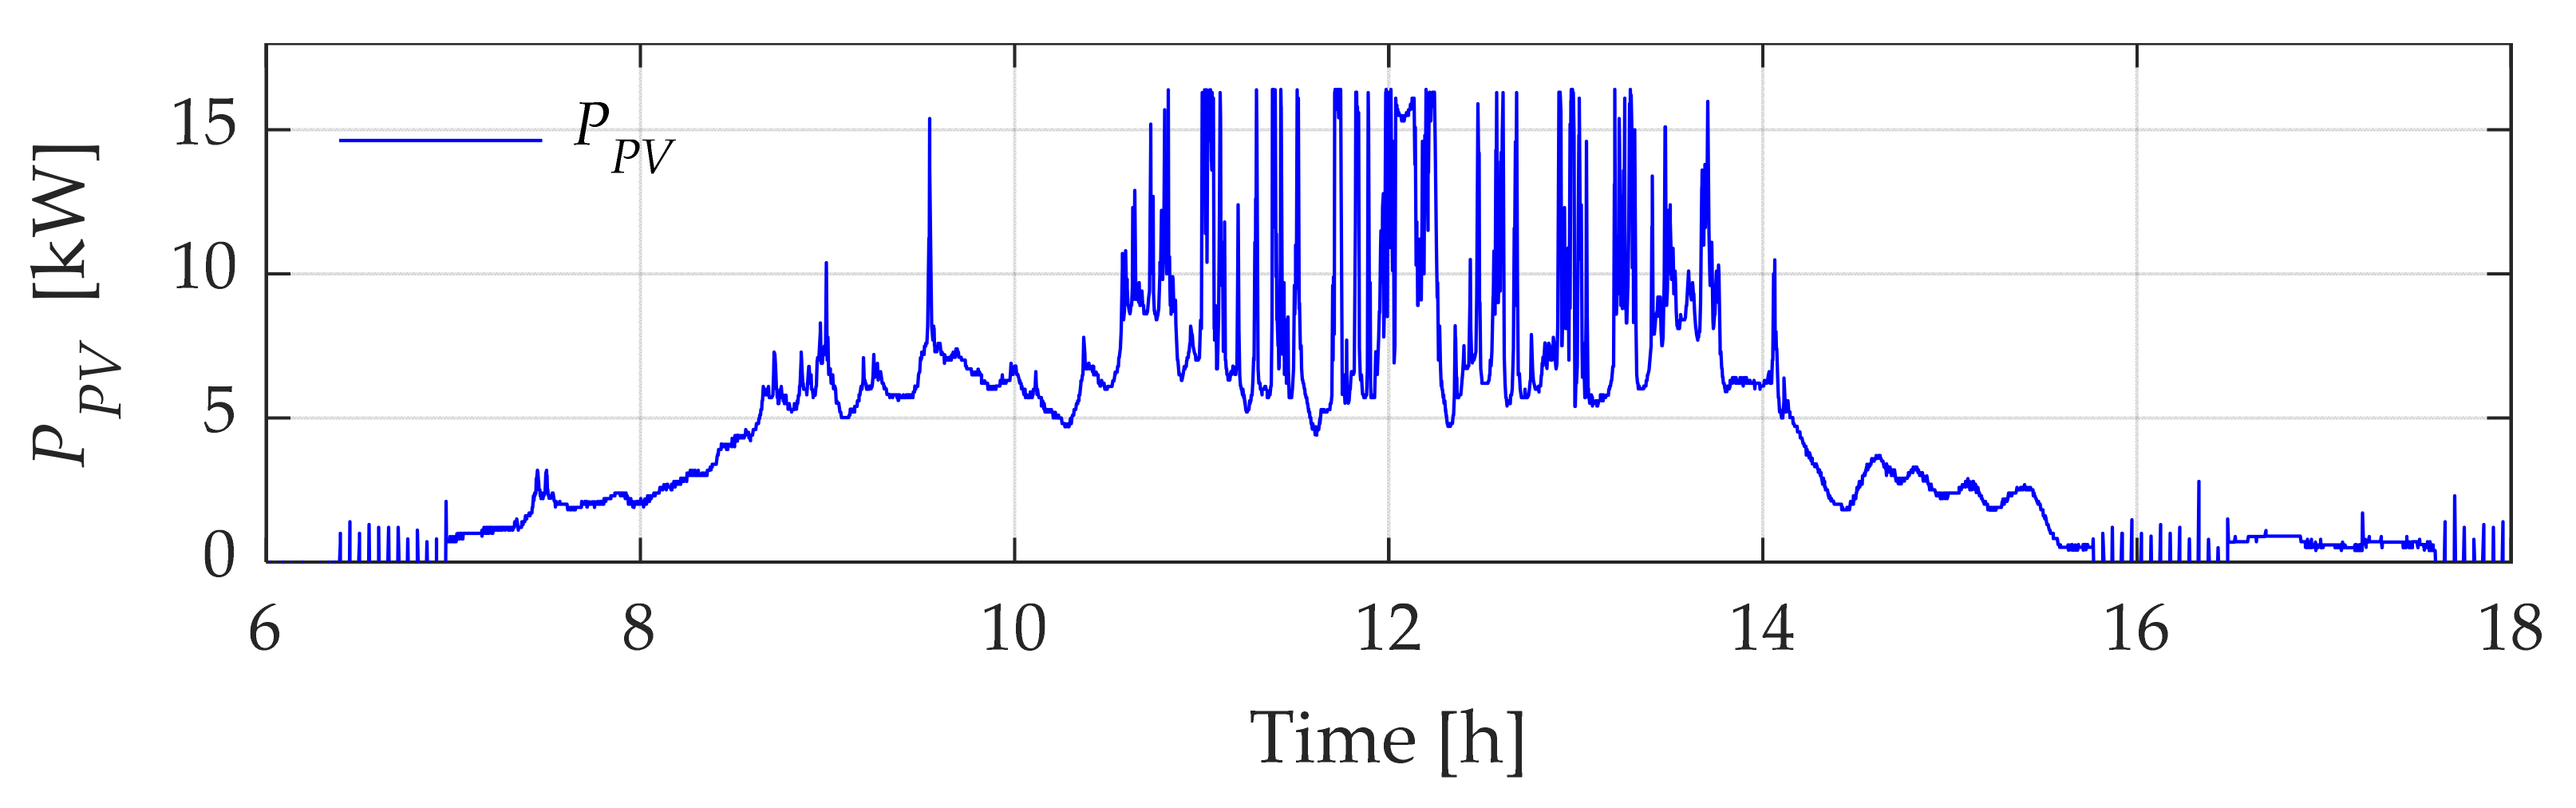
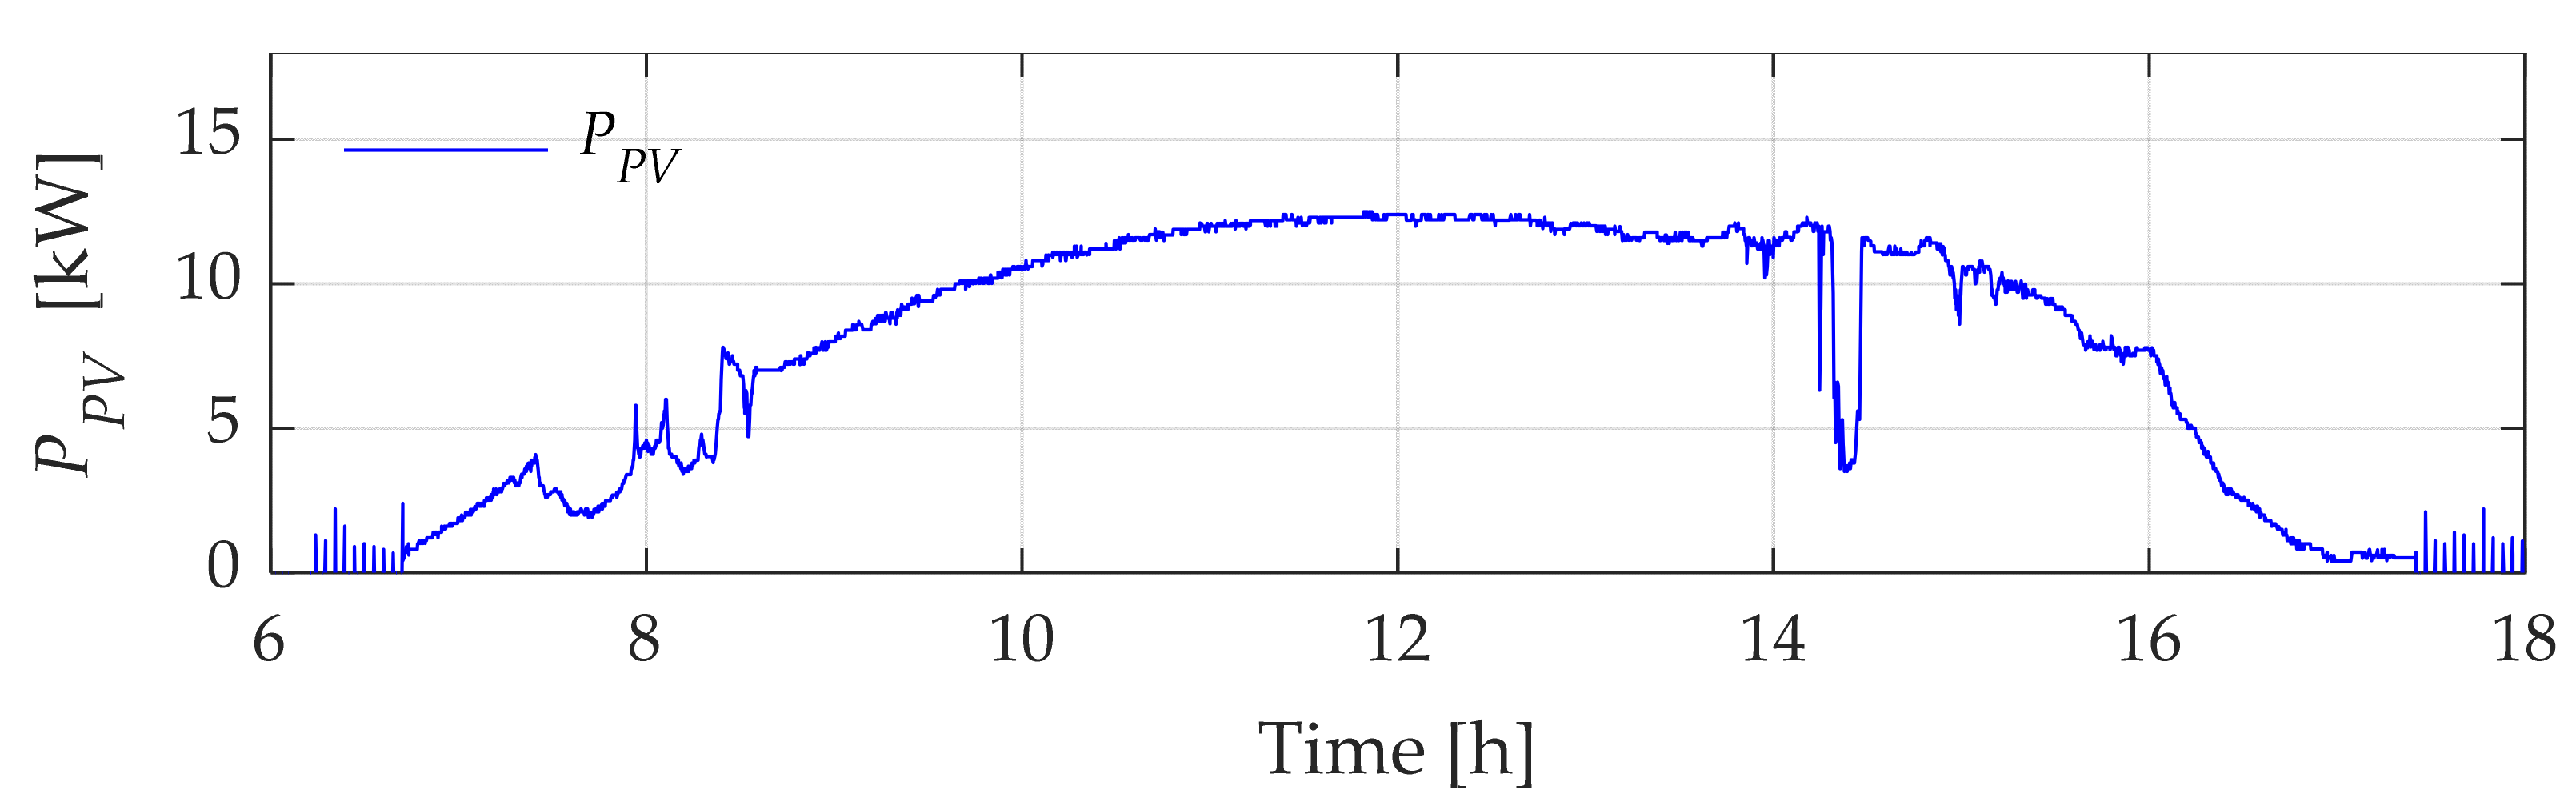
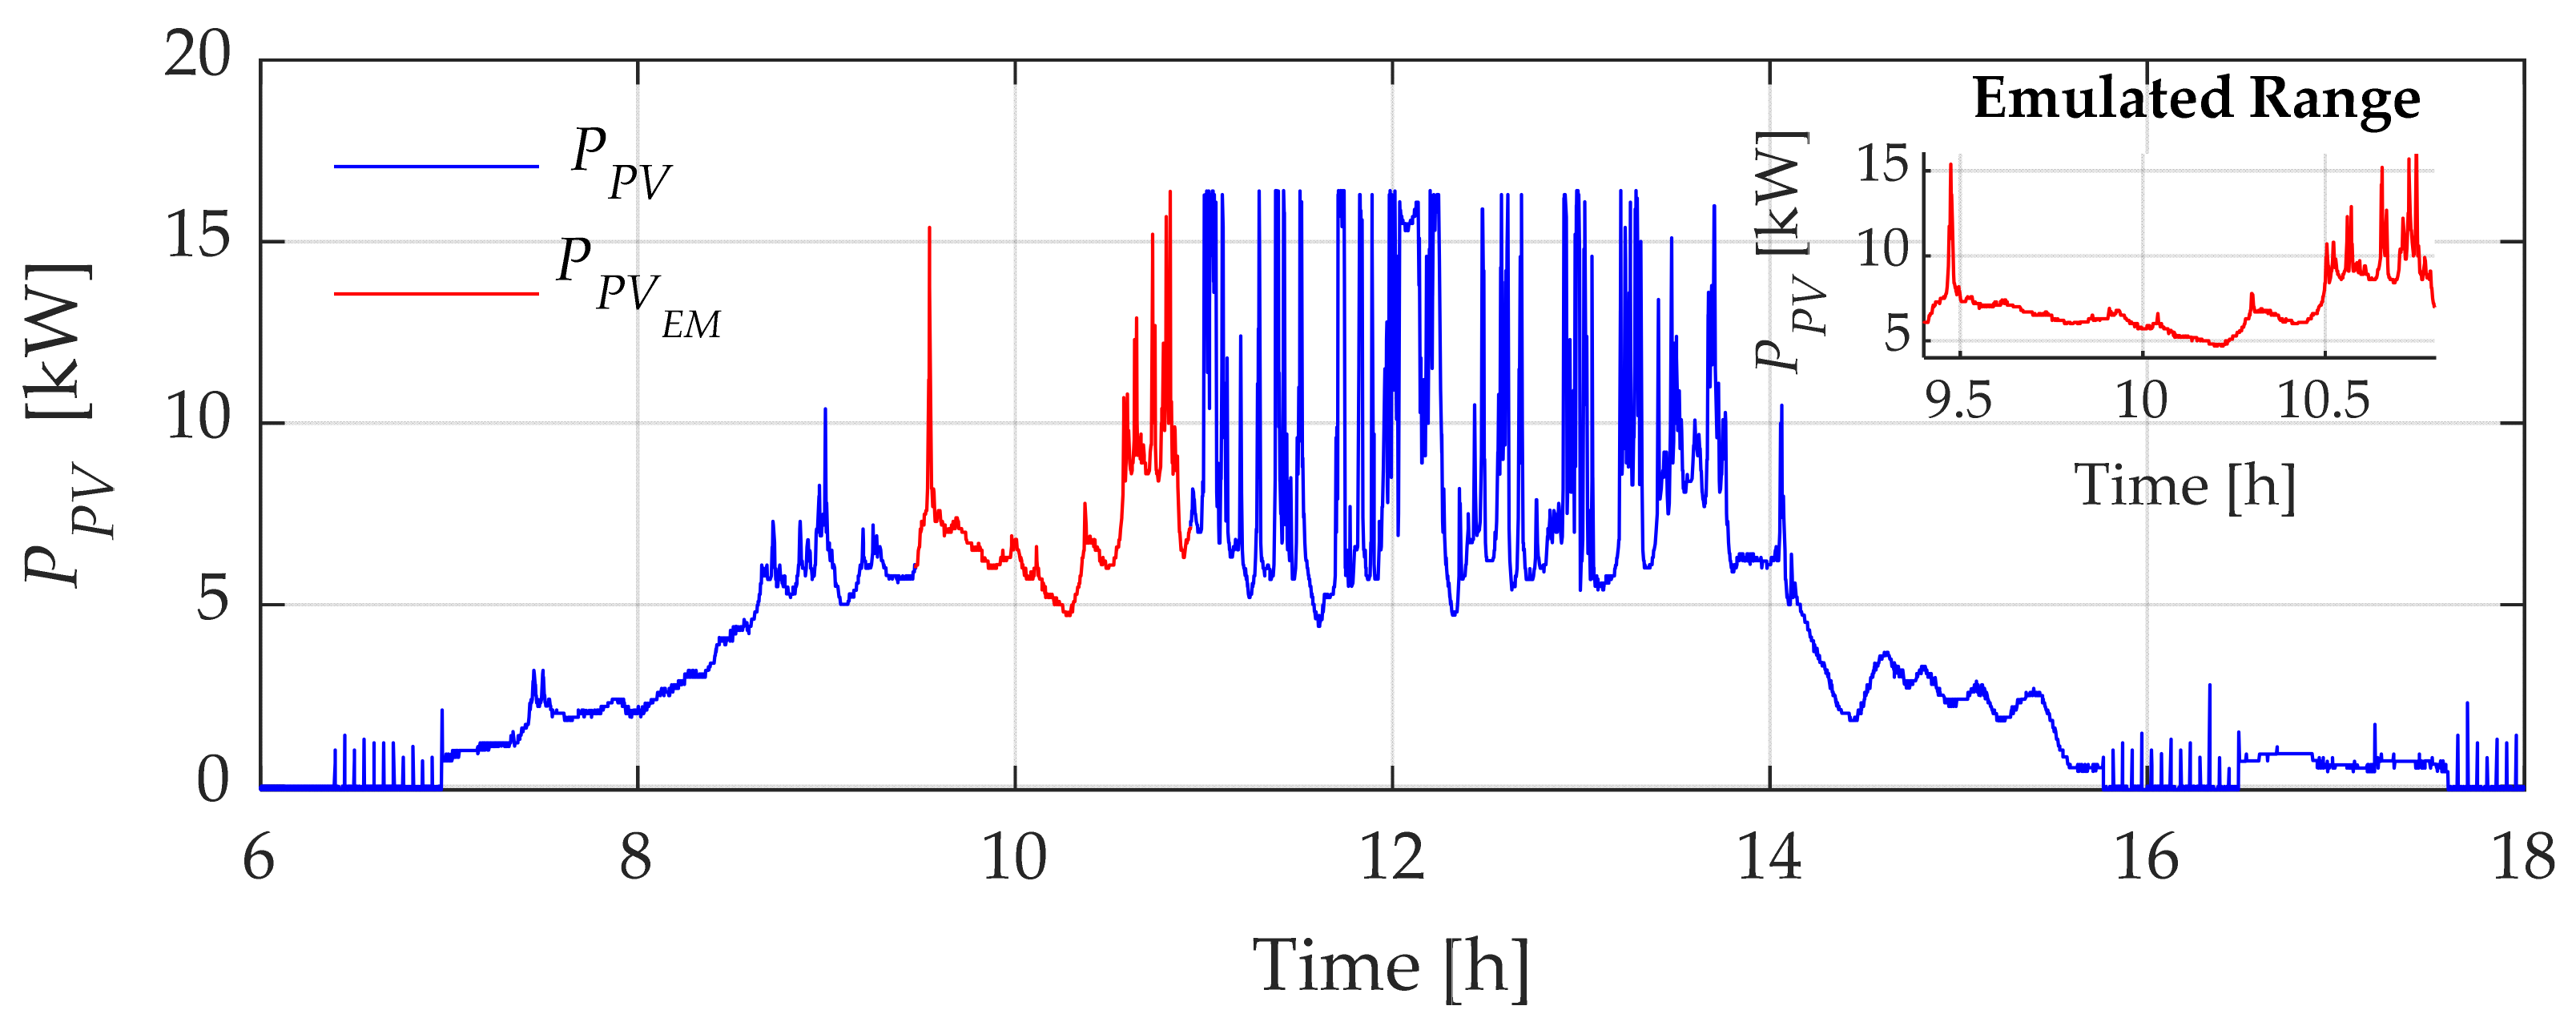
3.2. Types of Daily PV Power Curves

It is important to consider that variability in daily PV production can significantly impact the operation and performance of both grid-connected and off-grid PV systems, as well as the design and sizing requirements of energy storage or energy management systems. Depending on the specific conditions and requirements of each project or application, analyzing and understanding the daily solar production curve with high and low fluctuations is of great importance in the planning, operation, and optimization of solar energy equipment. For this specific case, two types of randomly generated PV power curves have been considered throughout the year. Depending on the climatic conditions, geographic location, and characteristics of the PV system, the PV generation curve can vary significantly from one day to another. Figure 9 and Figure 10 depict two potential daily PV power curves with high and low variability, respectively. These two profiles are from actual records measured on the rooftop of the Micro-Grid laboratory building in the city of Cuenca, Ecuador (−2.891918819933002, −79.03857439068271 WGS84 coordinate system).
The daily PV power curve with high variability (Type I) shown in Figure 9 exhibits the daily PV behavior, which varies significantly throughout the day due to climatic factors such as solar radiation variability, the presence of clouds, or shadows from nearby obstacles. For instance, on cloudy days or during rapid changes in cloud coverage, the power output of the solar cells will abruptly change within a short period of time, resulting in substantial fluctuations in the daily electricity generation curve. This curve may display sharp peaks and drops in generation throughout the day, indicating the presence of power fluctuations.
On the other hand, the daily PV power curve with low variability (Type II) shown in Figure 10 indicates that the daily PV power production remains relatively constant throughout the day with minimal changes due to climatic factors. This can occur under conditions of continuously high solar radiation, clear skies, or no shadows or obstructions in the solar system. This curve can provide a more stable and uniform PV electricity production throughout the day with smooth and gradual changes in electricity generation.
For laboratory testing and verification of the proposed methods’ efficiency, approximately 1.5 h of the Type I curve (see Figure 9) were emulated (See profile highlighted in red in Figure 11). This specific segment of the Type I curve was chosen for emulation due to its behavior, which includes an initial power peak, followed by a decrease and then a plateau with high variability. This selection enables a more appropriate evaluation of the proposed methods. In Figure 11, the emulated curve is depicted in red, aiming to test the three methods in real time under the same PV solar power conditions, thereby enabling a better assessment of the SC-ESS behavior. It should be noted that an energy storage system based on lithium-ion batteries (Li-Ion BESS), available in the laboratory and connected to the B-01 busbar of the microgrid (Figure 7), is used for the PV-delivered power emulation.

4. Result and Discussions

In this study, the use and effectiveness of three methods for power smoothing were evaluated: LP, MA, and RR filters, considering in each case employing three conditions based on the S o C S C percentage initial state of charge of the SC-ESS:
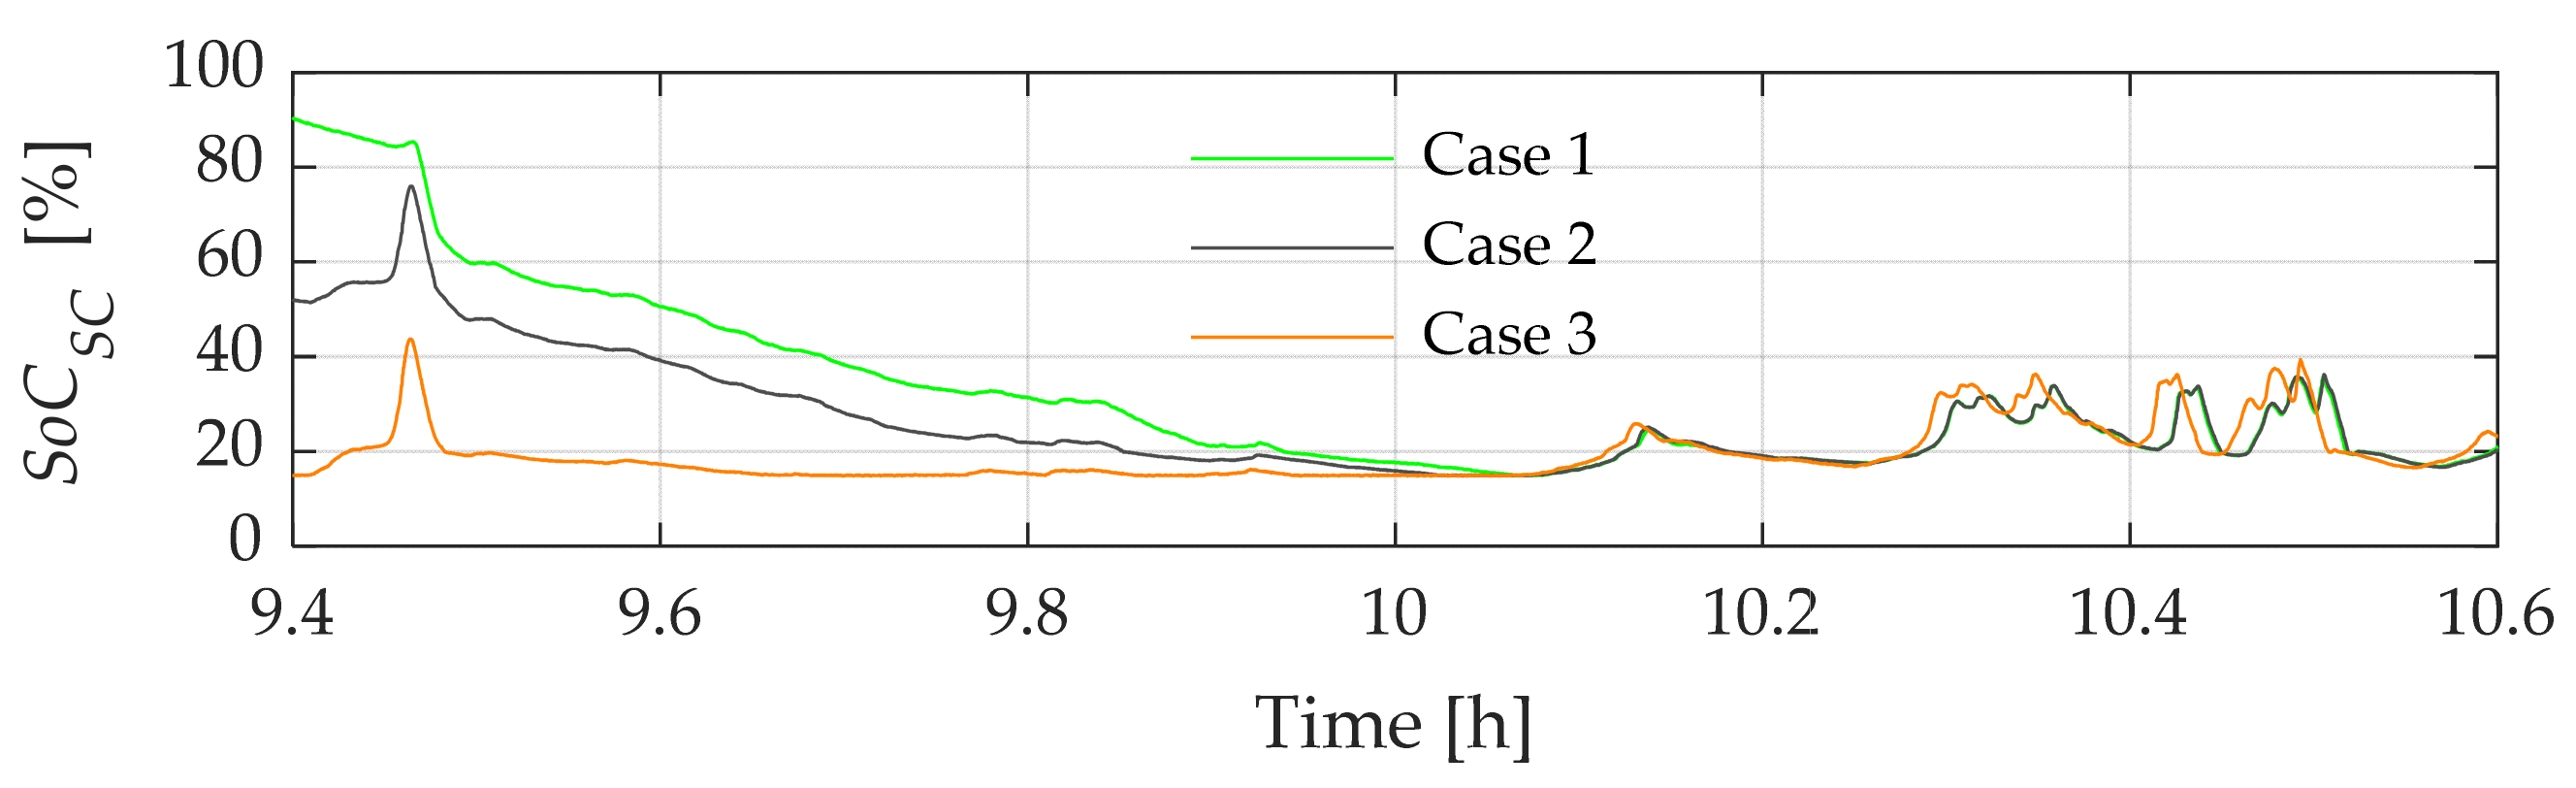
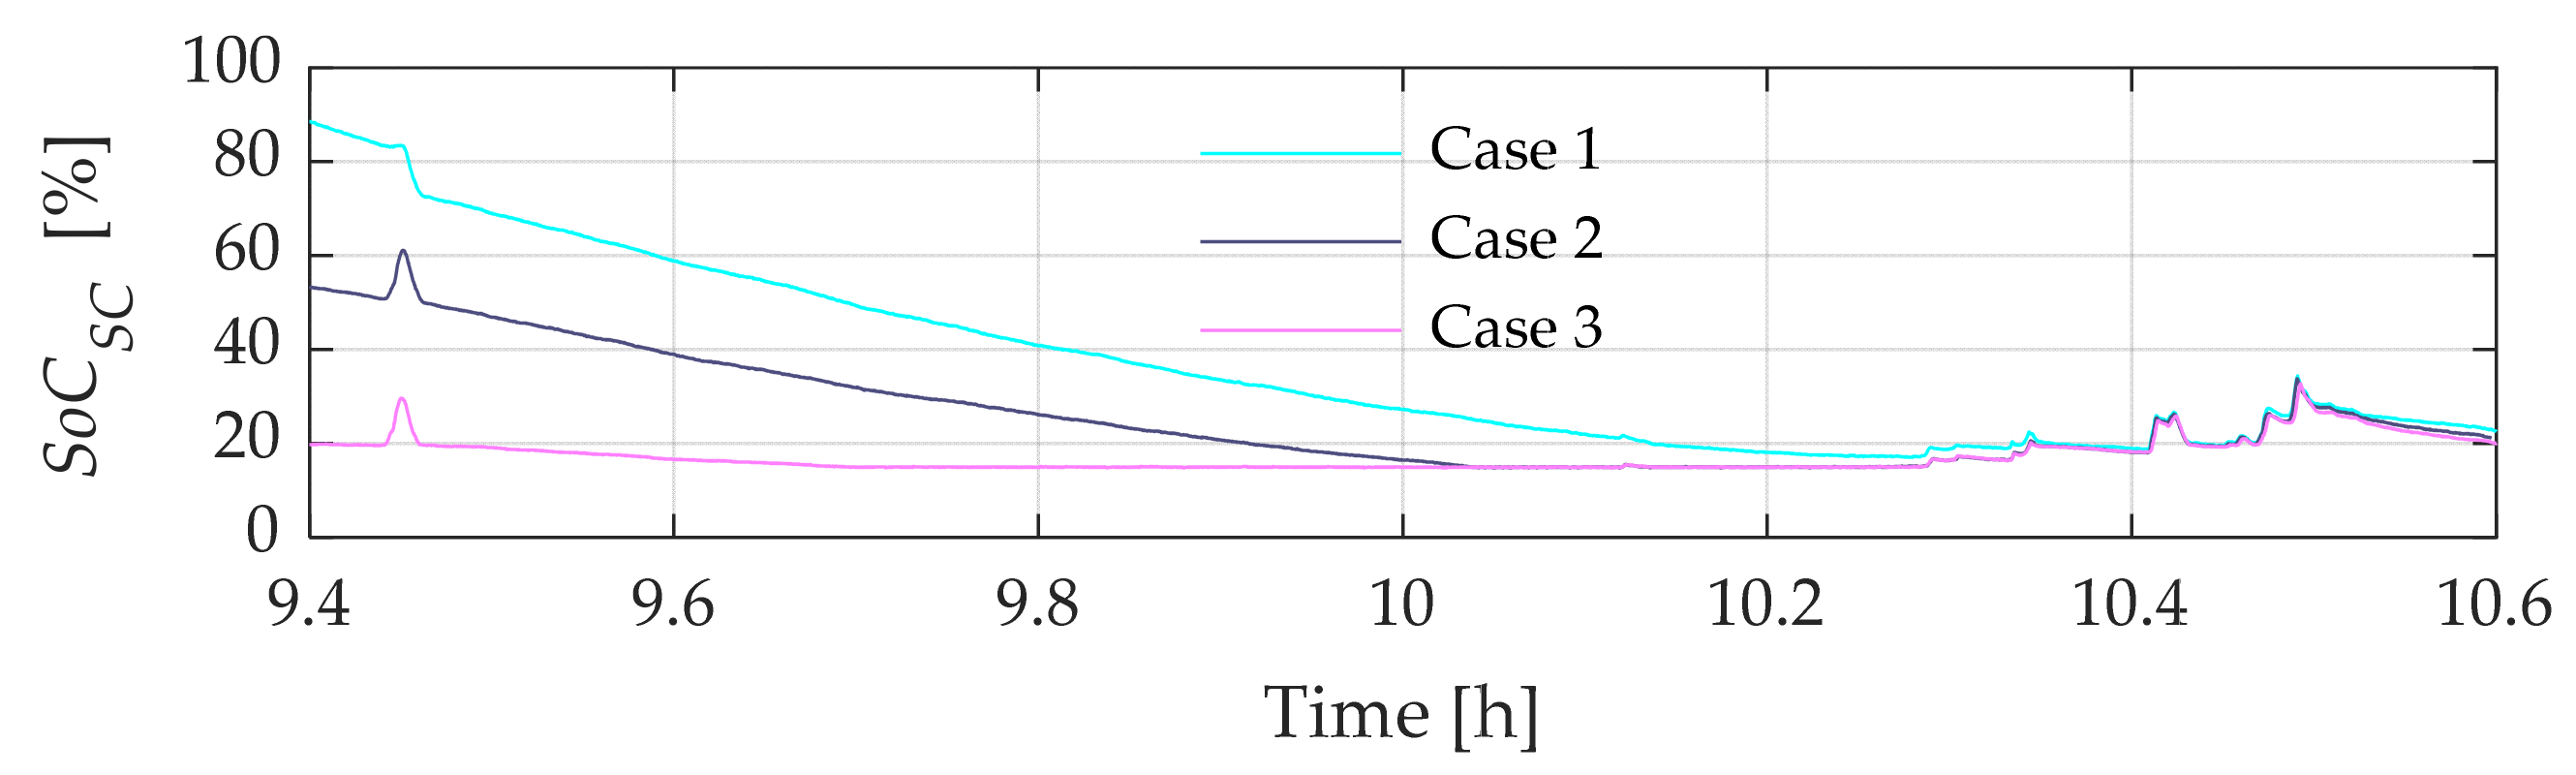
  • Case 1: SC-ESS at the maximum SoC (overcharged condition)
    Under these circumstances, it is mandated that the SC-ESS be charged to a level exceeding 80% of its SoC prior to performing the power smoothing tasks.
  • Case 2: SC-ESS in a medium SoC
    In this scenario, a requirement is established for the SoC of the SC-ESS to be maintained within the range of 20% to 80% as an initial condition.
  • Case 3: SC-ESS at the minimum SoC (undercharged condition)
    Lastly, for this specific undercharged state, the SC-ESS starts its compensation work with a value below 20% of its maximum storage capacity.

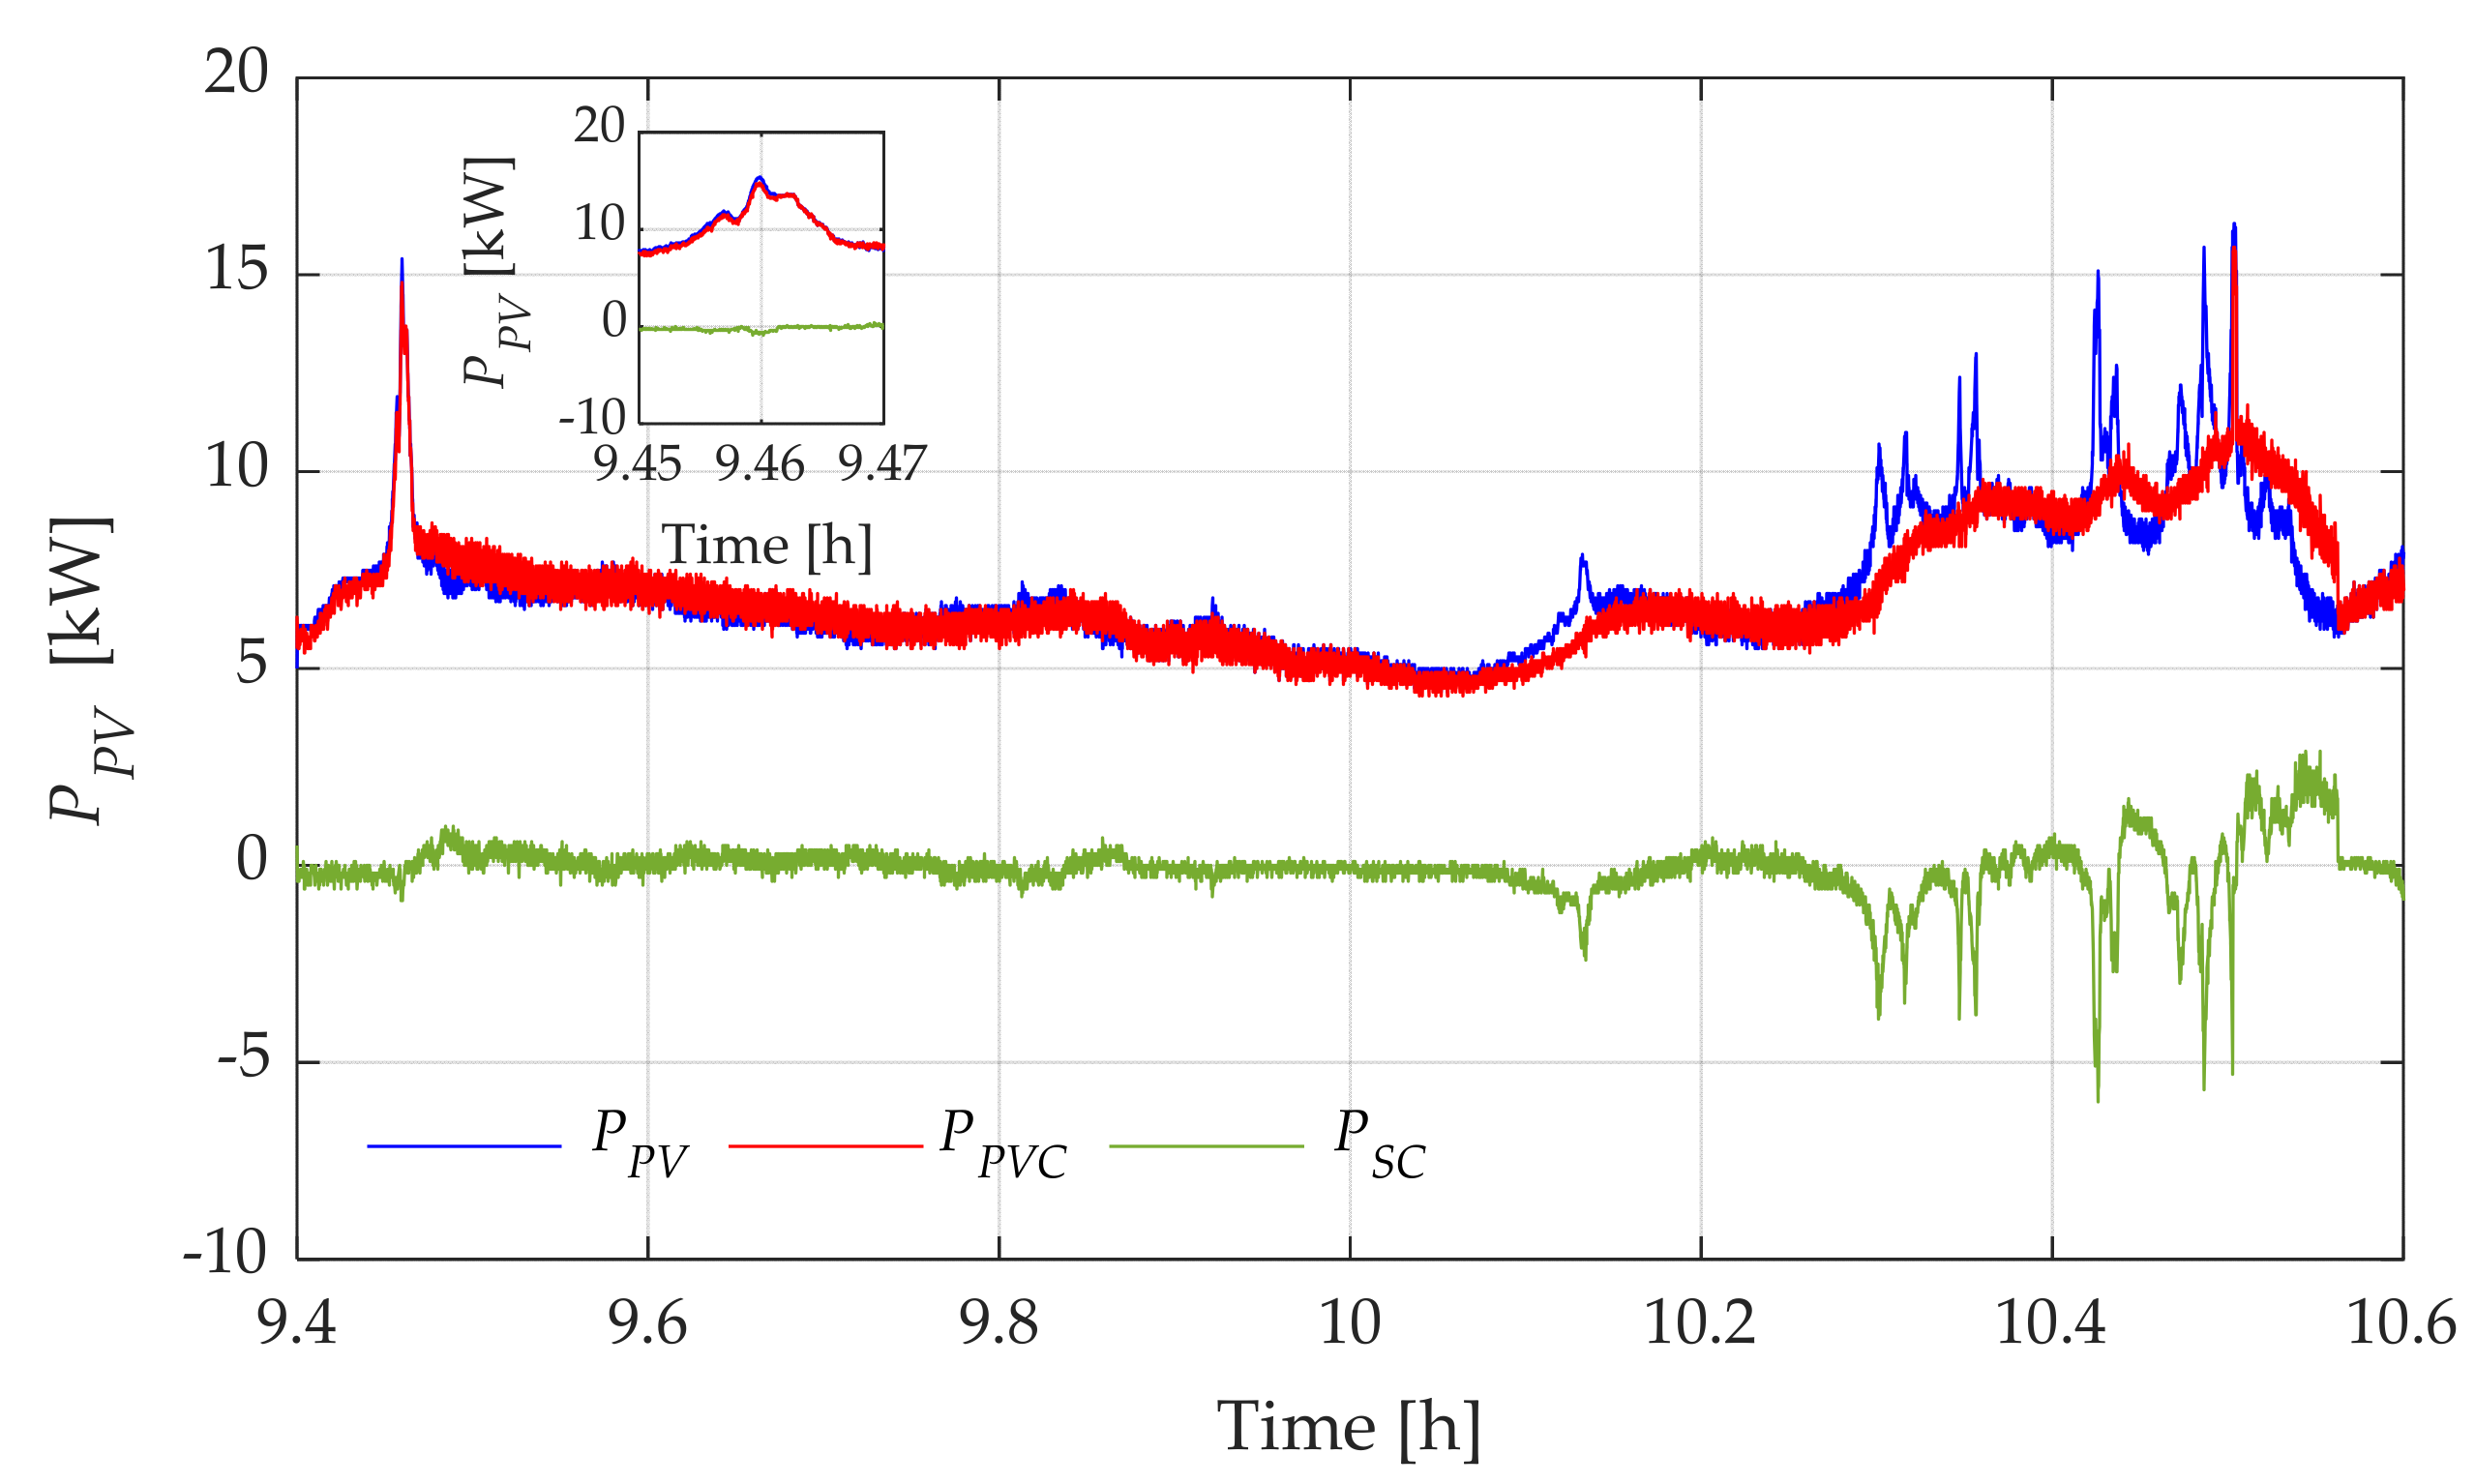
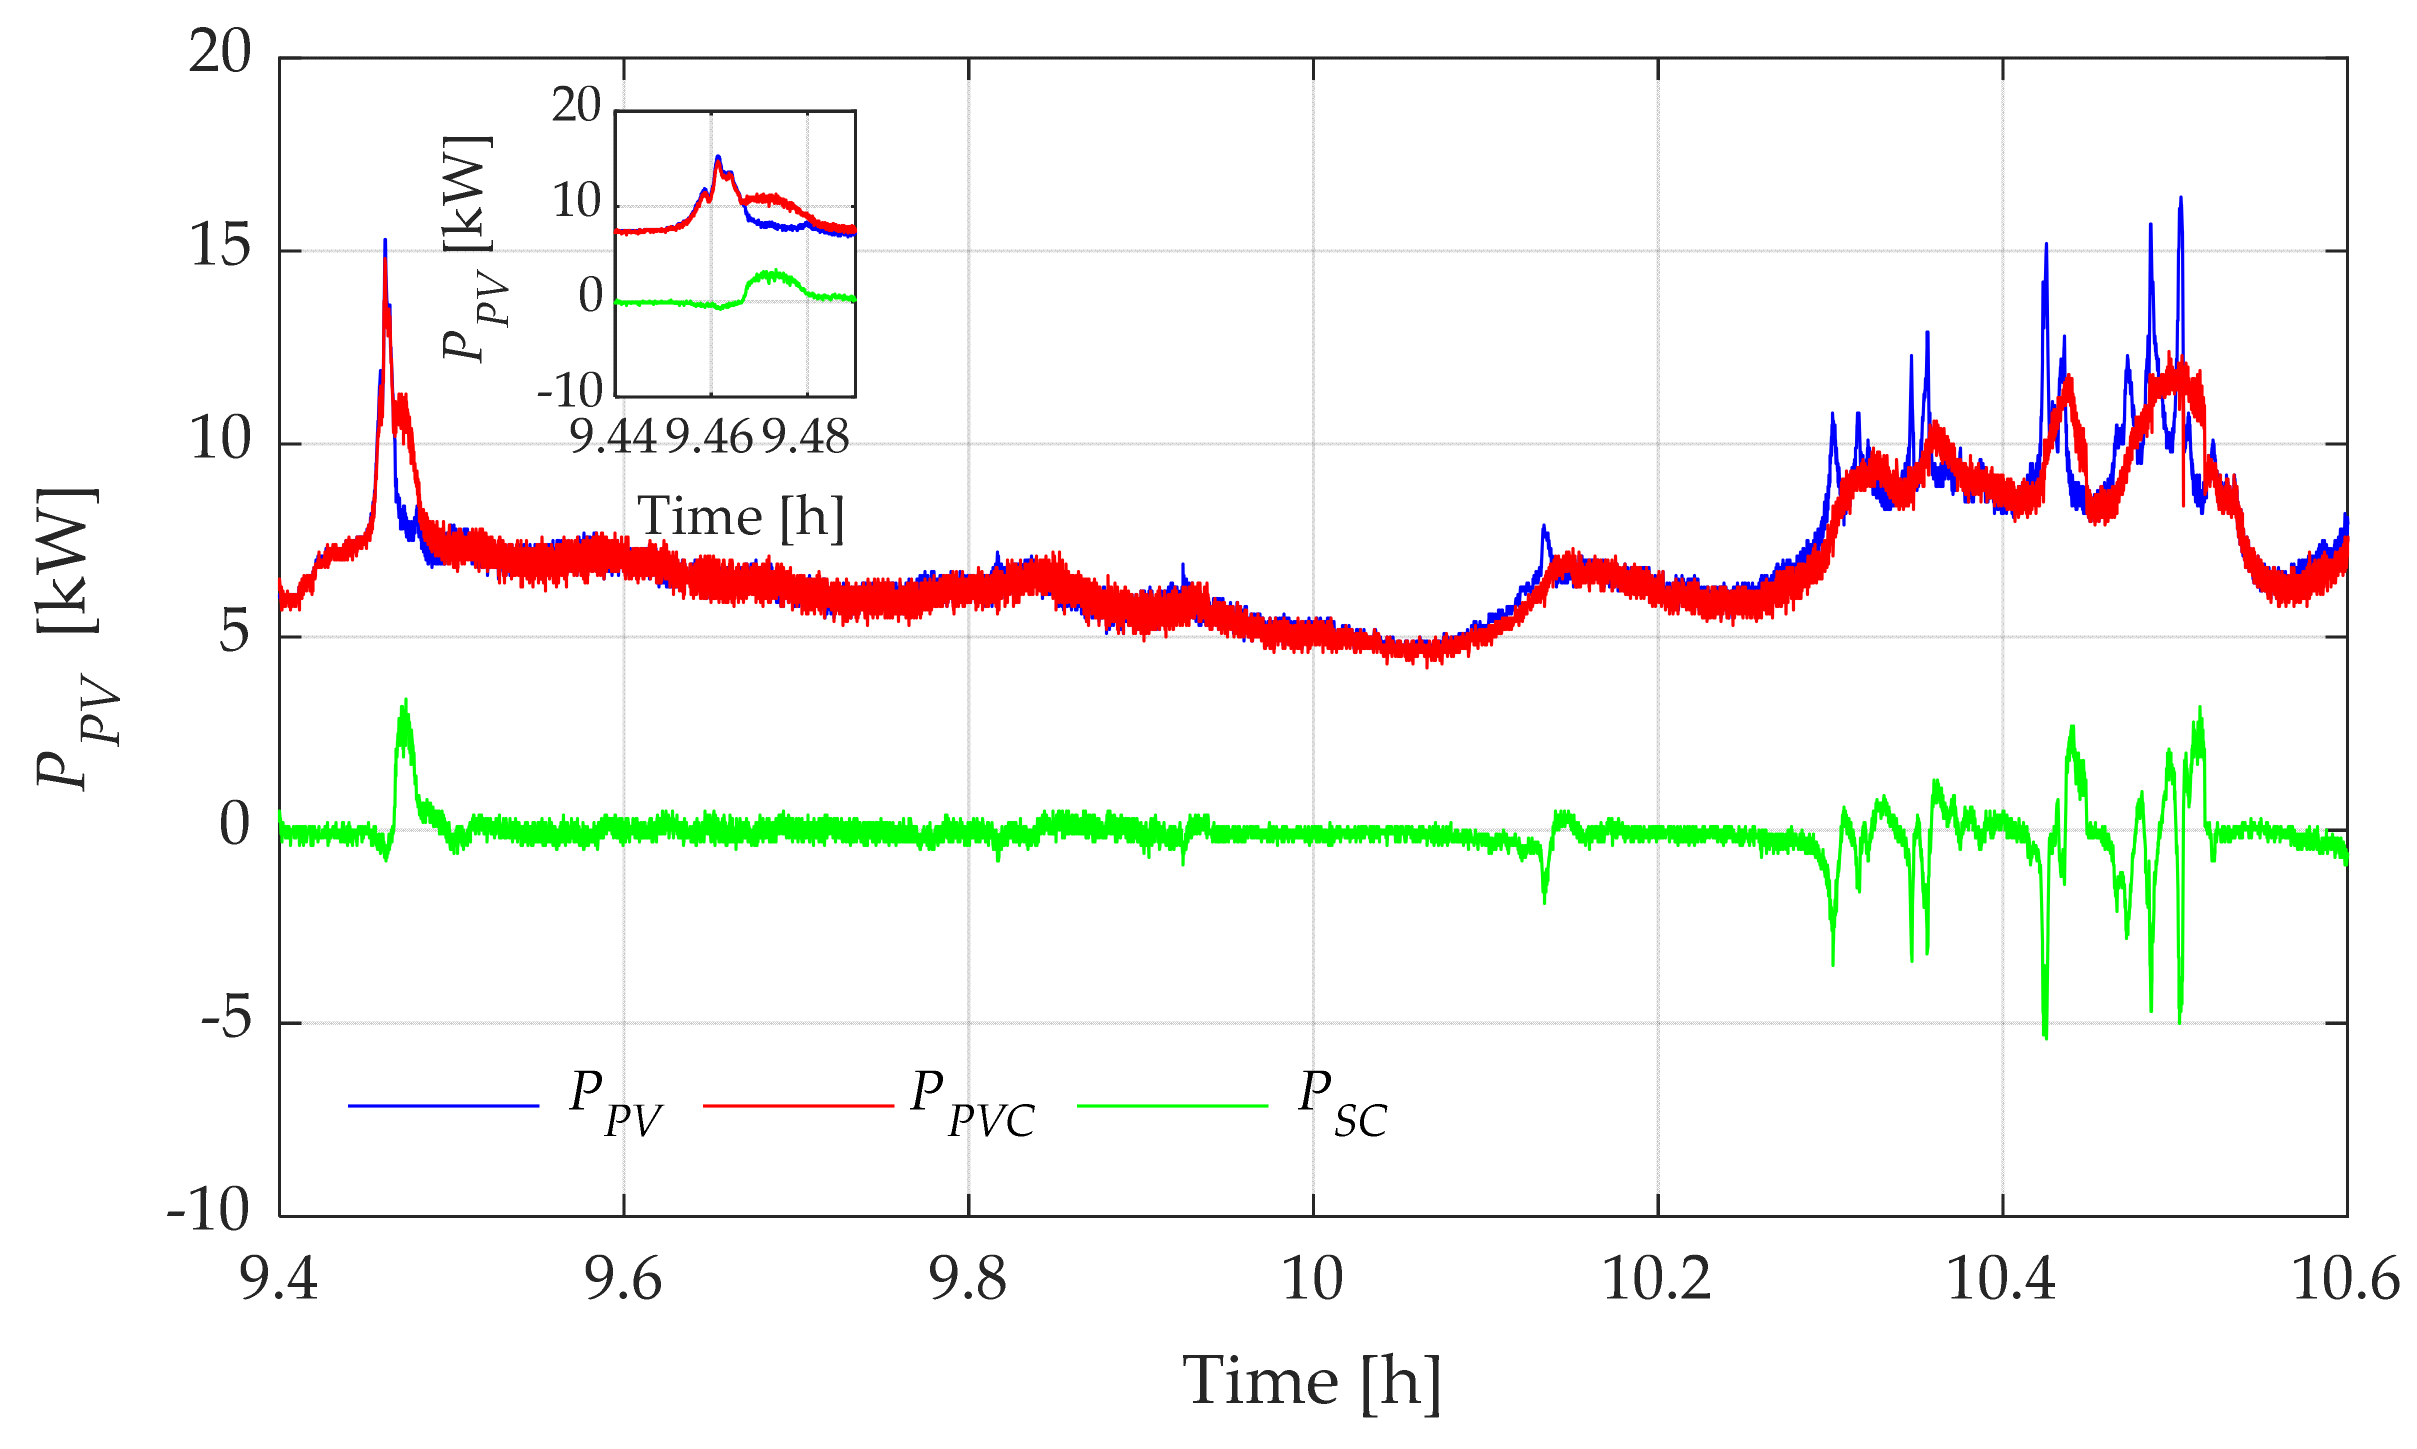
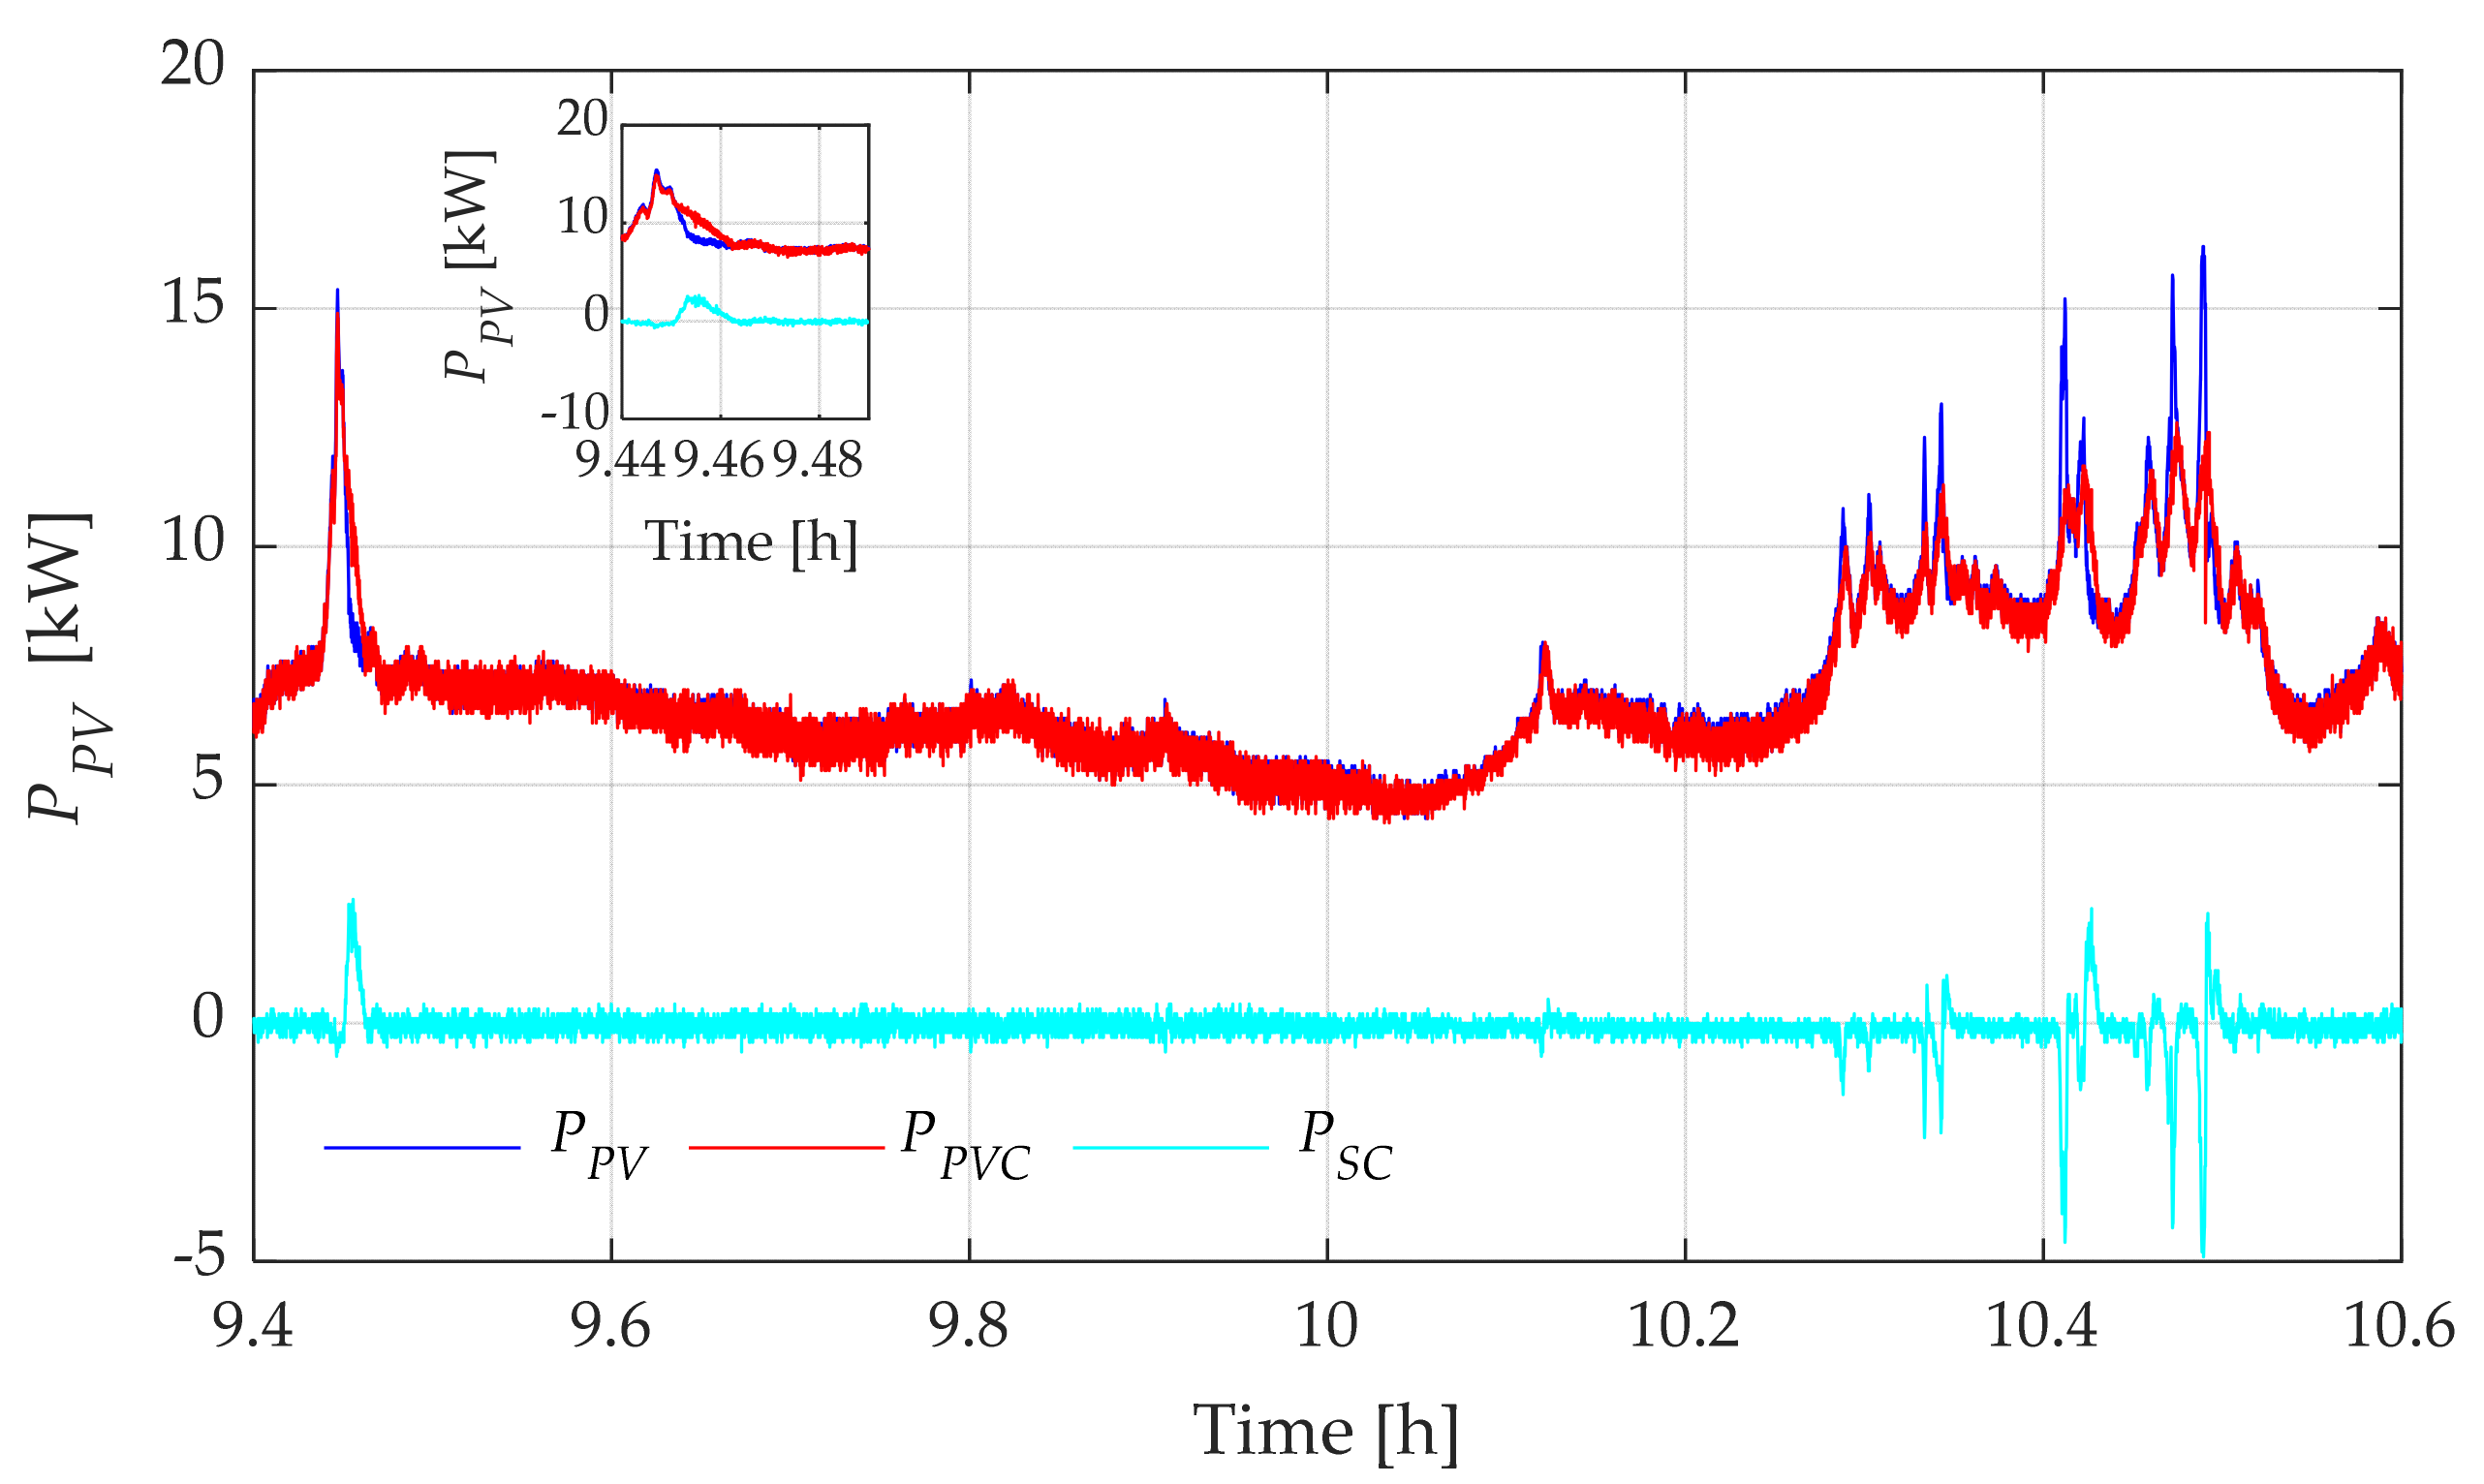
4.1. Low Pass Filter Based Power Smoothing Method Results

The experimental results are summarized in Figure 12, Figure 13 and Figure 14 displaying the emulated profiles of PV power (blue line), SC-ESS power (green, purple, and yellow lines, according to the case of study), and the smoothed power output to the grid (red line). Figure 15 presents an overview of the S o C S C percentage behavior for each case study, demonstrating satisfactory performance as the system maintains its operation within safe values (20–80%), showcasing the effectiveness of the proposed method in this particular case.
Table 2 shows the results of the LP filter, which aimed to reduce the variability of renewable energy generation by implementing three conditions based on the initial S o C S C percentage of the SC-ESS. The first condition threshold was set slightly above 80% of S o C S C , the second between 80% and 20%, and the third below 20%. By implementing these conditions, the LP filter effectively smoothed out the generated energy by delivering more or less energy depending on the S o C S C percentage within the specified range.
The results indicate that the LP filter method achieved a variance reduction of 11.4% for an initial S o C S C greater than 80%. The variance without SC-ESS was 2.99, while with SC-ESS, it decreased to 2.65. Moreover, the LP filter method resulted in a marginal improvement in energy delivery, with 0.09 kWh of additional energy injected into the system compared with the case without SC-ESS.

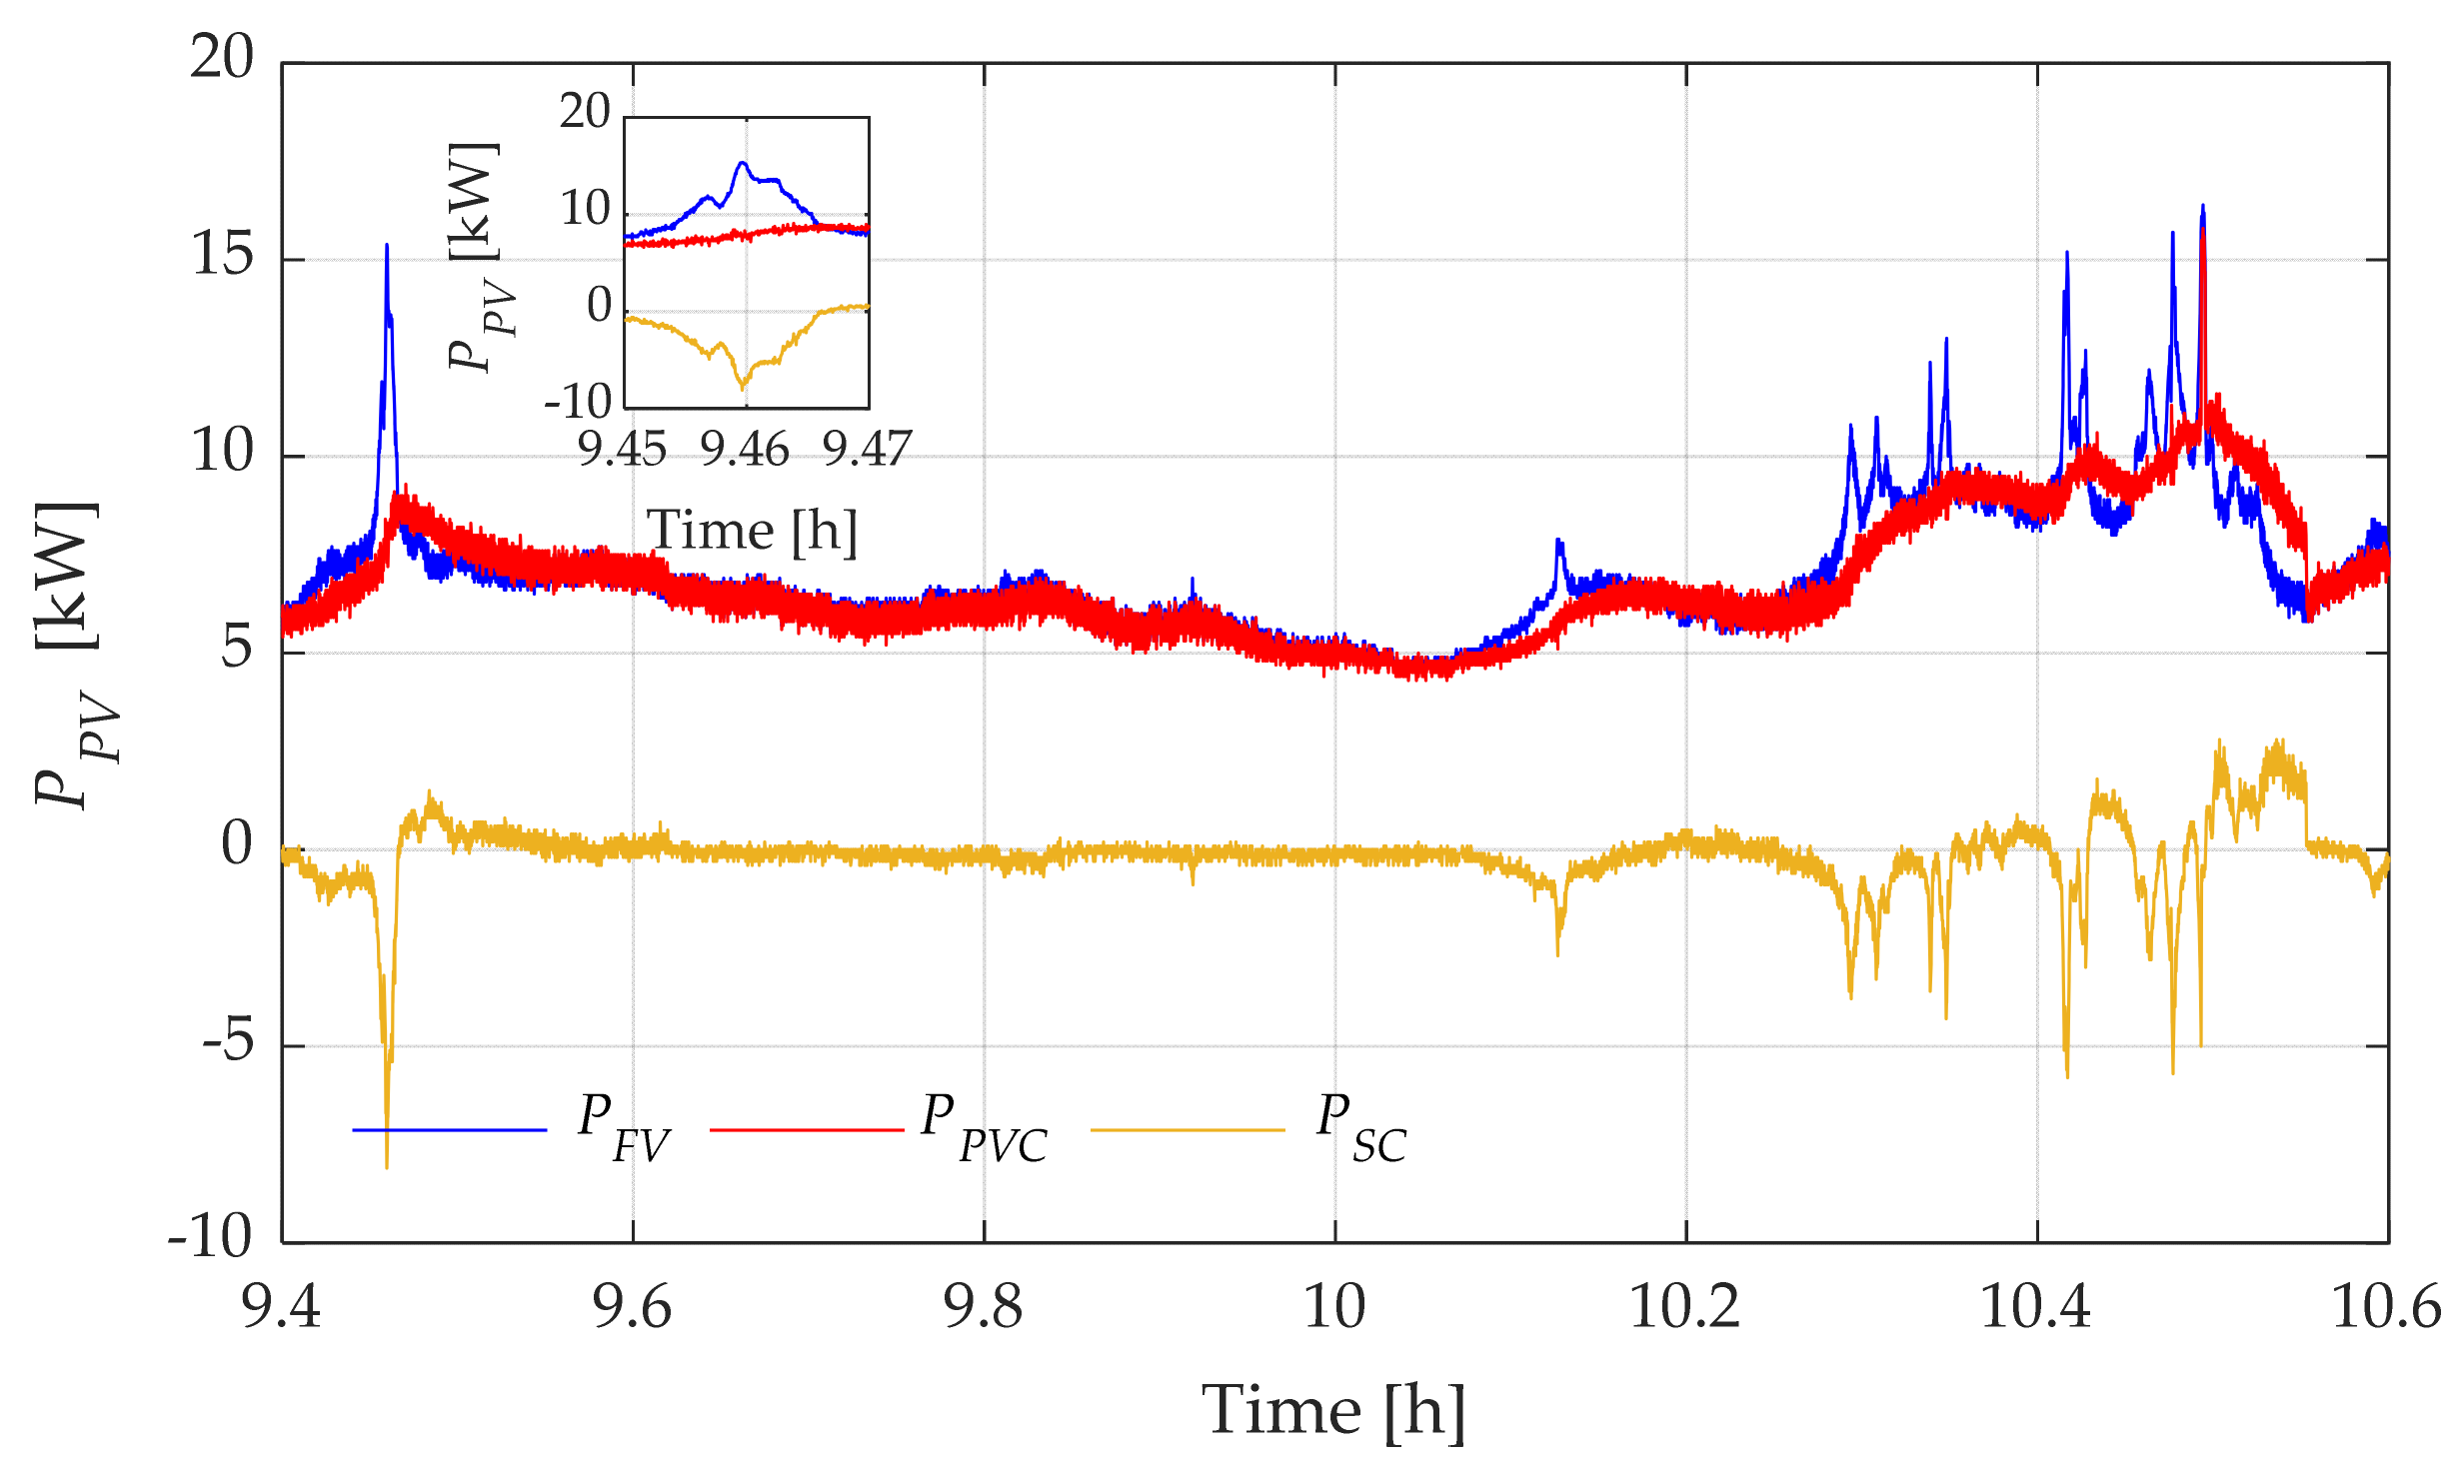
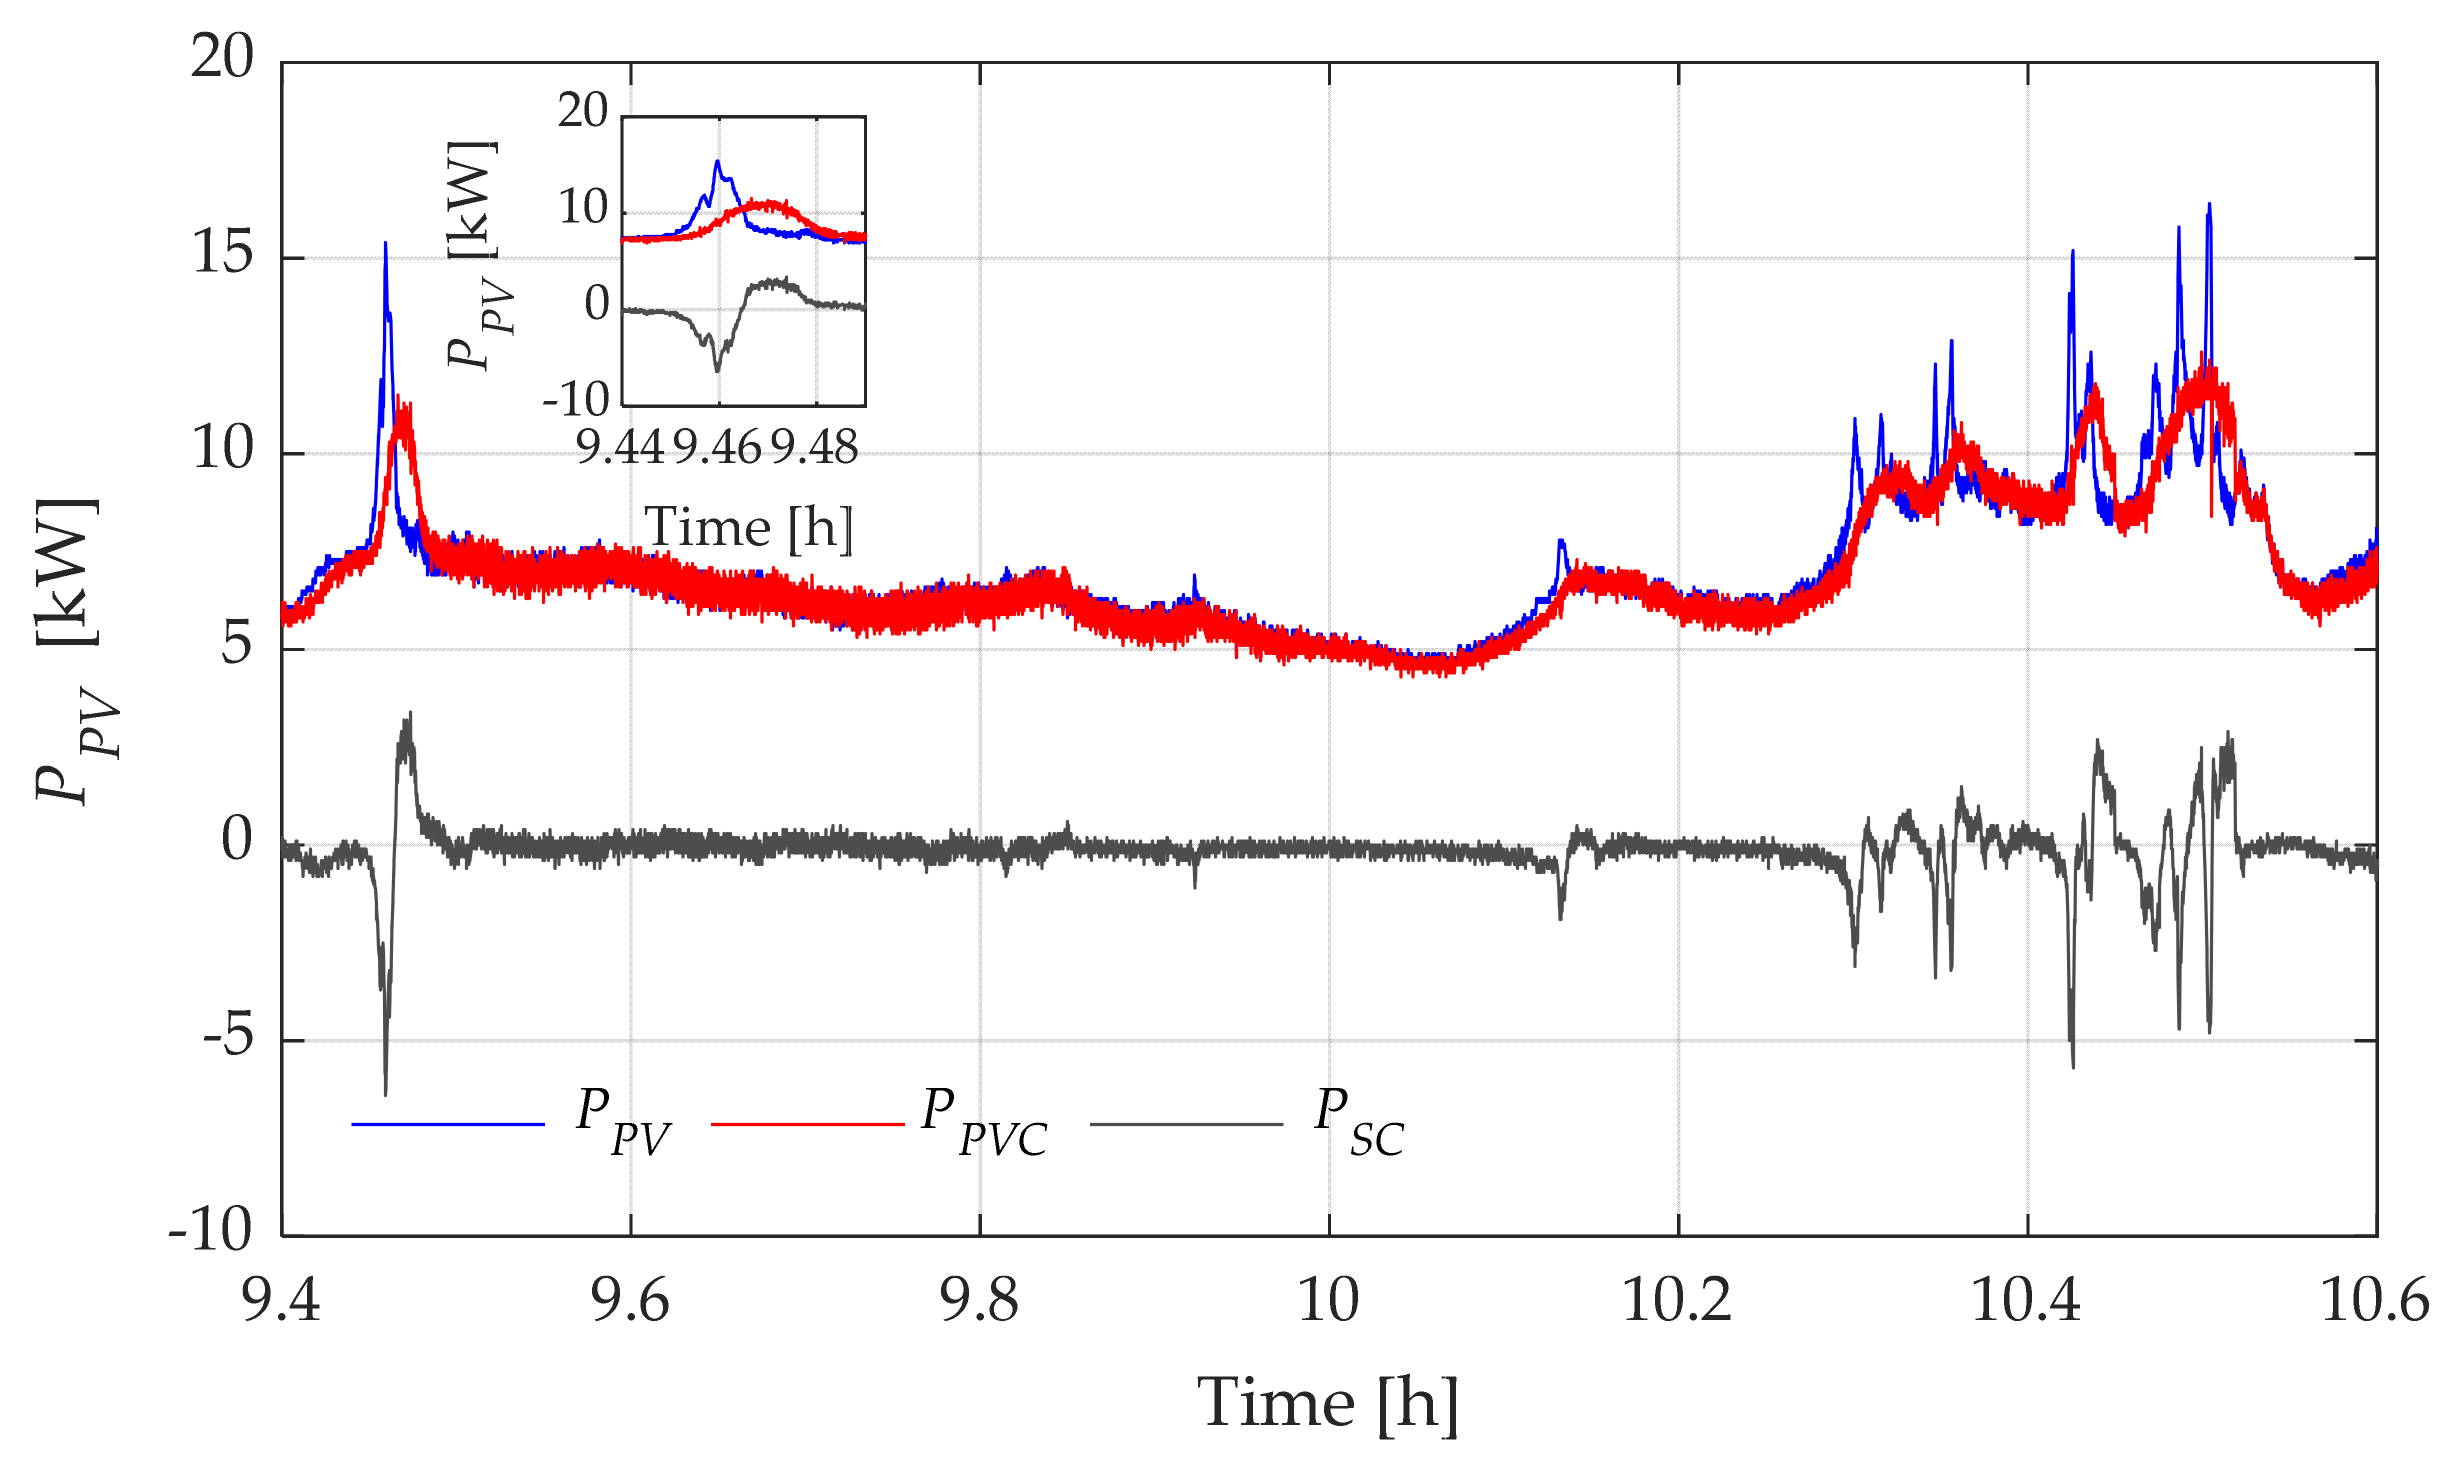
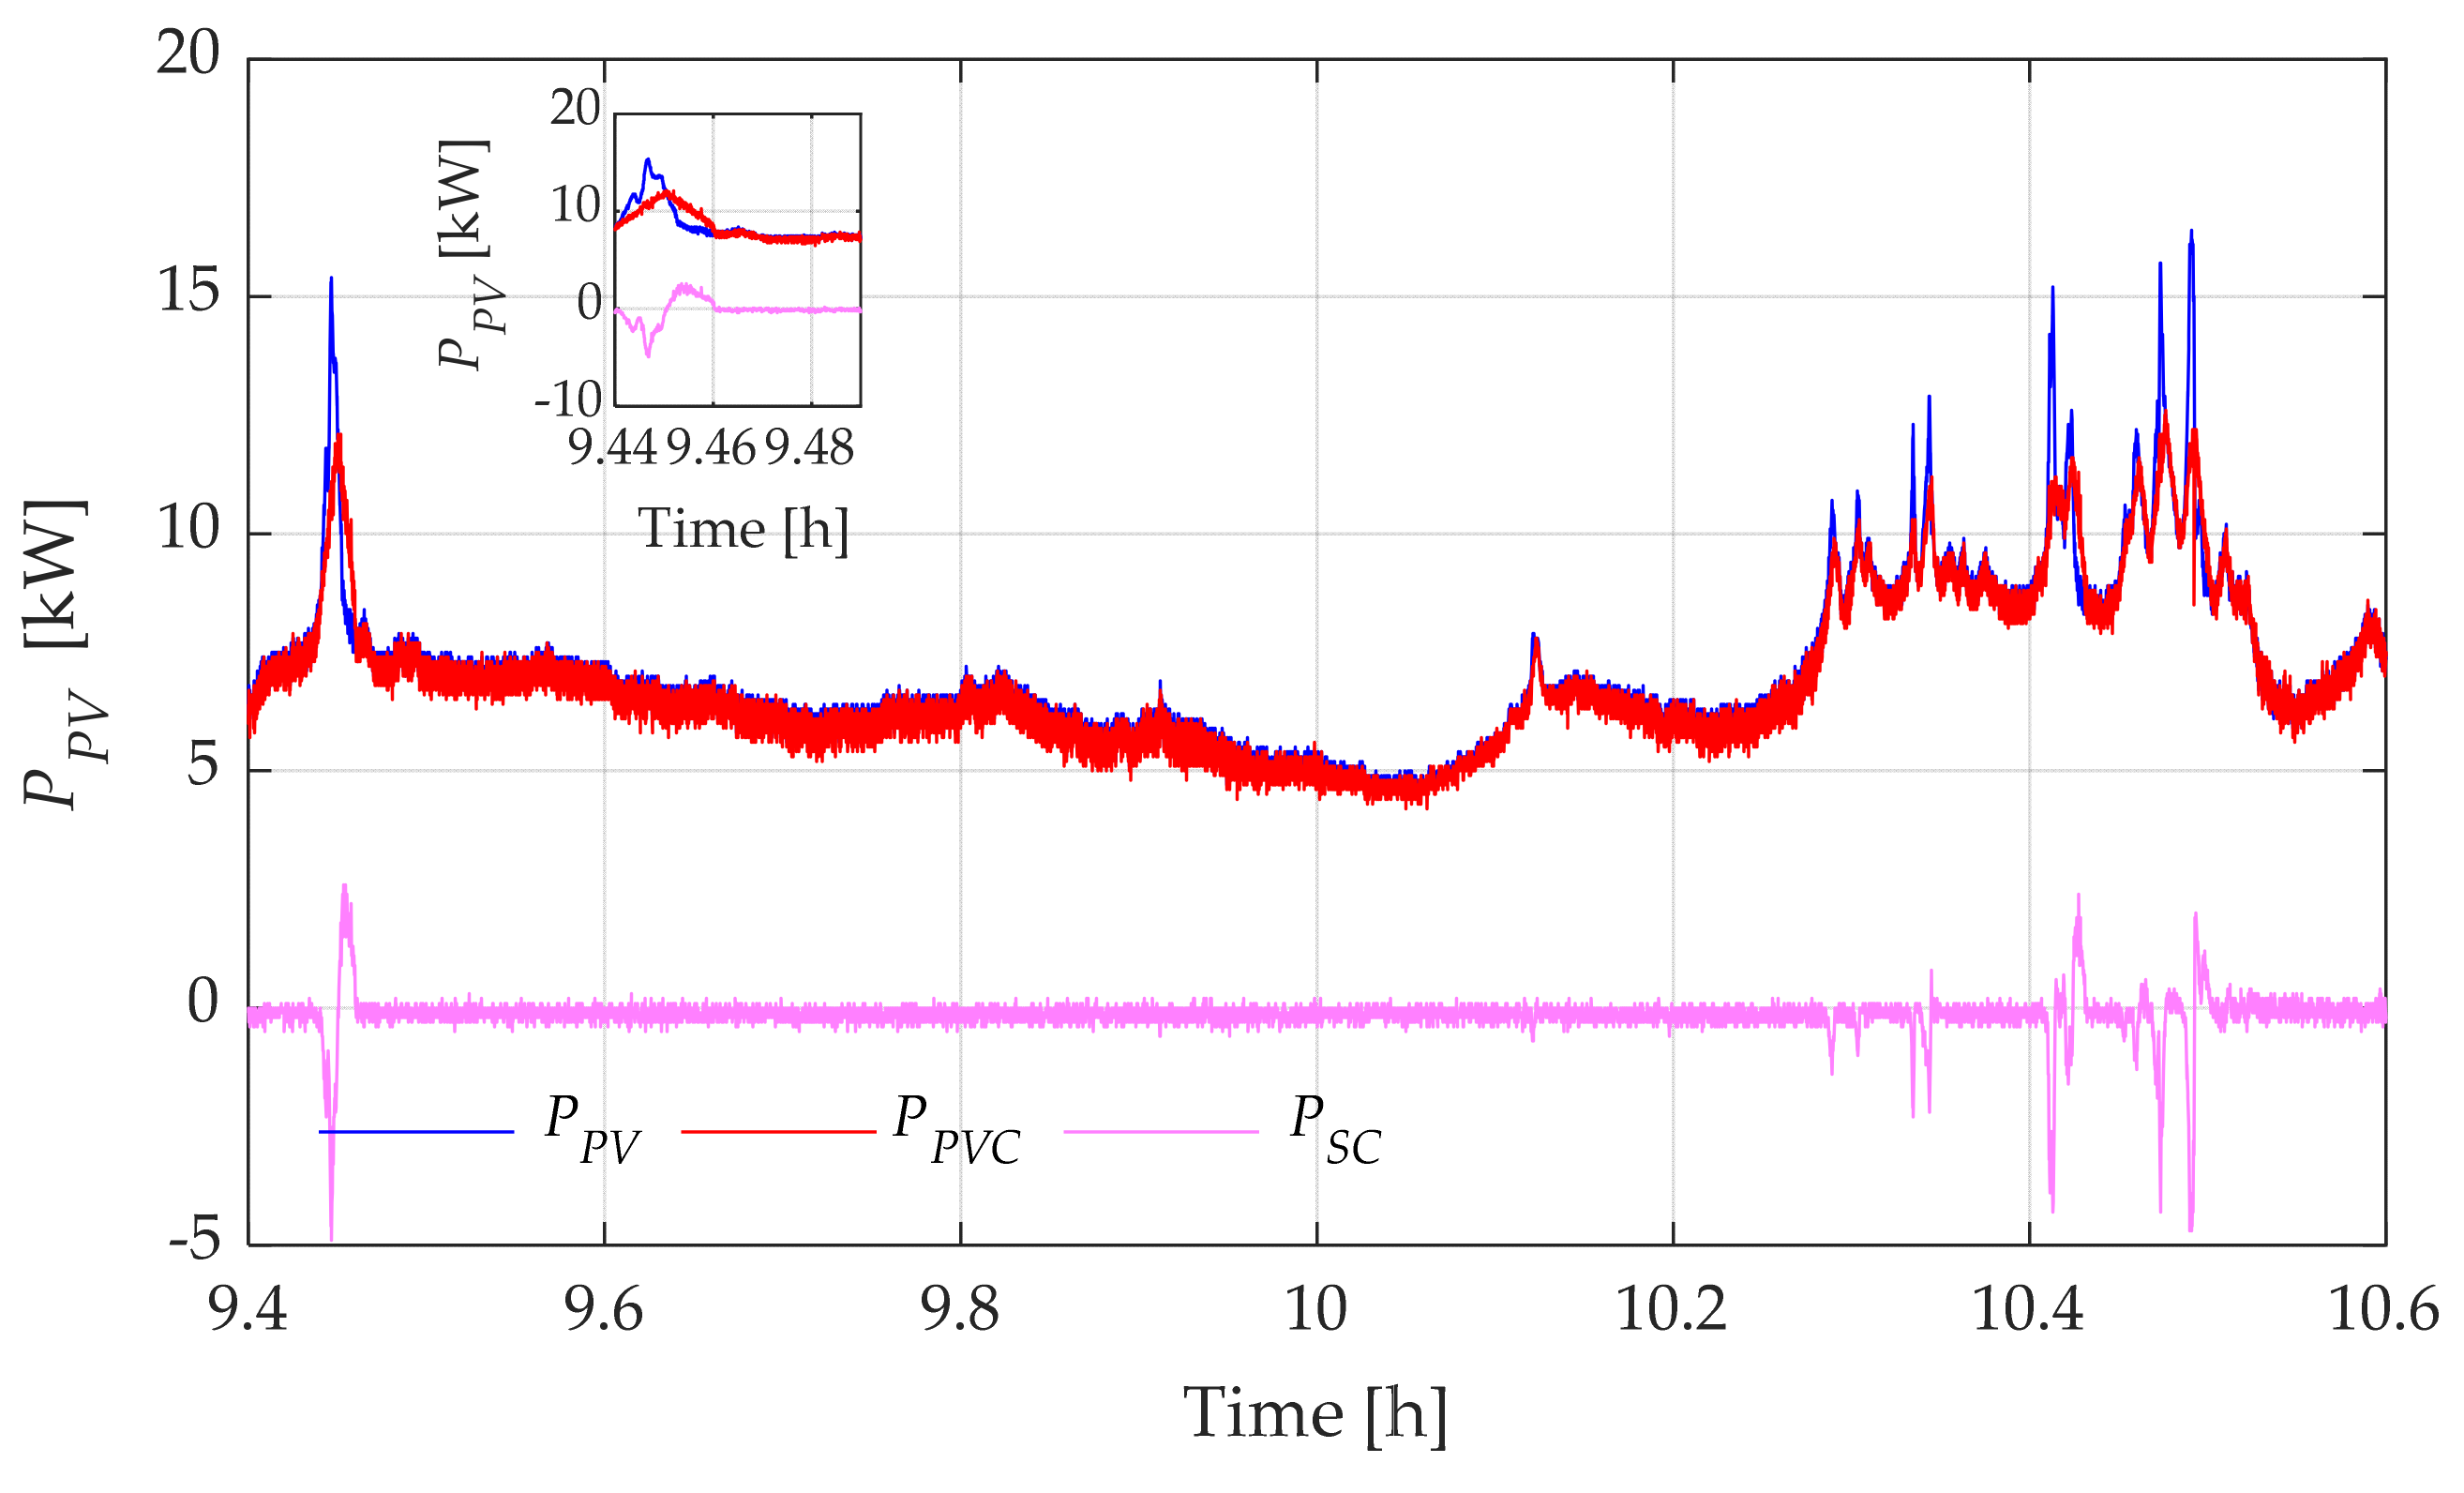
4.2. Moving-Average-Based Power Smoothing Method Results

The experimental results are summarized in Figure 16, Figure 17 and Figure 18, depicting the emulated profiles of PV power (blue line), SC-ESS power (green, black, and orange lines, depending on the case of study), and the smoothed power output to the grid (red line). Figure 19 presents an overview of the S o C S C percentage behavior for each case study, demonstrating satisfactory performance by maintaining operation within safe values (20–80%) and showcasing the effectiveness of the proposed method in this particular case.
Table 3 presents the results of the MA filter, which applied the same three conditions based on the S o C S C percentage. The MA filter exhibited a greater reduction in the variability of the generated energy compared with the LP filter. For an initial S o C S C greater than 80%, the variance reduction achieved by the MA filter was 4.4%. The variance without SC-ESS was 2.97, while with SC-ESS it decreased to 2.84. Additionally, the MA filter method delivered 0.07 kWh more energy to the system compared with the case without SC-ESS.

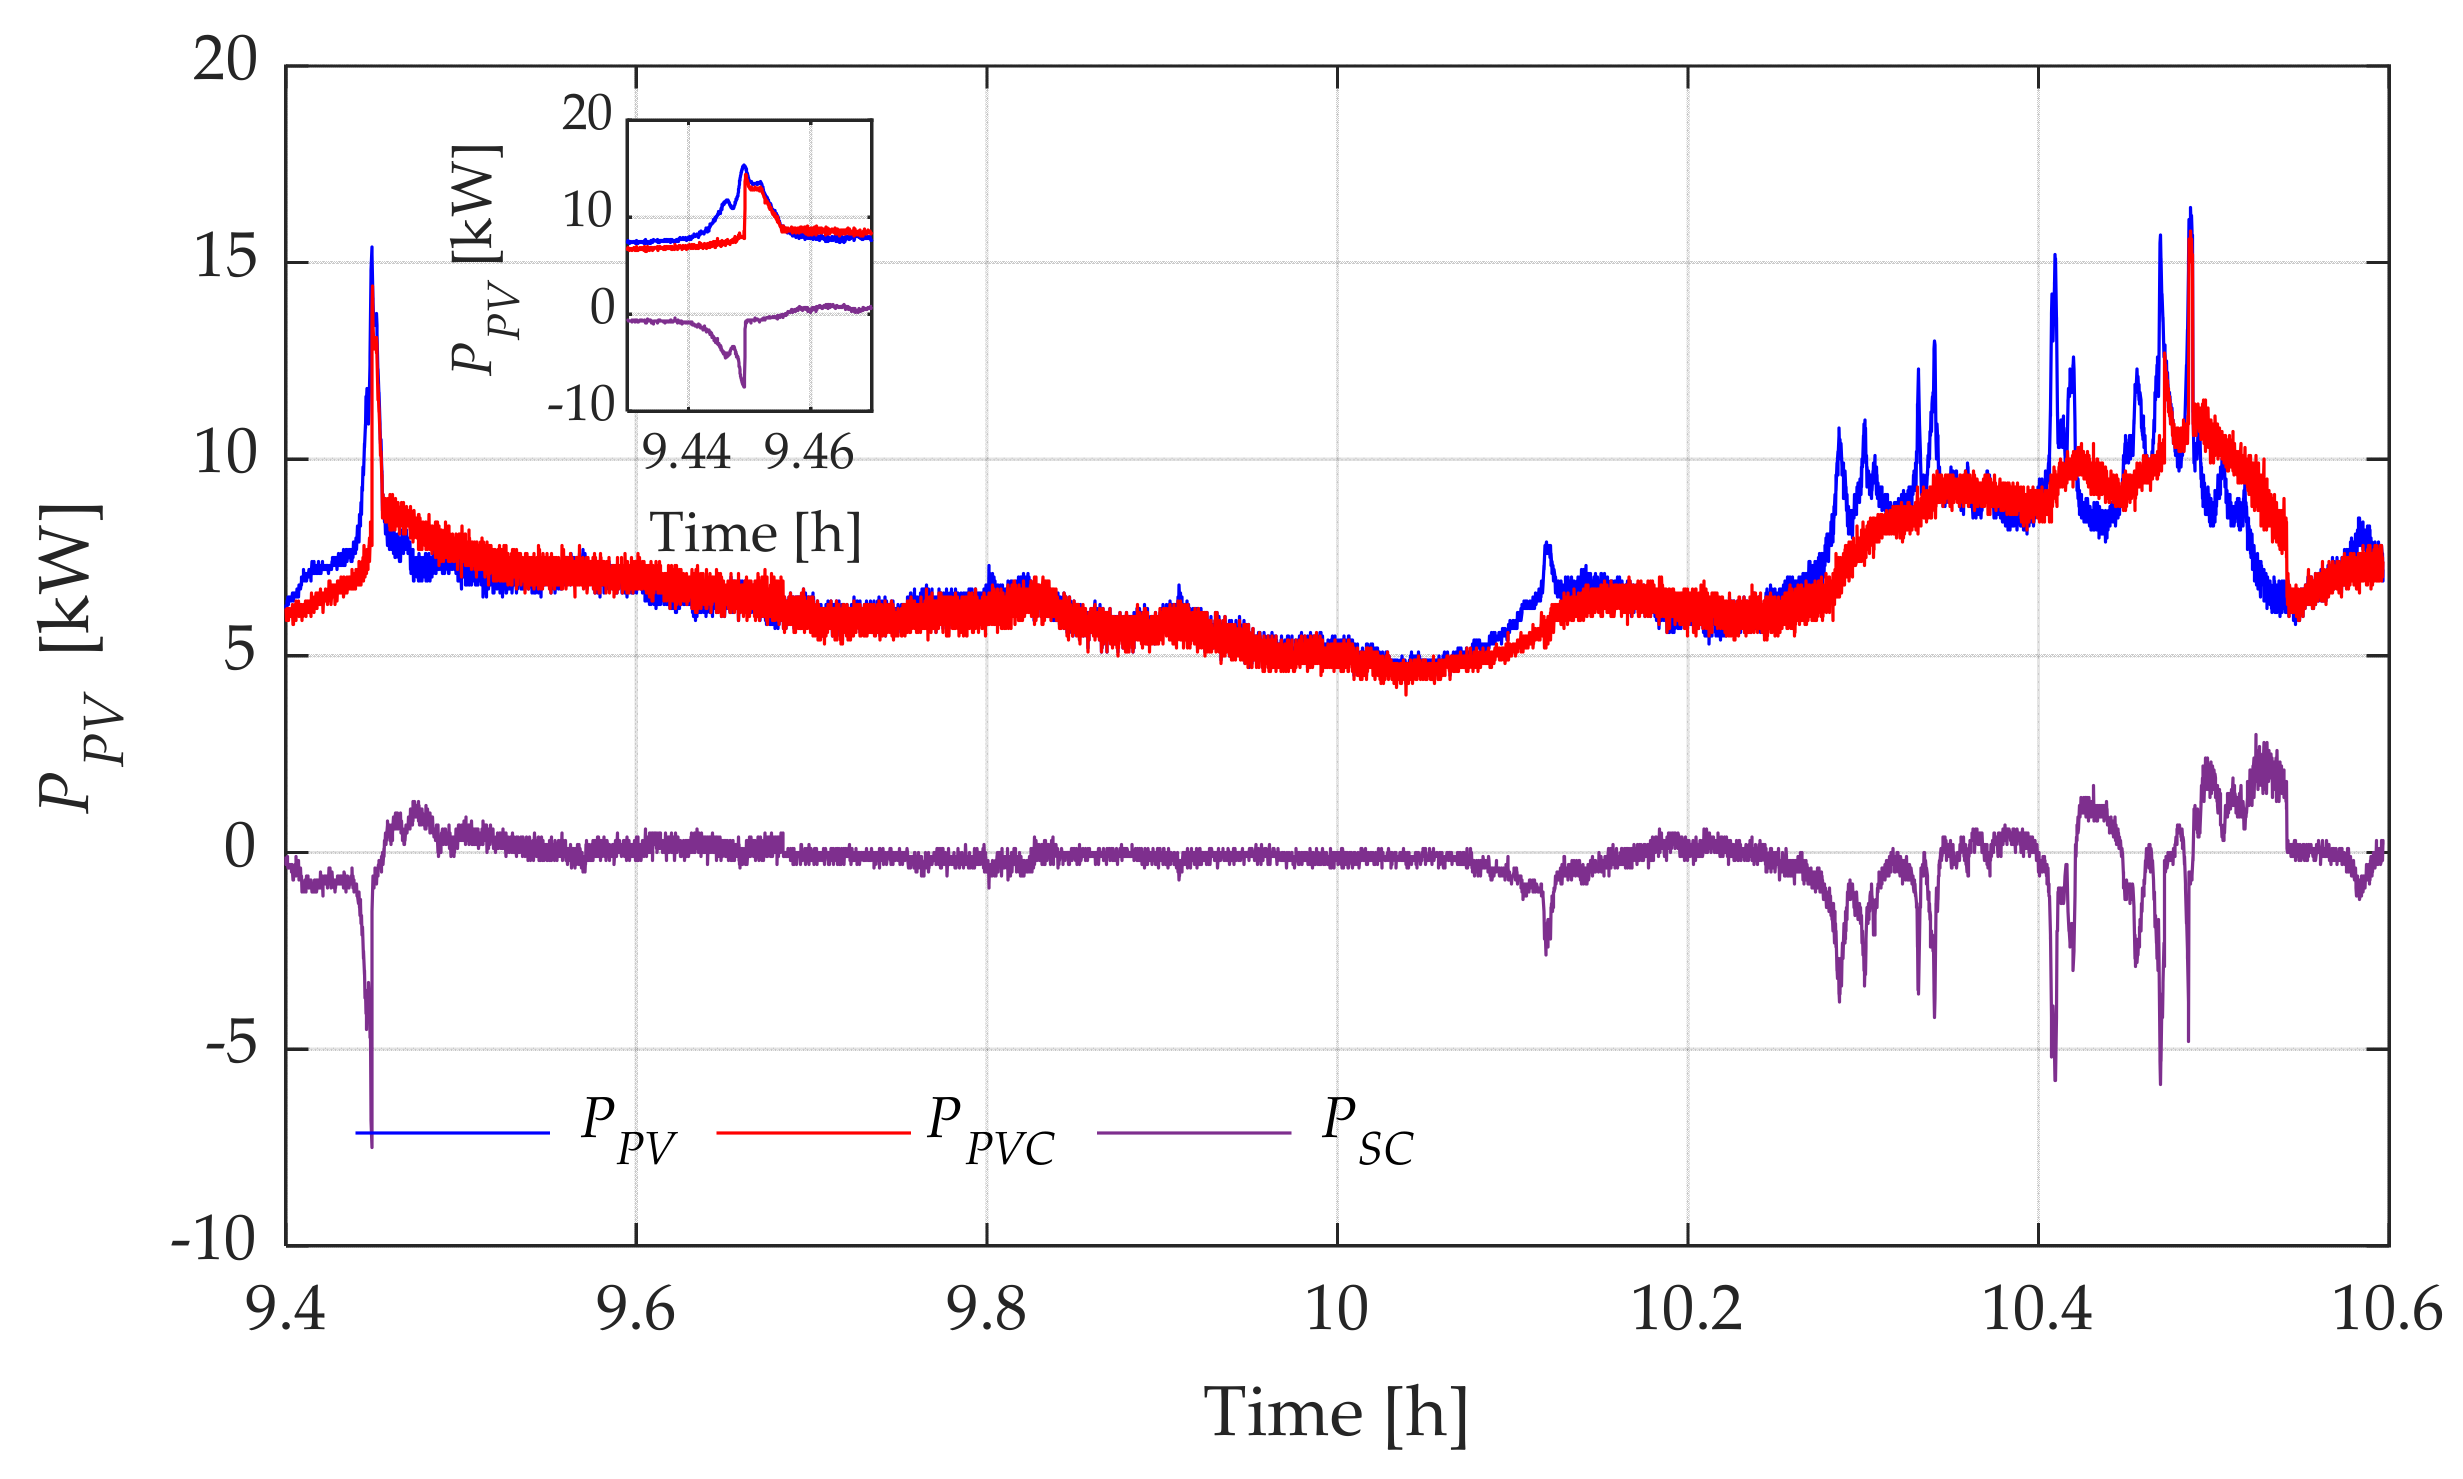
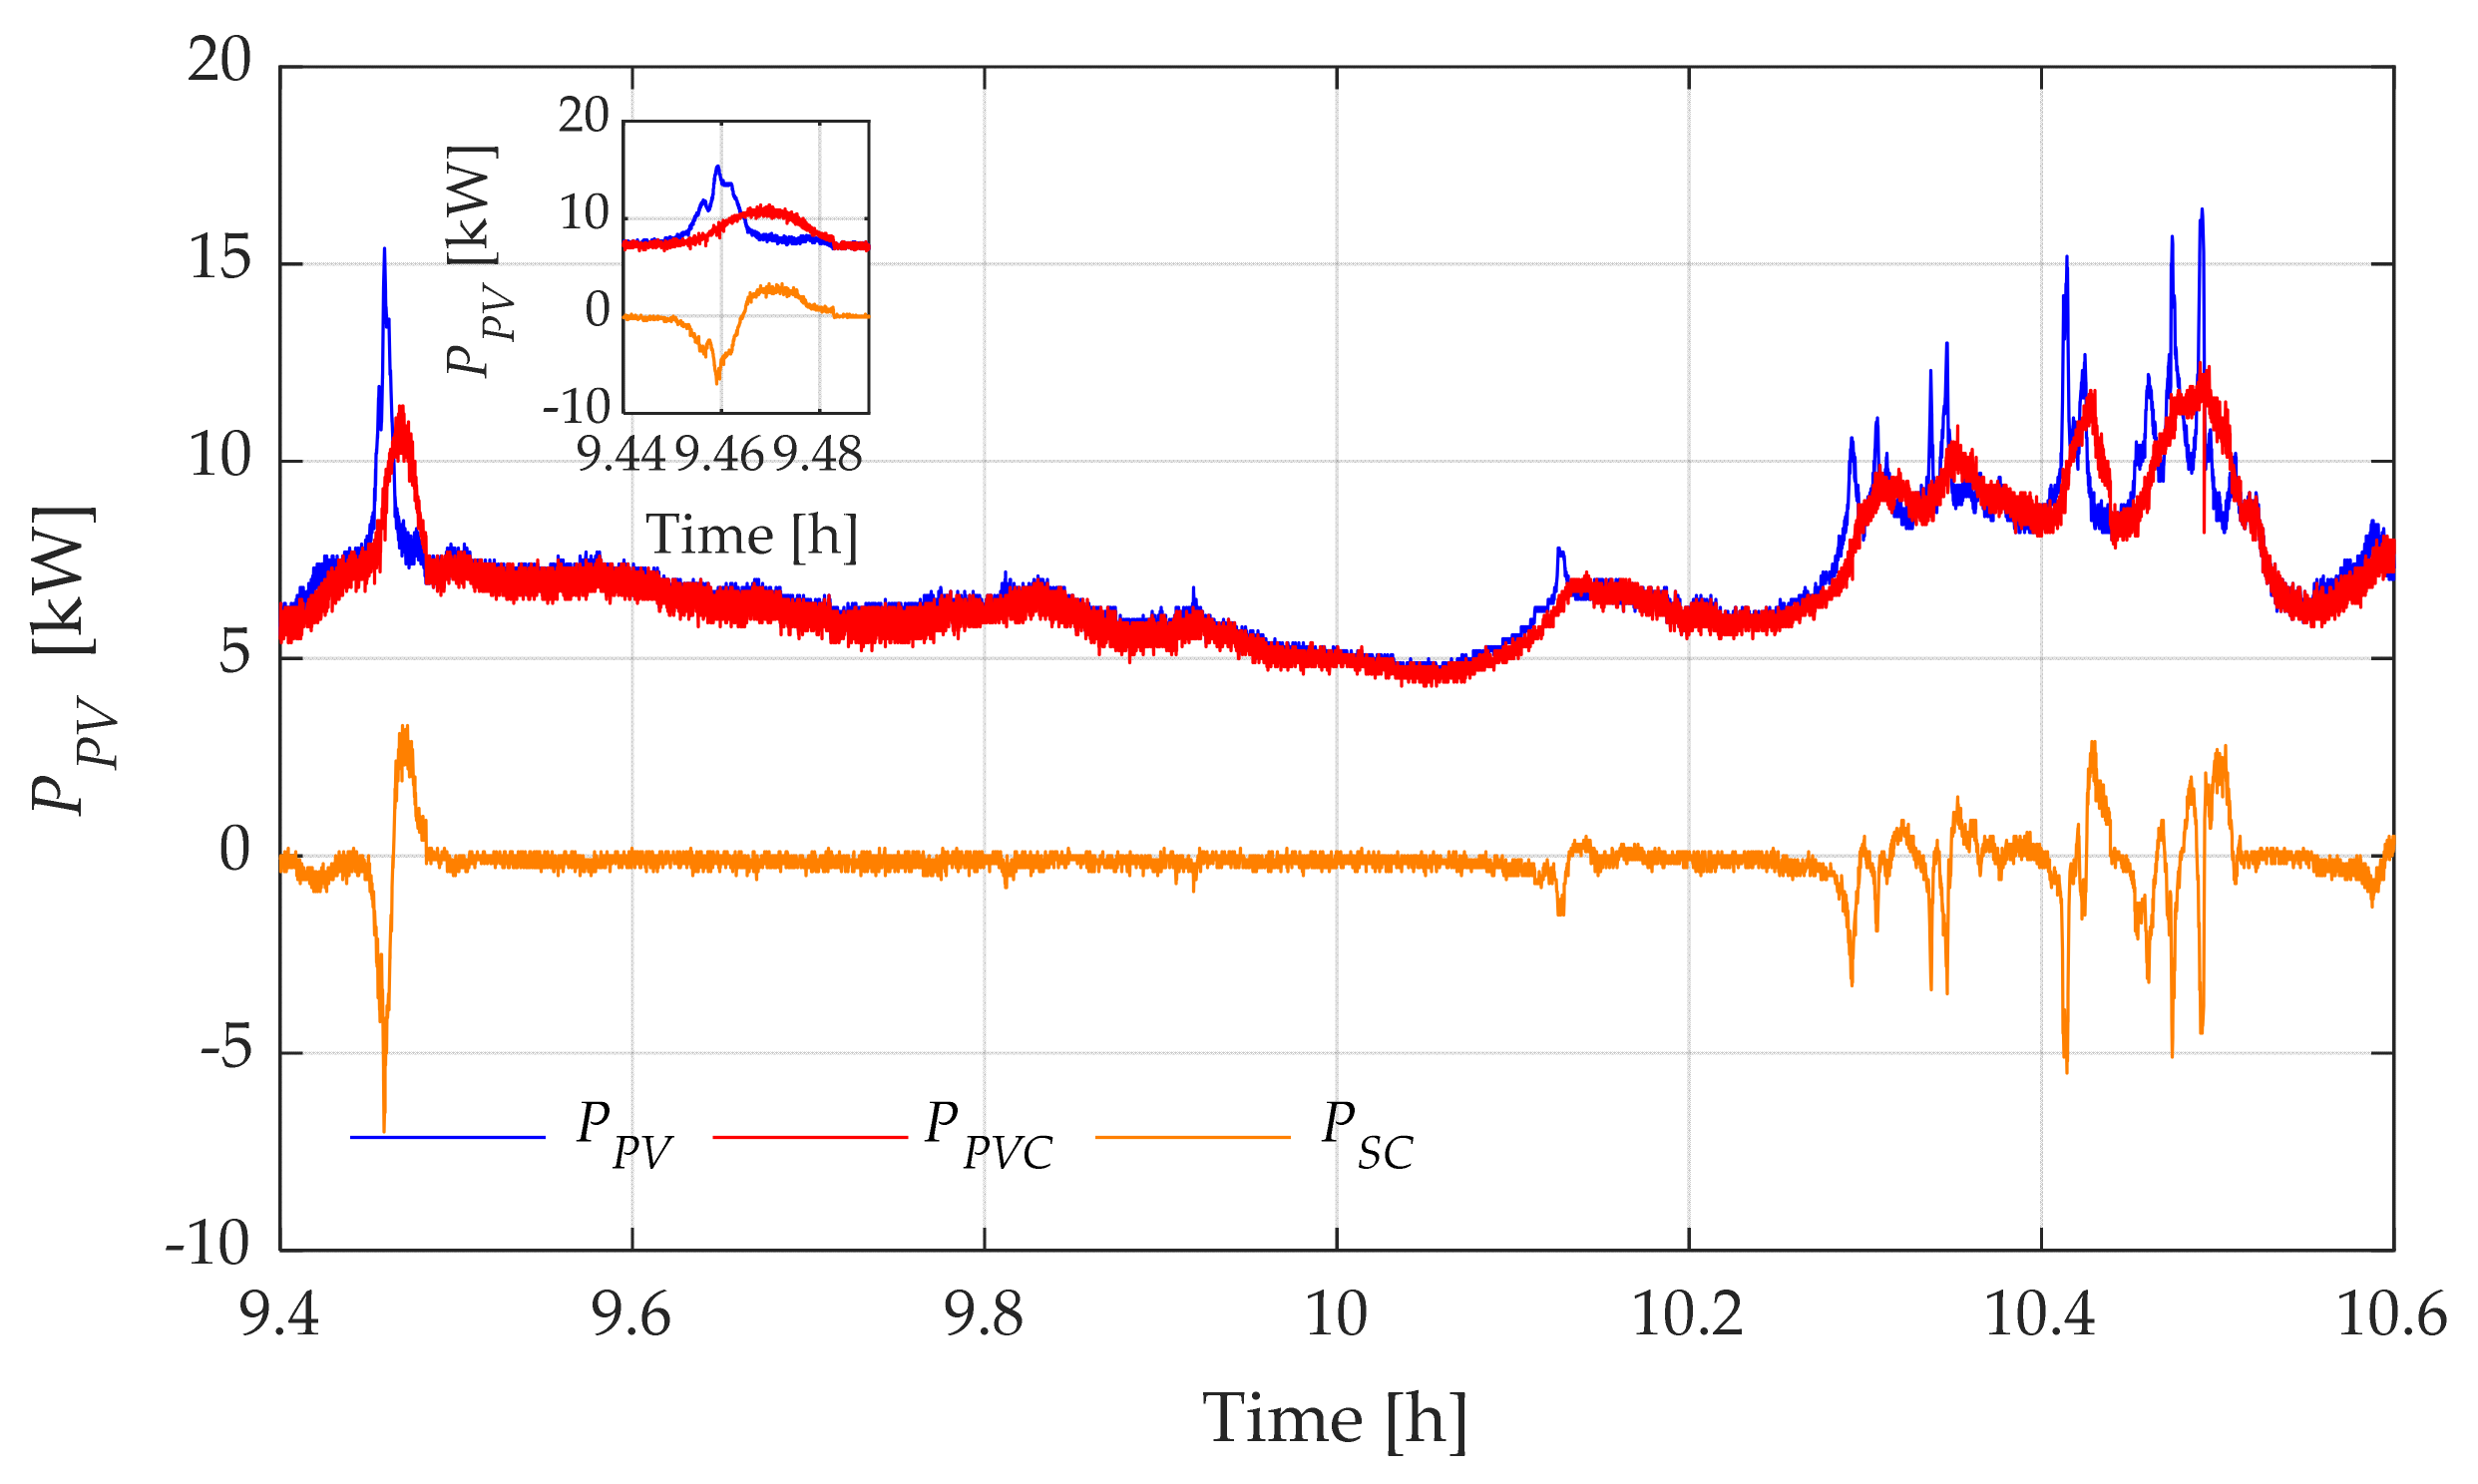
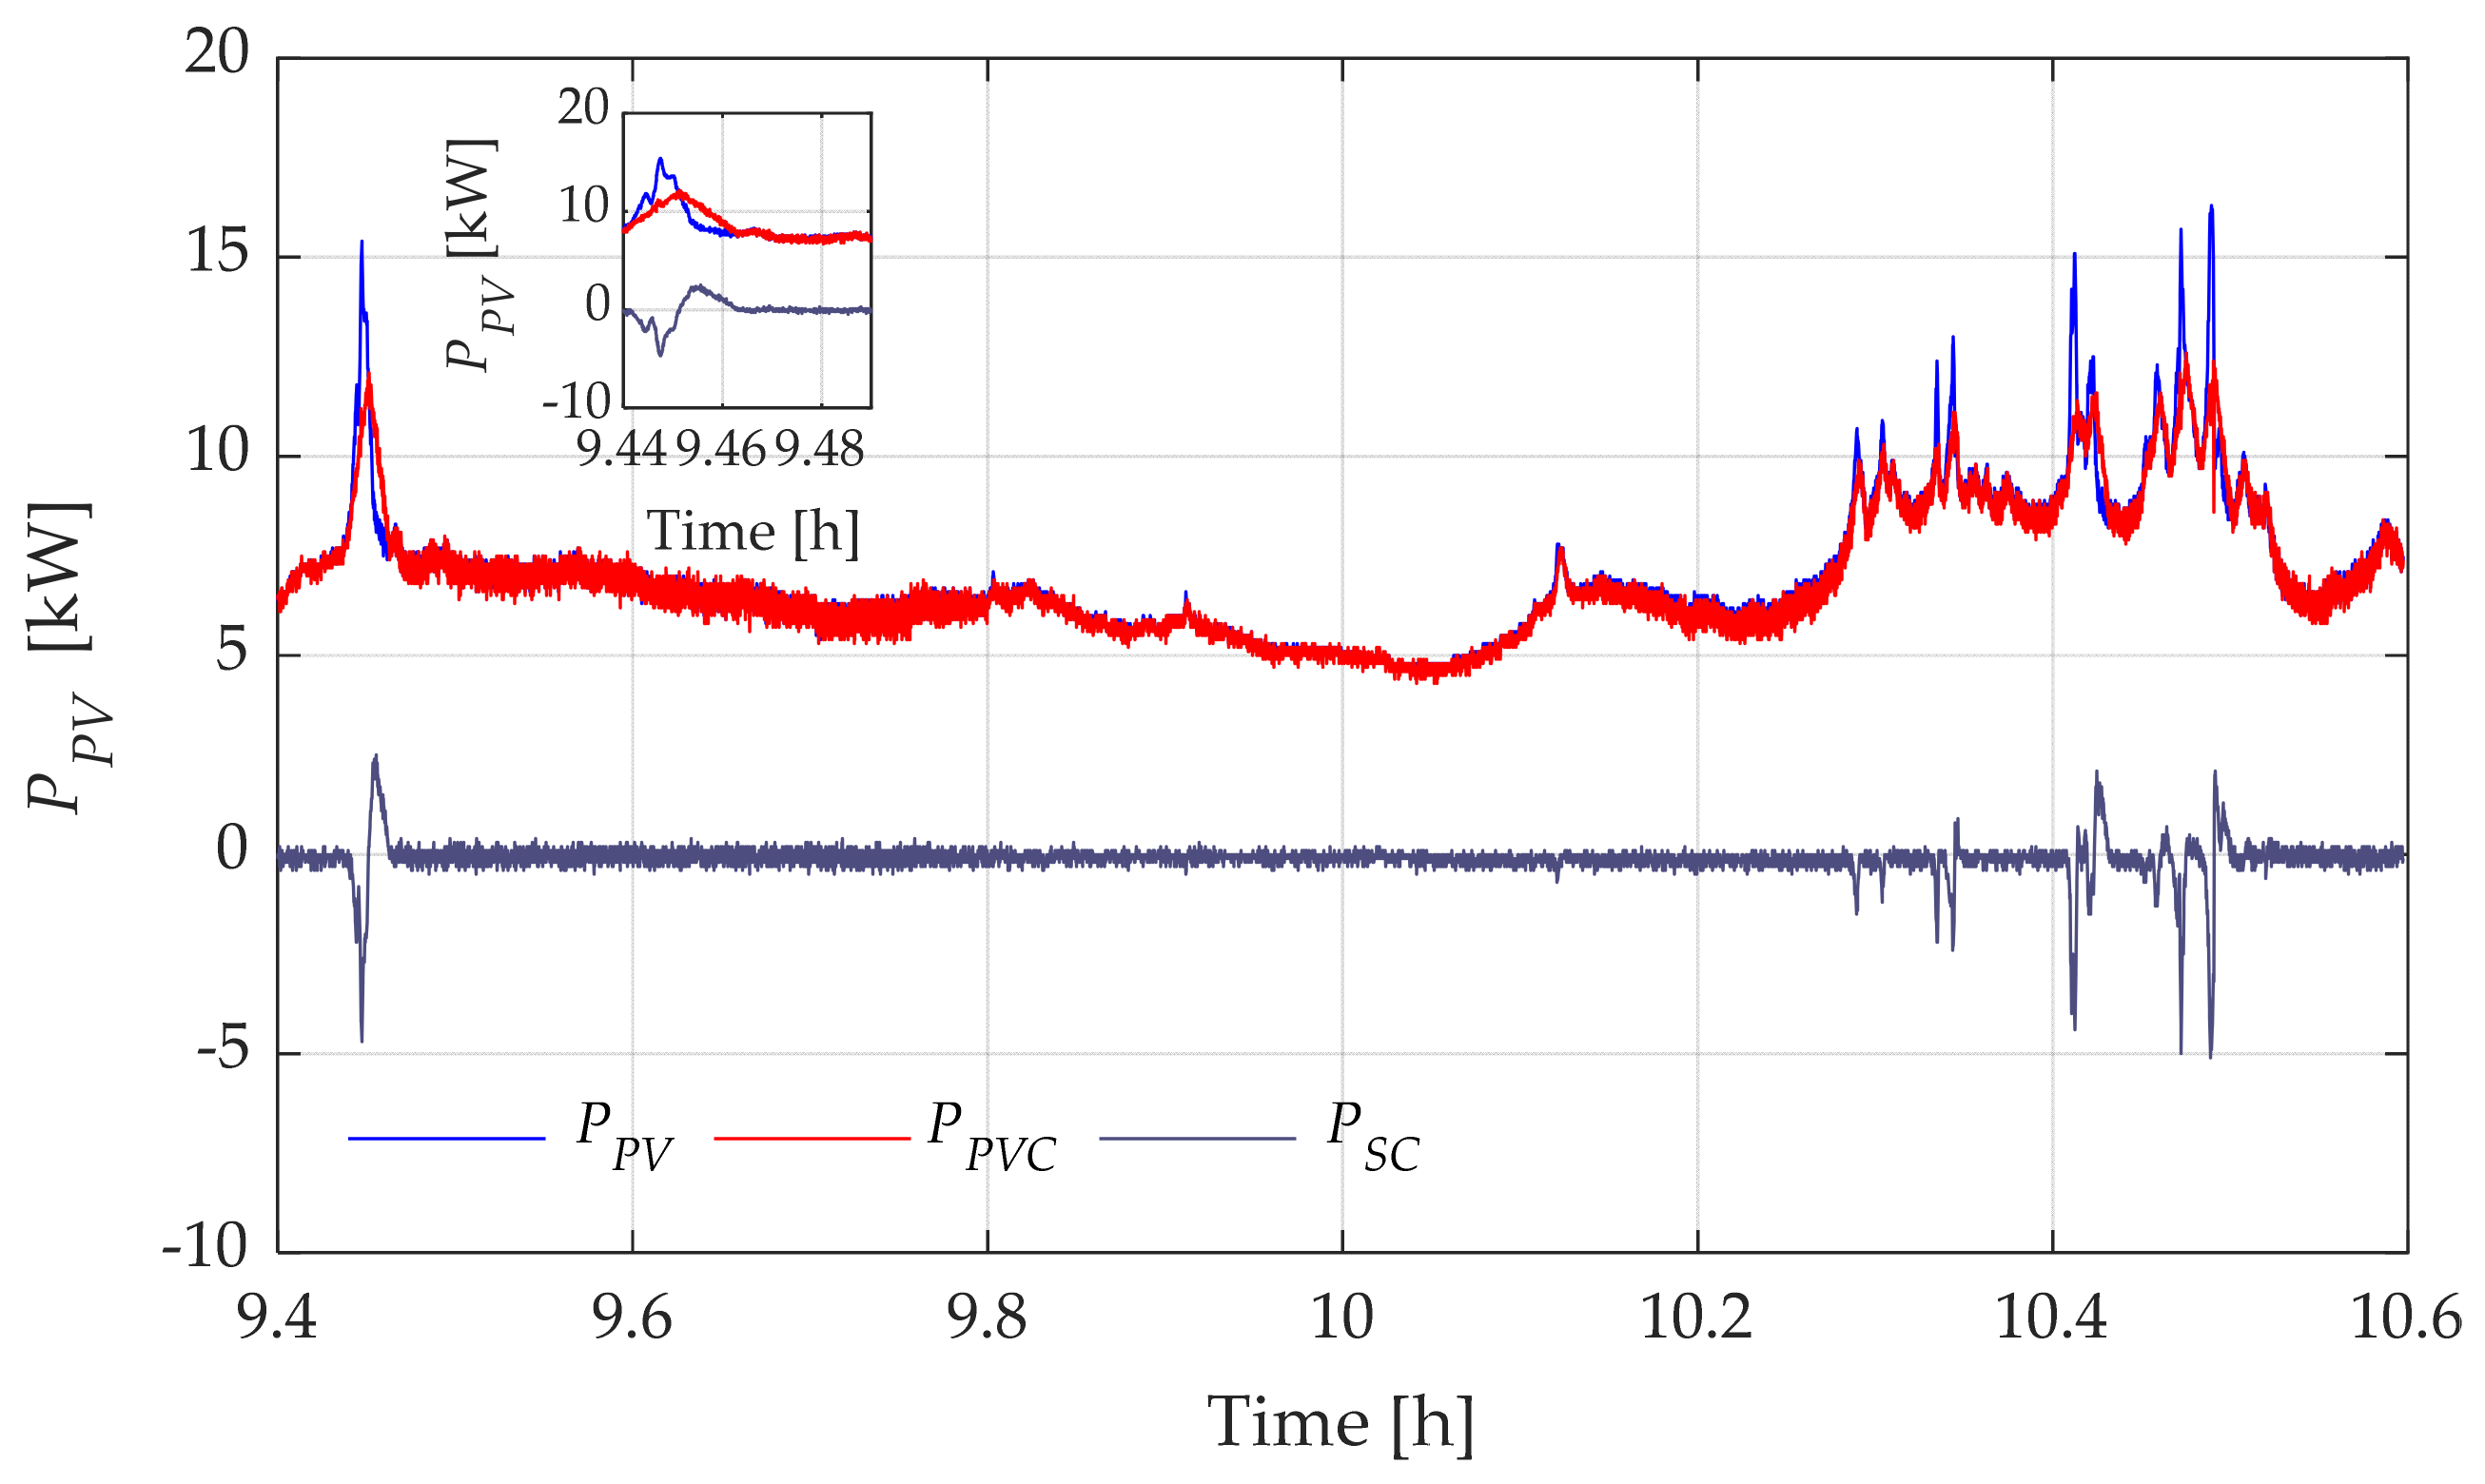
4.3. Ramp Rate Filter Based Power Smoothing Method Results

The experimental results are summarized in Figure 20, Figure 21 and Figure 22, which show the emulated profiles of PV power (blue line), SC-ESS power (light blue, dark blue, and violet lines, according to the case study), and the smoothed power output to the grid (red line). Figure 23 provides an overview of the percentage behavior of S o C S C for each case study, demonstrating satisfactory performance as the system maintains its operation within safe values (20–80%), showcasing the effectiveness of the proposed method in this particular case.
Table 4 presents the results of the RR filter, which aimed to reduce the variability of renewable energy generation by implementing three conditions based on the initial percentage of S o C S C of the SC-ESS. The threshold for the first condition was set slightly above 80% of S o C S C , the second condition between 80% and 20%, and the third condition below 20%. By implementing these conditions, the RR filter effectively smoothed the generated energy by delivering more or less energy depending on the percentage of S o C S C within the specified range.
The results indicate that the RR filter method achieved a reduction in variance of 9.99% for an initial S o C S C above 80%. The variance without SC-ESS was 2.90, while with SC-ESS, it decreased to 2.61. Furthermore, the RR filter method resulted in a marginal improvement in energy supply, with an additional 0.1 kWh of energy injected into the system compared with the case without SC-ESS.
Based on these results, it can be observed that the LP filter method achieved greater power smoothing when considering the reduction in power variability. Conversely, the MA and RR methods outperformed the LP filter in terms of energy delivery, delivering more energy to the system due to the higher energy storage capacity of the SC-ESS. This disparity in energy delivery can be attributed to the fact that the SC-ESS stores a greater amount of energy than the MA and RR methods, as evident in Figure 15, Figure 19 and Figure 23. Overall, these findings highlight the trade-off between power smoothing and energy delivery in the LP, MA, and RR filter methods. The LP filter excels in power smoothing, while the MA and RR filters offer a slightly higher energy delivery capability. The choice between these methods should consider the specific system requirements and priorities regarding power stability and energy availability.

4.4. Comparison between Methods

In this section, we compare the LP, MA, and RR methods in terms of their performance for power smoothing in the PV system. The LP filter method demonstrates a higher degree of power smoothing, effectively reducing power output variability. It achieves a smoother power profile, resulting in more stable power output to the grid. However, it is worth noting that the LP filter method delivers less energy to the system at a given time. This is due to the higher energy storage capacity of the SC-ESS, which results in higher energy retention than the MA and RR methods. On the other hand, the MA and RR methods perform better in terms of energy delivery to the system. They provide a higher amount of energy, making them more advantageous regarding power availability. However, they may exhibit slightly lower power smoothing than the LP filter method. The MA and RR methods are simpler to implement in software because they are based on noncomplex linear algorithms. This is an advantage over the LP method, in which implementing a discrete-time transfer function leads to a higher computational burden during its execution.
Overall, the selection between the LP, MA, and RR methods hinges upon the specific requirements and priorities of the PV system. If the primary goal is to mitigate power fluctuations and ensure a consistent power output to the grid, the LP filter method is highly recommended. Conversely, if the emphasis is on maximizing energy delivery, the MA and RR methods may prove to be more suitable. The latter conclusion applies if a practical implementation of the methods with less computational effort is also sought. It is essential to conduct a thorough analysis and consider the system’s requirements in order to make an informed decision regarding the choice of method. Lastly, Table 5 provides a concise overview of the advantages and disadvantages associated with the implemented filter methods based on the findings of this research.
Finally, it should be noted in all the cases studied that the SC-ESS operates within safe active power limits, since it remains below its maximum current handling capability (±30 kW), and that its SoC is outside values that could compromise the reliability of the equipment.

5. Conclusions

This paper presents an advanced power smoothing method that enhances the effectiveness of the low-pass filter (LP), moving average (MA), and ramp-rate (RR) techniques for grid-connected photovoltaic systems. By monitoring and controlling the state of charge (SoC) of the supercapacitor energy storage system (SC-ESS), we effectively mitigate photovoltaic power fluctuations.
  • The LP and RR filters achieve a variance reduction of 11.4% and 10%, respectively, for initial SoC percentages above 80%, demonstrating superior power smoothing. Meanwhile, the MA filter reduces variance by 4.4% for the same initial SoC percentages, delivering more stable energy output.
  • By comparing the results provided in Table 2, Table 3 and Table 4, it can be seen that each method studied offers advantages and disadvantages depending on the parameters analyzed. LP and RR offer the best smoothing effectiveness. However, this performance penalizes the energy delivered to the grid. The MA method offers an acceptable level of smoothing, while sacrificing less PV energy to make it available to the grid.
  • The LP and RR filter excels in power smoothing, adapting energy delivery based on the SoC percentage. Conversely, the MA filter capitalizes on the SC-ESS’s higher energy storage capacity, increasing energy delivery.
  • These findings highlight the trade-off between power smoothing and energy delivery. The LP and RR filters achieve superior power smoothing, while the MA filter offers slightly higher energy delivery capabilities. Choosing between the methods depends on specific system requirements and priorities regarding power stability and energy availability.
In conclusion, this study provides valuable insights into enhancing power smoothing efficiency in renewable energy systems using supercapacitors and control algorithms. Further research is recommended to quantify the overall benefits in terms of the number of days with significant variability per year and the extra energy injected into the system, considering factors such as electricity prices, resale rates, and energy exchange hours.

Author Contributions

Conceptualization, P.A., R.A. and V.I.-M.; data curation, R.A. and D.O.-C.; formal analysis, P.A., D.O.-C., V.I.-M. and M.T.-V.; funding acquisition, M.T.-V.; investigation, E.V.-Á., P.A., R.A. and V.I.-M.; methodology, E.V.-Á., P.A., D.O.-C. and V.I.-M.; project administration, F.J.; resources, R.A., F.J. and M.T.-V.; software, P.A., D.O.-C., F.J. and M.T.-V.; supervision, F.J. and M.T.-V.; validation, E.V.-Á., P.A., R.A., D.O.-C. and M.T.-V.; visualization, V.I.-M. and M.T.-V.; writing—original draft, E.V.-Á., D.O.-C. and V.I.-M.; writing—review and editing, P.A., R.A. and F.J. All authors have read and agreed to the published version of the manuscript.

Funding

This research received no external funding.

Data Availability Statement

Data will be made available on request.

Acknowledgments

The author Paul Arévalo thanks the Call for Grants for the Requalification of the Spanish University System for 2021–2023, Margarita Salas Grants for the training of young doctors awarded by the Ministry of Universities and financed by the European Union—NextGenerationEU. This article partially reports the findings of the research work conducted by the author Edisson Villa in the framework of his doctoral studies in the Ph.D. program in Advances in Engineering of Sustainable Materials and Energies. Finally, the authors thank Universidad de Cuenca for easing access to the facilities of the Micro-Grid Laboratory of the Centro Científico Tecnológico y de Investigación Balzay (CCTI-B), for allowing the use of its equipment, and for authorizing members of its staff the provision of technical support necessary to carry out the experiments described in this article.

Conflicts of Interest

The authors declare no conflict of interest.

Appendix A. Supercapacitor-Based Energy Storage System (SC-ESS) Installed in the Micro-Grid Laboratory of the Universidad de Cuenca

Table A1. Supercapacitor bank.
Electrical ParametersValue and UnitsPower and Energy (Array)
Rated Capacitance130 F-
Maximum ESR DC, initial8.1 mΩ-
Rated Voltage56 V-
Absolute Maximum Voltage62 V-
Maximum Peak Current, 1 s1800 A-
Standby Current, maximum (Passive Balancing)120 mA-
Maximum Series Voltage750 V-
Mass, typical18 kg-
Volume (0.683 × 0.177 × 0.175)0.021156 m3-
Density850.83 kg/m3-
Usable Specific Power, Pd-28,600 W/kg
Impedance Match Specific Power, Pmax-59,400 W/kg
Specific Energy, Emax-34.1 Wh/kg
Stored Energy-622.6 Wh
Table A2. Three-phase bidirectional inverter of the SC-ESS.
DC InputAC OutputEfficiency
SoC voltage range (max. power)425–800 VDC--
Max. input voltage900 VDC--
Max. input current75 A--
Nominal AC voltage-3 × 400 VAC-
Frequency-50/60 Hz-
Rated AC power @25 oC-30 kW-
Maximum output current-52 A-
Total Harmonic Distortion (THD)-<3%-
Power Factor-Dynamically adjustable (PQ mode)-
Maximum efficiency--96%
Self-consumption standby--≤50 W

References

  1. Anghelache, C.; Anghel, M.G.; Iacob, Ș.V.; Pârțachi, I.; Rădulescu, I.G.; Brezoi, A.G. Analysis of the Situation of Renewable and Non-Renewable Energy Consumption in the European Union. Energies 2023, 16, 1338. [Google Scholar] [CrossRef]
  2. Augusto Pereira, H.; Fagner Cupertino, A.; Wu, J.-C.; Jou, H.-L.; Chang, C.-H. Power Conversion Interface for a Small-Capacity Photovoltaic Power Generation System. Energies 2023, 16, 1097. [Google Scholar] [CrossRef]
  3. Fregosi, D.; Pilot, N.; Bolen, M.; Hobbs, W.B. An Analysis of Storage Requirements and Benefits of Short-Term Forecasting for PV Ramp Rate Mitigation. IEEE J. Photovolt. 2023, 13, 315–324. [Google Scholar] [CrossRef]
  4. Xu, J.; Xie, B.; Liao, S.; Ke, D.; Sun, Y.; Jiang, X.; Yu, J. CVR-Based Real-Time Power Fluctuation Smoothing Control for Distribution Systems with High Penetration of PV and Experimental Demonstration. IEEE Trans. Smart Grid 2022, 13, 3619–3635. [Google Scholar] [CrossRef]
  5. Cano, A.; Arévalo, P.; Benavides, D.; Jurado, F. Comparative Analysis of HESS (Battery/Supercapacitor) for Power Smoothing of PV/HKT, Simulation and Experimental Analysis. J. Power Sources 2022, 549, 232137. [Google Scholar] [CrossRef]
  6. Wu, T.; Yu, W.; Guo, L. A Study on Use of Hybrid Energy Storage System along with Variable Filter Time Constant to Smooth DC Power Fluctuation in Microgrid. IEEE Access 2019, 7, 175377–175385. [Google Scholar] [CrossRef]
  7. Arévalo, P.; Benavides, D.; Tostado-Véliz, M.; Aguado, J.A.; Jurado, F. Smart Monitoring Method for Photovoltaic Systems and Failure Control Based on Power Smoothing Techniques. Renew. Energy 2023, 205, 366–383. [Google Scholar] [CrossRef]
  8. Benavides, D.; Arévalo, P.; Tostado-Véliz, M.; Vera, D.; Escamez, A.; Aguado, J.A.; Jurado, F. An Experimental Study of Power Smoothing Methods to Reduce Renewable Sources Fluctuations Using Supercapacitors and Lithium-Ion Batteries. Batteries 2022, 8, 228. [Google Scholar] [CrossRef]
  9. Benavides, D.; Arévalo, P.; Aguado, J.A.; Jurado, F. Experimental Validation of a Novel Power Smoothing Method for On-Grid Photovoltaic Systems Using Supercapacitors. Int. J. Electr. Power Energy Syst. 2023, 149, 109050. [Google Scholar] [CrossRef]
  10. Ma, W.; Wang, W.; Wu, X.; Hu, R.; Tang, F.; Zhang, W.; Han, X.; Ding, L. Optimal Allocation of Hybrid Energy Storage Systems for Smoothing Photovoltaic Power Fluctuations Considering the Active Power Curtailment of Photovoltaic. IEEE Access 2019, 7, 74787–74799. [Google Scholar] [CrossRef]
  11. Nempu, P.B.; Sabhahit, J.N.; Gaonkar, D.N.; Rao, V.S. Novel Power Smoothing Technique for a Hybrid AC-DC Microgrid Operating with Multiple Alternative Energy Sources. Adv. Electr. Comput. Eng. 2021, 21, 99–106. [Google Scholar] [CrossRef]
  12. Ma, W.; Wang, W.; Wu, X.; Hu, R.; Tang, F.; Zhang, W. Control Strategy of a Hybrid Energy Storage System to Smooth Photovoltaic Power Fluctuations Considering Photovoltaic Output Power Curtailment. Sustainability 2019, 11, 1324. [Google Scholar] [CrossRef] [Green Version]
  13. Krishan, O.; Suhag, S. A Novel Control Strategy for a Hybrid Energy Storage System in a Grid-Independent Hybrid Renewable Energy System. Int. Trans. Electr. Energy Syst. 2020, 30, e12262. [Google Scholar] [CrossRef]
  14. Saripalli, B.P.; Singh, G.; Singh, S. Supercapacitors Based Energy Storage System for Mitigating Solar Photovoltaic Output Power Fluctuations. World J. Eng. 2022. [Google Scholar] [CrossRef]
  15. Chong, L.W.; Wong, Y.W.; Rajkumar, R.K.; Isa, D. An Optimal Control Strategy for Standalone PV System with Battery-Supercapacitor Hybrid Energy Storage System. J. Power Sources 2016, 331, 553–565. [Google Scholar] [CrossRef]
  16. Kanehira, T.; Takahashi, A.; Imai, J.; Funabiki, S. A Comparison of Electric Power Smoothing Control Methods for Distributed Generation Systems. Electr. Eng. Jpn. (Engl. Transl. Denki Gakkai Ronbunshi) 2015, 193, 49–57. [Google Scholar] [CrossRef]
  17. Takahashi, A.; Kajitani, T.; Funabiki, S. Parameter Determination for Reducing ESS Capacity in PV Power Smoothing Control Using Spline Function. Electr. Eng. Jpn. (Engl. Transl. Denki Gakkai Ronbunshi) 2022, 215, e23367. [Google Scholar] [CrossRef]
  18. Sukumar, S.; Marsadek, M.; Agileswari, K.R.; Mokhlis, H. Ramp-Rate Control Smoothing Methods to Control Output Power Fluctuations from Solar Photovoltaic (PV) Sources—A Review. J. Energy Storage 2018, 20, 218–229. [Google Scholar] [CrossRef]
  19. Ali, A.; Raisz, D.; Mahmoud, K. Voltage Fluctuation Smoothing in Distribution Systems with RES Considering Degradation and Charging Plan of EV Batteries. Electr. Power Syst. Res. 2019, 176, 105933. [Google Scholar] [CrossRef]
  20. Al Shereiqi, A.; Al-Hinai, A.; Albadi, M.; Al-Abri, R. Optimal Sizing of a Hybrid Wind-Photovoltaic-Battery Plant to Mitigate Output Fluctuations in a Grid-Connected System. Energies 2020, 13, 3015. [Google Scholar] [CrossRef]
  21. Aryani, D.R.; Kim, J.S.; Song, H. Suppression of Pv Output Fluctuation Using a Battery Energy Storage System with Model Predictive Control. Int. J. Fuzzy Log. Intell. Syst. 2017, 17, 202–209. [Google Scholar] [CrossRef] [Green Version]
  22. Malamaki, K.N.D.; Casado-Machado, F.; Barragan-Villarejo, M.; Gross, A.M.; Kryonidis, G.C.; Martinez-Ramos, J.L.; Demoulias, C.S. Ramp-Rate Limitation Control of Distributed Renewable Energy Sources via Supercapacitors. IEEE Trans. Ind. Appl. 2022, 58, 7581–7594. [Google Scholar] [CrossRef]
  23. D’Amico, G.; Petroni, F.; Vergine, S. Ramp Rate Limitation of Wind Power: An Overview. Energies 2022, 15, 5850. [Google Scholar] [CrossRef]
  24. Atif, A.; Khalid, M. Fuzzy Logic Controller for Solar Power Smoothing Based on Controlled Battery Energy Storage and Varying Low Pass Filter. IET Renew. Power Gener. 2020, 14, 3824–3833. [Google Scholar] [CrossRef]
  25. Atif, A.; Khalid, M. Saviztky-Golay Filtering for Solar Power Smoothing and Ramp Rate Reduction Based on Controlled Battery Energy Storage. IEEE Access 2020, 8, 33806–33817. [Google Scholar] [CrossRef]
  26. Pontes, L.; Costa, T.; Souza, A.; Dantas, N.; Vasconcelos, A.; Rissi, G.; Dias, R.; Mohamed, M.A.; Siano, P.; Marinho, M. Operational Data Analysis of a Battery Energy Storage System to Support Wind Energy Generation. Energies 2023, 16, 1468. [Google Scholar] [CrossRef]
  27. Ochoa, D.; Martinez, S.; Arévalo, P. A Novel Fuzzy-Logic-Based Control Strategy for Power Smoothing in High-Wind Penetrated Power Systems and Its Validation in a Microgrid Lab. Electronics 2023, 12, 1721. [Google Scholar] [CrossRef]
  28. Kumar, D.S.; Maharjan, S.; Albert; Srinivasan, D. Ramp-Rate Limiting Strategies to Alleviate the Impact of PV Power Ramping on Voltage Fluctuations Using Energy Storage Systems. Solar Energy 2022, 234, 377–386. [Google Scholar] [CrossRef]
  29. Espinoza, J.L.; Gonzalez, L.G.; Sempertegui, R. Micro Grid Laboratory as a Tool for Research on Non-Conventional Energy Sources in Ecuador. In Proceedings of the 2017 IEEE International Autumn Meeting on Power, Electronics and Computing, ROPEC, Ixtapa, Mexico, 8–10 November 2017; pp. 1–7. [Google Scholar] [CrossRef]
Figure 1. Representative scheme of the proposed methodology.
Energies 16 05386 g001
Figure 2. SC-ESS from the Micro-Grid laboratory: (a) the bank of supercapacitors (left) and the cabinet with the power electronics converter (right) and (b) real-time performance of the inverter under CSC mode.
Energies 16 05386 g002
Figure 6. Flowchart for implementing conditionals to optimize the charging/discharging of an SC-ESS.
Energies 16 05386 g006
Figure 7. Grid-connected microgrid at the Micro-Grid laboratory (CCTI-B).
Energies 16 05386 g007
Figure 8. Architecture of connected equipment at CCTI-B.
Energies 16 05386 g008
Figure 9. Photovoltaic power curve of a Type I day with high variability.
Energies 16 05386 g009
Figure 10. Photovoltaic power curve of a Type II day with low variability.
Energies 16 05386 g010
Figure 11. Emulated photovoltaic solar generation ( P P V E M ) in the laboratory of the Type I curve ( P P V ) for real-time testing.
Energies 16 05386 g011
Figure 12. Results of the response of SC-ESS (Case 1) to input PV solar power fluctuations PPV with the LP filter and its compensated PV solar power response PPVC.
Energies 16 05386 g012
Figure 13. Results of the response of SC-ESS (Case 2) to input PV solar power fluctuations P P V with the LP filter and its compensated PV solar power response P PVC .
Energies 16 05386 g013
Figure 14. Results of the response of SC-ESS (Case 3) to input PV power fluctuations P P V with the LP filter and its compensated PV solar power response P PVC .
Energies 16 05386 g014
Figure 15. Response of SC-ESS to the LP filter under its three S o C S C , conditions: Case 1 with S o C S C around 90%. Case 2 with S o C S C around 50%, and Case 3 with S o C S C lower than 20%.
Energies 16 05386 g015
Figure 16. Results of the response of SC-ESS (Case 1) to fluctuations in the input PV power P P V with the MA filter and its compensated PV power response P P V C .
Energies 16 05386 g016
Figure 17. Results of the response of SC-ESS (Case 2) to fluctuations in the input PV power P P V with the MA filter and its compensated PV power response P P V C .
Energies 16 05386 g017
Figure 18. Results of the response of SC-ESS (Case 3) to fluctuations in the input PV power P P V with the MA filter and its compensated PV power response P P V C .
Energies 16 05386 g018
Figure 19. Response of SC-ESS to the MA filter in its three S o C S C conditions: Case 1, greater than around 90%, Case 2, around 50%, and Case 3, less than 20%.
Energies 16 05386 g019
Figure 20. Results of the response of SC-ESS (Case 1) to fluctuations in the input PV power P P V with the RR filter and its compensated PV power response P P V C .
Energies 16 05386 g020
Figure 21. Results of the response of SC-ESS (case 2) to fluctuations in the input PV power P P V with the RR filter and its compensated PV power response P P V C .
Energies 16 05386 g021
Figure 22. Results of the response of SC-ESS (case 3) to fluctuations in the input PV power P P V with the RR filter and its compensated PV power response P P V C .
Energies 16 05386 g022
Figure 23. Response of SC-ESS to the RR filter in its three S o C S C conditions: Case 1, around greater than 90%, Case 2, around 50%, and Case 3, less than 20%.
Energies 16 05386 g023
Table 2. Results of PV power output with and without the LP filter for power smoothing.
(%) S o C S C InitialVariance without SC-ESSVariance with SC-ESSVariance Reduction (%)PV Energy Delivered without SC-ESS ( k W h )Delivered Compensated PV Energy with
SC-ESS ( k W h )
Energy Difference ( k W h )
S o C S C > 80 2.992.6511.48.248.140.09
S o C S C = 50 2.922.5612.38.428.260.15
S o C S C < 20 2.992.4916.78.197.990.19
Table 3. Results of PV solar power output with and without MA filter for power smoothing.
(%) S o C S C InitialVariance without SC-ESS Variance with SC-ESS Variance Reduction (%) PV Energy Delivered without
SC-ESS ( kWh )
Delivered Compensated PV Energy with SC-ESS ( kWh )Energy Difference ( k W h )
S o C S C > 80 2.972.844.48.288.200.07
S o C S C = 50 2.982.699.78.298.160.13
S o C S C < 20 2.942.688.88.288.110.17
Table 4. Results of PV solar power output with and without RR filter for power smoothing.
(%) S o C S C InitialVariance without
SC-ESS
Variance with
SC-ESS
Variance Reduction (%)PV Energy Delivered without
SC-ESS ( kWh )
Delivered Compensated PV Energy with
SC-ESS ( kWh )
Energy Difference ( k W h )
S o C S C > 80 2.902.619.998.518.410.10
S o C S C = 50 2.912.5014.058.438.300.13
S o C S C < 20 2.912.5512.358.518.350.17
Table 5. Summary of the advantages and disadvantages of the implemented assessed power smoothing filter methods.
Moving Average FilterLow-Pass FilterRampe Rate Filter
AdvantagesEasy to implementPreserves the characteristics of the original power signalSmooths power variations in a controlled and gradual manner
Can reduce random power noiseSuppresses high-variability power noiseAvoids abrupt changes in generated power
Eliminates power peaks and smooths variable power signalsImproves the quality of the power output to the gridImproves power output stability
Maintains the S o C S C levels above 50%
DisadvantagesNot suitable for power signals with rapid changesIt can overly smooth the power signal in its output to the gridRequires additional calculations to limit the rate of power change
Ineffective in reducing high-variability power noiseDelay in the filtered power signalMay limit responsiveness to rapid changes in generated power
Prone to be affected by extreme valuesRequires more complex calculationsRequires linear and simple calculations
Less effective in eliminating impulsive power noise Does not eliminate power noise; it focuses on smoothing variations
Maintains   S o C S C levels below 50% Maintains   the   S o C S C at medium levels Maintains   S o C S C levels below 50%
Disclaimer/Publisher’s Note: The statements, opinions and data contained in all publications are solely those of the individual author(s) and contributor(s) and not of MDPI and/or the editor(s). MDPI and/or the editor(s) disclaim responsibility for any injury to people or property resulting from any ideas, methods, instructions or products referred to in the content.

