Abstract
The lack of an EV charging infrastructure is of the top five barriers preventing the adoption of EVs on a large scale. A long charging time is also one of the five barriers, according to the latest survey published by the IEA in 2021. The estimated increase in demand for EVs is a big challenge in many countries all around the world. This challenge exists in many EU and Middle East countries. The main reason for this problem is the requirement of huge funds to install enough public charging points that result in satisfactory charging services. Hence, the phase-out plans of internal combustion engine (ICE) vehicles can be carried out successfully and smoothly. Unfortunately, there is a trade-off between the cost of installing charging points and EV charging time. Therefore, it is important to optimize both factors simultaneously. This way, the charging services can be provided at the minimum possible cost and at a satisfactory level of quality. This study determines the optimum ratio of the number of chargers to the number of EVs in a certain province. The optimal number of chargers that are necessary to optimally serve a certain number of EVs has been determined. Two well-known evolutionary search techniques have solved the optimization problem: particle swarm optimization (PSO) and genetic algorithms (GA). Both algorithms have succeeded in providing many optimal charging infrastructure scenarios. Hence, the decision maker can select the most convenient scenario from several alternatives based on the available budgets and the most convenient charging time.
1. Introduction
Electric vehicles (EVs) are gradually substituting conventional combustion engine (ICE) vehicles in several countries. According to Figure 1, the global EV market size in 2022 was approximately 206 billion USD [1]. It is estimated to exceed 1716 billion USD by 2032. For the period from 2023 to 2032, the forecasted compound annual growth rate (CAGR) is approximately 23% [1].
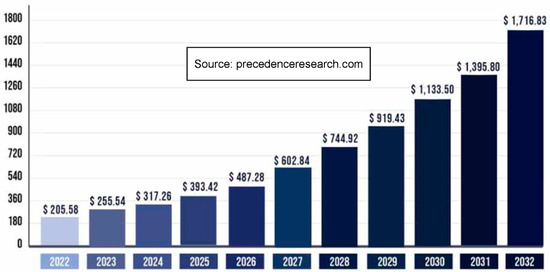
Figure 1.
Global electric vehicle market size for the period 2022–2032 (USD billion).
However, this paradigm shift faces many obstacles, such as the high capital cost of EVs, the high replacement cost of EV batteries and relatively long charging times. In addition, the insufficient number of public charging points and stations is among the most significant challenges.
1.1. Top Barriers to EV Adoption
According to the latest survey published by the International Agency of Energy (IEA) in Paris in 2021 [2], the top five barriers that prevent the adoption of EVs on a large scale are the lack of EV charging points and stations [2,3]; the lack of suitable types of EVs; high capital costs; long charging times; and immaturity of regulations and policies [2,3,4,5]. To understand this problem, we have to observe the current situation of the EU, where 185,000 public charging points (PCP) are currently installed. However, by 2025, the installed PCP should be increased to 1.3 million. By 2030, the PCP should exceed 3 million to cover the estimated increase in demand for EVs. This is a significant challenge due to the huge funds that should be assigned to carry out such projects. The problem also exists on a large scale in the Middle East.
1.2. KSA Market Status
Some published data related to the Kingdom of Saudi Arabia’s (KSA) market status are summarized in Table 1, where the KSA intends to fabricate approximately 150,000 EVs by 2025/2026 under a CEER trademark [6,7,8,9]. In Riyadh, the capital of the kingdom, there are around 4.8 million gasoline-operated vehicles [10]. The target is to replace 30% of these vehicles with EV counterparts by 2030 [11]. Owing to these numbers, the KSA is considered one of the most promising markets in the Middle East. It can be one of the EV technology hubs in the zone, where many leading Technology Transfer Centers (TTC) can be established. Thus, there are huge investment opportunities in many EV technologies, including the charging infrastructure, as there is significant market demand for such stations.

Table 1.
Summary of KSA market status.
2. Literature Review
Considerable research activities have been carried out to tackle the existing challenges and help accelerate phase-out plans for ICE vehicles. Ref. [12] provides a literature review of the problems of EV charging, focusing on the difficulties during on-trip charging and proposing a solution to such problems. In [13], the authors developed a model for DC fast charging stations to quantify the effect of many parameters on the station loading and the quality of the provided service using a Monte Carlo analysis. The authors of [14] present a technology overview of the extremely fast charging infrastructure, addressing design considerations and providing a review of the power electronics converter topologies utilized to develop such extremely fast chargers. Ref. [15] proposed a model to tackle some design problems of the charging infrastructure to determine the optimum capacity and optimum location of charging stations. An event simulator was developed using Python to assess the proposed solutions. The authors of [16] proposed a coordinated planning methodology for extremely fast charging stations and power distribution networks considering on-site batteries to reduce the energy use of the extra fast charging stations.
The authors of [17] proposed a comprehensive planning and analysis tool for the deployment of EV Charging Stations (EVCS), including power generation from photovoltaics (PVs). The output is the size and installation times of EV chargers including PV infrastructure. A review of the development of EV charging infrastructure in the UK and a technical review of the advanced approaches of EV demand management have been conducted in [18,19], respectively. In [20], an assessment method was proposed for the future of EV charging infrastructure scenarios for long-distance transport in Sweden.
An optimization program was proposed in [21] to represent the design and utilization management of EV charging infrastructures. Moreover, the urban charging infrastructure for electric road freight and data-driven planning for the EV charging infrastructure were investigated as case studies for Cambridge, UK and Sydney, Australia in [22,23], respectively. A dynamic model for an EV charging infrastructure was proposed in [24], where the model relies on a finite element approach. In [25,26,27,28], optimal siting and location of EV chargers were investigated, and a multi-criteria model for long-term placement was proposed in [25]. In [26], traffic network and power distribution system were taken into consideration. The authors of [27] studied a radial distribution network. In [28], the study addressed the optimal placement of chargers in an active distribution network. Ref. [29] proposed a robust planning model for EV charging stations to address placement problems considering road traffic uncertainty. In addition, an open-source algorithm for smart charging of EV fleets was proposed in [30]. A power management algorithm for EV parking lots was proposed in [31]. The algorithm was based on fuzzy logic.
The authors of [32] proposed a dynamic wireless charging (DWC) coordination strategy that allocates the EVs demanding energy to the most optimal lanes, resulting in a load profile that is approximately flattened across the charging lanes. The frequent-charging characteristic of DWC and their effects on the battery lifetime were investigated in [33]. In addition, a battery degradation model was also incorporated. A scheduling scheme for EV charging based on the internet of vehicles (IoV) was proposed in [34]. The target is to minimize charging costs while satisfying the constraints of the charging time requirement of EVs and the resources of the charging station. The authors of [35] proposed a low voltage direct current charging network for plugin EVs, including an energy management system (EMS) that is capable of planning and operating the charging network at the minimum charging costs. The authors of [36] proposed the term vehicle-directed smart charging (VDSC), referring to strategies to charge EVs in a more intelligent way, reducing the burden on the electric grid and avoiding the need for any additional infrastructure. In [37], a blockchain-based efficient charging station selection protocol was proposed to ensure the security, privacy and comfort of EV users. Ref. [38] addressed uncertain EV availability using regression models trained on historical data to predict EV departures. The priority mechanism considers EVs that require charging urgently. In [39], the bidirectional energy transferring capability between vehicles (V2V) was employed as an auxiliary solution to charge EVs on request. Optimum routing and scheduling scenarios have been achieved by heuristic algorithms. The authors of [40] presented a blockchain-based energy trading architecture for electric EVs within smart cities. Ref. [41] presented a comprehensive review of EV technology, including EV chargers and different topologies. The concept of inductive power transfer (IPT) for charging movable EVs was also explained. A comprehensive review for the use of supervised and unsupervised machine learning was conducted in [42]. It employed deep neural networks to analyze and predict EV charging behavior, which was also described in [43]. In [44], a data-driven simulator was designed to help with the implementation of online scheduling algorithms for EV charging. This tool significantly reduces the software programming burden on researchers and exposes them to practical EV charging issues.
Many research activities have been conducted in the area of smart charging of EVs, as indicated in [45,46,47,48,49,50,51]. Ref. [52] proposed a new framework to identify the fleet size capability of a power network considering economic and emission dispatch. The authors of [53] conducted a study on the investment in EV charging points for parking, granting a higher priority to the EV that needs charging compared with the ICE conventional vehicle.
3. Main Objective of the Study
This case study attempts to find the optimum ratio between the number of public charging points and the number of electric vehicles. Consequently, the suitable number of EV chargers that should be installed in a certain province to secure the charging requirements of a specific number of EVs can be determined. No concrete or unique value can accomplish this task, not only because many variables and parameters affect the computation of this ratio, but also because some criteria can be set when computing this ratio. Some of these criteria are the minimization of cost, the minimization of charging time, or the optimization of both simultaneously. Accordingly, instead of a single (unique) solution, optimum scenarios can be achieved. This way, decision-makers can select the most convenient scenario among several alternatives. The conducted case study is assigned to the KSA market, as one of the emerging and promising markets in the Middle East. Figure 2 briefly demonstrates the main objective of the conducted case study.
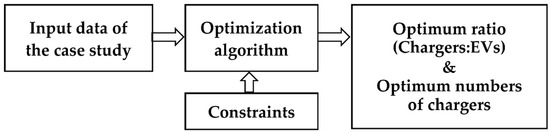
Figure 2.
The main objective of the study: searching for the optimum ratio (Chargers:EVs).
4. Methods
This paper has adopted an evolutionary search approach to determine the optimum scenarios of EV charging mix schemes. The optimization algorithm minimizes the total costs and charging time simultaneously. It takes other criteria into consideration. This paper provides several optimum values of the ratio between the number of public charging points and the number of EVs (Chargers:EVs). Hence, EVs can be served optimally.
4.1. Charging Mix Scheme
The charging mix approach or charging mix scheme is based on the utilization of different types of chargers to charge the same EV battery (See Figure 3). Generally, there are two major types of chargers: home-residential chargers (AC chargers of few kilowatts), and public chargers (DC fast chargers and ultra-fast chargers).
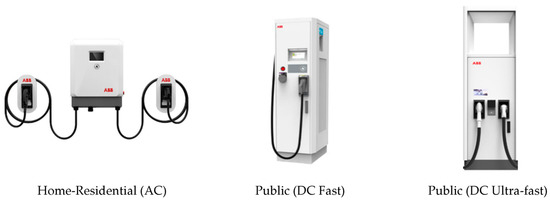
Figure 3.
Different types of EV chargers (typical types of chargers from ABB).
Typical ratings are 5 kW and 25 kW for residential AC chargers and 50 kW and 150 kW for public DC chargers. In the case of an EV battery with a capacity of 75 kWh, it can be charged with any of the four types but with different charging durations as illustrated in Table 2.
Table 2.
Maximum charging time of a 75 kWh EV battery using different chargers.
Off-board DC fast chargers and ultra-fast chargers bypass the on-board charger built into the EV (equipped with the EV). Therefore, the off-board DC chargers directly charge the EV battery bank, which leads to fast charging, owing to the power level of the DC charger. Thus, the theoretical maximum charging times, summarized in Table 2, achieved by different charger ratings, are applicable.
4.2. Trade-Off between Cost and Quality of Service
Two possible extremes exist. In the first extreme, if we install a limited number of charging points to reduce the overall cost, the resultant charging time will be too high, and the station’s contention (congestion) would be unaffordable. Thus, owners and drivers of EVs will lose confidence in EV technology, and the market acceptance of this paradigm shift could be delayed. Simultaneously, the phase-out plans of ICE vehicles would be subjected to inevitable delay. In the second extreme, if we install an excessive or large number of fast charging stations than are needed to reduce the overall charging time, to achieve drivers’/owners’ satisfaction and fulfil the commitments to the community, the overall costs will become too high. Thus, huge budgets and investments should be assigned to implement these projects, which would negatively affect investment in other sectors. Therefore, there is a trade-off between cost and quality of service. Hence, it is important to study this issue carefully, to provide the decision-makers with several choices and optimum scenarios that can be applied. Consequently, they can select from several alternatives. One of the possible solutions to such a challenge is to optimize both cost and charging time simultaneously. This way, the necessary charging services are provided with the minimum possible budgets at the minimum possible charging time.
4.3. Problem Formulation
There is a trade-off between cost and charging time. The main issue this study aims to address (determining of the optimum scenarios for EV charging) can be converted into a mathematical optimization problem that aims to minimize simultaneously both the overall cost and the charging time. The target is to search for the optimum number(s) of EV charging points that can optimize a customized objective function (). In general, the objective function should have at least two major terms: the total cost term and the total charging time term. It should also be subjected to some constraints so that the optimization algorithm yields realistic results.
where:
- J is the customized objective function to be minimized.
- L1, L2, L3, L4 are the number of chargers whose power ratings are 5 kW, 25 kW, 50 kW and 120 kW, respectively.
- is the total cost function (see Appendix A).
- is the total charging time function (see Appendix A).
The 5 kW and 25 kW chargers are home and residential chargers that can be purchased directly by owners or by the government through incentives or green loans. While the 50 kW and 120 kW chargers are public chargers. They are installed by the government or by investors.
Each term of the objective function can have a certain weighting factor, as indicated in Equation (4). The weight factor is a value that lies between 0 and 1. The selection and setting of the weight factors are based on the degree of importance and the relative priority of each term.
where:
- is the objective function term concerning the total cost.
- is the objective function term concerning the total charging time.
- is the weight factor of the total cost term.
- is the weight factor of the total charging time term.
weight factors .
Table 3 illustrates three different cases: crowded cities, countries with limited funds, and the same degree of importance (terms with equal priority). The proper action and the corresponding possible values of the weight factors are summarized in Table 3.
Table 3.
Selection criteria of weight factors.
The total cost and the total charging time are functions of the number of chargers of each type that have been chosen in this case study. The total cost term of the objective function () is the sum of the total cost of the individual type of chargers multiplied by the concerning weight factor, as given by Equations (5) and (6).
where:
- is the objective function term concerning the total cost.
- is the weight factor of the cost term of chargers of type i
- is the total cost of all chargers of type i:
Similarly, the total charging time term of the objective function () is the sum of the total charging time of the individual type of chargers multiplied by the concerning weight factor, as described in Equations (7) and (8).
where:
- is the objective function term concerning the total charging time.
- is the weight factor of the charging time term of chargers of type i
- is the total charging time of all chargers of type i.
Moreover, the objective function can involve any customized terms to be optimized directly, such as the ratio (Chargers:EVs), and/or minimization of the number of any specific type of chargers. Whatever the objective function, the optimization algorithm should be subjected to some constraints, such as the upper limit of the cost (budget); the upper limit of the number of any type of chargers (this is important in the case of home chargers where only one home charger is operating at a time, because it does not make sense to have more than one home charger); and the minimum value of the total generated charging power. This means the algorithm searches for the number of chargers such that the objective function is minimized, provided that the constraints are not violated.
For example, if we leave the optimization algorithm without constraints, it will determine a very small number of chargers to reduce the cost, or a very large number of chargers to limit the charging time. Table 4 shows the optimization algorithm running without constraints.
Table 4.
The action of optimization algorithm when some constraints are not involved.
Accordingly, adding proper constraints is very important for the success of the optimization algorithm in achieving realistic and applicable results.
Therefore, the optimization problem is described as follows:
- The applied (considered) constraints are:
- Number of home chargers of 5 kW: ;
- Number of residential chargers of 25 kW: ;
- Number of public chargers of 50 kW: ;
- Number of public chargers of 120 kW: ;
- Charging power: .
4.4. Variables and Parameters Affecting the Study
The determination of the adequate number of EV chargers and the corresponding (Chargers:EVs) ratio depends on many variables and parameters. A summary of the major parameters and variables that should be taken into consideration when determining the optimum (Chargers:EVs) ratio is presented in Table 5.
Table 5.
Main variable and parameters affecting the case study.
4.5. Evolutionary Search Algorithms
Many evolutionary search algorithms exist to solve complex optimization problems that are difficult to solve with traditional analytical methods. Some of the commonly used algorithms are particle swarm optimization (PSO), and genetic algorithms (GA). Both have been selected to solve this optimization problem, owing to the many successful applications of PSO and GA [54,55,56,57,58,59,60]. The following sub-sections address briefly both optimization algorithms and their selected parameters (types and numerical values).
- Particle Swarm Optimization
PSO is considered to be one of the evolutionary search techniques that rely on iterative and evolved searching for the optimum solution(s) among several candidate solutions. PSO was first intended to simulate the social behavior of birds when they fly for long distances in search of food. The algorithm was simplified by Eberhart and Kennedy. They observed its capability to perform (operate) as an optimization technique. Two equations were proposed to describe the velocity and position of each bird (particle) in the swarm. Updates of both the velocity and position of each particle are based on two major factors: self-opinion (self-position) of the particle, which is called the local best value relative to the target; and the global opinion of the swarm, which is called the global best value relative to the target achieved by the flock. The new velocity also depends on an inertia factor, which affects the rate of approaching the desired target and oscillates around it. Therefore, each particle modifies its position and velocity according to these factors. The velocity and position of each particle are updated at each iteration by Equations (11) and (12) [54,55]:
where xm is the position of the m-th particle in the search space, vm is the velocity of the m-th particle, w is the inertia of the particles and α and β are uniformly distributed positive random vectors. L is the particle’s best position, G is the global best position achieved by all particles and k is the instantaneous number of each iteration [57]. A summary of the parameters of the employed PSO algorithm is presented in Table 6, while the flowchart of the PSO algorithm is shown in Figure 4 [55]. The main information about the simulation environment is summarized in Appendix B.
Table 6.
Parameters of the employed PSO algorithm.
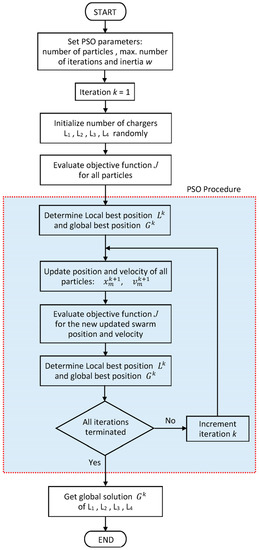
Figure 4.
Flowchart of the PSO algorithm.
- b.
- Genetic Algorithm
The GA is based on natural selection, borrowed from the evolution of biology [55,58]. The process of producing the next generation from the current population to obtain the global solution is composed of three main steps: selection, crossover and mutation. The selection rules select the individuals, called parents, that contribute to the next generation’s population. The crossover rules combine two parents to produce children for the next generation [55,59,60]. The GA modifies the population of individual solutions repeatedly. At each step, the GA selects individuals randomly from the current population to be parents. It uses them to produce children for the next generation [59,60]. The population evolves toward an optimal solution based on the best-fitted individuals’ fitness. The parameters of the employed GA are presented in Table 7, while the flowchart of the GA algorithm is shown in Figure 5 [55]. See Appendix B to recognize the main information of the simulation environment of the employed optimization software.
Table 7.
Parameters of the employed GA algorithm.
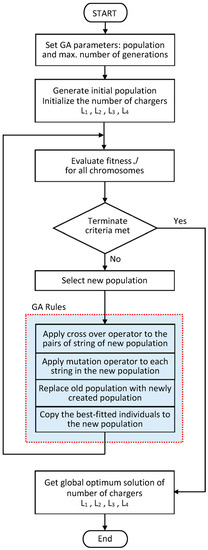
Figure 5.
Flowchart of the GA algorithm.
5. Assumptions and Inputs of the Study
The numerical values of the different inputs of the case study are summarized in Table 8, where the number of vehicles is to be 150,000 EVs, emulating the case of CEER. Four types of chargers are employed in this study: residential (charger_1 is 5 kW and charger_2 is 25 kW) and public (charger_3 is 50 kW and charger_4 is 120 kW). Prices are obtained from internet searches of many websites. There is a variety of prices. But the mentioned prices are for chargers of brand names.
Table 8.
Summary of inputs of the case study (operating conditions).
The estimated EVs’ daily utilization profile varies from one city to another and from one province to another [61,62,63,64]. Also, it varies from working days to weekends. The estimated daily travelled distances during working days and weekends are illustrated in Figure 6 and Figure 7, respectively. It is Gaussian distribution-like, where most people drive their EVs for distances between 25 km and 100 km.
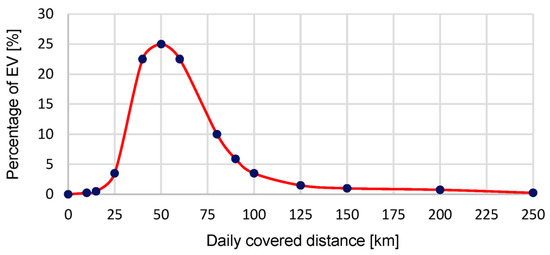
Figure 6.
EVs’ daily utilization profile (working days).
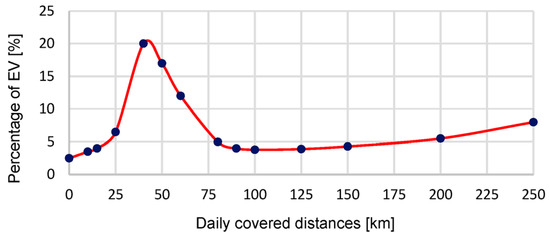
Figure 7.
EVs’ daily utilization profile (weekends).
The attitude of people is slightly different during weekends, as many people prefer to spend the weekend in the surrounding areas inside the desert or near seashores, while a considerable percentage of the habitants travel to the holy cities such as Makkah and Madinah. Refs. [61,62,63,64] are useful guides to determine the EV utilization profiles.
6. Results
This section presents and discusses some numerical results obtained from the optimization algorithms based on the operating conditions presented in Table 8.
6.1. Extreme Optimization Results
The two extremes of the optimization process are presented in Table 9, where the middle column contains the numerical results corresponding to the minimization of the total cost only. The right column contains the numerical results corresponding to the minimization of the total charging time only.
Table 9.
Optimization results for the operating conditions of Table 8.
Owing to the obtained results, the cost is 186.67 million USD in the case of minimizing the total cost only. The resultant numbers of the four types of EV chargers are presented in the left column. The resultant ratio is (1:167). The cost has raised to 720 million USD when the total charging time is minimized only. The corresponding numbers of the four types of EV chargers are presented in the right column. The resultant ratio is (1:5).
6.2. Optimization Results for Minimum Costs and Charging Time Simultaneously
Between these two extremes, various optimum scenarios have been achieved when optimizing both cost and charging time simultaneously. Hence, decision-makers can select the most appropriate scenario(s) to apply, owing to their policies and priorities. Some of these optimum scenarios are presented in Table 10. By observing the results of Table 10, various applicable values of the ratio (Chargers:EVs) are achieved at different levels of costs. To improve the ratio, the budget should be increased. Meanwhile, the corresponding total charging time is decreased. The obtained scenarios are reasonable and applicable.
Table 10.
Optimization results with different criteria.
6.3. Comparison with the Typical Ratios of Many Countries
The ratio (Chargers:EVs) of some countries is summarized in Table 11, based on data and reports recently published by the IEA [2]. Korea has the highest ratio (1:2); one charger serves two EVs. The lowest ratio (1:52) is in New Zealand; one charger serves every 52 EVs [65]. Meanwhile, the recommended value by the EU is (1:10). Few EU countries have accomplished this recommendation so far [2,65].
Table 11.
Typical values of the ratio (Chargers:EVs) in some countries.
The obtained results from this case study can be compared with the typical values of this ratio registered in many countries that are given in Table 11. Some optimum values of the ratio determined by this case study are presented in Table 12. The obtained values of the ratio (Chargers:EVs) by the optimization algorithms are reasonable and are in accordance with the typical values of the ratio in many countries.
Table 12.
Optimization results of minimized cost and charging time simultaneously.
The results of Table 12 have been plotted in Figure 8. The relation between the cost and the number of EVs served by one public charger can be observed. Moreover, the corresponding vehicle charging time is plotted in Figure 9 as a function of the number of EVs served by one public charger.
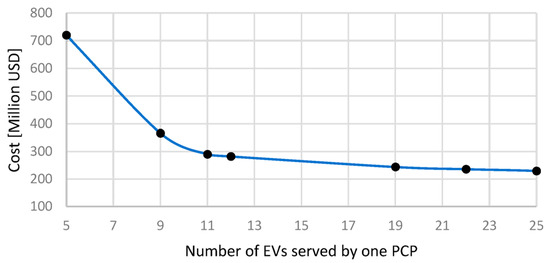
Figure 8.
Cost versus the number of EVs served by one public charger.
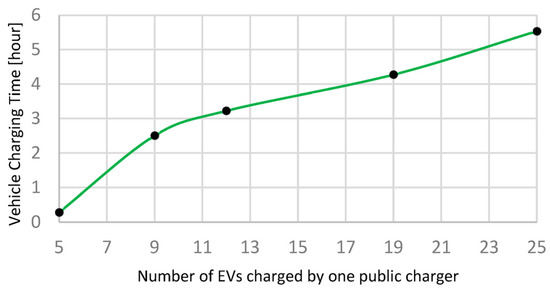
Figure 9.
Vehicle charging time versus the number of EVs served by one public charger.
6.4. Optimum Range of the Ratio (Chargers:EVs)
To recognize the optimum range of the ratio (Chargers:EVs) based on the obtained results of Table 10, a new evaluation function G is defined. G is computed as the sum of normalized values of both total cost and the corresponding vehicle charging time (see Appendix A for the computations of total cost and total charging time). The function G and its terms are calculated using Equations (13) to (16):
The function G is calculated for each numerical value of the ratio (Chargers:EVs). The results have been plotted in Figure 10, together with the normalized values of total cost and vehicle charging time. Owing to the results of Figure 10, the optimum range of the ratio is between (1:9) and (1:12). This is because the function G has its minimum values at this range.
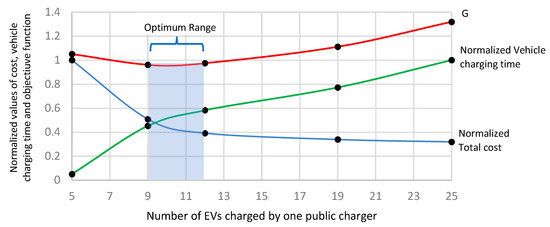
Figure 10.
Normalized values of the total cost, vehicle charging time and the function G versus the number of EVs served by one public charger.
Owing to the results of Table 13, the ratio (1:9) results in the lowest relative vehicle charging time. Meanwhile, the ratio (1:12) results in the minimum relative total cost. Hence, the ratio (1:12) is the most convenient if the minimum cost criterion has the highest priority. The ratio (1:9) will be the most convenient if the minimum charging time criterion has the highest priority. However, the ratio (1:11) can also be considered a satisfactory optimum value, because it yields the medium total cost and medium vehicle charging time compared with the other ratios (1:9) and (1:12).
Table 13.
Numerical values of total cost and vehicle charging time at the optimum range of the ratio (Chargers:EVs).
6.5. Additional Cost (Power Generation Cost)
So far, the total costs of the charging infrastructure do not include the power generation cost that are required to charge all EVs. The power generation cost can be considered an additional fixed cost added to the cost of establishing the charging infrastructure. Owing to the optimization results provided in Table 10, the total needed charging power is 2.432 GW approximately. This value is the worst-case condition assuming the worst-case SOC is (0% to 100%).
Therefore, the worst-case scenario is to install new power stations with a total capacity of 2.432 GW. Fortunately, the power generation capacity of KSA in 2021 is around 83 GW [65,66,67,68]. Therefore, the required power to charge all EVs in the worst-case scenario represents less than 3% (2.93%) of the total power generation capacity of the KSA. This percentage does not constitute a severe burden on the national electric grid of the KSA.
Moreover, if we assume another scenario by considering only 70% of EVs are to be charged simultaneously (since not all EVs are to be charged at the same time), the resultant required charging power is 1.7 GW. This value represents 2.05% of the total power generation capacity of the KSA. Again, this is a negligible burden on the national electric grid of the KSA.
However, in many other countries, the power generation costs cannot be discarded from the computations of the overall cost. Since the required charging power is 1.7 GW (in the second scenario), the corresponding power generation costs should be added to the EV charging infrastructure cost. In this case, two power stations (each with a capacity of 850 MW) can provide the necessary charging power for the 150,000 EVs considered in this case study.
6.6. Recommendations for Highways
For highways, the most convenient types of chargers are DC fast chargers, DC ultra-fast chargers and on-demand chargers. Thus, after determining the number of DC fast chargers, some of them are reserved for highways as on-demand chargers, which are movable vehicles for securing the highway. For highways, governments should sacrifice some cost to achieve other goals, such as fulfilling commitments to the community and EV owners, securing the highways, accelerating the phase-out plans for internal combustion engine (ICE) vehicles, helping people to accept this paradigm shift and facilitating the future development of the surrounding and nearby areas.
For charging stations outside cities, the most convenient types of chargers are DC fast chargers. The resultant full charging time is less than one hour. This can be a good opportunity for investment, where the EV charging station can accommodate other activities such as restaurants, playgrounds, coffee shops, mosques and others.
7. Discussion
The accuracy of the obtained results depends on the accuracy of the input data. It can be enhanced if more real data and surveys about drivers’ attitudes, rate of driving and daily covered distances are updated. In this case, many surveys and questionnaires are needed to collect this new data.
The developed optimization algorithms can accommodate any type of EV charger with any rating. Also, it can accommodate any EV utilization profiles. Moreover, it has great flexibility in handling any SOC of the EVs batteries, including the initial and desired final states.
The objective function is tailor-made, and can be customized to account for any parameter to be optimized, in addition to cost and charging time. Also, each term can have a weight factor to achieve different priorities based on the operating conditions.
The optimization algorithm should be subjected to some important constraints, such as the minimum value of the generated charging power, the upper limit of the budget and the upper limit of home chargers that should not exceed the number of vehicles.
The designer can set any other important constraints, such as a specific upper limit for the vehicle charging time. Some of these constraints are essential to achieve realistic optimization results. For example: in the case of home chargers, if the optimization algorithm leads to a number of home chargers greater than the number of vehicles, this will not be a realistic result, because it does not make sense to utilize two or three home chargers to charge a single vehicle. Thus, an upper limit of home chargers must be considered as a constraint. In this study, the utilized constraints are the upper limits of chargers and the minimum required charging power (as mentioned at the end of Section 4.3).
For highways, some factors rather than the cost could be taken into consideration. The government can sacrifice some of the cost to achieve other goals such as securing the highways, a smooth transition to the EV era, the successful implementation of the phase-out plans for conventional ICE vehicles and convincing people to discard conventional vehicles.
In addition, many economic and commercial locations can be integrated with charging points, such as restaurants, coffee shops, mosques etc. This can facilitate the future development of surrounding and nearby areas.
On-demand charging services can be integrated with highway stations so that a high level of security is provided to the EV owner. This way, they can accept this paradigm shift in transportation systems. This would be considered the next generation of flatbeds.
The investment in EV charging hubs and infrastructure has considerable opportunities and looks feasible, as the market is still thirsty for such charging stations.
8. Conclusions
This paper employs evolutionary search optimization techniques to determine the optimum values of the EV charging point to be installed in a certain province. Thus, an optimal EV charging service is provided. The case study has investigated the KSA market, which is considered one of the promising markets in the Middle East.
The employed computational approach provides several options and scenarios for the number of chargers. The ratio (Chargers:EVs) is optimized based on criteria such as minimum cost only, minimum charging time only and the minimization of both the total cost and the total charging time simultaneously.
When the total cost is only minimized, the resultant cost of the charging infrastructure is 186.67 million USD. The total charging time is 1.325 Mega hours. Hence, the average vehicle charging time is 8.83 h. When the total charging time is only minimized, the cost is raised to 720 million USD, while the resultant charging time is dramatically reduced to 0.04 Mega hours. The corresponding average vehicle charging time is dramatically reduced to 0.28 h.
In the case of minimizing the total cost and the total charging time simultaneously, the optimization algorithms have provided several optimum options (scenarios). One of the convenient values of the ratio is (1:12), where the total cost is 282 million USD. The corresponding total charging time is 0.48 Mega hours, with an average vehicle charging time of 3.2 h.
The obtained results are reasonable and in good agreement with the typical values of such a ratio in many countries. The mentioned costs do not include the capital cost of building new power stations to supply the required electric energy. For the KSA, the worst-case charging power is less than 3% of the total power generation capacity, which is not yet a burden on the electric grid.
Funding
This research received no external funding.
Data Availability Statement
Not applicable.
Conflicts of Interest
The author declares no conflict of interest.
Abbreviations
| CEER | Trademark of the EV vehicles to be fabricated in the KSA |
| DWC | Dynamic wireless charger |
| EMS | Energy management system |
| EV | Electric vehicle |
| GA | Genetic algorithms |
| ICE | Internal combustion engine |
| IOV | Internet of vehicles |
| IPT | Inductive power transfer |
| PSO | Particle swarm optimization |
| PCP | Public charging points |
| PV | Photovoltaic |
| SASO | Saudi standards organization |
| SOC | State of charge of EV battery |
| TTC | Technology Transfer Centers |
| VDSC | Vehicle directed smart charging |
| Symbols | |
| Bcap | Battery capacity (kWh) |
| Ci | Total cost of chargers of type i |
| CCi | Capital cost of an individual charger of type i: |
| Total cost of all chargers; | |
| D1 | Daily covered distance during working days (km) |
| D2 | Daily covered distance during weekends (km) |
| Davg | Average daily covered distance (km) |
| d | Distances: 10 km; 20 km;……250 (km) |
| Ti | Total charging time with chargers of type i |
| Total charging time with all chargers; | |
| MCi | Running (maintenance) cost of an individual charger of type i |
| NEVd1 | Number of EVs that have covered a distance d (km) during a working day |
| NEVd2 | Number of EVs that have covered a distance d (km) during a weekend day |
| SOCf | Final state of charge of EV battery |
| SOCi | Initial state of charge of EV battery |
| Li | Number of the charger of type i |
| M | Iteration number in the PSO algorithm |
| k | Particle (bird) number in the PSO algorithm |
| i | Type number of chargers, it takes numerical values from 1 to 4 |
| J | Objective function |
| w | Inertia factor in the PSO algorithm |
| wc | Cost-term weight factor |
| wci | Cost-term weight factor of charger i |
| wt | Charging-term weight factor |
| wti | Charging-term weight factor of charger I |
| EV efficiency (kW/km) | |
| Charging power of individual charger of type i | |
| Total possible charging power of all chargers of type i | |
| Total possible charging power of all chargers | |
| Minimum required power to charge all vehicles; | |
| Position of the particle number m at the iteration number k | |
| Velocity of the particle number m at the iteration number k |
Appendix A
- (a)
- Computation of total cost of the different types of chargers:
Total cost of chargers of type i:
Total cost of all chargers (total cost):
where:
- is the total cost of all chargers of type i;
- is the number of chargers of type i obtained from the optimization algorithm;
- is the capital cost of an individual charger of type i;
- is the total cost of all chargers;
- is the running (maintenance) cost of an individual charger of type i;
- i takes values from 1 to 4.
- (b)
- Computation of charging time with the different types of chargers:
Total charging time with individual charger of type i:
Total charging time with all chargers (Total Charging Time):
where:
- is the total charging time of all chargers of type i;
- is the total charging time with all chargers.
- (c)
- Computation of average daily covered distance and needed charging power:
- is the total required charging power for all vehicles;
- (d)
- Computation of resultant (actual) charging power with different types of chargers:
Total actual charging power with chargers of type i whose number is Li:
where:
- is the total charging power of all chargers of type i;
- is the charging power of individual charger of type i.
Total actual charging power with all chargers based on the number of chargers determined by the optimization algorithm:
The results of optimization algorithm (achieved numbers of chargers of each type) should be able to produce the needed charging power. i.e.:
should be
In this case study
Thus, is considered a constraint that should be satisfied by the optimization algorithm.
Appendix B
- Optimization Software
Table A1.
Optimization software.
Table A1.
Optimization software.
| Item | Parameter |
|---|---|
| Software package | Matlab R2016 64 Bit, Mathworks, Inc. |
| Machine | Intel core i7, Ram 16 GB |
| (Simulation platform) | PSO: Matlab m.file |
| GA: Optimization toolbox 7.5, Mathworks, Inc. |
References
- Available online: https://www.precedenceresearch.com/electric-vehicle-market (accessed on 30 June 2023).
- IEA Technology Report. Available online: https://www.iea.org/reports/global-ev-outlook-2021 (accessed on 1 March 2023).
- Alotaibi, S.; Omer, S.; Su, Y. Identification of Potential Barriers to Electric Vehicle Adoption in Oil-Producing Nations—The Case of Saudi Arabia. Electricity 2022, 3, 365–395. [Google Scholar] [CrossRef]
- Available online: https://www.exro.com/industry-insights/barriers-to-electric-vehicle-adoption-in-2022#:~:text=Charging%20infrastructure%2C%20electric%20vehicle%20performance,barriers%20to%20electric%20vehicle%20adoption (accessed on 10 January 2023).
- Available online: https://www.exro.com/industry-insights/barriers-to-ev-adoption-part-2 (accessed on 10 January 2023).
- National Industrial Development Center NIDC. Available online: https://www.ic.gov.sa/en/ (accessed on 10 January 2023).
- Available online: https://english.alarabiya.net/business/technology/2022/11/17/Saudi-Arabia-s-electric-vehicle-maker-Ceer-appoints-CEO (accessed on 20 December 2022).
- Available online: https://www.saudiembassy.net/news/hrh-crown-prince-launches-ceer-first-saudi-electric-vehicle-brand (accessed on 20 December 2022).
- Available online: https://english.aawsat.com/home/article/3967641/crown-prince-launches-ceer-1st-saudi-electric-vehicle-brand (accessed on 23 December 2022).
- Available online: https://www.zeaara.com/blog/riyadhcarstats.html (accessed on 5 January 2023).
- Available online: https://www.arabnews.com/node/2034146/business-economy (accessed on 9 January 2023).
- Nezamuddin, O.N.; Nicholas, C.L.; Santos, E.C. The Problem of Electric Vehicle Charging: State-of-the-Art and an Innovative Solution. IEEE Trans. Intell. Transp. Syst. 2022, 23, 4663–4673. [Google Scholar] [CrossRef]
- Ucer, E.; Koyuncu, I.; Kisacikoglu, M.C.; Yavuz, M.; Meintz, A.; Rames, C. Modeling and Analysis of a Fast Charging Station and Evaluation of Service Quality for Electric Vehicles. IEEE Trans. Transp. Electrif. 2019, 5, 215–225. [Google Scholar] [CrossRef]
- Tu, H.; Feng, H.; Srdic, S.; Lukic, S. Extreme Fast Charging of Electric Vehicles: A Technology Overview. IEEE Trans. Transp. Electrif. 2019, 5, 861–878. [Google Scholar] [CrossRef]
- Kabir, M.E.; Assi, C.; Alameddine, H.; Antoun, J.; Yan, J. Demand-Aware Provisioning of Electric Vehicles Fast Charging Infrastructure. IEEE Trans. Veh. Technol. 2020, 69, 6952–6963. [Google Scholar] [CrossRef]
- Shao, C.; Qian, T.; Wang, Y.; Wang, X. Coordinated Planning of Extreme Fast Charging Stations and Power Distribution Networks Considering On-Site Storage. IEEE Trans. Intell. Transp. Syst. 2021, 22, 493–504. [Google Scholar] [CrossRef]
- Abdullah, H.M.; Gastli, A.; Ben-Brahim, L.; Mohammed, S.O. Planning and Optimizing Electric-Vehicle Charging Infrastructure through System Dynamics. IEEE Access 2022, 10, 17495–17514. [Google Scholar] [CrossRef]
- Chen, T.; Zhang, X.-P.; Wang, J.; Li, J.; Wu, C.; Hu, M.; Bian, H. A Review on Electric Vehicle Charging Infrastructure Development in the UK. J. Mod. Power Syst. Clean Energy 2020, 8, 193–205. [Google Scholar] [CrossRef]
- Ding, Z.; Teng, F.; Sarikprueck, P.; Hu, Z. Technical Review on Advanced Approaches for Electric Vehicle Charging Demand Management, Part II: Applications in Transportation System Coordination and Infrastructure Planning. IEEE Trans. Ind. Appl. 2020, 56, 5695–5703. [Google Scholar] [CrossRef]
- Marquez-Fernandez, F.J.; Bischoff, J.; Domingues-Olavarria, G.; Alakula, M. Assessment of Future EV Charging Infrastructure Scenarios for Long-Distance Transport in Sweden. IEEE Trans. Transp. Electrif. 2022, 8, 615–626. [Google Scholar] [CrossRef]
- Mirheli, A.; Hajibabai, L. Hierarchical Optimization of Charging Infrastructure Design and Facility Utilization. IEEE Trans. Intell. Transp. Syst. 2022, 23, 15574–15587. [Google Scholar] [CrossRef]
- Nicolaides, D.; Cebon, D.; Miles, J. An Urban Charging Infrastructure for Electric Road Freight Operations: A Case Study for Cambridge UK. IEEE Syst. J. 2019, 13, 2057–2068. [Google Scholar] [CrossRef]
- Li, C.; Dong, Z.; Chen, G.; Zhou, B.; Zhang, J.; Yu, X. Data-Driven Planning of Electric Vehicle Charging Infrastructure: A Case Study of Sydney, Australia. IEEE Trans. Smart Grid 2021, 12, 3289–3304. [Google Scholar] [CrossRef]
- Brenna, M.; Lazaroiu, G.C.; Roscia, M.; Saadatmandi, S. Dynamic Model for the EV’s Charging Infrastructure Planning through Finite Element Method. IEEE Access 2020, 8, 102399–102408. [Google Scholar] [CrossRef]
- Abdullah, H.M.; Gastli, A.; Ben-Brahim, L.; Mohammed, S.O. Integrated Multi-Criteria Model for Long-Term Placement of Electric Vehicle Chargers. IEEE Access 2022, 10, 123452–123473. [Google Scholar] [CrossRef]
- Fathollahi, A.; Derakhshandeh, S.Y.; Ghiasian, A.; Masoum, M.A. Optimal Siting and Sizing of Wireless EV Charging Infrastructures Considering Traffic Network and Power Distribution System. IEEE Access 2022, 10, 117105–117117. [Google Scholar] [CrossRef]
- Sadhukhan, A.; Ahmad, M.S.; Sivasubramani, S. Optimal Allocation of EV Charging Stations in a Radial Distribution Network Using Probabilistic Load Modeling. IEEE Trans. Intell. Transp. Syst. 2022, 23, 11376–11385. [Google Scholar] [CrossRef]
- Zeb, M.Z.; Imran, K.; Khattak, A.; Janjua, A.K.; Pal, A.; Nadeem, M.; Zhang, J.; Khan, S. Optimal Placement of Electric Vehicle Charging Stations in the Active Distribution Network. IEEE Access 2020, 8, 68124–68134. [Google Scholar] [CrossRef]
- Deb, S.; Tammi, K.; Gao, X.-Z.; Kalita, K.; Mahanta, P.; Cross, S. A Robust Two-Stage Planning Model for the Charging Station Placement Problem Considering Road Traffic Uncertainty. IEEE Trans. Intell. Transp. Syst. 2022, 23, 6571–6585. [Google Scholar] [CrossRef]
- Frendo, O.; Gaertner, N.; Stuckenschmidt, H. Open Source Algorithm for Smart Charging of Electric Vehicle Fleets. IEEE Trans. Ind. Inform. 2021, 17, 6014–6022. [Google Scholar] [CrossRef]
- Hussain, S.; Ahmed, M.A.; Kim, Y.-C. Efficient Power Management Algorithm Based on Fuzzy Logic Inference for Electric Vehicles Parking Lot. IEEE Access 2019, 7, 65467–65485. [Google Scholar] [CrossRef]
- ElGhanam, E.; Sharf, H.; Odeh, Y.; Hassan, M.S.; Osman, A.H. On the Coordination of Charging Demand of Electric Vehicles in a Network of Dynamic Wireless Charging Systems. IEEE Access 2022, 10, 62879–62892. [Google Scholar] [CrossRef]
- Jeong, S.; Jang, Y.J.; Kum, D.; Lee, M.S. Charging Automation for Electric Vehicles: Is a Smaller Battery Good for the Wireless Charging Electric Vehicles? IEEE Trans. Autom. Sci. Eng. 2019, 16, 486–497. [Google Scholar] [CrossRef]
- Ejaz, W.; Naeem, M.; Sharma, S.K.; Khattak, A.M.; Ramzan, M.R.; Ali, A.; Anpalagan, A. Iov-Based Deployment and Scheduling of Charging Infrastructure in Intelligent Transportation Systems. IEEE Sens. J. 2021, 21, 15504–15514. [Google Scholar] [CrossRef]
- Mokgonyana, L.; Smith, K.; Galloway, S. Reconfigurable Low Voltage Direct Current Charging Networks for Plug-in Electric Vehicles. IEEE Trans. Smart Grid 2019, 10, 5458–5467. [Google Scholar] [CrossRef]
- Mobarak, M.H.; Bauman, J. Vehicle-Directed Smart Charging Strategies to Mitigate the Effect of Long-Range EV Charging on Distribution Transformer Aging. IEEE Trans. Transp. Electrif. 2019, 5, 1097–1111. [Google Scholar] [CrossRef]
- Danish, S.M.; Zhang, K.; Jacobsen, H.-A.; Ashraf, N.; Qureshi, H.K. Blockev: Efficient and Secure Charging Station Selection for Electric Vehicles. IEEE Trans. Intell. Transp. Syst. 2021, 22, 4194–4211. [Google Scholar] [CrossRef]
- Frendo, O.; Gaertner, N.; Stuckenschmidt, H. Improving Smart Charging Prioritization by Predicting Electric Vehicle Departure Time. IEEE Trans. Intell. Transp. Syst. 2021, 22, 6646–6653. [Google Scholar] [CrossRef]
- Kabir, M.E.; Sorkhoh, I.; Moussa, B.; Assi, C. Joint Routing and Scheduling of Mobile Charging Infrastructure for V2V Energy Transfer. IEEE Trans. Intell. Veh. 2021, 6, 736–746. [Google Scholar] [CrossRef]
- Lasla, N.; Al-Ammari, M.; Abdallah, M.; Younis, M. Blockchain Based Trading Platform for Electric Vehicle Charging in Smart Cities. IEEE Open J. Intell. Transp. Syst. 2020, 1, 80–92. [Google Scholar] [CrossRef]
- Khalid, M.R.; Khan, I.A.; Hameed, S.; Asghar, M.S.; Ro, J.-S. A Comprehensive Review on Structural Topologies, Power Levels, Energy Storage Systems, and Standards for Electric Vehicle Charging Stations and Their Impacts on Grid. IEEE Access 2021, 9, 128069–128094. [Google Scholar] [CrossRef]
- Shahriar, S.; Al-Ali, A.R.; Osman, A.H.; Dhou, S.; Nijim, M. Machine Learning Approaches for EV Charging Behavior: A Review. IEEE Access 2020, 8, 168980–168993. [Google Scholar] [CrossRef]
- Shahriar, S.; Al-Ali, A.R.; Osman, A.H.; Dhou, S.; Nijim, M. Prediction of EV Charging Behavior Using Machine Learning. IEEE Access 2021, 9, 111576–111586. [Google Scholar] [CrossRef]
- Lee, Z.J.; Sharma, S.; Johansson, D.; Low, S.H. ACN-SIM: An Open-Source Simulator for Data-Driven Electric Vehicle Charging Research. IEEE Trans. Smart Grid 2021, 12, 5113–5123. [Google Scholar] [CrossRef]
- Chaudhari, K.; Kandasamy, N.K.; Krishnan, A.; Ukil, A.; Gooi, H.B. Agent-Based Aggregated Behavior Modeling for Electric Vehicle Charging Load. IEEE Trans. Ind. Inform. 2019, 15, 856–868. [Google Scholar] [CrossRef]
- Chavhan, S.; Dubey, N.; Lal, A.; Khetan, D.; Gupta, D.; Khanna, A.; Rodrigues, J.J.; Pinheiro, P.R. Next-Generation Smart Electric Vehicles Cyber Physical System for Charging Slots Booking in Charging Stations. IEEE Access 2020, 8, 160145–160157. [Google Scholar] [CrossRef]
- Ahmed, M.A.; El-Sharkawy, M.R.; Kim, Y.-C. Remote Monitoring of Electric Vehicle Charging stations in Smart Campus Parking Lot. J. Mod. Power Syst. Clean Energy 2020, 8, 124–132. [Google Scholar] [CrossRef]
- Lee, Z.J.; Lee, G.; Lee, T.; Jin, C.; Lee, R.; Low, Z.; Chang, D.; Ortega, C.; Low, S.H. Adaptive Charging Networks: A Framework for Smart Electric Vehicle Charging. IEEE Trans. Smart Grid 2021, 12, 4339–4350. [Google Scholar] [CrossRef]
- Cao, Y.; Kaiwartya, O.; Zhuang, Y.; Ahmad, N.; Sun, Y.; Lloret, J. A Decentralized Deadline-Driven Electric Vehicle Charging Recommendation. IEEE Syst. J. 2019, 13, 3410–3421. [Google Scholar] [CrossRef]
- Tucker, N.; Alizadeh, M. An Online Admission Control Mechanism for Electric Vehicles at Public Parking Infrastructures. IEEE Trans. Smart Grid 2020, 11, 161–170. [Google Scholar] [CrossRef]
- Kong, P.-Y. Autonomous Robot-like Mobile Chargers for Electric Vehicles at Public Parking Facilities. IEEE Trans. Smart Grid 2019, 10, 5952–5963. [Google Scholar] [CrossRef]
- Ahmad, M.S.; Sivasubramani, S. Optimal Number of Electric Vehicles for Existing Networks Considering Economic and Emission Dispatch. IEEE Trans. Ind. Inform. 2019, 15, 1926–1935. [Google Scholar] [CrossRef]
- Badia, B.; Berry, R.A.; Wei, E. Investment in EV Charging Spots for Parking. IEEE Trans. Netw. Sci. Eng. 2020, 7, 650–661. [Google Scholar] [CrossRef]
- Azab, M. Multi-Objective Design Approach of Passive Filters for Single-Phase Distributed Energy Grid Integration Systems Using Particle Swarm Optimization. Energy Rep. 2020, 6, 157–172. [Google Scholar] [CrossRef]
- Azab, M.; Serrano-Fontova, A. Optimal Tuning of Fractional Order Controllers for Dual Active Bridge-Based DC Microgrid Including Voltage Stability Assessment. Electronics 2021, 10, 1109. [Google Scholar] [CrossRef]
- Liu, W.; Wang, Z.; Liu, X.; Zeng, N.; Bell, D. A Novel Particle Swarm Optimization Approach for Patient Clustering from Emergency Departments. IEEE Trans. Evol. Comput. 2019, 23, 632–644. [Google Scholar] [CrossRef]
- Azab, M. Design Approach and Performance Analysis of Trap Filter for Three-Phase PV Grid Integration Systems Using Evolutionary Search Algorithms. J. King Saud Univ. Eng. Sci. 2021, 33, 491–506. [Google Scholar] [CrossRef]
- Corus, D.; Oliveto, P.S. Standard Steady State Genetic Algorithms Can Hillclimb Faster than Mutation-Only Evolutionary Algorithms. IEEE Trans. Evol. Comput. 2018, 22, 720–732. [Google Scholar] [CrossRef]
- Wang, Z.; Li, J.; Fan, K.; Ma, W.; Lei, H. Prediction Method for Low Speed Characteristics of Compressor Based on Modified Similarity Theory with Genetic Algorithm. IEEE Access 2018, 6, 36834–36839. [Google Scholar] [CrossRef]
- Mohammadi, A.; Asadi, H.; Mohamed, S.; Nelson, K.; Nahavandi, S. Multiobjective and Interactive Genetic Algorithms for Weight Tuning of a Model Predictive Control-Based Motion Cueing Algorithm. IEEE Trans. Cybern. 2019, 49, 3471–3481. [Google Scholar] [CrossRef]
- Dalla Chiara, B.; Deflorio, F.; Pellicelli, M.; Castello, L.; Eid, M. Perspectives on Electrification for the Automotive Sector: A Critical Review of Average Daily Distances by Light-Duty Vehicles, Required Range, and Economic Outcomes. Sustainability 2019, 11, 5784. [Google Scholar] [CrossRef]
- Smart, J.; Powell, W.; Schey, S. Extended Range Electric Vehicle Driving and Charging Behavior Observed Early in the EV Project. SAE Tech. Pap. Ser. 2013, 1–9. [Google Scholar] [CrossRef]
- He, J.; Yamamoto, T. Characterization of Daily Travel Distance of a University Car Fleet for the Purpose of Replacing Conventional Vehicles with Electric Vehicles. Sustainability 2020, 12, 690. [Google Scholar] [CrossRef]
- Plötz, P.; Jakobsson, N.; Sprei, F. On the Distribution of Individual Daily Driving Distances. Transp. Res. Part B Methodol. 2017, 101, 213–227. [Google Scholar] [CrossRef]
- Available online: https://www.statista.com/chart/26325/ratio-electric-vehicles-to-public-charging-points/ (accessed on 20 June 2023).
- Available online: https://www.statista.com/statistics/975223/saudi-arabia-electricity-generation-capacity/#:~:text=As%20of%202021%2C%20the%20electricity,capacity%20of%20around%2053.6%20gigawatts (accessed on 20 June 2023).
- Available online: https://datasource.kapsarc.org/explore/dataset/electric-power-generation-capacity-and-number-of-subscribers/table/?disjunctive.indicators&refine.indicators=%2APower%2BGeneration%2BCapacity%2B%28MW%29 (accessed on 13 October 2022).
- Available online: https://www.kapsarc.org/wp-content/uploads/2020/12/KS-2020-DP25-Saudi-Arabia-Energy-Report.pdf (accessed on 8 February 2023).


Disclaimer/Publisher’s Note: The statements, opinions and data contained in all publications are solely those of the individual author(s) and contributor(s) and not of MDPI and/or the editor(s). MDPI and/or the editor(s) disclaim responsibility for any injury to people or property resulting from any ideas, methods, instructions or products referred to in the content. |
© 2023 by the author. Licensee MDPI, Basel, Switzerland. This article is an open access article distributed under the terms and conditions of the Creative Commons Attribution (CC BY) license (https://creativecommons.org/licenses/by/4.0/).