Abstract
Global energy and environmental issues are becoming increasingly serious, and the promotion of clean energy and green transportation has become a common goal for all countries. In the logistics industry, traditional fuels such as diesel and natural gas can no longer meet the requirements of energy and climate change. Hydrogen fuel cell logistics vehicles are expected to become the mainstream vehicles for future logistics because of their “zero carbon” advantages. The GREET model is computer simulation software developed by the Argonne National Laboratory in the USA. It is extensively utilized in research pertaining to the energy and environmental impact of vehicles. This research study examines four types of logistics vehicles: hydrogen fuel cell vehicles (FCVs), electric vehicles, LNG-fueled vehicles, and diesel-fueled vehicles. Diesel-fueled logistics vehicles are currently the most abundant type of vehicle in the logistics sector. LNG-fueled logistics vehicles are considered as a short-term alternative to diesel logistics vehicles, while electric logistics vehicles are among the most popular types of new-energy vehicles currently. We analyze and compare their well-to-wheels (WTW) energy consumption and emissions with the help of GREET software and conduct lifecycle assessments (LCAs) of the four types of vehicles to analyze their energy and environmental benefits. When comparing the energy consumption of the four vehicle types, electric logistics vehicles (EVs) have the lowest energy consumption, with slightly lower energy consumption than FCVs. When comparing the nine airborne pollutant emissions of the four vehicle types, the emissions of the FCVs are significantly lower than those of spark-ignition internal combustion engine logistics vehicles (SI ICEVs), compression-ignition direct-injection internal combustion engine logistics vehicles (CIDI ICEVs), and EVs. This study fills a research gap regarding the energy consumption and environmental impact of logistics vehicles in China.
1. Introduction
The world is currently facing an increasingly serious energy crisis and environmental problems, as the world’s population continues to rise and human living standards improve, leading to a continuous increase in world energy demand. The International Energy Agency (IEA) attributes the current energy crisis to 2021 when the global energy market faced intense pressure due to the economic downturn triggered by the COVID-19 pandemic. The pandemic led to a reduction in the production of renewable energy sources, such as wind, hydro, and solar power, and forced the postponement of the scheduled maintenance and overhaul of power plants planned for 2020 and 2021. According to the International Monetary Fund (IMF), energy prices are expected to remain high as global oil and coal prices doubled and tripled, respectively, and European gas prices increased sevenfold in 2022 compared to the beginning of 2021 [1]. The conflict between Russia and the Ukraine, which started in February 2022, has exacerbated the energy crisis, which has had profound implications for global energy supply. The duration and evolution of the crisis remain highly uncertain, and many countries face considerable risks to their energy supply security.
On 18 February 2021, the United Nations Environment Programme (UNEP) released its first comprehensive report, “Making Peace With Nature: A scientific blueprint to tackle the climate, biodiversity and pollution emergencies”, which states that climate change, biodiversity decline, and environmental pollution have become the three major global environmental emergencies [2]. In 2015, 196 parties adopted the Paris Agreement at the United Nations Climate Change Conference (COP21) in Paris, France, a legally binding international climate change treaty with the overarching goal of “limiting global average temperature increases to well below 2 °C below pre-industrial levels” and to work towards “limiting temperature increases to 1.5 °C above pre-industrial levels” [3]. In this context, Europe set a target of achieving carbon neutrality by 2050 [4]. On 22 September 2020, Chinese President Xi Jinping formally announced China’s “dual carbon” targets at the 75th United Nations General Assembly. These targets aim to reach peak carbon dioxide emissions by 2030 and to achieve carbon neutrality before 2060. During the 26th United Nations Climate Change Conference (UNFCCC) in 2021, countries agreed to the “Glasgow Climate Pact,” recognizing the necessity of concerted efforts to limit the increase in the global mean temperature to within 1.5 °C [5].
The car is one of the most vital modes of transportation for people’s productive lives, and its ownership continues to expand. According to the National Bureau of Statistics, China’s civilian vehicle ownership surged from 126.714 million units in 2013 to 311.900 million units in 2022, marking a growth rate of 146.2% [6]. This continuous increase in car ownership will result in additional energy and environmental constraints.
According to the Ministry of Ecology and Environment, in 2021, 121 of the 339 prefecture-level and above cities, accounting for 35.7% of all prefecture-level and above cities, exceeded the ambient air quality standard, with PM2.5, O3, PM10, NO2, and CO as the main pollutants. The annual average concentration of PM2.5 is 30 μg/m3, and the annual average concentration of PM10 is 54 μg/m3 [7]. As shown in Table 1, the hazards of some common air pollution emissions have been studied by many scholars. Yoro et al. argue that current uncontrolled human emissions may be contributing to global warming, ocean acidification, desertification, and changes in climate conditions [8]. Yang et al. argue that there is a need for governments to encourage residents to purchase goods with low carbon emissions or air pollutants and to encourage them to develop a more environmentally friendly lifestyle [9]. Bao et al. believe that the government’s attention to environmental pollution will help improve the quality of the local environment [10]. At the same time, China’s annual energy consumption is increasing. In 2022, China’s total energy consumption reached 541,000 million tons of standard coal, a growth rate of 3.24% from 2021 [6].

Table 1.
Emissions of Gaseous Pollutants and Their Hazards.
Currently, fossil fuels remain the dominant source of energy consumption in China, with a share of 83.4% of the total energy consumption in 2021. Specifically, coal, oil, and natural gas accounted for 56.0%, 18.5%, and 8.9%, respectively [6]. The biggest drawback of fossil fuels is the air pollutant emissions, of which greenhouse gas (GHG) emissions are considered to be a major contributor to global warming [17]. The transport sector accounts for about 20% of the total global primary energy consumption and about 23% of CO2 emissions, and when emissions of other GHGs such as methane are taken into account, these account for about 14% of total global GHG emissions or about 7 billion tons of CO2 equivalent, almost the same as the livestock sector [18]. Currently, over 95% of the transportation energy demand is supplied by liquid fuels derived from oil. Therefore, decarbonization of the transportation sector is more challenging than in other sectors. The use of clean alternative energy sources is one effective way to address this challenge, and it has been studied by scholars in recent years [17,18]. Hydrogen is a promising renewable energy source, which attracts people’s attention because of its clean and abundant properties [19]. Sun et al. conducted a comprehensive review of the current status of automotive power in China and proposed a mid- to long-term development plan for China’s automotive industry. This plan involves optimizing the internal combustion engine technology in the short term and transitioning to diesel vehicles. Additionally, they suggest developing natural gas as a new alternative fuel for automobiles, while biomass fuel can be used as a mid-term alternative and supplementary fuel. Hydrogen gas is seen as the “ultimate energy source” for the development of automobile power in China due to its high power output and zero carbon emissions. However, the commercialization of FCVs and refueling stations is still in its early stages in China [20]. Kalghatgi et al. found that as the entire energy system is decarbonized and battery technology improves, BEVs and hydrogen will play an increasing role, replacing liquid hydrocarbons in the long term, and the required infrastructure will evolve [18].
At present, the transportation sector is an important area of hydrogen energy application, which is highly valued by many countries in the world. Developed economies such as Europe, the USA, Japan, and South Korea have introduced national strategic plans to vigorously develop the hydrogen energy industry [21,22,23]. In March 2022, the National Development and Reform Commission and the National Energy Administration jointly issued the Medium- and Long-term Plan for the Development of the Hydrogen Energy Industry (2021–2035), which clarifies that hydrogen energy will be used as an important part of China’s energy structure in the future [24]. In the second half of 2022, India, France, Singapore, and South Korea all put forward their plans to vigorously develop hydrogen fuel cell vehicles, with South Korea planning to popularize 30,000 hydrogen fuel cell commercial vehicles by 2030. According to the International Energy Agency (IEA), the demand for hydrogen energy in the transportation sector will increase nearly 30 times in 2060 compared to 2030.
As of 2021, the total length of China’s roads has reached 5.28 million kilometers, which is approximately 35 times the operational length of railways. The logistics industry has experienced rapid growth due to the development of China’s industrialization and the rise of ecommerce. According to the statistics from the National Bureau of Statistics, in 2022, the total volume of express deliveries in China reached 11.058 billion units, increasing by 2.1% compared to the previous year. In the same year, the volume of goods transported by road in China reached 3712 million tons, accounting for 73.35% of the total volume of goods transported [6]. The demand for logistics vehicles is expected to continue to increase in China in the future. Thus, finding a solution to reduce energy consumption and pollutant emissions while ensuring transportation efficiency is crucial, and hydrogen fuel cell logistic vehicles have provided a promising solution.
At present, there are not many cases of the application of hydrogen fuel cell logistics vehicles in the logistics industry in China. In contrast, the logistics sector is still dominated by traditional energy types, such as diesel vehicles. Alternative energy such as NG and EVs also occupy part of the market. However, as environmental protection and development of green energy issues are being paid more and more attention, and the government and enterprises are promoting the application and development of hydrogen energy technology, the application of hydrogen fuel cell logistics vehicles also has a greater potential for development. In the future, with the continuous improvement of hydrogen fuel cell technology and the reduction in the manufacturing cost, hydrogen fuel cell logistics vehicles are expected to gradually become the mainstream models in the logistics industry.
Compared to hydrogen fuel cell logistics vehicles, hydrogen fuel cells have already achieved mature applications in cars. As shown in Figure 1, FCVs mainly consist of six components: (1) the hydrogen storage tank, (2) the air intake system, (3) the fuel cell system, (4) the power control unit, (5) the battery, and (6) the electric motor [25]. Hydrogen chemical energy can be converted into electrical energy through proton exchange membrane fuel cell technology. Hydrogen gas and oxygen in the air are mixed and pushed through the onboard intake system. When they pass through the fuel cell stack, electrical energy is generated through an electrochemical process, with the only byproduct being water vapor, which is ejected into the atmosphere from the fuel cell stack. Therefore, during the driving process, hydrogen fuel cell vehicles do not emit any tailpipe emissions in the form of GHGs or CAPs. The electricity generated by the fuel cell is managed by the power control unit and adjusted and used as needed. According to the operating conditions or power requirements of hydrogen fuel cell cars, the power control unit can charge the battery, supply power to the motor, or both. Although the battery is not the primary power source of hydrogen fuel cell cars, it can store excess electricity, allowing the fuel cell to operate at near peak efficiency and support other vehicle functions. The electric motor converts the electrical energy into mechanical energy to propel the vehicle forward.
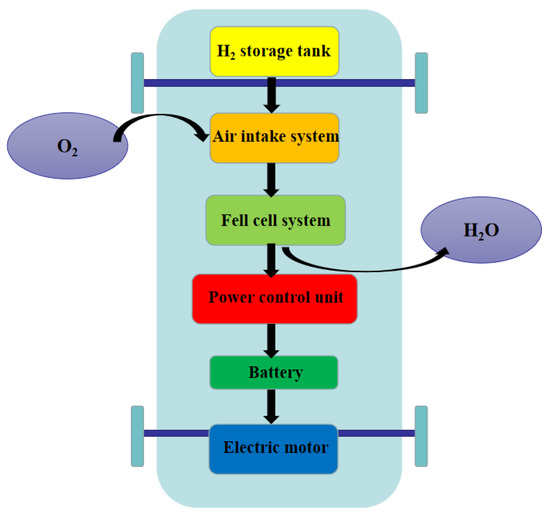
Figure 1.
Main components of an FCV.
Lifecycle assessment (LCA) is a method for assessing the environmental impact of a product throughout its lifecycle, and Figure 2 illustrates the steps in implementing LCA. In recent years, many scholars have made comparative analyses of the energy saving and emission reduction benefits of various vehicles over their entire lifecycle. Regarding the lifecycle assessment of vehicles, many research institutes have developed practical models based on different fuel pathways and vehicle technologies, including the GREET model (Greenhouse gases, regulated emissions, and energy use in transportation), the DFE model (Design for Environment), the EIO-LCA model (Economic Input–Output Lifecycle Assessment), the Tsinghua-LCAM model, and the E-balance model. The GREET model and the WTW evaluation system, developed by Argonne National Laboratory, are currently the most widely used in the energy industry. As shown in Figure 3, the WTW (well-to-wheel) evaluation system can be divided into two stages: WTP (Well-to-Pump) for fuel production and PTW (Pump-to-Wheel) for vehicle use. It studies the energy consumption, related pollutant emissions, and GHG emissions throughout the entire production and use process of vehicle fuel and compares and analyzes each specific stage. This approach can provide a more intuitive display of the positive impact of vehicles on environmental improvement.
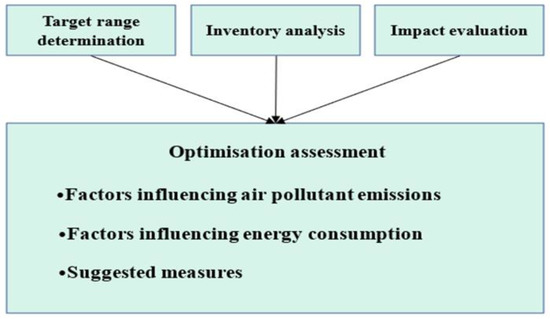
Figure 2.
LCA implementation steps.

Figure 3.
Well-to-wheels fuel cycle.
When calculating vehicle energy consumption and emissions, scholars generally use the GREET model and LCA. Liu et al. compared the well-to-wheels GHGs and criteria air pollutant emissions of MHD BEVs with conventional diesel MHDVs across weight classes and vocations [26]. Burnham et al. used the GREET model to evaluate the environmental benefits of light-duty electric vehicles and gasoline vehicles under different electric grid structures in different states of the USA and found that the environmental benefits of different vehicles varied depending on the combination of the electric grid [27]. Correa et al. proposed a multi-physical metric to compare the energy and environmental performance of five urban bus dynamics based on the WTW analysis [28]. Elgowainy et al. conducted a lifecycle assessment of GHG emissions from petroleum, NG, hydrogen, and electricity using the GREET model. The study found that electricity and hydrogen can significantly reduce the transportation sector’s dependence on petroleum energy sources. Using renewable energy sources, such as wind, solar, and biomass, as energy feedstocks for electricity and hydrogen production can reduce GHG emissions by over 80% compared to conventional gasoline ICEVs [29]. Ugurlu et al. used the GREET software to calculate the emissions impact of different hydrogen production methods on three types of hydrogen-powered vehicles. The study found that FCVs have lower emissions than SI HEVs, while SI HEVs have lower emissions than SI ICEVs [30]. Wang et al. used the GREET model to study the energy consumption and GHG and air pollutant emissions of HFCVs in China. The study suggested that renewable energy-powered water electrolysis for hydrogen production should be the primary trend for transitioning towards decarbonized, clean, and sustainable HFCVs [31]. He et al. assessed the WTW emissions, costs, and feedstock potentials for light-duty hydrogen fuel cell vehicles in China in 2017 and 2030 [32]. Saafi et al. explored the potential of hydrogen in decarbonizing China’s light-duty vehicle market and found that although H2 vehicles’ total cost of ownership will still be higher than EVs until 2040, hydrogen is the key approach to fulfill China’s decarbonization targets [33].
Scholars have used the LCA approach to study the energy consumption and emissions of hydrogen fuel cell vehicles. Wei et al. studied the effects of driving cycles and hydrogen production pathways on the fuel economy and GHG emissions over the lifecycle of hydrogen fuel cell vehicles in Korea [34]. Lu et al. conducted a lifecycle assessment of the energy efficiency of hydrogen fuel cell vehicles in China, and the research results showed that the wheel-to-wheel energy efficiency of hydrogen fuel cell vehicles ranged from 6.8% to 29.2%, depending to a large extent on the source of hydrogen and the mode of transport [35]. Hwang et al. conducted a comprehensive lifecycle analysis of the energy consumption and greenhouse gas emissions of fuel/vehicle systems for FCV technology and concluded that natural gas reforming to hydrogen may be the primary hydrogen production method in the early stages of FCV development for economic reasons [36]. Ahmadi et al. conducted a simulation and lifecycle assessment of hydrogen fuel cell vehicles using a real model under various hydrogen production methods with Simcenter Amesim software [37]. Lee et al. conducted a comprehensive and up-to-date lifecycle comparison of hydrogen fuel cell electric trucks and traditional diesel trucks in terms of energy use and emissions. The study found that hydrogen fuel cell electric trucks reduced the lifecycle WTW petroleum energy use by over 98% compared to their diesel counterparts [38].
This study discusses the potential of hydrogen fuel cell logistics vehicles in terms of energy consumption and CO2, CH4, N2O, NOX, SOX, VOC, PM10, and PM2.5 emissions using the lifecycle assessment. GREET software is utilized to analyze the energy consumption and emissions of FCVs, SI ICEVs, CIDI ICEVs, and EVs during the WTW cycle according to the different types of energy sources used by logistics vehicles. By comparing the energy consumption and emissions of logistics vehicles with different energy types, this paper aims to explore the advantages of hydrogen fuel cell logistics vehicles in terms of energy consumption and environmental benefits and provide relevant suggestions for the advantages of developing hydrogen energy as an “ultimate energy” for the future.
Compared with previous studies, the main contributions of this paper are threefold:
- This study fills a research gap by examining the previously unexplored area of energy consumption and emissions of logistics vehicles in China.
- The calculated results from this study offer valuable data to support the decision-making process for the adoption of new energy vehicles in both the short-term and long-term perspectives within China’s transportation industry.
- Furthermore, the findings derived from this study provide insights into the feasible directions for improving energy cleanliness as pursued by various nations worldwide.
2. Materials and Methods
China’s logistics vehicles mainly include three types: light-duty, medium-duty, and heavy-duty vehicles. Light logistics vehicles have small volume and limited load capacity, mainly used for light and small-scale logistics business such as urban distribution. Medium-sized logistics vehicles have improved load capacity compared to light vehicles and are suitable for medium-sized logistics businesses such as long-distance logistics transportation and express delivery. Heavy logistics vehicles are usually used for logistics transportation of bulk commodities, such as coal, steel, etc. According to data from the National Bureau of Statistics, as of 2021, the total number of civilian light cargo vehicles in China has reached 22.5326 million, accounting for 69.15% of the total number of cargo vehicles [6]. Therefore, this study takes civilian light cargo vehicles as the research object. As the commonly used logistics vehicle types in China are diesel-powered logistics vehicles, pure electric logistics vehicles, and natural gas logistics vehicles, this study selects these three types of logistics vehicles as control groups to compare the energy saving and emission reduction effects of hydrogen fuel cell logistics vehicles. The four selected vehicle types are FCV-Liquid H2, SI ICEV-LNG, CIDI ICEV-FT Diesel, and EV200-Electricity.
This study assessed the energy consumption and air pollutant emissions of four logistics vehicle types: FCVs, SI ICEVs, CIDI ICEVs, and EVs, using an LCA evaluation. The energy consumption and emissions of the vehicles were calculated using the GREET software developed by the Argonne National Laboratory (ANL) in the USA. The GREET model is a computational simulation tool developed by ANL, one of the largest scientific and engineering research national labs in the USA, in 1995, which is updated regularly [39]. The GREET model has a large database that covers various production, transportation, and usage pathways for different fuels and provides in-depth lifecycle simulation for various energy and chemical pathways. It enables researchers to evaluate the emissions and energy consumption of the entire lifecycle under different transportation technology conditions through modifying the boundary conditions and parameters. In addition, the model contains information on transportation vehicles to provide a comprehensive understanding of the impacts of various transportation modes on the environment and energy consumption.
As the development of hydrogen fuel cell logistics vehicles in China is still in its infancy, there is currently a lack of accurate data related to hydrogen production and vehicle use stages. To ensure the accuracy and reference value of the research results and considering that China and the USA are both fossil fuel-dominated countries with similar energy structures, this paper analyzes the emission characteristics of logistics vehicles under this energy structure based on the more mature vehicle and energy data in the USA. This provides a reference basis for analyzing the energy saving and emission reduction effects and the feasibility of hydrogen fuel cell logistics vehicles. Due to the differences between China and the USA, there are expected discrepancies in the final calculated results. For instance, although both countries have a significant proportion of fossil fuels in their energy mix, the USA relies more on nuclear energy as a clean energy source, whereas China’s proportion of nuclear energy is relatively lower. This discrepancy may lead to minor differences in energy consumption and emission outcomes, but it does not affect the overall trend assessment. This study used a method of controlling variables to separately calculate the emissions and energy consumption of various logistics vehicles. In terms of parameter selection, this research chose carrying capacity, consumption, proportion of urban areas, and fuel pathways as variables to study. In order to make the calculation results fit the reality, the real data in the GREET model was used without modification during modeling. The calculation of energy consumption and emissions is influenced by the payload capacity and urban driving proportion of different vehicles. Considering the daily payload of the chosen civilian light-duty logistics vehicles in this study and for convenient observation of the calculated results, we set the payload of the vehicles to 2 tons, while adopting the urban driving proportion recommended by the GREET model, which is 0.7. Only the difference in energy consumption and emission resulting from the difference in energy sources was considered. All the energy consumption and emission values from fuel production to vehicle use in this study were calculated separately by the GREET software. For the convenience of comparison, the total energy consumption results are expressed in KJ/km as the unit, representing the energy consumption of the vehicle per kilometer traveled in KJ. Except for CO2 emission results, which are expressed in g/km, the emission results of other gases are expressed in mg/km, representing the emissions of the vehicle per kilometer traveled in terms of mg.
The energy consumption and emissions during the fuel production and transportation stages, i.e., the Well-to-Pump phase, for the four types of fuels have been thoroughly considered in the GREET model and are reflected in the final calculation results. In the following sections, this paper introduces the manufacturing and transportation processes of the four fuels.
2.1. H2 as Fuel
There are various methods for hydrogen production, including fossil fuel hydrogen production, steam methane reforming (SMR), photocatalytic hydrogen production, industrial byproduct hydrogen production, water electrolysis, nuclear hydrogen production, etc. Internationally, hydrogen is mainly derived from natural gas, which accounts for about 76% of the global hydrogen production through SMR. SMR technology utilizes the reaction between methane and water vapor under high temperature and catalyst conditions and is a low-cost method of hydrogen production. However, the hydrogen production process generates a large amount of carbon emissions. Combining it with carbon capture and storage (CCS) technology can reduce carbon emissions by about 80%, but it significantly increases the cost of hydrogen production. According to the simulation results of this study’s previous calculation, the hydrogen fuel cell logistics vehicle’s energy consumption and environmental benefits are optimal under the nuclear hydrogen production method. The nuclear hydrogen production method mainly uses high-temperature gas-cooled reactors to provide high-temperature process heat and then uses nuclear power for the water electrolysis process (the high-temperature electrolysis has a theoretical efficiency of more than 50% at 800 °C). Nuclear energy is a clean primary energy, and nuclear hydrogen production has developed into a clean, mature, and safe technology that combines nuclear reactors with advanced hydrogen production processes to achieve large-scale and efficient hydrogen production. Compared with traditional hydrogen production methods, nuclear hydrogen production has the advantages of large-scale, high efficiency, and zero GHG emissions. Therefore, this paper studies the energy consumption and emissions of hydrogen fuel cell logistics vehicles using hydrogen from nuclear power. However, concurrently, issues regarding the safety of nuclear power plants and the secure handling of nuclear waste also demand effective resolutions.
2.2. NG as Fuel
The emissions and energy consumption of natural gas in the fuel cycle mainly occur during the extraction and transportation stages. The transportation methods for natural gas mainly include pipeline transportation, tanker transportation, and ship transportation. Among them, the most widely used is CNG pipeline transportation due to its long distance, large transportation volume, and wide applicability, but LNG pipeline transportation is currently less used due to technical reasons. The LNG used in natural gas logistics vehicles mainly comes from LNG refueling stations, and the main transportation methods for LNG are tanker transportation and ship transportation.
Due to the difference in the energy density between natural gas and diesel, the range of CNG (compressed natural gas) vehicles is shorter than that of diesel vehicles, while the range of LNG (liquefied natural gas) vehicles is longer. The exhaust emissions of natural gas logistics vehicles mainly consist of harmful substances such as carbon dioxide, nitrogen oxides, and particulate matter. According to the research conducted by Hao et al., natural gas vehicles offer advantages over conventional diesel vehicles in terms of reducing petroleum consumption, carbon dioxide emissions, and air pollutants [40].
2.3. Electricity as Fuel
The energy consumption and pollutant emissions of electricity in the WTP stage are mainly concentrated in the thermal power generation stage. Clean power generation processes such as hydropower, nuclear power, wind power, and solar power generation almost do not produce carbon emissions or energy consumption. The proportion of clean energy in China’s power grid exceeds 30%, and further increasing this ratio contributes to further reductions in energy consumption and emissions during the WTP phase for EVs. Thermal power generation is a method of power generation that uses the heat generated by burning combustible materials to convert it into electrical energy through a power generation device. According to the fuel used, the main types of thermal power generation include coal-fired power generation, gas-fired power generation, and oil-fired power generation. The main emissions from thermal power generation include sulfur dioxide, nitrogen oxides, carbon dioxide, and carbon monoxide. Like hydrogen, electricity can achieve zero emissions in the PTW stage, but due to limitations in battery technology, the charging speed of EVs is not as fast as the refueling speed of FCVs.
2.4. Diesel as Fuel
Crude oil is transported through pipelines into a storage area upon arrival at the plant and then subjected to atmospheric and vacuum distillation to produce residual oil and diesel feedstock. The residual oil is then transformed into diesel fuel through the coking equipment and diesel hydrogenation equipment. Diesel logistics vehicles are limited by engine technology, and their combustion emits pollutants such as carbon dioxide, nitrogen oxides, and particulate matter. These harmful substances have a significant impact on the environment and health. If there are technological breakthroughs in diesel engines, it would significantly enhance the fuel’s energy efficiency and reduce pollutant emissions to a certain extent.
By providing a general overview of the Well-to-Pump processes for four different fuels, the study clarifies how the energy consumption and emissions generated during fuel production and transportation can influence the overall lifecycle energy consumption and emissions of vehicles. This influence has been thoroughly taken into account in the GREET software, ultimately reflected in the calculations of the WTP and WTW energy consumption and emissions.
3. Results
The WTW total energy consumption of FCVs, SI ICEVs, CIDI ICEVs, and EVs according to the GREET software are presented in Figure 4. The total lifecycle energy consumption of CIDI ICEVs is the highest, followed by SI ICEVs, while EVs have the lowest total lifecycle energy consumption. However, the energy consumption of FCVs is almost the same as EVs. During the WTP stage, SI ICEVs have the lowest total energy consumption, followed by FCVs and EVs, and CIDI ICEVs have the largest total energy consumption. Because only natural gas among these four energy sources belongs to primary energy, which can be obtained directly through extraction, its energy consumption during the fuel cycle is mainly generated during compression and transportation. Hydrogen, electricity, and diesel all belong to secondary energy, they need to go through a series of preparation processes to be generated. Their energy consumption during the WTP stage is higher than that of natural gas. During the PTW stage, the order of energy consumption from high to low is SI ICEVs, CIDI ICEVs, FCVs, and EVs. Since the SI ICEVs have the lowest energy consumption in the WTP stage, the final WTW lifecycle energy consumption is still lower than that of the CIDI ICEVs. According to the calculation of the GREET model, the total energy consumptions of the various types of vehicles in terms of the WTW are: 2061.56 KJ/km for hydrogen fuel cell logistics vehicles, 3444.25 KJ/km for natural gas logistics vehicles, 3883.27 KJ/km for diesel logistics vehicles, and 2049.51 KJ/km for electric logistics vehicles. From an energy saving perspective, diesel logistics vehicles have the lowest energy saving benefits, and electric logistics vehicles have the highest energy-saving benefits, reducing energy consumption by 47.22% compared to diesel logistics vehicles. Hydrogen fuel cell logistics vehicles reduce energy consumption by 46.91% compared to diesel logistics vehicles, and their energy-saving benefits are comparable to those of electric logistics vehicles.
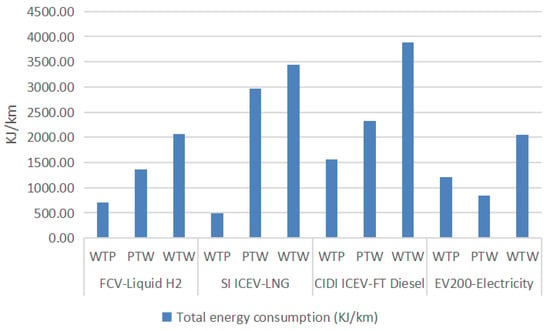
Figure 4.
Total energy consumption of FCVs, SI ICEVs, CIDI ICEVs, and EVs.
The WTW CO2 emissions of FCVs, SI ICEVs, CIDI ICEVs, and EVs according to the GREET software can be found in Figure 5. CO2 is the predominant greenhouse gas emission among the various vehicle types. FCVs have the lowest lifecycle carbon emission among all vehicle types, with only 5.59 g/km. The lifecycle carbon emissions of the other three vehicle types are relatively close, with the SI ICEV at 190.63 g/km, the EV at 161.55 g/km, and the CIDI ICEV having the highest carbon emissions at 215.15 g/km. Compared to diesel logistics vehicles, hydrogen fuel cell logistics vehicles reduce carbon emissions by 97.40%, while natural gas logistics vehicles only reduce carbon emissions by 11.40%, and electric logistics vehicles reduce carbon emissions by 24.91%. Although both hydrogen fuel cell and electric logistics vehicles can achieve zero carbon emissions during the PTW phase, the carbon emissions of electric logistics vehicles during the WTP phase are significant due to the predominance of thermal power generation in the current electricity grid structure, which has a relatively low proportion of clean energy sources. Therefore, electric logistics vehicles have no advantage compared to hydrogen fuel cell logistics vehicles. Carbon dioxide is a major contributor to global warming and climate change; so, it is essential for the transportation industry to develop low-carbon logistics vehicles. Hydrogen fuel cell logistics vehicles align perfectly with this strategy.
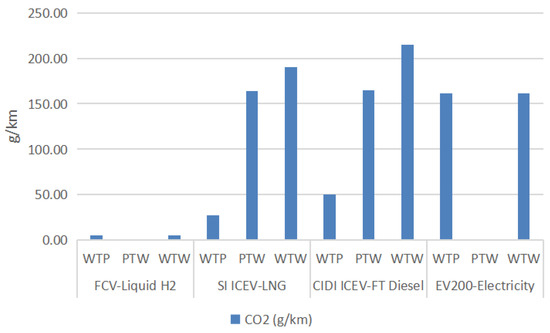
Figure 5.
CO2 emissions of FCVs, SI ICEVs, CIDI ICEVs, and EVs.
The WTW CO emissions of FCVs, SI ICEVs, CIDI ICEVs, and EVs according to the GREET software can be seen in Figure 6. Compared to carbon dioxide, the CO emissions of various types of vehicles in their lifecycle are greatly reduced, with hydrogen fuel cell vehicles having lifecycle CO emissions of 8.33 mg/km, SI ICEVs at 1811.00 mg/km, CIDI ICEVs at 2254.00 mg/km, and EVs at 55.00 mg/km. Both hydrogen fuel cell and electric logistics vehicles achieve zero CO emissions during the vehicle use phase, but the CO emissions of electric logistics vehicles during their lifecycle are more than six times higher than that of hydrogen fuel cell logistics vehicles. The lifecycle CO emissions of natural gas logistics vehicles are 217 times higher than that of hydrogen fuel cell logistics vehicles, and the emissions of diesel logistics vehicles are more than 270 times higher.
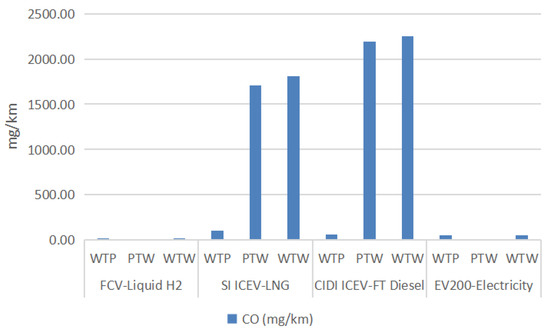
Figure 6.
CO emissions of FCVs, SI ICEVs, CIDI ICEVs, and EVs.
The WTW methane emissions of FCVs, SI ICEVs, CIDI ICEVs, and EVs according to the GREET software are shown in Figure 7. Hydrogen fuel cell logistics vehicles have the lowest lifecycle methane emissions, with only 13.00 mg/km, while natural gas logistics vehicles emit 846.00 mg/km, diesel logistics vehicles emit 540.00 mg/km, and electric logistics vehicles emit 255.00 mg/km. Compared to natural gas logistics vehicles, which have the highest methane emissions, hydrogen fuel cell logistics vehicles reduce methane emissions by 98.46%. Methane is another critical factor in global warming. To achieve the goals of the Paris Agreement, the transportation industry should strictly control methane emissions. In this regard, hydrogen fuel cell logistics vehicles clearly have more advantages than the other three types of vehicles.
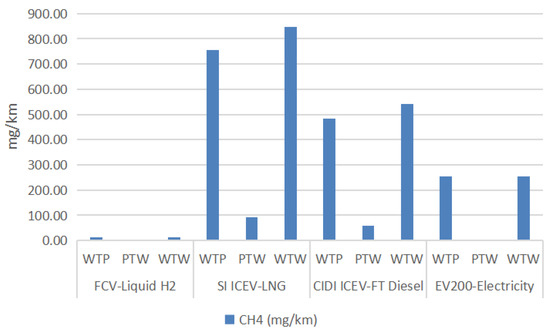
Figure 7.
CH4 emissions of FCVs, SI ICEVs, CIDI ICEVs, and EVs.
The WTW nitrous oxide emissions of FCVs, SI ICEVs, CIDI ICEVs, and EVs according to the GREET software are presented in Figure 8. The lifecycle N2O emissions of the four vehicle types are as follows: hydrogen fuel cell logistics vehicles emit 0.10 mg/km, natural gas logistics vehicles emit 6.97 mg/km, diesel logistics vehicles emit 0.87 mg/km, and electric logistics vehicles emit 3.82 mg/km. Among the four vehicle types, natural gas logistics vehicles have the highest N2O emissions, while hydrogen fuel cell logistics vehicles have the lowest emissions.
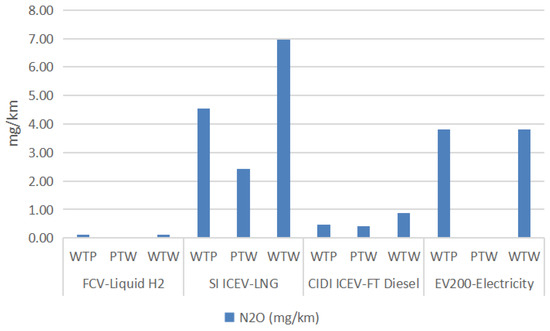
Figure 8.
N2O emissions of FCVs, SI ICEVs, CIDI ICEVs, and EVs.
The WTW NOX emissions of FCVs, SI ICEVs, CIDI ICEVs, and EVs according to the GREET software are shown in Figure 9. The lifecycle NOX emissions of FCVs are the lowest among all vehicle types at 8.42 mg/km, while SI ICEVs emit 180.00 mg/km, CIDI ICEVs emit 132.00 mg/km, and EVs emit 121.00 mg/km. Similar to the emissions of methane and N2O, natural gas logistics vehicles have the highest NOX emissions among the four vehicle types.
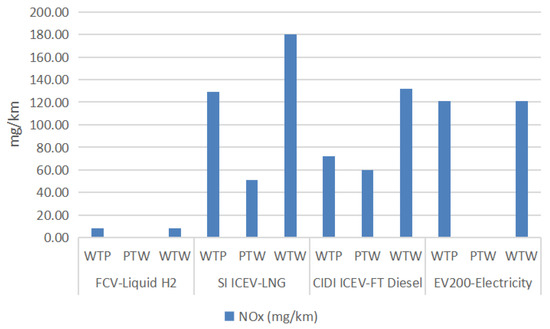
Figure 9.
NOX emissions of FCVs, SI ICEVs, CIDI ICEVs, and EVs.
The WTW SOX emissions of FCVs, SI ICEVs, CIDI ICEVs, and EVs according to the GREET software can be found in Figure 10. EVs have the highest lifecycle SOx emissions at 155.00 mg/km, while FCVs have the lowest emissions at 2.69 mg/km. SI ICEVs emit 38.00 mg/km, and CIDI ICEVs emit 37.00 mg/km. Despite this, hydrogen fuel cell logistics vehicles still have the best environmental performance among the four vehicle types.
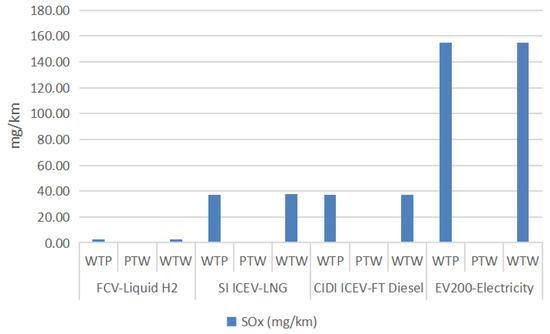
Figure 10.
SOX emissions of FCVs, SI ICEVs, CIDI ICEVs, and EVs.
The WTW VOC emissions of FCVs, SI ICEVs, CIDI ICEVs, and EVs according to the GREET software are presented in Figure 11. The lifecycle VOC emissions of the four vehicle types are as follows: FCVs emit 1.77 mg/km, SI ICEVs emit 76.00 mg/km, CIDI ICEVs emit 119.00 mg/km, and EVs emit 14.00 mg/km. Compared to NG and diesel-powered logistics vehicles, both hydrogen fuel cell and electric logistics vehicles significantly reduce VOC emissions and achieve zero emissions during the PTW phase. However, hydrogen fuel cell logistics vehicles still have the best environmental performance.
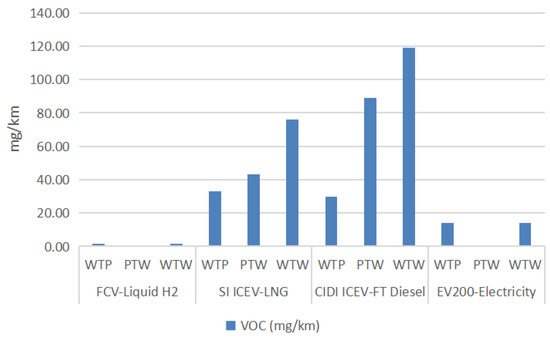
Figure 11.
VOC emissions of FCVs, SI ICEVs, CIDI ICEVs, and EVs.
The WTW PM10 emissions of FCVs, SI ICEVs, CIDI ICEVs, and EVs according to the GREET software can be seen in Figure 12. Electric logistics vehicles have a significantly higher lifecycle PM10 emission of 25 mg/km compared to the other three vehicle types, and it is all concentrated in the WTP phase. This is due to the significant emission of particulate matter from the thermal power generation process, which accounts for a substantial portion of the electricity grid’s generation sources. The PM10 emissions for the other three vehicle types are as follows: FCVs emit 0.66 mg/km, SI ICEVs emit 4.44 mg/km, and CIDI ICEVs emit 6.08 mg/km. Hydrogen fuel cell logistics vehicles have the least PM10 emissions among the four vehicle types.
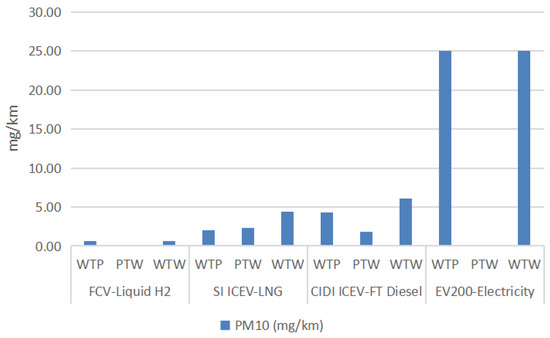
Figure 12.
PM10 emissions of FCVs, SI ICEVs, CIDI ICEVs, and EVs.
Finally, the WTW PM2.5 emissions of FCVs, SI ICEVs, CIDI ICEVs, and EVs according to the GREET software are presented in Figure 13. The lifecycle PM2.5 emissions for the four vehicle types are slightly lower than their PM10 emissions, with specific emissions as follows: FCVs emit 0.39 mg/km, SI ICEVs emit 3.69 mg/km, CIDI ICEVs emit 5.15 mg/km, and EVs emit 11.00 mg/km. Electric logistics vehicles have the highest PM2.5 emissions among the four vehicle types.
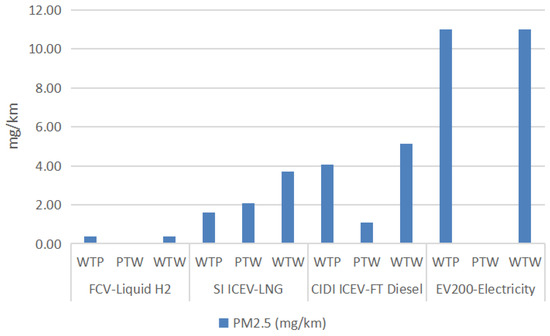
Figure 13.
PM2.5 emissions of FCVs, SI ICEVs, CIDI ICEVs, and EVs.
4. Conclusions
Studying the full lifecycle energy consumption and air emissions of hydrogen fuel cell logistics vehicles is of significant importance. This research helps China’s transportation sector achieve energy conservation, emission reduction, and the dual-carbon goals. Additionally, it promotes green logistics in the logistics industry. This study compared the full lifecycle energy consumption and emissions of hydrogen fuel cell logistics vehicles with those of conventional energy sources such as diesel logistics vehicles, natural gas logistics vehicles that are considered to be sources of potential alternative energy in the short term, and rapidly emerging new energy electric logistics vehicles. The research findings indicate that hydrogen fuel cell and electric logistics vehicles have significant advantages over natural gas logistics and diesel logistics vehicles in terms of energy consumption, with slightly lower energy consumption for electric logistics vehicles than hydrogen fuel cell logistics vehicles. Regarding air pollution emissions, the lifecycle emissions of the nine airborne pollutants for hydrogen fuel cell logistics vehicles are the lowest among the four vehicle types and have the best environmental performance. Natural gas logistics vehicles have the highest methane, N2O, and NOX emissions among the four vehicle types, and diesel logistics vehicles have the highest CO2, CO, and VOC emissions. Additionally, electric logistics vehicles have the highest SOX, PM10, and PM2.5 emissions among the four vehicle types. Based on the full lifecycle energy consumption and emissions performance of the four vehicle types, the following conclusions can be drawn:
- The comprehensive energy conservation and emission reduction benefits of hydrogen fuel cell logistics vehicles are the best among the four vehicle types.
- Development of hydrogen fuel cell logistics vehicles can help the transportation sector achieve energy conservation and emission reduction goals.
- For countries like China and the USA that primarily rely on fossil energy sources, the energy consumption and emissions performance of logistics vehicles largely depend on the country’s energy structure; therefore, clean energy should be integrated more into the structure.
- The optimization of the power grid structure, increasing the proportion of clean energy generation is necessary.
- Advanced clean hydrogen production technologies should be developed to further reduce the WTP stage energy consumption and emissions of hydrogen energy.
Based on the comprehensive findings of this study and the conclusions drawn by previous scholars, the following recommendations can be proposed for government policy making and industry development:
- In the short to medium term, the government should prioritize energy conservation and emission reduction efforts by optimizing diesel engine technology and promoting natural gas vehicles as a short-term substitute for diesel. Simultaneously, there should be substantial efforts to develop clean energy generation and promote the adoption of electric vehicles.
- Due to the unparalleled advantages of hydrogen energy, the government should consider the development of hydrogen technology as a long-term goal.
- The hydrogen energy industry should establish relevant standards to regulate the development of hydrogen production technologies.
- The results of this research are not only applicable to China and the USA but can also serve as a reference for developing countries similar to China, aiding in optimizing their energy structure.
- Different countries should formulate suitable energy development strategies based on their specific circumstances and technological advancements. For instance, countries with mature nuclear technologies can prioritize hydrogen production from nuclear energy, while nations with relatively lagging technologies may consider importing hydrogen technologies or adopting established methods like water electrolysis.
Author Contributions
Conceptualization, S.Q. and L.L.; methodology, S.Q.; software, S.Q.; validation, S.Q. and L.L.; formal analysis, S.Q.; investigation, S.Q.; resources, S.Q.; data curation, S.Q.; writing—original draft preparation, S.Q.; writing—review and editing, S.Q. and L.L.; visualization, S.Q.; supervision, L.L.; project administration, L.L. All authors have read and agreed to the published version of the manuscript.
Funding
This work was supported by the Shaanxi Provincial Science and Technology Foundation of China, grant number 2023-JC-YB-628.
Data Availability Statement
The data presented in this study are available in the article.
Conflicts of Interest
The authors declare no conflict of interest.
Nomenclature
| CAP | Conventional air pollutant |
| CIDI ICEV | Compression-ignition direct-injection internal combustion engine vehicle |
| EV | Electric vehicle |
| FCV | Fuel cell vehicle |
| GHG | Greenhouse gas |
| GREET | Greenhouse gases, regulated emissions, and energy use in transportation |
| HFCV | Hydrogen fuel cell vehicle |
| ICEV | Internal combustion engine vehicle |
| LCA | Lifecycle assessment |
| LNG | Liquefied natural gas |
| LH2 | Liquid hydrogen |
| MHDV | Medium- and heavy-duty vehicle |
| MHD BEV | Medium- and heavy-duty battery electric vehicle |
| PM2.5 | Particulate matter with a diameter of 2.5 mm |
| PM10 | Particulate matter with a diameter of 10 mm |
| PTW | Pump-to-wheel |
| SI ICEV | Spark-ignition internal combustion engine vehicle |
| SI HEV | Spark-ignition hybrid electric vehicle |
| VOC | Volatile organic compound |
| WTW | Well-to-wheel |
| WTP | Well-to-pump |
References
- Hussain, S.A.; Razi, F.; Hewage, K.; Sadiq, R. The Perspective of Energy Poverty and 1st Energy Crisis of Green Transition. Energy 2023, 275, 127487. [Google Scholar] [CrossRef]
- UN Environment Programme. Making Peace with Nature. Available online: http://www.unep.org/resources/making-peace-nature (accessed on 17 April 2023).
- UNFCCC. The Paris Agreement. Available online: https://unfccc.int/process-and-meetings/the-paris-agreement (accessed on 17 April 2023).
- Candelaresi, D.; Valente, A.; Iribarren, D.; Dufour, J.; Spazzafumo, G. Novel Short-Term National Strategies to Promote the Use of Renewable Hydrogen in Road Transport: A Life Cycle Assessment of Passenger Car Fleets Partially Fuelled with Hydrogen. Sci. Total Environ. 2023, 859, 160325. [Google Scholar] [CrossRef] [PubMed]
- UNFCCC. The Glasgow Climate Pact—Key Outcomes from COP26. Available online: https://unfccc.int/process-and-meetings/the-paris-agreement/the-glasgow-climate-pact-key-outcomes-from-cop26 (accessed on 17 April 2023).
- National Data. Available online: https://data.stats.gov.cn/english/easyquery.htm?cn=C01 (accessed on 20 April 2023).
- Ministry of Ecology and Environment the People’s Republic of China. Available online: http://english.mee.gov.cn/ (accessed on 20 April 2023).
- Yoro, K.O.; Daramola, M.O. CO2 Emission sources, greenhouse gases, and the global warming effect. In Advances in Carbon Capture; Elsevier: Amsterdam, The Netherlands, 2020; pp. 3–28. ISBN 978-0-12-819657-1. [Google Scholar]
- Yang, S.; Chen, B.; Ulgiati, S. Co-Benefits of CO2 and PM2.5 Emission Reduction. Energy Procedia 2016, 104, 92–97. [Google Scholar] [CrossRef]
- Bao, R.; Liu, T. How Does Government Attention Matter in Air Pollution Control? Evidence from Government Annual Reports. Resour. Conserv. Recycl. 2022, 185, 106435. [Google Scholar] [CrossRef]
- Hall-Spencer, J.; Allen, R. The Impact of CO2 Emissions on “nuisance” Marine Species. Res. Rep. Biodivers. Stud. 2015, 4, 33–46. [Google Scholar] [CrossRef]
- Scoccimarro, E.; Gualdi, S.; Villarini, G.; Vecchi, G.A.; Zhao, M.; Walsh, K.; Navarra, A. Intense Precipitation Events Associated with Landfalling Tropical Cyclones in Response to a Warmer Climate and Increased CO2. J. Clim. 2014, 27, 4642–4654. [Google Scholar] [CrossRef]
- Amoatey, P.; Omidvarborna, H.; Baawain, M.S.; Al-Mamun, A. Emissions and Exposure Assessments of SOX, NOX, PM10/2.5 and Trace Metals from Oil Industries: A Review Study (2000–2018). Process Saf. Environ. Prot. 2019, 123, 215–228. [Google Scholar] [CrossRef]
- United States Environmental Protection Agency. Health and Environmental Effects of Particulate Matter (PM). Available online: https://www.epa.gov/pm-pollution/health-and-environmental-effects-particulate-matter-pm (accessed on 22 April 2023).
- Sgobba, F.; Sampaolo, A.; Patimisco, P.; Giglio, M.; Menduni, G.; Ranieri, A.C.; Hoelzl, C.; Rossmadl, H.; Brehm, C.; Mackowiak, V.; et al. Compact and Portable Quartz-Enhanced Photoacoustic Spectroscopy Sensor for Carbon Monoxide Environmental Monitoring in Urban Areas. Photoacoustics 2022, 25, 100318. [Google Scholar] [CrossRef]
- Pinthong, N.; Thepanondh, S.; Kondo, A. Source Identification of VOCs and Their Environmental Health Risk in a Petrochemical Industrial Area. Aerosol Air Qual. Res. 2022, 22, 210064. [Google Scholar] [CrossRef]
- Teimouri, A.; Zayer Kabeh, K.; Changizian, S.; Ahmadi, P.; Mortazavi, M. Comparative Lifecycle Assessment of Hydrogen Fuel Cell, Electric, CNG, and Gasoline-Powered Vehicles under Real Driving Conditions. Int. J. Hydrogen Energy 2022, 47, 37990–38002. [Google Scholar] [CrossRef]
- Kalghatgi, G. Is It Really the End of Internal Combustion Engines and Petroleum in Transport? Appl. Energy 2018, 225, 965–974. [Google Scholar] [CrossRef]
- Zhu, J.; Li, Y.; Cao, W.; Li, Y.; Gao, Z. Failure Analysis of Novel BOSS Structures for Type IV Hydrogen Storage Vessels. Energies 2023, 16, 4005. [Google Scholar] [CrossRef]
- Sun, Z.-Y.; Li, G.-X. On Reliability and Flexibility of Sustainable Energy Application Route for Vehicles in China. Renew. Sustain. Energy Rev. 2015, 51, 830–846. [Google Scholar] [CrossRef]
- DOE. US National Clean Hydrogen Strategy and Roadmap (Draft): DOE Hydrogen Program. Available online: https://www.hydrogen.energy.gov/clean-hydrogen-strategy-roadmap.html (accessed on 25 April 2023).
- EU Hydrogen Strategy. Available online: https://energy.ec.europa.eu/topics/energy-systems-integration/hydrogen_en (accessed on 25 April 2023).
- Korea Hydrogen Economy Roadmap 2040—Policies. Available online: https://www.iea.org/policies/6566-korea-hydrogen-economy-roadmap-2040 (accessed on 25 April 2023).
- National Energy Administration. Medium and Long-Term Plan for the Development of Hydrogen Energy Industry (2021–2035). Available online: http://zfxxgk.nea.gov.cn/2022-03/23/c_1310525630.htm (accessed on 25 April 2023).
- Liu, X.; Reddi, K.; Elgowainy, A.; Lohse-Busch, H.; Wang, M.; Rustagi, N. Comparison of Well-to-Wheels Energy Use and Emissions of a Hydrogen Fuel Cell Electric Vehicle Relative to a Conventional Gasoline-Powered Internal Combustion Engine Vehicle. Int. J. Hydrogen Energy 2020, 45, 972–983. [Google Scholar] [CrossRef]
- Liu, X.; Elgowainy, A.; Vijayagopal, R.; Wang, M. Well-to-Wheels Analysis of Zero-Emission Plug-In Battery Electric Vehicle Technology for Medium- and Heavy-Duty Trucks. Environ. Sci. Technol. 2021, 55, 538–546. [Google Scholar] [CrossRef]
- Burnham, A.; Lu, Z.; Wang, M.; Elgowainy, A. Regional Emissions Analysis of Light-Duty Battery Electric Vehicles. Atmosphere 2021, 12, 1482. [Google Scholar] [CrossRef]
- Correa, G.; Muñoz, P.; Falaguerra, T.; Rodriguez, C.R. Performance Comparison of Conventional, Hybrid, Hydrogen and Electric Urban Buses Using Well to Wheel Analysis. Energy 2017, 141, 537–549. [Google Scholar] [CrossRef]
- Elgowainy, A.; Wang, M.; Joseck, F.; Ward, J. Life-cycle analysis of fuels and vehicle technologies. In Encyclopedia of Sustainable Technologies; Elsevier: Amsterdam, The Netherlands, 2017; pp. 317–327. ISBN 978-0-12-804792-7. [Google Scholar]
- Ugurlu, A.; Oztuna, S. How Liquid Hydrogen Production Methods Affect Emissions in Liquid Hydrogen Powered Vehicles? Int. J. Hydrogen Energy 2020, 45, 35269–35280. [Google Scholar] [CrossRef]
- Wang, Q.; Xue, M.; Lin, B.-L.; Lei, Z.; Zhang, Z. Well-to-Wheel Analysis of Energy Consumption, Greenhouse Gas and Air Pollutants Emissions of Hydrogen Fuel Cell Vehicle in China. J. Clean. Prod. 2020, 275, 123061. [Google Scholar] [CrossRef]
- He, X.; Wang, F.; Wallington, T.J.; Shen, W.; Melaina, M.W.; Kim, H.C.; De Kleine, R.; Lin, T.; Zhang, S.; Keoleian, G.A.; et al. Well-to-Wheels Emissions, Costs, and Feedstock Potentials for Light-Duty Hydrogen Fuel Cell Vehicles in China in 2017 and 2030. Renew. Sustain. Energy Rev. 2021, 137, 110477. [Google Scholar] [CrossRef]
- Saafi, M.A.; Ou, S.; Jiang, Y.; Li, H.; He, X.; Lin, Z.; Gan, Y.; Lu, Z.; Dawson, S.T.M. Exploring the Potential of Hydrogen in Decarbonizing China’s Light-Duty Vehicle Market. Int. J. Hydrogen Energy 2022, 47, 36355–36371. [Google Scholar] [CrossRef]
- Wei, Q.S.; Zhang, X.; Oh, B.S. The Effect of Driving Cycles and H2 Production Pathways on the Lifecycle Analysis of Hydrogen Fuel Cell Vehicle: A Case Study in South Korea. Int. J. Hydrogen Energy 2021, 46, 7622–7633. [Google Scholar] [CrossRef]
- Lu, Q.; Zhang, B.; Yang, S.; Peng, Z. Life Cycle Assessment on Energy Efficiency of Hydrogen Fuel Cell Vehicle in China. Energy 2022, 257, 124731. [Google Scholar] [CrossRef]
- Hwang, J.-J. Sustainability Study of Hydrogen Pathways for Fuel Cell Vehicle Applications. Renew. Sustain. Energy Rev. 2013, 19, 220–229. [Google Scholar] [CrossRef]
- Ahmadi, P.; Khoshnevisan, A. Dynamic Simulation and Lifecycle Assessment of Hydrogen Fuel Cell Electric Vehicles Considering Various Hydrogen Production Methods. Int. J. Hydrogen Energy 2022, 47, 26758–26769. [Google Scholar] [CrossRef]
- Lee, D.-Y.; Elgowainy, A.; Kotz, A.; Vijayagopal, R.; Marcinkoski, J. Life-Cycle Implications of Hydrogen Fuel Cell Electric Vehicle Technology for Medium- and Heavy-Duty Trucks. J. Power Sources 2018, 393, 217–229. [Google Scholar] [CrossRef]
- Argonne National Laboratory. GREET Model. 2022. Available online: https://greet.es.anl.gov/index.php?content=greetdotnet (accessed on 3 May 2023).
- Hao, H.; Liu, Z.; Zhao, F.; Li, W. Natural Gas as Vehicle Fuel in China: A Review. Renew. Sustain. Energy Rev. 2016, 62, 521–533. [Google Scholar] [CrossRef]
Disclaimer/Publisher’s Note: The statements, opinions and data contained in all publications are solely those of the individual author(s) and contributor(s) and not of MDPI and/or the editor(s). MDPI and/or the editor(s) disclaim responsibility for any injury to people or property resulting from any ideas, methods, instructions or products referred to in the content. |
© 2023 by the authors. Licensee MDPI, Basel, Switzerland. This article is an open access article distributed under the terms and conditions of the Creative Commons Attribution (CC BY) license (https://creativecommons.org/licenses/by/4.0/).