1. Introduction
Tire and road wear particles (TRWP), tiny particles generally induced to the abrasion between tire and road when a vehicle runs, are mainly generated at the frictional surface between tires and roads, and contain various substances that were used in the tire tread and road pavement. Heavy particles of the generated TRWP accumulate on roads and roadsides by vehicular movement and wind, while lighter particles are suspended in the atmosphere and then descend onto the surface of roads and roadsides after the stabilization of the traffic and atmospheric conditions over time. Such particles either settle in soil with moisture during rains or road-washing, or they flow into rivers and seas. Therefore, TRWP impacts the atmosphere and soil, as well as the aquatic environment [
1,
2,
3,
4]. Studies have been conducted under various conditions to understand the environmental impact of TRWP and the mechanism thereof [
2,
3,
5,
6,
7,
8]. Various studies have been conducted on tires, mainly focusing on the shape and size of wear particles, emission characteristics, marker analysis, physicochemical composition, and the effect of tire particles on the air quality. Owing to this, a need to regulate TRWP emissions along with the PM from automobile exhaust gas is being discussed worldwide. Detailed investigations are required to precisely analyze the physico-chemical analysis of TRWP, accurate measurement of emissions, and proportion of TRWP in the atmosphere.
Tires are generally manufactured with rubber, fillers, process oils, additives, and vulcanization agents. Natural rubber (NR), a raw material obtained from plants, and styrene-butadiene rubber (SBR), a synthetic rubber made by various copolymers, account for 40 to 60% of a tire. Fillers, which are mainly made of carbon black, represent 20 to 35% [
9]. Chemical marker analysis has been used to analyze TRWP in the atmosphere, with vinylcyclohexene, dipentene, styrene, and butadiene serving as markers [
1,
6]. These markers are analyzed to understand the tire characteristics and the proportion of TRWP in the PM sampled in the atmosphere. The impact and emission of TRWP in the atmosphere have also been analyzed through the analysis of organic and inorganic matters, such as polycyclic aromatic hydrocarbons (PAHs), various chemical components, and heavy metals [
5,
10,
11,
12,
13].
Previous studies on the properties of TRWP reported the characteristics of tires and PM in the atmosphere by conducting thermal gravimetric analysis (TGA), a method of thermal analysis in which the sample weight change and the rate of weight change with concern of temperature, time and atmosphere, differential scanning calorimetry (DSC), a thermos-analytical system measuring temperature, heat flows, and the rate of heat flow associated with thermal transitions in a sample material, and pyrolysis–gas chromatography/mass spectrometry (GC/MS), an analytical instrument combining the features of gas chromatography and mass spectrometry to provide the identification of different compounds within a test sample, on tire samples and wear particles collected in the atmosphere [
1,
4,
14,
15]. In [
1], the pyrolysis–GC/MS analysis revealed that the contributions of tire particles (TP) and TRWP in PM10 are 0.23–1.24% and 0.45–2.48%, respectively.
PAHs have been analyzed mainly by a high-performance liquid chromatography (HPLC), an instrument to identify and quantify different compounds in a liquid mixture, and a GC/MS to characterize tire samples and PM in the atmosphere [
16,
17,
18,
19,
20,
21,
22]. PAHs are organic compounds in which two or more benzene rings are connected [
11]. They are mainly adsorbed on gaseous or fine particulate matter [
23] and are reported to be potentially toxic, carcinogenic, and mutagenic substances [
20,
24], which are very harmful to the human body [
25]. Long-term and short-term methods have been used to extract PAHs-containing compounds from the atmosphere for analysis [
11,
19,
26,
27].
For analyzing heavy metals, many experimental methods have been developed using various instruments, such as energy-dispersive X-ray spectroscopy (EDX) to identify the elemental composition in the solid material, X-ray fluorescence (XRF) to determine the elemental composition in various materials (solid, liquid and slurry), and inductively coupled plasma–optical emission spectroscopy/mass spectrometry (ICP-OES/MS) for the multi-element analysis of aqueous samples by routine analysis (ICP-OES) or trace analysis and identification of elemental isotope (ICP-MS), depending on the research purpose. It has been reported that tire treads contain heavy metals, such as Mn, Fe, Co, Ni, Cu, Zn, Cd, and Pb [
13], and that they partially contribute to the PM concentration in the atmosphere [
12,
28]. Zinc oxides are added as activators during the vulcanization process and they are known to constitute 0.4 to 4.3% of tire treads [
13]. Zinc from tires is known to be a major pollutant of soil, air, road dust, and urban atmosphere [
4,
29,
30]. It was also reported that other heavy metals that constitute tire treads also contaminate the environment [
12,
31].
In this study, the influence of TRWP on airborne PM was investigated with a chemically analytical method coupling with a quantitative pyrolysis–GC/MS protocol and PM samples from tire and air. While there are noteworthy advances in the analysis of the physical and chemical properties of TRWP that reported changes in the characteristics of tires and PM in the atmosphere, detailed information on the tire-induced particulate emissions from a vehicle driving in realistic conditions is still required to effectively predict the effect of tire on the environment. The markers, vinylcyclohexene (a tracing material of SBR) and dipentene (a tracing material of NR), from the rubber used in tires were derived via pyrolysis–GC/MS, GC/MS, and ICP/MS. Additionally, PM samples from the atmosphere, and PAHs and heavy metals from tire samples were analyzed. A short-term accelerated solvent extraction (ASE) method, a sample preparation method for extracting high-quality chemicals from a complex solid or slurry mixture, was applied for PAH analysis. The extracted compounds were analyzed by the EPA Method TO-13A usually used to determine polycyclic aromatic hydrocarbons in samples, using internal standards. Finally, the measured marker concentrations were analyzed to investigate the effect of tire abrasion particles on PM in the atmosphere.
3. Chemical Analysis
The markers in the tire rubber were analyzed for TRWP with a quantitative pyrolysis–GC/MS protocol, based on the ISO/TS 20593 method (ISO/TS 20593, 2017). In this study, SBR and NR were thermally decomposed into the polymers that constitute tires, and vinylcyclohexene (a tracing material of SBR) and dipentene (a tracing material of NR) were measured with GC/MS.
The samples were placed in the sample cup of a pyrolyzer (Pyrolyzer-3030D, Frontier Lab, Fukusima, Japan) and analyzed with GC/MS (Agilent 5975B, Agilent, Santa Clara, CA, USA), and first and second pyrolysis (i.e., double-shot analysis) were conducted. The GC/MS was calibrated using the auto-tune method suggested by the manufacturer. In this method, peaks for the mass ions of 69, 219, and 502 m/z are examined using perfluorotributylamine (PFTBA), and proportions in the three different ranges of 70–69, 220–219, and 503–502 m/z were analyzed by measuring peaks for the isotope mass ions of 70, 220, and 503 m/z. Additionally, the ratios between 69 and 219 m/z and between 69 and 502 m/z were measured to confirm that they were higher than a certain value. The system was calibrated by analyzing the proportions of the precursors of 69, 219, and 502 m/z and through the ratios between 18 and 69 m/z and 28 and 69 m/z. The precision and accuracy of pyrolysis–GC/MS were 0.03–0.3 ppb and 0.5–10.1%, with the calibration curves being 0.992–0.996 for linearity.
The GC/MS was calibrated with two procedures. The check for air and water background and mass calibration. For air and water background checks, the ratio of air to water background was used to determine a mass spectrometer’s “leak tightness” and overall suitability to run samples. The Bench TOF-dx requires that for a leak-tight system, the molar mass of water (i.e., 18 g/mol) is at a higher intensity than both, the molar mass of nitrogen (i.e., 28 g/mol) and the molar mass of oxygen (i.e., 32 g/mol) background. The ratios of 18 to 19, and 28 to 32 indicate instrument performance. The ratios of N
2 to O
2 in ambient air and H
2O to protonated H
2O were tested to be 4:1 and 9:1, respectively. Automatic mass calibration, as suggested by the manufacturer, was applied using PFTBA. In this method, the peak finding algorithm of the automatic mass calibration assumes that all mass peaks can be found within approximately 1 amu of the initial calibration. First, the mass calibration valve was opened and the liquid calibration vapor, PFTBA, was introduced into the ion source. Thereafter, the mass calibration valve was closed and a backup of the old parameter settings was made. A peak finding algorithm identified the predefined mass peaks of the selected calibration substance in the flight-time spectra, and then it calculated coefficients for the flight time/mass conversion. The coefficients and flight times were stored as new default values for future measurements. PAHs were analyzed using the following procedure. The mixture of two surrogate standards (D
10-fluorene and D
10-pyrene) was injected into the tire sample and quartz fiber filter and they were placed in the extraction cell in an accelerated solvent extractor (200, Dionex, Sunnyvale, CA, USA). From the tire sample, PAHs were extracted using 10% acetone/methylene chloride at 100 °C and 1500 psi. From TSP, which is a sample collected in the atmosphere, PAHs were extracted using the same method but using 10% ethyl ether/hexane. The extracted samples were analyzed using GC/MS (Aglient 7890A, Agilent, Santa Clara, CA, USA/TD100, Markes, Wales, UK). In [
17,
18], the tire samples were analyzed with an ASE extractor and GC/MS. EPA 610 PAH Mix (AccuStandard, New Haven, CT, USA) was used as a standard. Phenanthrene, fluoranthene, pyrene, benzo(g,h,i)perylene, and naphthalene were measured using the EPA Method TO-13A for analyzing PAHs samples collected from the atmosphere [
33]. The gaseous substance produced through pyrolysis was transported to GC/MS at 1 mL/min using helium gas. The temperature was set to 280 °C for the injector and 250 °C for the detector, respectively, and the sample was injected into the GC injector by 1 μL using an automatic sample injector. DB-5MS (Aglient, Santa Clara, CA, USA) was used for the separation of PAHs. With the method detection limit (MDL), precision and accuracy were 0.06–0.65 ppb and 1.0–13.4% for the VOCs, 7.2–61.7 ppb and 2.4–16.5% for the PAHs, respectively. The R-square of the calibration curves was ranged from 0.993 to 0.998 for linearity.
For analyzing heavy metals in tire samples, organic matter contained in samples was removed using a microwave decomposition system (IT/START D, Milestone, Bergamo, Italy). This pre-treatment process involves placing a tire sample in a decomposition vessel, adding nitric acid (HNO3), and decomposing and removing organic matter and interfering substances. The program of the microwave decomposition system had three steps: (1) The temperature was increased to 210 °C over 15 min. (2) A temperature of 210 °C was maintained for 15 min. (3) Ventilation was performed and the decomposition vessel was cooled to room temperature. The type and the amount of acid were Nitric acid and 10 mL, respectively. Upon the completion of the above process, the vessel was placed in the atmosphere for 2 h until its temperature was reduced to 25 °C. The sample was filtered using filter papers and analyzed using ICP/MS (NexION 5000, PerkinElmer, Waltham, MA, USA). ICP/MS was calibrated using the following method: (1) 24Mg, 115In, and 238U with a concentration of 1 ppb each were used. (2) The sensitivity for each mass region was measured after confirming that the mass signals of the elements were higher than 5000, 25,000, and 20,000 cps. (3) To find the plasma with the appropriate power required for the experiment, the generation of monovalent ions was mainly measured using barium. The conditions for generating divalent ions were also measured. Based on these values, the conditions for generating no divalent ions were found. The equipment was set so that the values of 156CeO/140Ce and 69Ba/138Ba could be maintained at 0.03 or less, respectively. The precision and accuracy were 5 M cps/mg/L for 24Mg, 25 M cps/mg/L for 115In, 20 M cps/mg/L for 238U, and 3% for 156CeO/140Ce, 3% for 69Ba/138Ba. Assuming that the vehicles traveling in the target area have the same components for their tires and the particle component distribution collected in the quartz filter of the high-volume sampler is homogeneous, the amount of TRWP distributed in the atmosphere can be calculated using the ratio of polymers to all components in the tire tread, the ratio between TRWP and tire tread, and the polymer content.
4. Data Analysis
The weight of TRWP collected in the high-volume sampler filter can be calculated as Equation (1):
where,
mTRWP,t is the total mass of
TRWP collected in the high-volume sampler filter,
AT is the area of the high-volume sampler filter,
Aa is the quartz filter area of pyrolysis–GC/MS, and
mTRWP,i is the mass of
TRWP collected in the quartz filter of pyrolysis–GC/MS.
The amount of polymers extracted from the high-volume sampler filter and processed by pyrolysis–GC/MS can be expressed by Equation (2):
where,
mp,i is the weight of the polymers measured in pyrolysis–GC/MS, (
mp/
mTt) is the polymer ratio in the tire tread, and
mTt,i is the tire tread weight tested in pyrolysis–GC/MS.
The amount of tire tread taken out from the high-volume sampler filter and processed by pyrolysis–GC/MS can be expressed by Equation (3):
where,
mTt,i is the weight of tire tread measured in pyrolysis–GC/MS, (
mTt/
mTRWP) is the ratio of tire tread to
TRWP, and
mTRWP,i the weight of
TRWP tested in pyrolysis–GC/MS.
Through Equations (2) and (3), the amount of polymers extracted from the high-volume sampler filter and processed by pyrolysis–GC/MS can be calculated as Equation (4):
Based on Equations (1) and (4), the weight of
TRWP collected in the high-volume sampler filter can be calculated as Equation (5):
Assuming that the ratio of polymer to the tire tread component,
Fr, and the ratio of tire tread to
TRWP FTt, are, respectively, Equations (6) and (7):
Equation (5) can be expressed as Equation (8):
Since the polymers used in tires are generally composed of SBR and NR, the mass of polymers can be expressed as Equation (9):
Substituting Equation (9) into Equation (8), the weight of TRWP collected in the high-volume sampler filter can be calculated as Equation (10):
Therefore, the concentration of TRWP in the atmosphere can be calculated as Equation (11):
Furthermore, the correction formula applied to correct the mass of SBR measured in the pyrolysis–GC/MS analysis using the mass ratio between SBR and BR can be used as Equation (12):
where,
ms is the mass of a standard specimen of SBR.
5. Results
The temperature was maintained at 40 °C for 2 min in the beginning, ramped at a rate of 20 °C/min to 320 °C, and then maintained for 14 min. In the pyrolysis–GC/MS chromatograms for tire particles and TSP, multiple high-peak sections were observed within 15 min after the start of the analysis and low-level peaks appeared afterward for the tire sample. In the case of TSP, high-level peaks appeared within 5 min after the start of an analysis, and intermittent low-level peaks were observed for 16 min. Afterward, no peak was observed. For the tire sample, the graph gradually increased for approximately 14 min after the start of the analysis and then decreased. For TSP, however, no similar tendency was observed. This difference appears to vary depending on the sample characteristics of the tire and TSP. In the pre-test conducted with the standard specimens of SBR and NR, the retention time (RT) was found to be 4.95 min for vinylcyclohexene in SBR and 6.96 min for dipentene in NR. These results were applied to the tire sample and TSP, and vinylcyclohexene and dipentene contained in SBR and NR, respectively, were measured through the substance library of GC/MS and spectrum analysis.
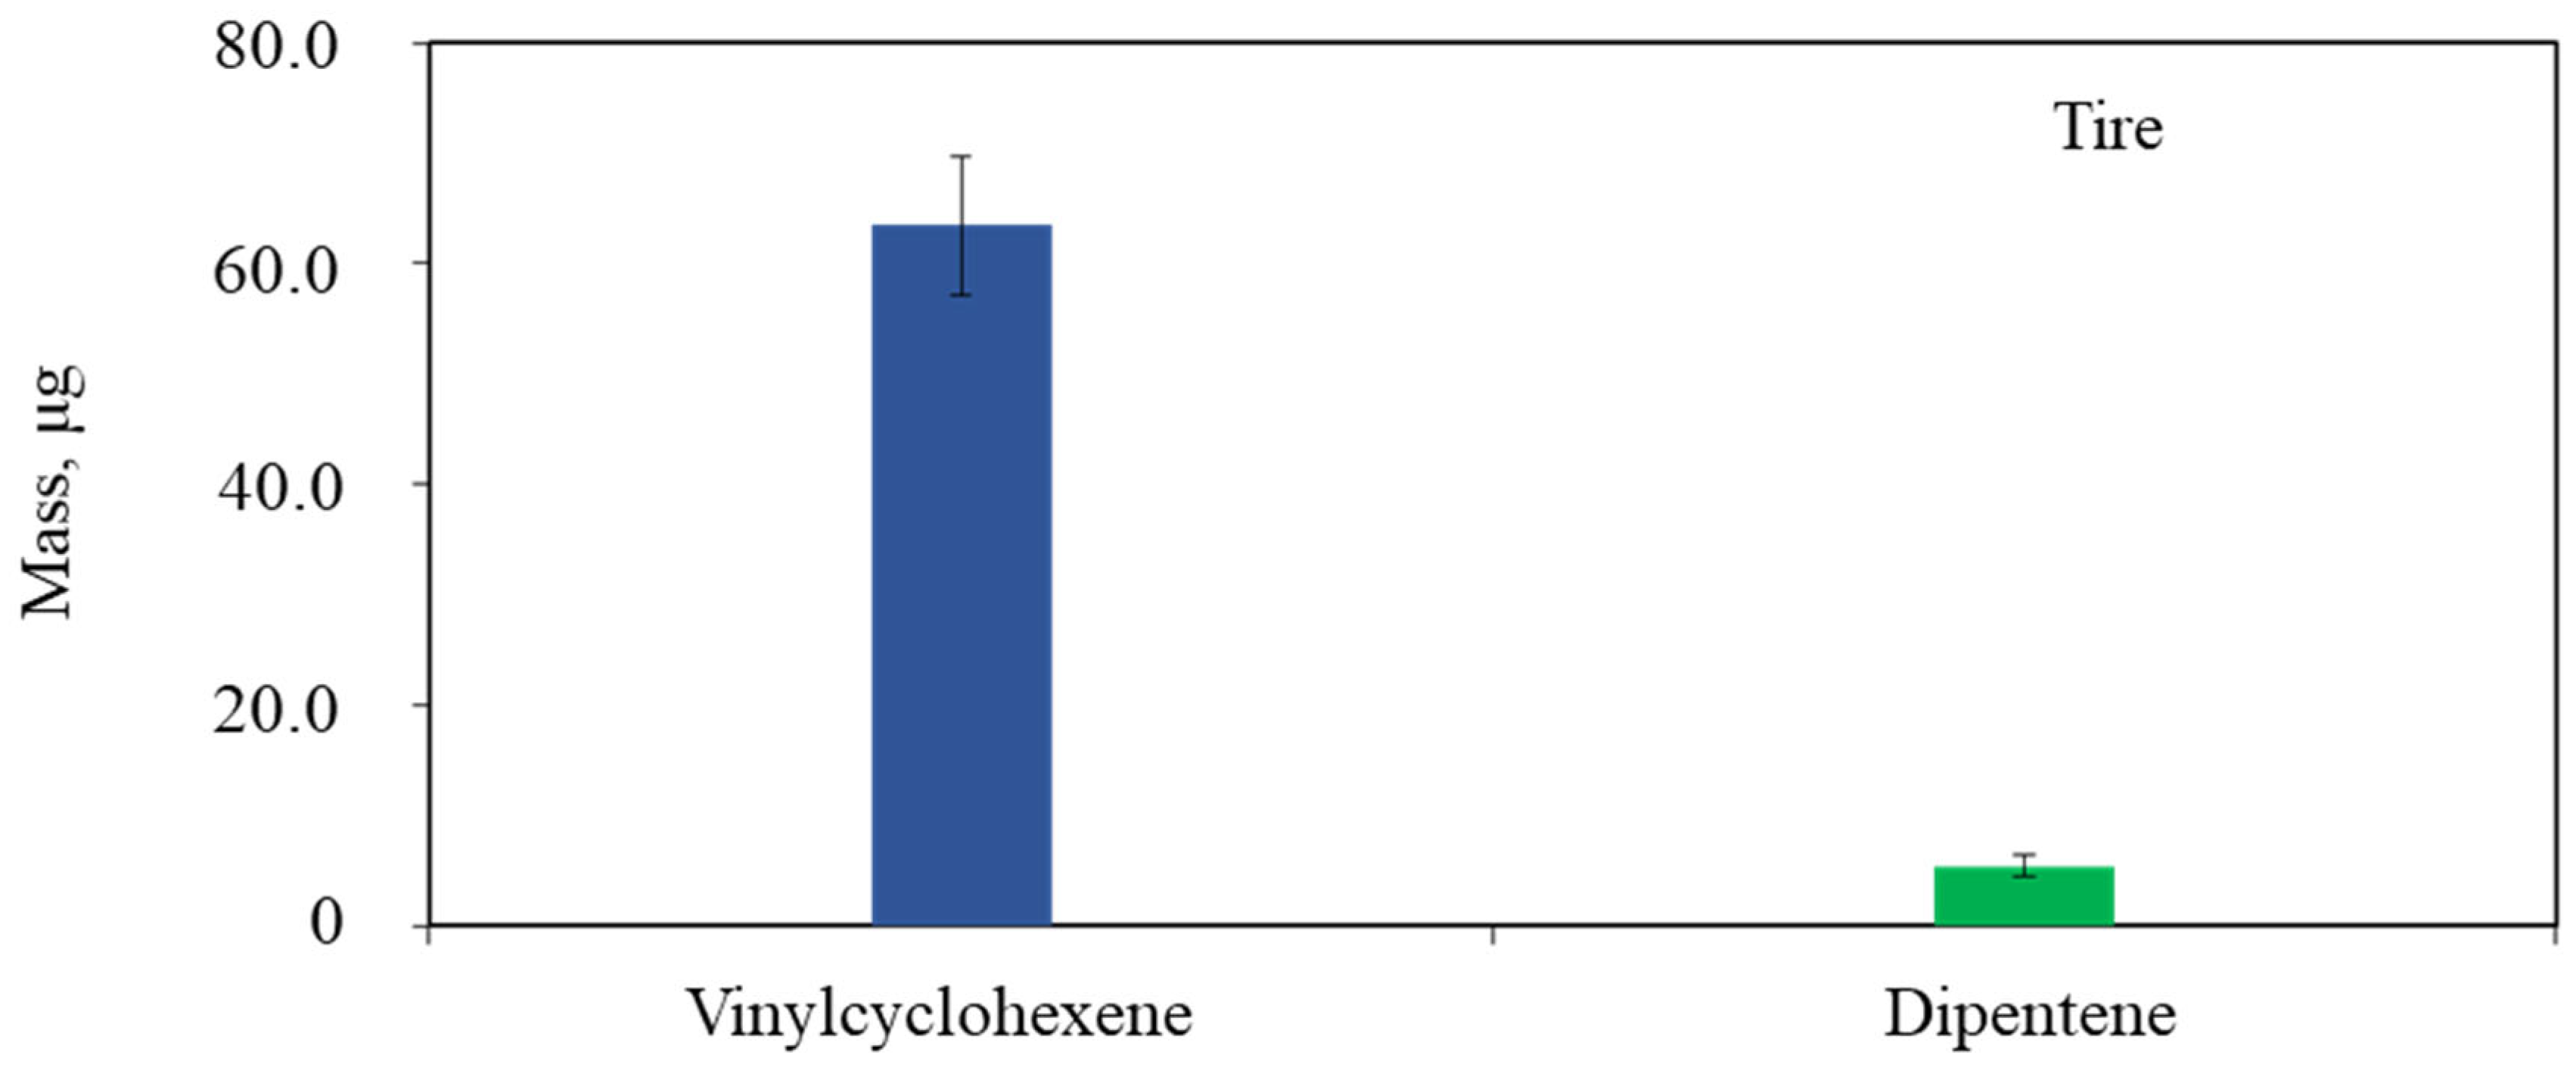
The mass of vinylcyclohexene and dipentene, which are the markers of SBR and NR, respectively, were measured from the tire samples depicted in
Figure 4. Note that error bars indicate 95% confidence intervals. As presented, the average mass of vinylcyclohexene was more highly detected than that of dipentene, which can be due to the gradual increase in SBR, added in the manufacturing process for the tires, compared to NR.
The average mass, standard deviation, and variation for two different tire markers, vinylcyclohexene and dipentene, which were measured from the tire samples, are summarized in
Table 1. The average mass for vinylcyclohexene shows a higher value than that for dipentene, 63.51 μg for vinylcyclohexene and 5.43 μg for dipentene. For the vinylcyclohexene, the high standard deviation and variation are revealed, 21.07 and 443.74, while it is relatively low for dipentene, 3.30 and 10.86, respectively. For the mass of vinylcyclohexene and dipentene involved in the samples of tire and air, the previous study [
34] has reported that the mass trend of vinylcyclohexene and dipentene indicates good agreement with measurement, the mass of SBR and BR is higher than that of NR in tire samples.
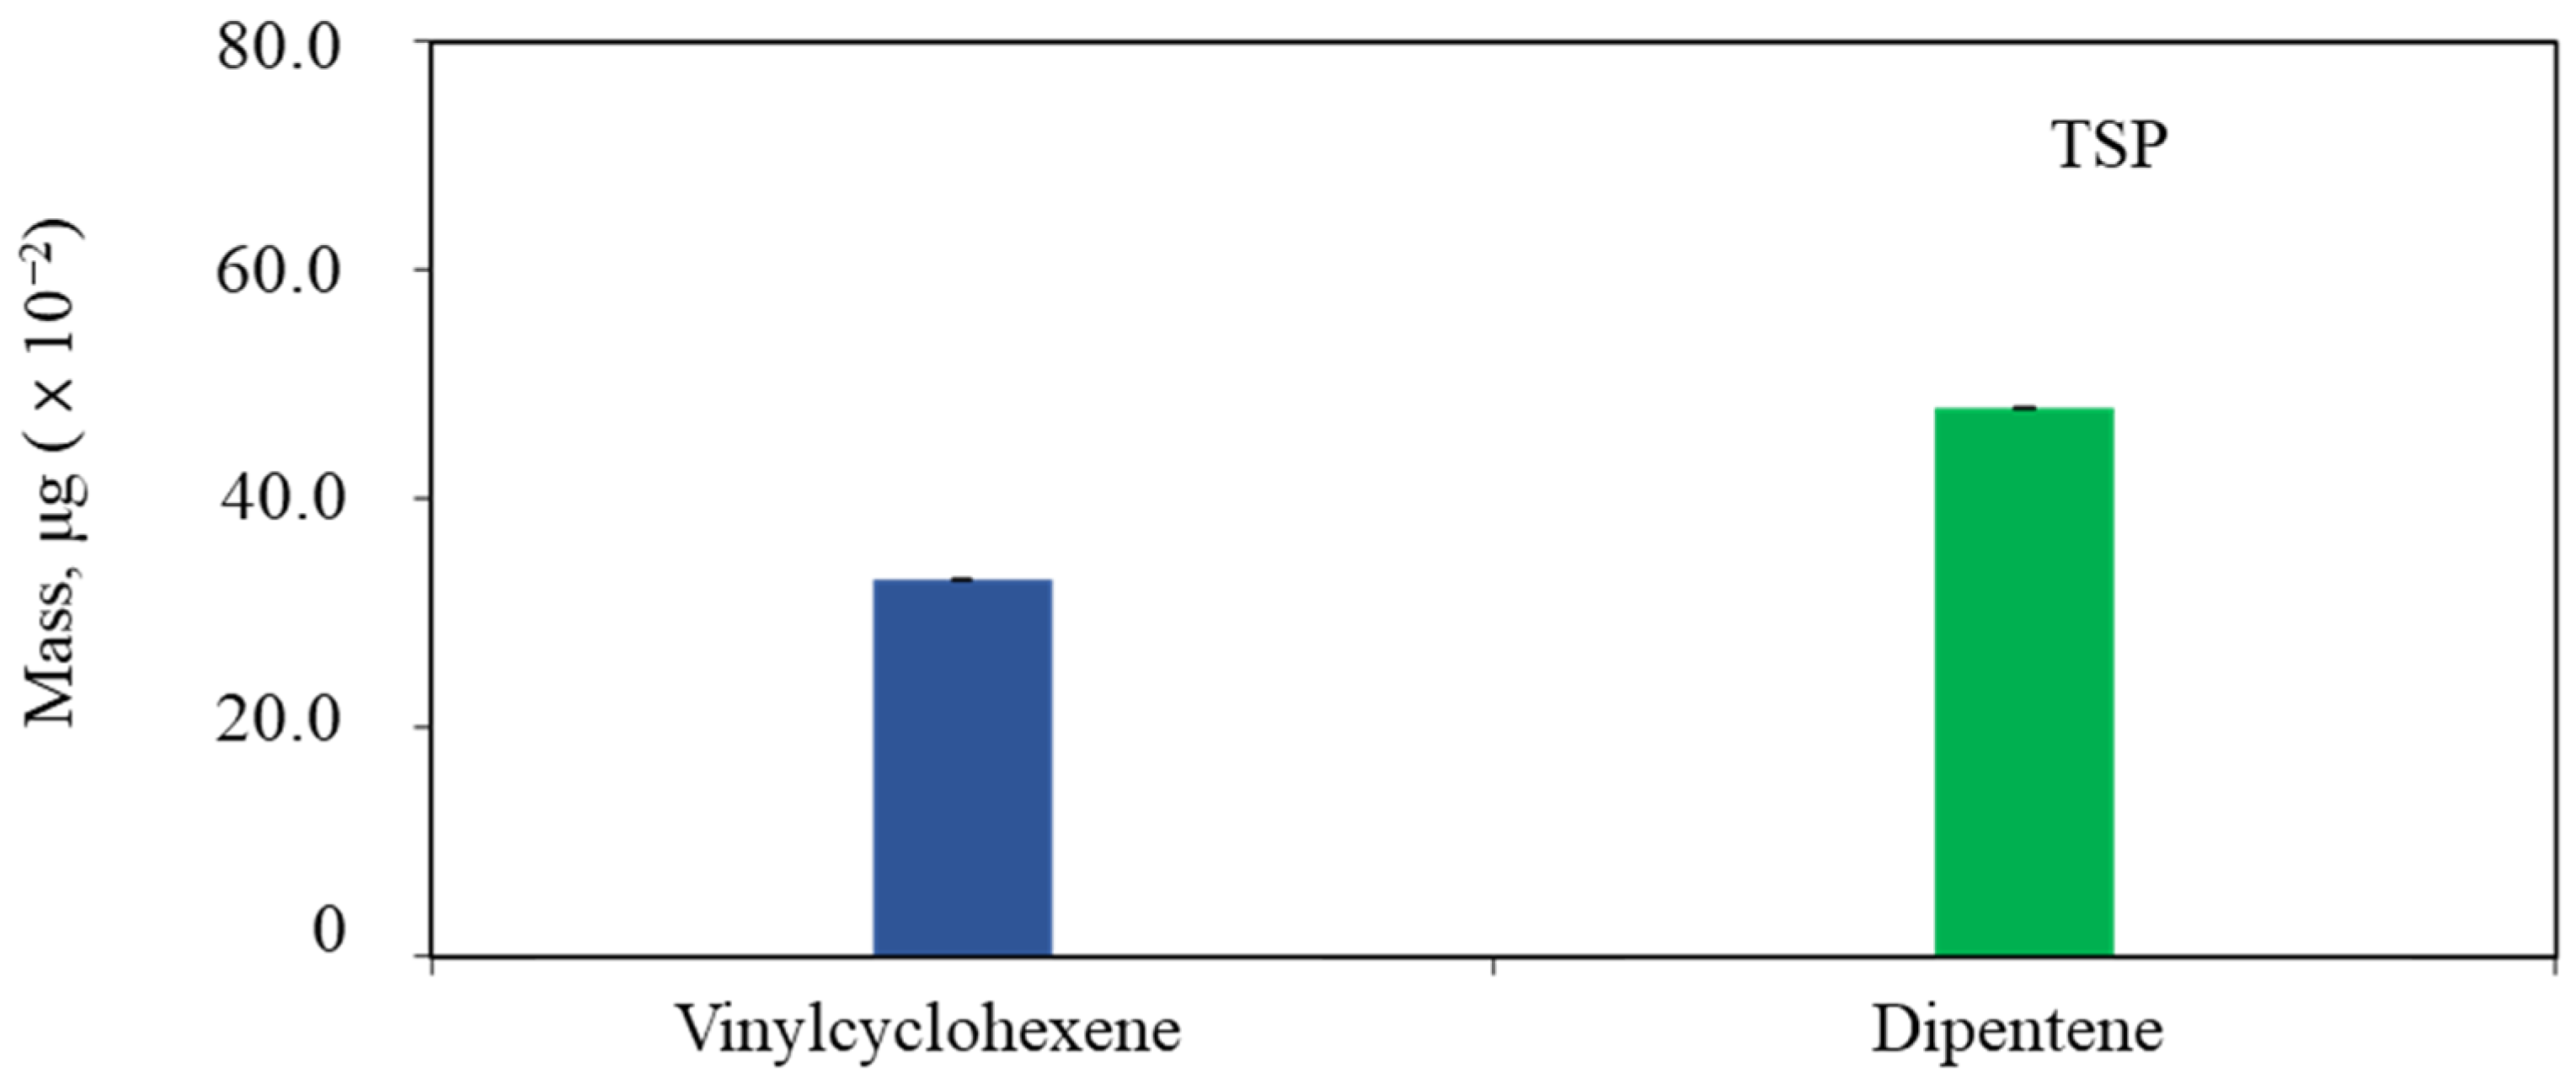
The distribution of vinylcyclohexene and dipentene measured in the TSP sample is depicted in
Figure 5. This figure exhibits the higher value in mass for dipentene, 0.48 μg, compared to that for vinylcyclohexene, 0.33 μg. This is different from the tendency in the experiment results for the tire samples (shown in
Figure 4). In general, SBR has complex structures with bridges, crosslinks, and network structures. In contrast, NR has a general linear structure. Thus, NR appears to wear from tires in the form of lighter particles than SBR [
34]. Therefore, it can be concluded that more dipentene, a marker of NR, was detected in the high-volume sample than vinylcyclohexene, a marker of SBR. As described earlier, the mass trend of vinylcyclohexene and dipentene in the air is similar to the previous study [
6], indicating that the mass of SBR and BR is lower than that of NR.
The average concentration, standard deviation, and variation for TP and TRWP in the air with Equation (9) are listed in
Table 2. In the place close to the roadside, the average concentrations of
TP and
TRWP in
TSP were found to be 1.10 and 2.21 μg/m
3, respectively. For
TRWP, the high standard deviation and variation were revealed, 0.48 and 0.23, while it was relatively low for TP, 0.24 and 0.06, respectively. The rubber ratio of tire tread is the ratio of the sum of vinylcyclohexene and dipentene to the sample mass of the tire (i.e., 2 mg). The value, F
r, was calculated to be 0.52 for the tire samples, and the standard deviation and the variation were 0.12 and 0.02, respectively. The proportion of tire to the tire and road wear particles was assumed to be 0.5, which is suggested by ISO/TS 20593 [
35].
To measure, characterize, and monitor polycyclic aromatic hydrocarbons (PAHs), one of the air pollutants that can severely affect health and the environment evolved from the tire particles in the atmosphere, a further in-depth chemical investigation was performed with the PAHs obtained from the tire samples and TSP. The temperature program consisted of seven different steps. After the temperature was maintained at 50 °C for 1 min, it ramped to 180 °C at a rate of 8 °C/min, 240 °C at a rate of 5 °C/min, 300 °C at a rate of 10 °C/min, and maintained for 7 min. Finally, the temperature was increased to 320 °C at a rate of 10 °C/min and maintained for 2 min. In the GC/MC chromatograms for tire particles and TSP, high-level peaks appeared sporadically over the entire measurement period. As mentioned earlier, the retention time, RT, for each of the 16 substances composing PAHs was pre-tested with the standard sample of PAHs. These RT values were applied to the tire sample and TSP, and five substances, benzo(g,h,i)perylene, pyrene, fluoranthene, phenanthrene, and naphthalene, were detected, as listed in
Table 3.
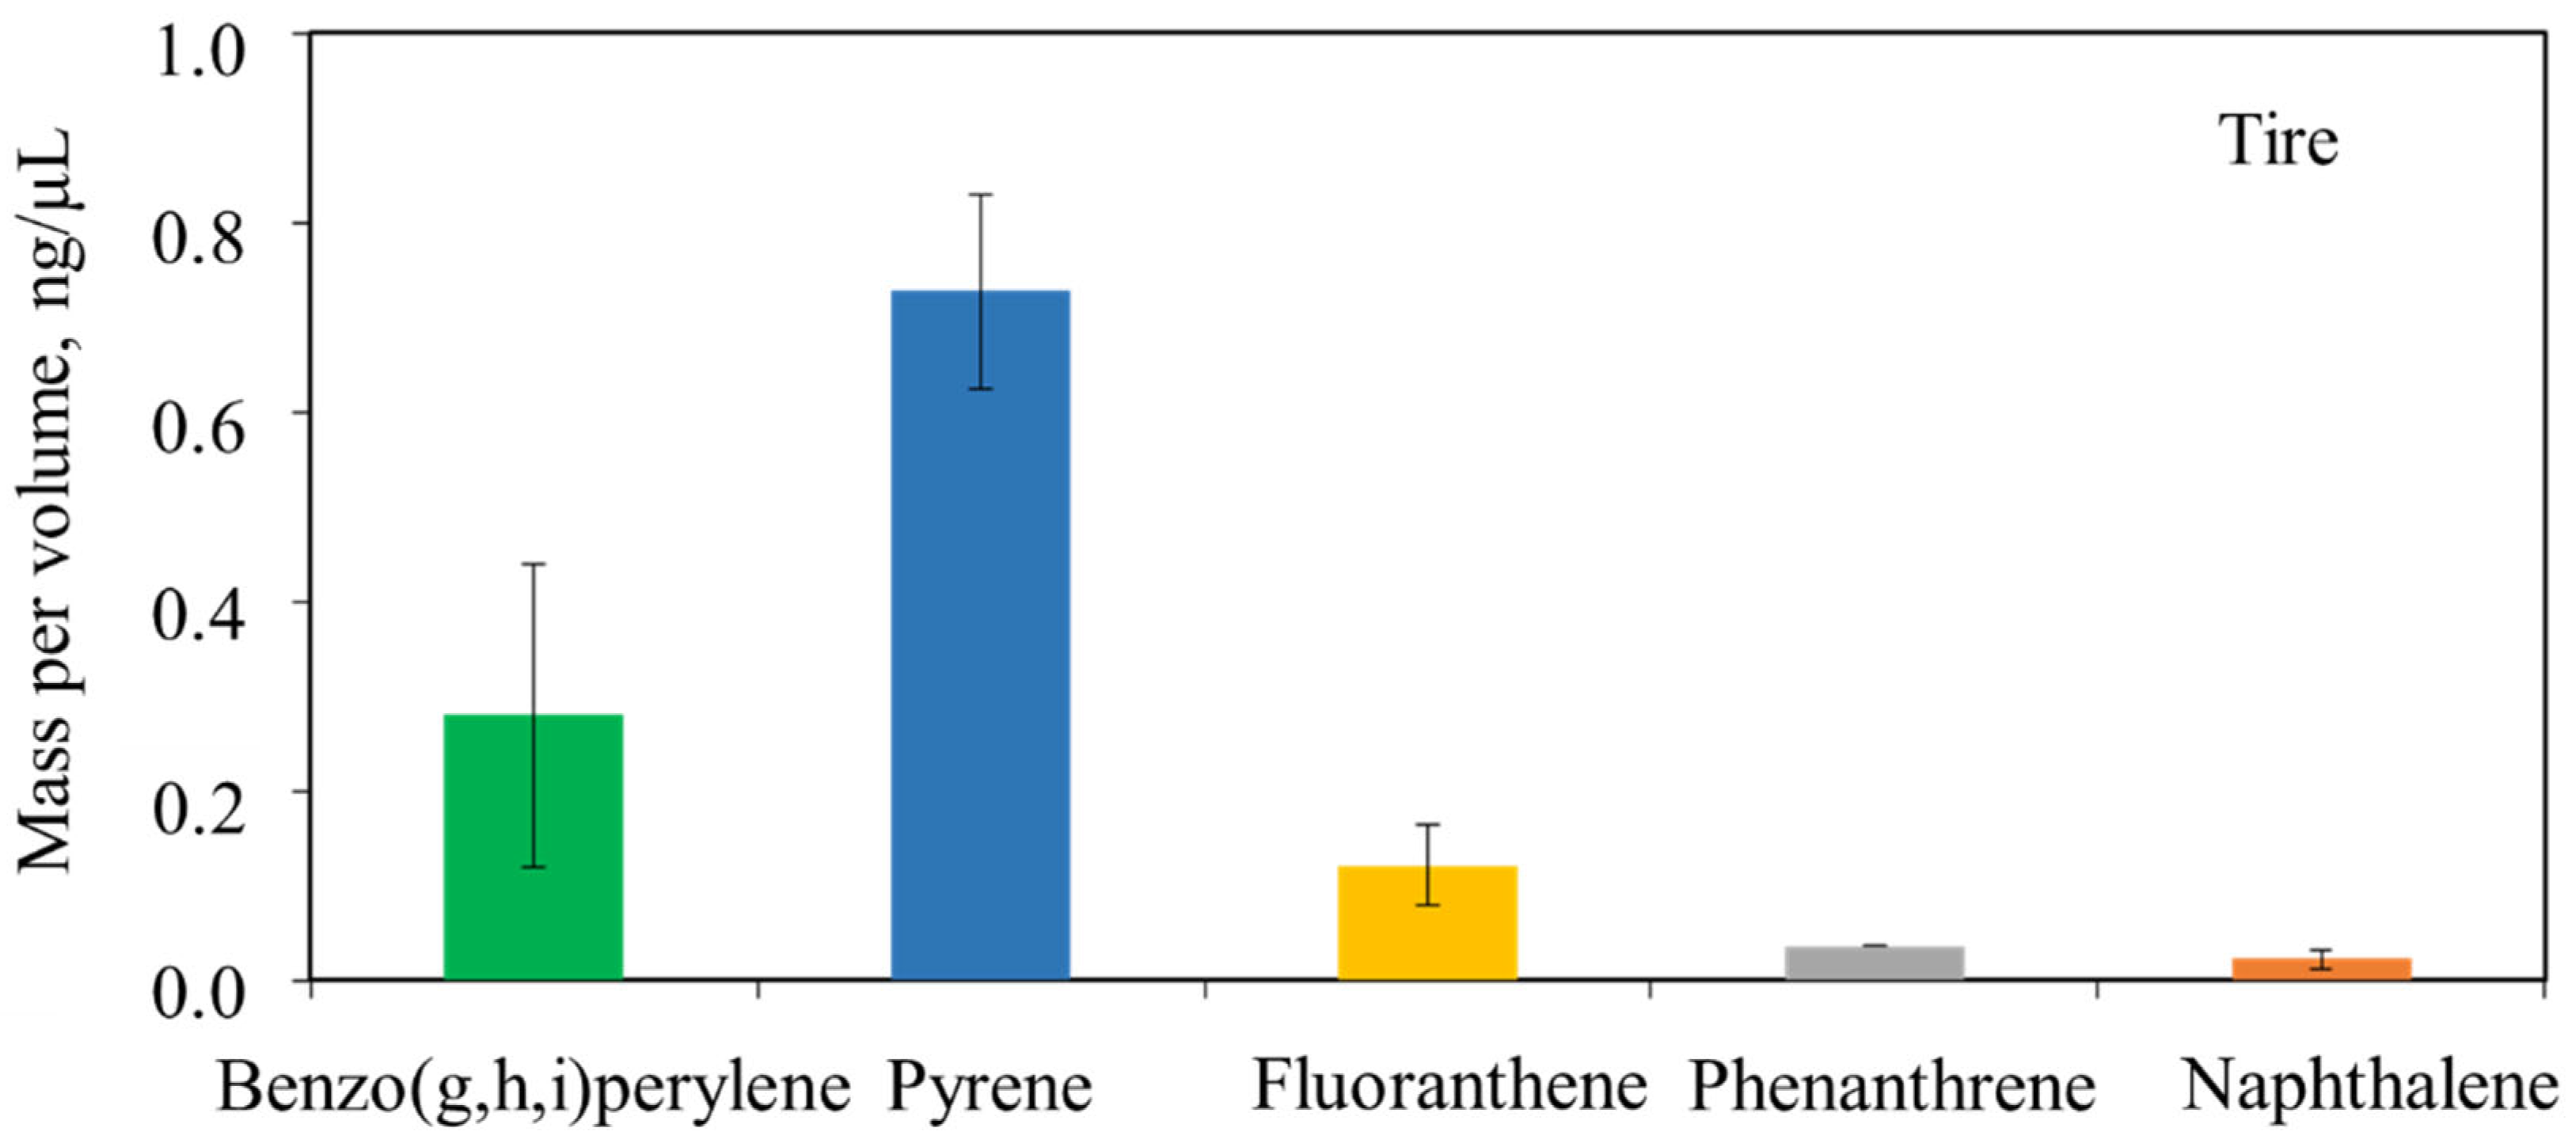
The distribution of benzo(g,h,i)perylene, pyrene, fluoranthene, phenanthrene, and naphthalene of PAHs measured from the tire samples were represented in
Figure 6. The highest concentration of pyrene was exhibited, followed by benzo(g,h,i)perylene, fluoranthene, phenanthrene, and naphthalene in that order. This result can be attributed to the aromatic oil being chemically added to the tire manufacturing process [
10,
11,
17,
18,
36].
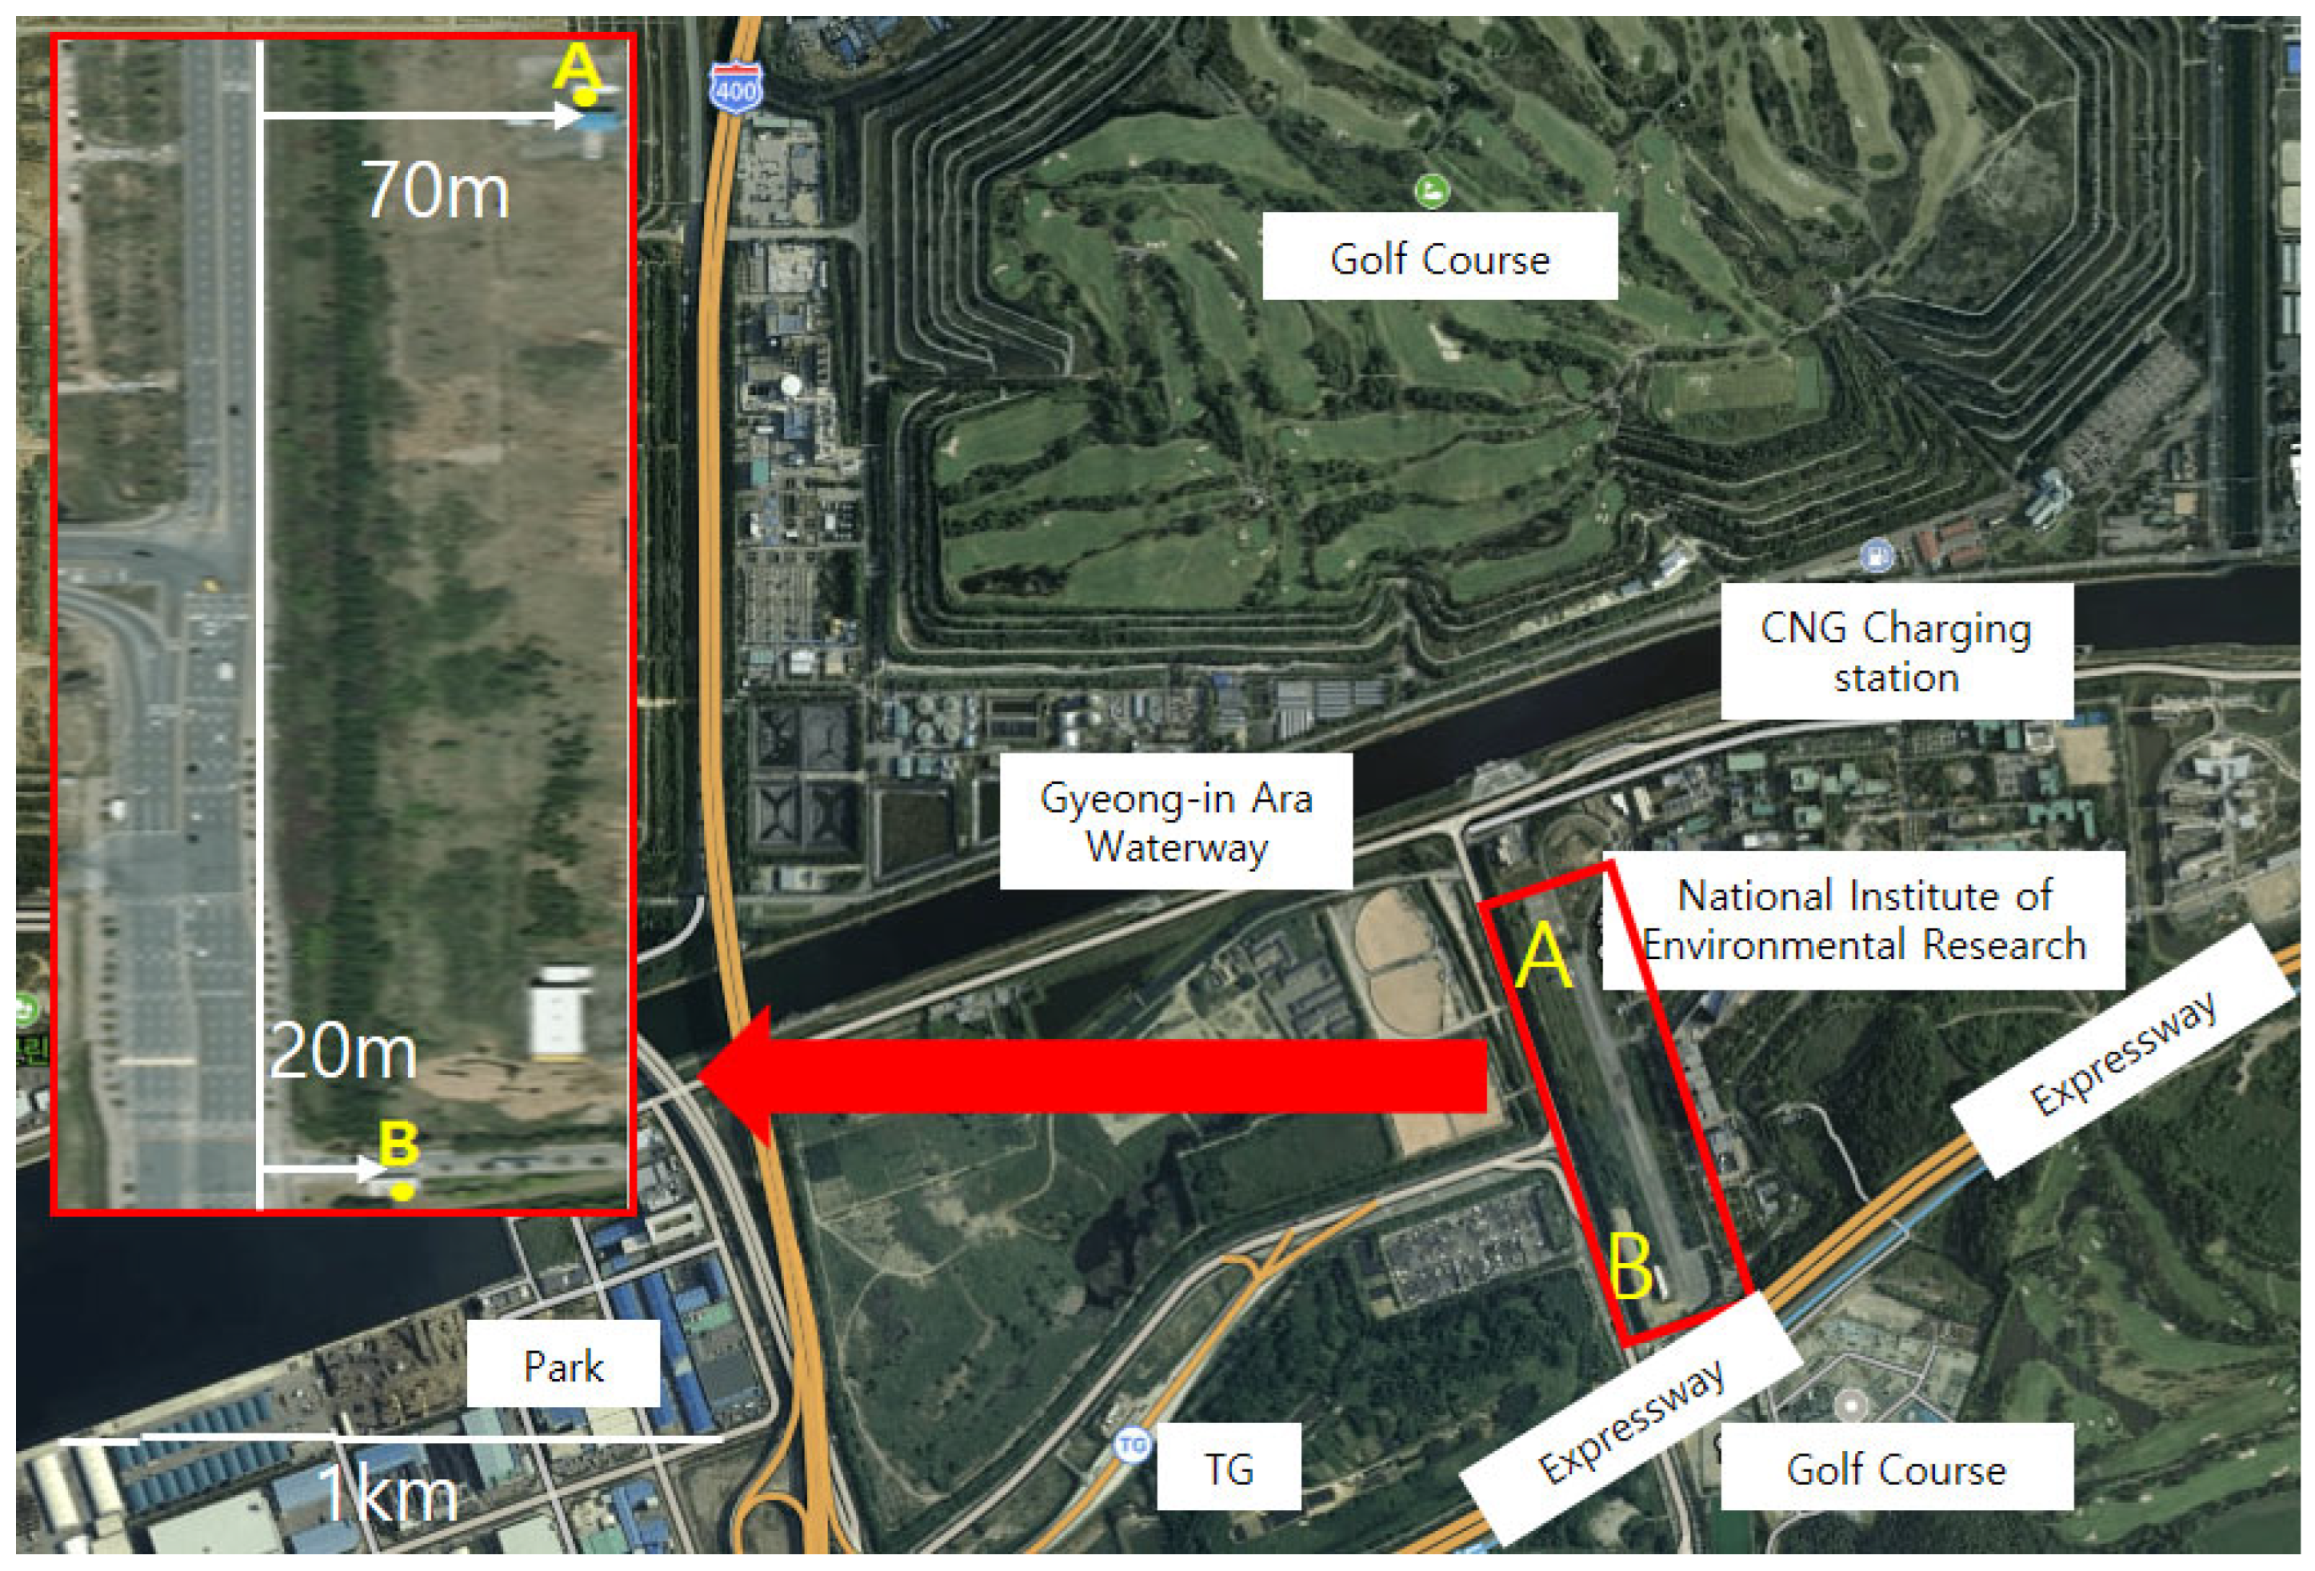
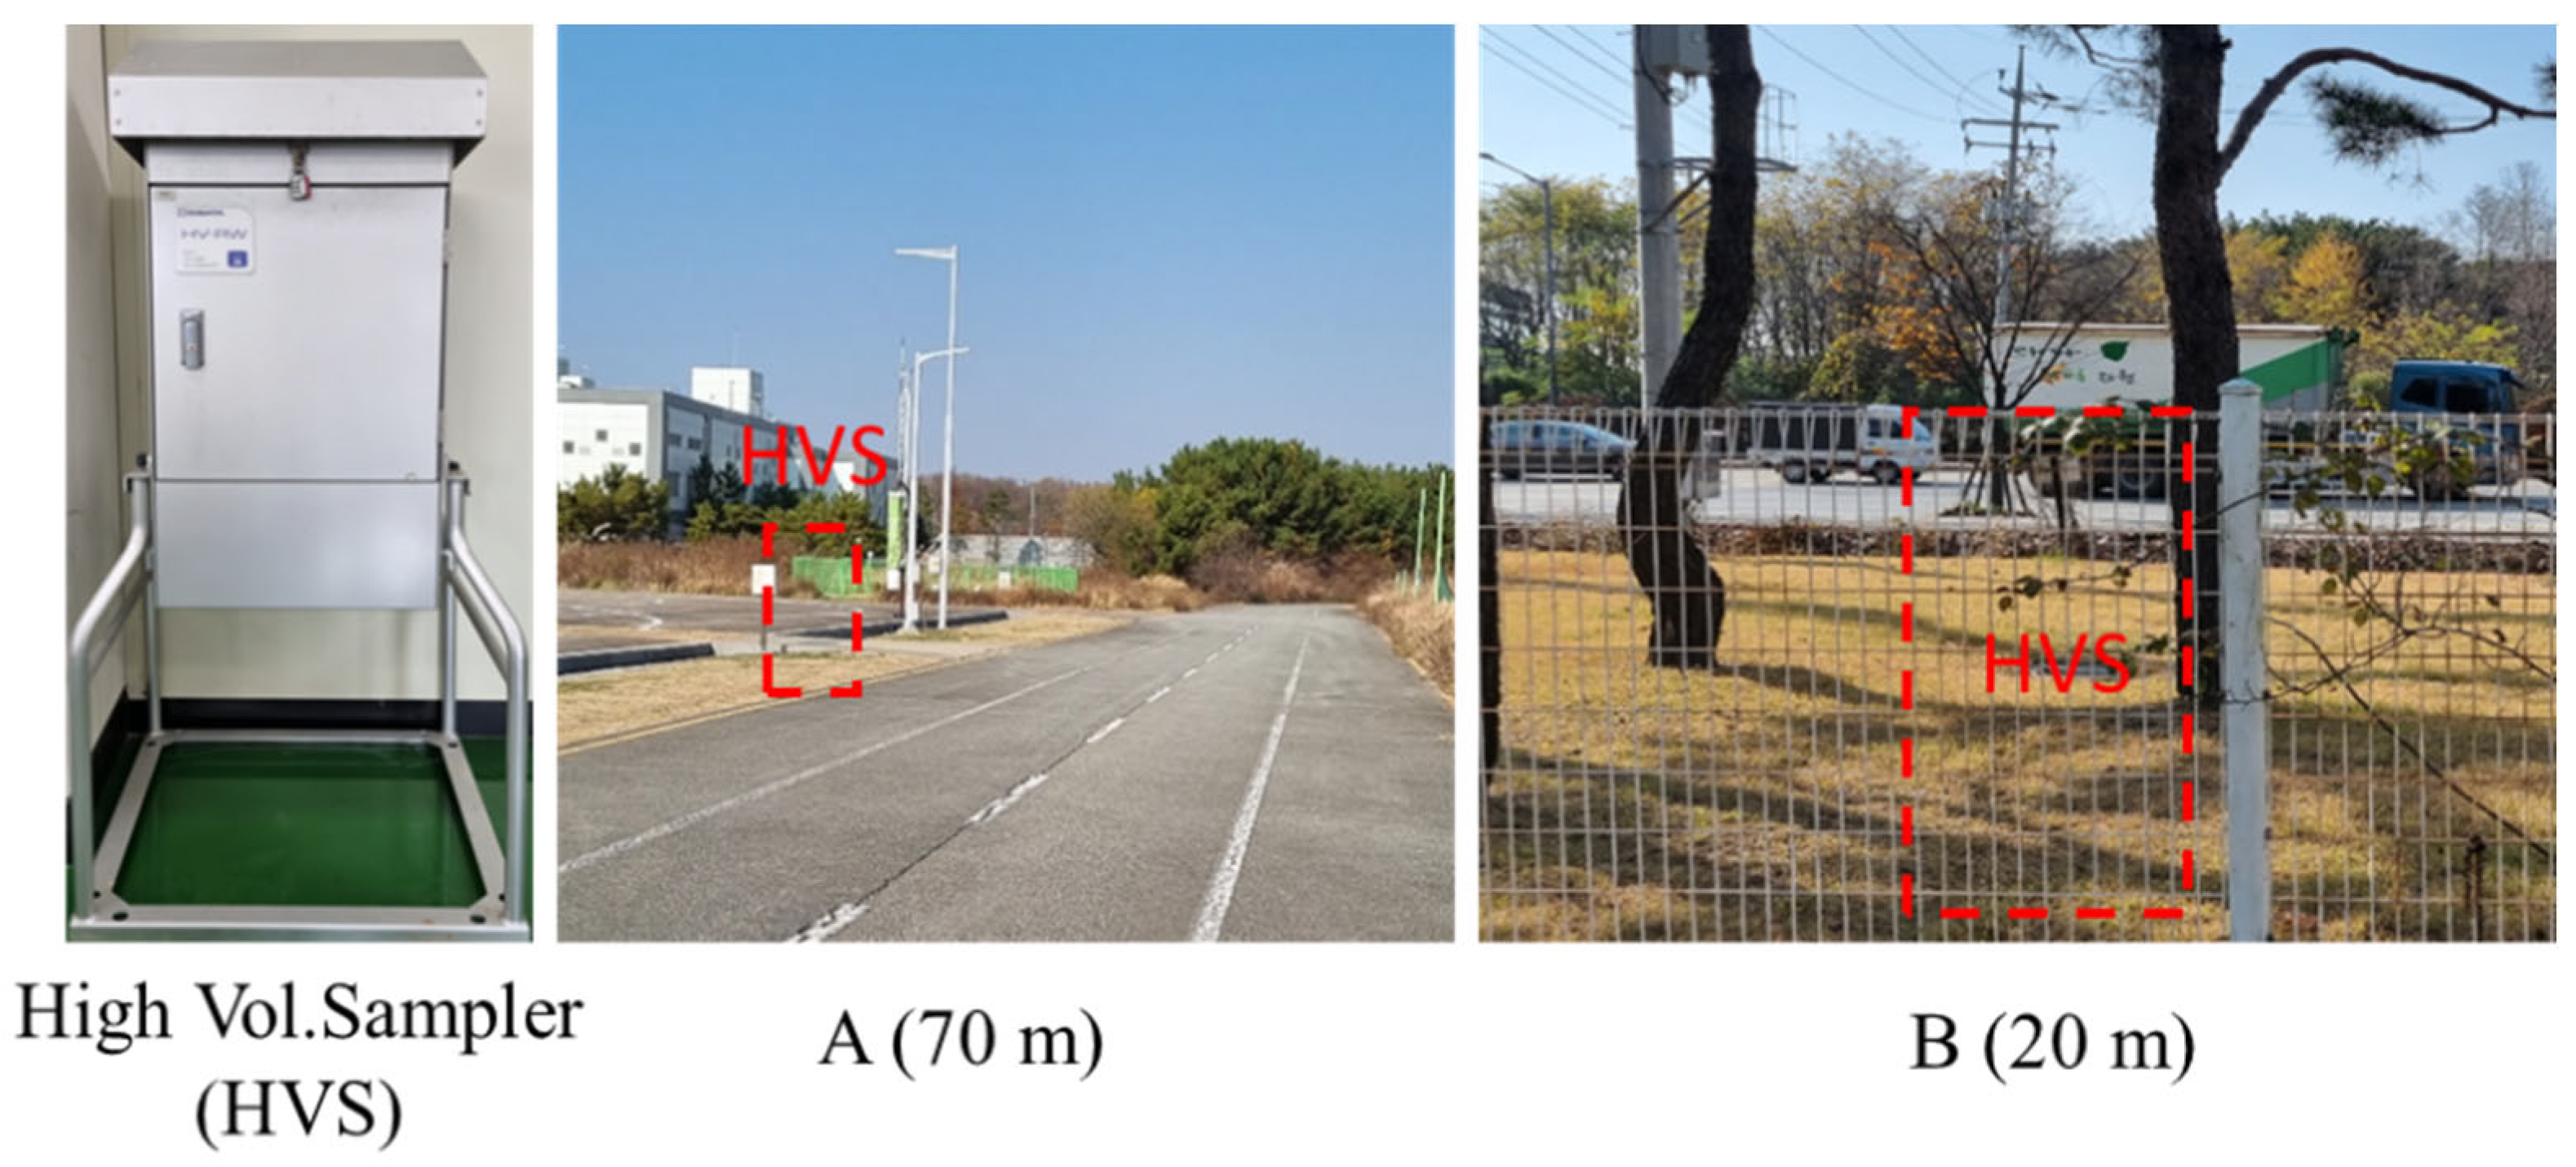
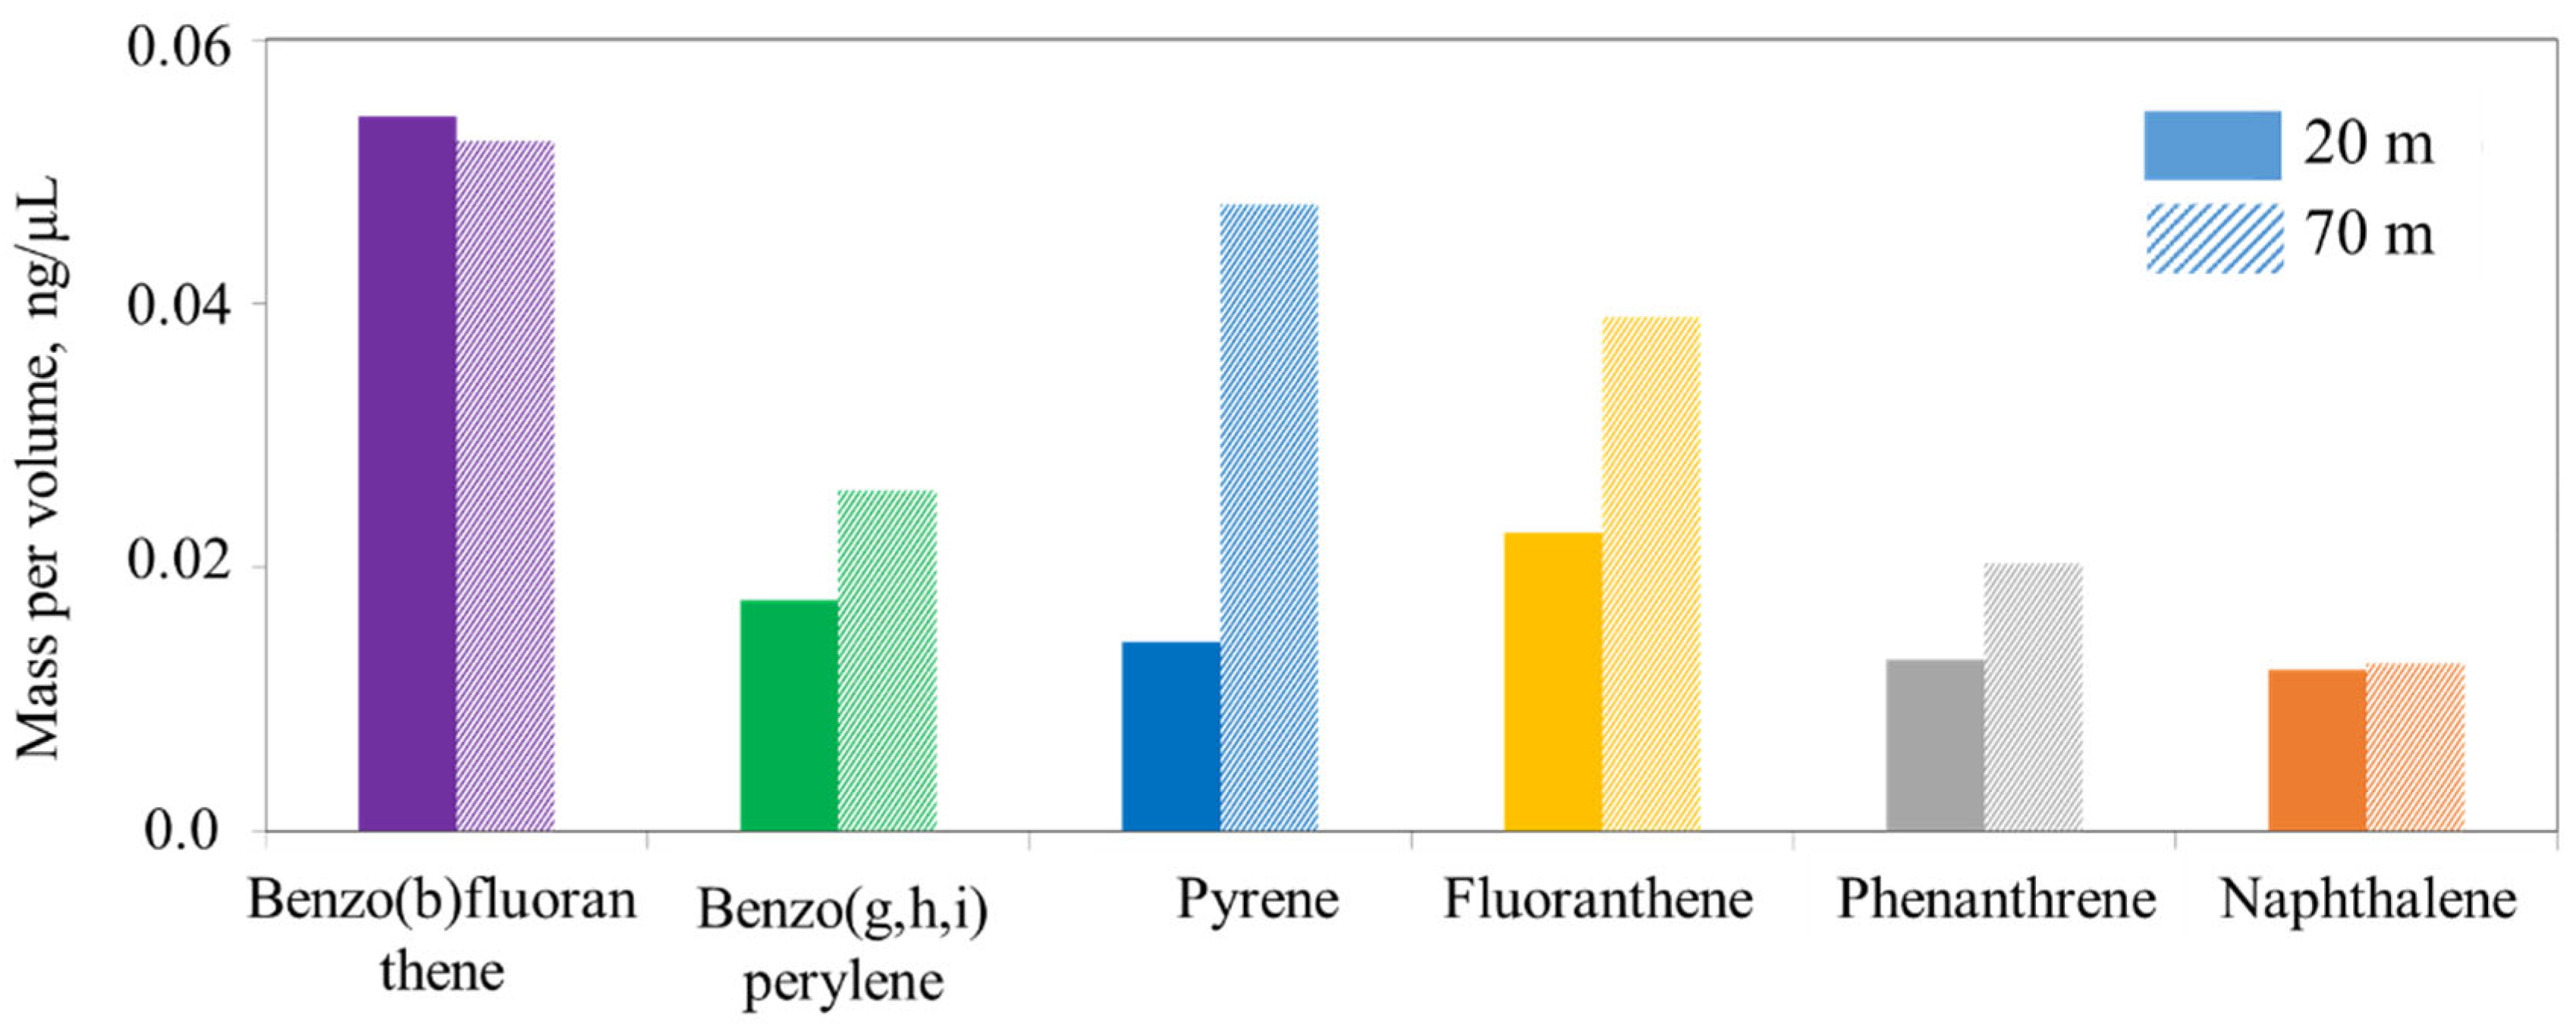
The distribution of chemical components in airborne PM samples, which was collected at a point 20 m and 70 m away from the roadside, respectively, are depicted in
Figure 7. For the 20 m (solid-pattern bar), benzo(b)fluoranthene showed the highest concentration, followed by fluoranthene, benzo(g,h,i)perylene, pyrene, phenanthrene, and naphthalene in that order. It is known that PAHs in the atmosphere are usually caused by incomplete combustion of fossil fuels [
11,
25,
26,
34,
37,
38], but it was reported that PAHs are also emitted from
TRWP [
10,
11,
16].
For the 70 m (comb-pattern bar), the mass per volume for benzo(b)fluoranthene noticeably shows higher (0.053 ng/μL) than that for the other chemical components consisting of PAHs in TSP, 0.028 ng/μL for benzo(g,h,i)perylene, 0.048 ng/μL for pyrene, 0.039 ng/μL for fluoranthene, 0.019 ng/μL for phenanthrene, and 0.01 ng/μL for naphthalene, which can be attributed to the incomplete combustion of fossil fuels and tire wear particles. Furthermore, the mass per volume for benzo(g,h,i)peryline, pyrene, fluoranthene, and phenanthrene in the 70 m TSP samples were relatively higher than those of 20 m, as depicted in
Figure 7. This can be, as stated earlier, due to the heavy-duty vehicles used in the industrial complex for cargo transport and various construction machinery in the construction sites, which were placed near the TSP sampling equipment. In general, the environmental condition in which the heavy-duty vehicles drive and construction machinery operate would lead to higher PAHs emissions, which can cause to higher chemical components consisting of PAHs.
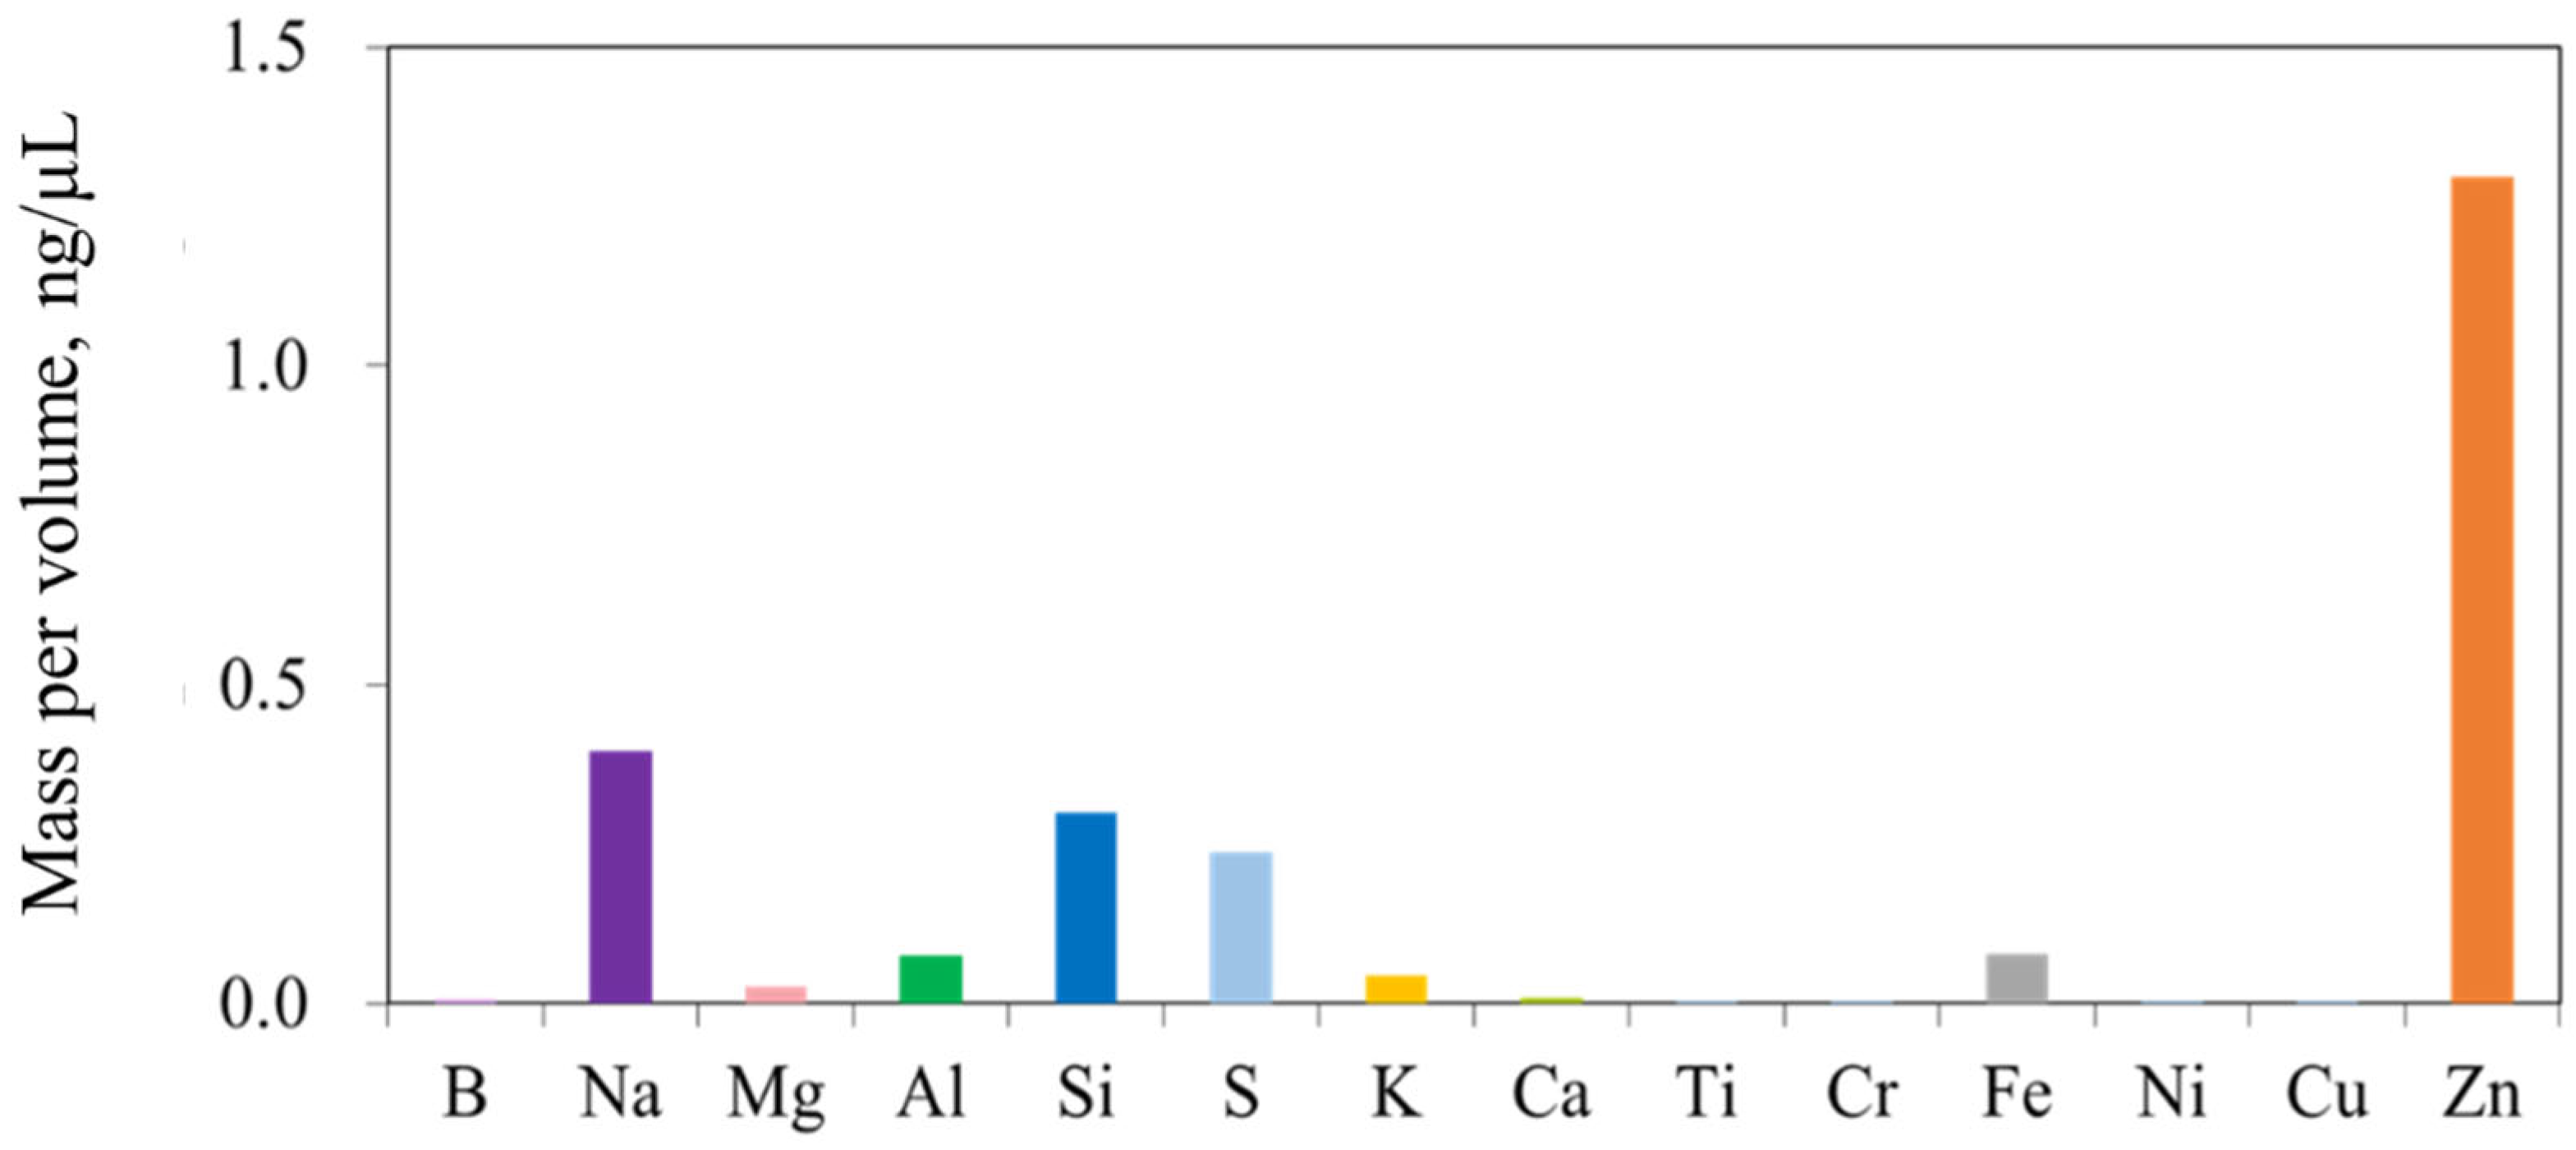
The distribution of metal components in the tire samples was represented in
Figure 8. The metal components in the environment are mainly induced by the additives for fuel and lubricant oil and non-exhaust emissions (i.e., metals used in the tire and brake). Because the metals also are very significant components affecting human health and the environment [
4,
12,
13,
28,
29,
30,
31], the investigation was comprehensively carried out in this study. As shown in this figure, Zn exhibited the highest concentration among the heavy metals, followed by Na, Si, Al, Mg, Fe, S, and K, in that order. The accelerators used in the vulcanization process include Pb, Mg, Zn, sulfur and calcium oxides. The retardants include terpene-resin acid blends. Zn is added by 1% in tire manufacturing [
39]. It has also been reported that Zn in tires exists as inorganic matter (ZnS and ZnO) and organic compounds (Zn stearate), and accounts for 0.4–4.3% of tire treads [
13,
28,
39]. Therefore, the concentration of Zn appears to be high [
12,
14,
17,
18].
The list of metals chemically analyzed for the tire samples and the TSP samples are shown in
Table 4,
Table 5 and
Table 6, respectively. Zn also recorded the highest concentration of all the tire samples. The other metals showed different tendencies depending on the tire sample. For the total TSP samples and the TSP sample at 20 m, Ca is the highest metal component among the metals, followed by Si, Al, Fe, and Na, in that order. In comparison with metal components between both samples, tire samples and TSP samples, S, Cr, and Ni are detected in the tire samples, while these metal components are not shown in the TSP samples. Furthermore, P, Mn, Ba, and Pb are measured in the TSP samples, in contrast to the tire samples that do not include these components.
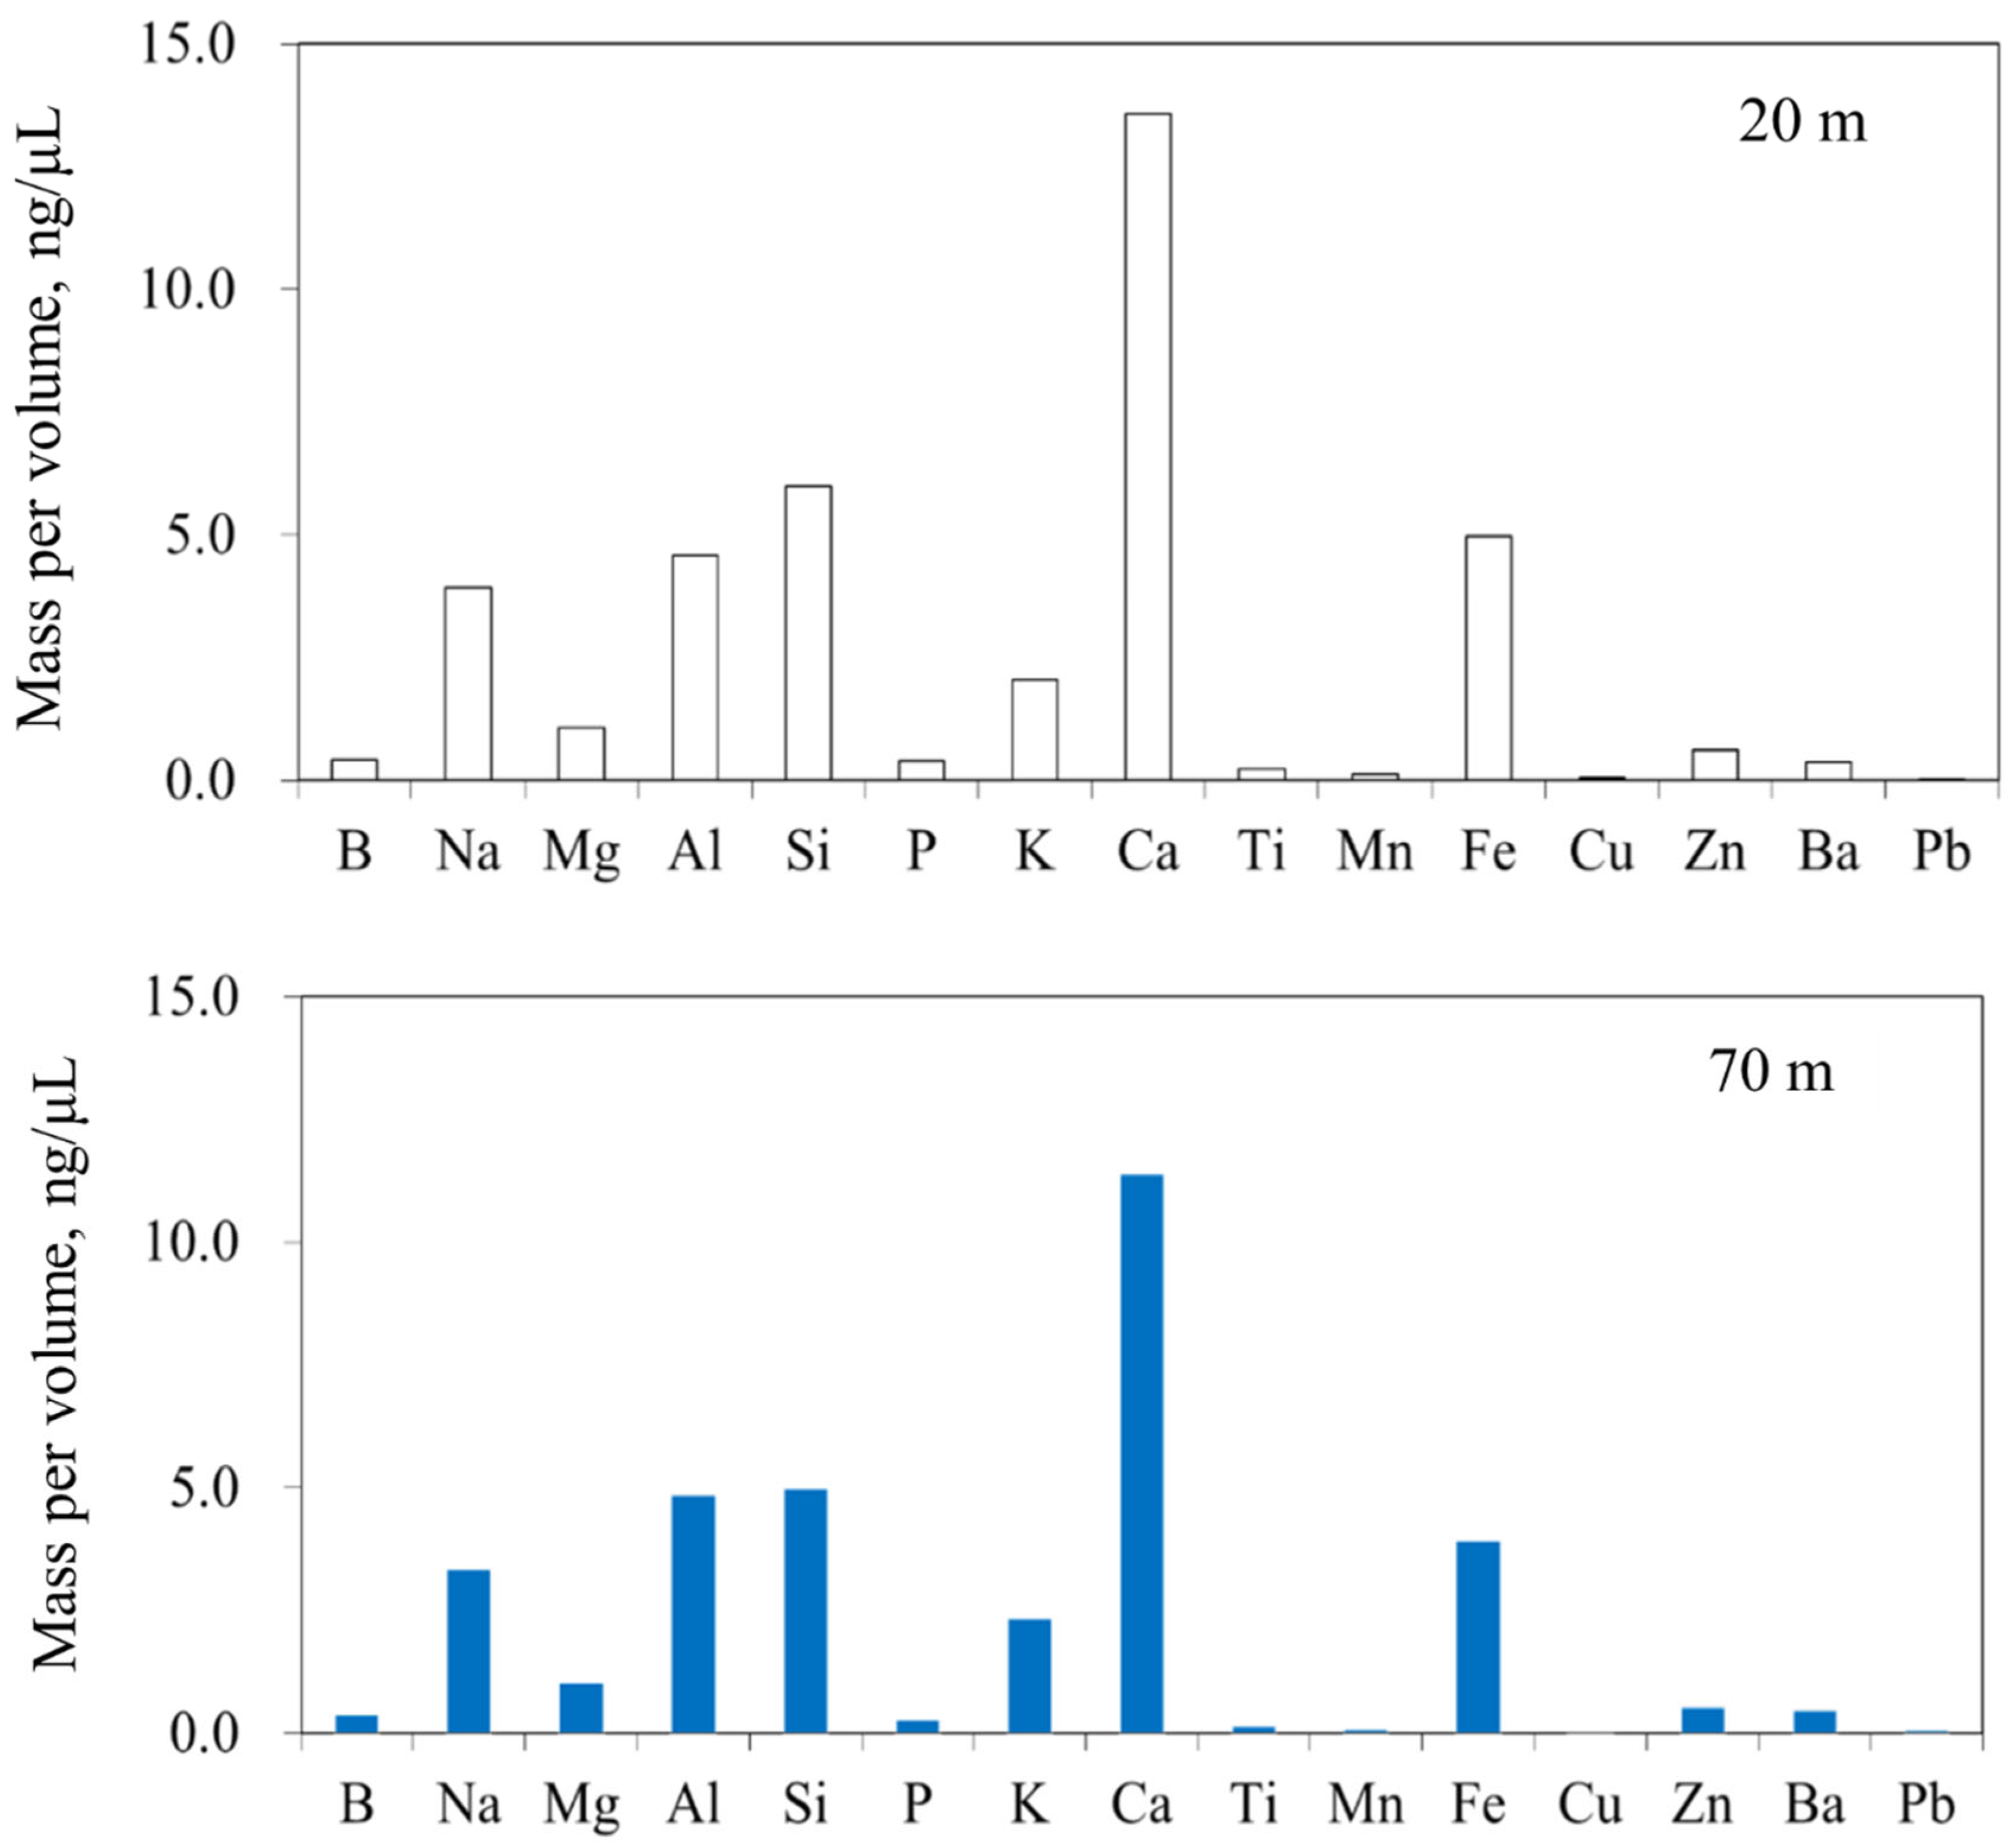
Figure 9 represents the distribution of metal components in TSP samples at 20 m and 70 m. Ca exhibited the highest concentration among the heavy metals in TSP, followed by Si, Fe, Al, Na, K, Mg, and Zn. This was similar to the result of a previous study in which Ca, Ma, Na, K, Fe, and Al showed high values in the heavy metal analysis results at a roadside measurement point [
12]. In particular, Ca, Ma, and K are metal components that occur at high proportions in soil matrices and are reported to be the influence of resuspended dust in soil [
12]. In previous studies on the distribution of metals for road dust and vehicle exhaust gas, Al, Fe, and Ca were observed in both road dust and vehicle exhaust gas, but Si, Cu, and Zn were mainly measured in road dust and S, Na, and Mg in the exhaust gas from vehicles [
28,
40,
41]. From the previous studies, it is revealed that heavy metals in the atmosphere are affected by road dust, tire wear particles, and vehicle exhaust gas.
6. Conclusions
In this study, the markers from the rubber used in tires were measured with the pyrolysis–GC/MS analysis, the GC/MS analysis, and the ICP/MS analysis for the tire samples and the particulate matter (PM) samples from the atmosphere. PAHs and heavy metals were analyzed from those samples. The influence of tire wear particles on PM in the atmosphere was investigated by analyzing the measured concentrations of the markers. The results provide accurate experimental data for the distribution of tire markers, PAHs, and metal contents. The data are, however, limited in their applicability for the whole country due to the restrictions imposed by small sample size and region.
The marker-based analysis used in this study reveals that the mass fractions of tire particles and tire road wear particles in the air are 1.6% and 3.13% for the sample point of 10 m, and 0.4% and 0.8% for 70 m. The concentration of benzo(b)fluoranthene is the highest in PAH, and Zn among the metal components exhibits the highest concentration in all tire samples and calcium in the air.
As for the distribution of vinylcyclohexene and dipentene, which are the markers of SBR and NR measured in tire samples, more vinylcyclohexene was detected than dipentene. This indicates that more SBR is added to tires than NR during the manufacturing process. In TSP samples, more dipentene was detected than vinylcyclohexene. NR appears to wear from tires in the form of lighter particles.
Pyrene showed the highest concentration in the PAH analysis, due to the aromatic oil, which was used during the tire manufacturing process. In TSP, the high concentration was benzo(b)fluoranthene, and the low concentration of pyrene in the atmosphere originates from tires. These results are very similar to the previous study that reported pyrene detection in tires and in the atmosphere. The other substances appear to have been affected by the exhaust gases emitted from the combustion process.
Metal components such as Zn, Na, Si, Al, Mg, Fe, S, and K showed different tendencies depending on the tire sample. Zn appears to have exhibited the highest concentration because it is added by 1% during the vulcanization process in tire manufacturing and it reportedly accounts for 0.4 to 4.3% in the tire tread. In TSP samples, Ca showed the highest concentration, followed by Si, Fe, Al, Na, K, Mg, and Zn, which can be affected by various sources.


