Abstract
One of the research areas related to renewable energy sources is the search for new applications for currently used technologies. An important postulate is to achieve the synergy effect by including the existing infrastructure in this process. The innovation described in this article is the integration of solar cells into a modular sound barrier on the highway. The contribution of this article is mainly based on the introduction of the potential feasibility of the first Turkish solar highway, describing the installation of PV systems based on a multi-criteria evaluation (azimuth angle, loss of shade, and dirt). The aim of the study is to determine the economic dimension by examining the costs of implementing such an investment and answering the question concerning the efficiency of solar cells on sound barriers. The research took into account various scenarios regarding the shadow effect and inclination of solar panels and their impact on solar energy production in the example of a given case study, an identified urban area. The research is limited to the model for assessing the feasibility of solar cells on sound barriers based on NPV and the essence of the relationship regarding the LCOE averaged electricity costs. In this study, the function and technical parameters of solar cells are not specified, but the article is limited to the basic information and characteristics required to investigate the payback period and profitability of an investment. Research has shown that if the investment is carried out in accordance with the proposed model, the expected amount of energy produced is 62,257 kWh per year. This value corresponds to the average consumption of electricity in a household by 24 apartments for a given destination, or to providing energy for a selected electric vehicle for one year of its operation, at the same time leading to a significant reduction of CO2. The presented research can find practical application in the area of developing a strategy for the development and popularization of renewable energy sources while increasing the use of the existing road infrastructure, presenting an important postulate in promoting this type of solution for other geographic destinations.
1. Introduction
Observations of socio-economic processes indicate that with the increase in the world’s population and technological progress, the exploration of natural resources and the emission of carbon dioxide (CO2) occur simultaneously. The modern economy of many countries is mostly based on fossil fuels, which has a negative impact on the climate [1]. All researchers agree that the burning of fossil fuels is the largest source of CO2 emissions and the greenhouse effect worldwide. According to Global Goals (2021), energy demand is expected to increase by 50% by 2050 [2].
At the end of 2015, most world leaders agreed on a new climate agreement, the Paris Agreement [3]. The goal of the Paris Agreement was to keep the global temperature rise below 2 °C to create a sustainable future, the agreement has no time limit [4]. For example, Turkey’s goal is for the country to have 100% renewable electricity production by 2050 and zero net emissions of greenhouse gases by 2045 [5]. However, it is difficult to predict how the Turkish energy system will be structured in the future. How it will look is influenced by the decisions made and the work currently being done today. Currently, the Turkish energy system supplies reliable, sufficient, and above all, cheap electricity for the whole country. This is possible due to the greater use of renewable energy sources [6]. However, there are concerns about the deepening of the ongoing energy crisis due to limited fossil fuels and rising tensions between Russia and Ukraine [7,8]. An unanswered research question concerns what renewable energy sources can reduce dependence on foreign energy sources. Replacing it with newly found natural gas in the Black Sea is not an option, at least not in the short term [9]. On the contrary, fossil energy sources should be phased out because Turkey and most of the world strive to make all future energy renewable. However, replacing fossil energy sources with only intermittent energy sources, such as solar or wind power, is not so simple. Intermittent energy sources are weather dependent and their generation is only partially predictable [10]. Too much-interrupted production of electricity in a given area may indicate a problem with the stability of the power grid [11]. The solution to such a problem might be to spread the intermittent electricity generation over a larger area. Loss of generation due to cloudy or windless weather will have less impact on the stability of the grid. On this basis, it should be assumed that the future energy systems, including the Turkish one, will probably be a mixture of several different renewable sources, with each energy source being used in the most efficient way. For example, solar energy is a renewable energy source with features such as being easy to install and use, as well as not polluting the environment, and not creating harmful waste [12]. Some countries in Africa have a significant solar energy potential due to their geographical location [13,14]. As emphasized by one of the researchers, the Sahara Desert, and North Africa in general, is one of the world’s largest untapped energy sources [15]. The solar energy that strikes the surface of this desert has the potential to power the entire world. Indeed, a single solar panel placed, in Algeria, is capable of generating three times more electricity than the same panel placed in Germany [16]. A panel in a solar farm located in Alegria, 1 m2 in size, would on average generate 5–7 kWh of energy each day. Increase that to 1 km2 and we are generating 5–7 GWh of energy each day. Increase that to 1000 km2 and we are generating 5–7 TWh of energy each day. Enough to satisfy nearly 100% of Europe’s energy needs [17]. If we multiply that by 10, we are generating 50–70 TWh a day, enough to power the entire world [18]. These impressive data are often repeated by many researchers [19].
Observations of the market reality indicate that the installation of solar cells is increasing in Turkey. While the installed power based on solar energy was 833 MW in 2016, it reached 8479 MW as of the end of June 2022, and its ratio to the total installed power was 8.35%. Since system prices have dropped so much in the last 2–3 years, interest has also increased. The authors support the thesis put forward by other researchers [20,21,22] that investments in solar cells not only make a positive contribution to environmental protection and energy independence, but also create the basis for wider use of, e.g., the available road infrastructure. Observations of the surrounding reality indicate that noise barriers located on expressways are an important element of the road infrastructure of many countries, including Turkey. According to the definition of the US Federal Highway Administration (FHWD), noise means unwanted sound [23]. While there can be many sources of noise, highway sound is the most common and the hardest to avoid. The most effective method of protection from noise is sound barriers. A noticeable trend is a growing interest in sound barriers in the face of the challenges of modern road transport and city life.
Figure 1 shows the noise barrier effectiveness, which reduces noise levels by 10–15 dB [24], cutting the loudness of traffic noise in half [20,25,26].
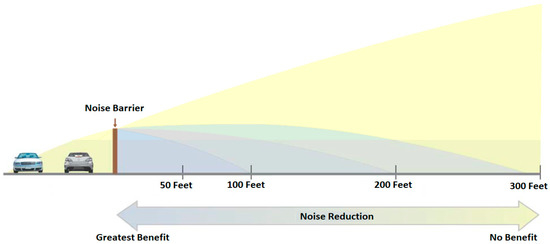
Figure 1.
Noise barrier effectiveness [24].
Photovoltaic sound barriers (PVSB) are a combination of sound barriers and conventional photovoltaic solar energy systems. Sound barriers are very suitable for the installation of photovoltaic systems as they have a comfortable installation area due to their structure and are not affected by environmental factors. The electricity generation mentioned here is the generation of electricity with the help of solar energy panels to be installed in the designated parts of the sound barriers. The idea is to create an efficient combination of sound barriers and solar energy in order to achieve a synergy effect. The barriers double as solar panels and produce green energy and it has many advantages. Such a solution reduces carbon footprint, makes something not very visually pleasing look better, and capturing energy. A sound barrier has very little spatial impact and is therefore suitable for energy generation. All renewable energy sources require a lot of space which is why it is important to bundle functionality. This is a good example practical of combining sound reduction and solar power generation. It is an important step towards the further dissemination of solar sound barriers [20,27].
The main disadvantages, and the reasons why this combination has not expanded, are mainly based on two different considerations regarding the possibility of theft and devastation. There is a great risk of theft because solar cells on sound barriers are easily accessible and can be easily removed. They are certainly not placed at the same height as the panels on the roofs. Another reason is mechanical damage. There is a risk that the solar cell modules are damaged by stones thrown by road traffic. Moreover, sound barriers are most often used as graffiti walls. If solar cells are mounted, graffiti can reduce the capacity of the solar cells, whereas damage from animals is a natural cause that is difficult to avoid. [28,29]. When the sound barriers used against traffic noise on highways gain the function of generating electricity with the sun, the existing sound barriers become both more aesthetic and functional. With the new functionality created by adding photovoltaic panels to noise barriers, a new field is emerging for research and analysis. It is thought that many kilometers of solar sound barriers will be seen in Turkey and possibly in Europe in the coming years.
The presented considerations are aimed at examining the possibility of using acoustic protection along highways to generate electricity from renewable sources. This is the first study to analyze the technical and economic impact of implementing PV noise barriers in Turkey. Several of the available studies used different factors, such as economic development, non-renewable energy, renewable energy, and CO2 emissions. However, this is the first study that refers to a specific destination where the analysis covered photovoltaic panels installed on roadside noise barriers, taking into account real data. This study clearly reveals the economic advantages and disadvantages of constructing a solar power-generating sound barrier in the Kaman district in Turkey. The result will also serve as a basis for investors and decision-makers to decide on the possible realization of a project in the region.
The study clearly shows the advantages and disadvantages of building an acoustic barrier equipped with photovoltaic panels that generate electricity. The obtained results can be used as a basis for making a decision about the possible installation of this category of solutions in other areas. Therefore, in the opinion of the authors, this article has many practical implications.
Briefly, the article presents a new look at the existing literature in the following areas: (1) Photovoltaic sound barrier; (2) new ways of using road infrastructure to obtain renewable energy; (3) synergy effect; and (4) energy independence. The article is organized as follows: In Section 1, the background of the study, the information that forms the basis for the problem formulation, and the purpose of the study are presented. Section 2 summarizes the theory which is a compilation of previous research and completed projects in the field as well as facts and literature relevant to this study. Section 3 consists of implementation, which is a detailed description of the study’s workflow, the structure of the area, and justifications for the choices made in the technical and financial calculations. Section 4 reporting of the study’s results. Finally, in Section 5, the conclusions adopted after the results and discussion are summarized.
2. Completed Projects, Previous Research, and Important Issues to Be Solved
2.1. Description of Projects and Research in This Area
Although the use of solar cells as a renewable energy source for electricity generation has been around for many years, in recent years, the widespread use of solar cells has increased due to the decrease in prices. According to Swedish company Bra Bullerplank, using sound barriers can effectively reduce sound, with the proviso that their construction is expensive and the achieved costs are measurable, but they do not provide a direct financial return [30]. The authors postulate that by installing solar cells on sound barriers, it is possible to produce energy while reducing carbon dioxide emissions and reducing sound levels. Previous studies in Europe and the USA on the combination between solar cells and sound barriers are summarized below.
An efficient way of sound prevention by application of photovoltaic modules was first demonstrated in Switzerland in 1989 with under a kilometer of sound barrier installed with top-mounted solar cells of 100 kWp. The described installation is still active and supplies approximately 170 MWh to the grid annually [21].
The world’s largest sound barrier with built-in two-sided solar cells was launched in 2019 in Uden, the Netherlands [31]. It generates energy for 40–60 households. The power generated by the Solar Highway goes directly to the residents. What makes this solar sound barrier stand out from previous projects combining solar energy and sound barriers is that the solar cells are truly an integral part of the sound barrier.
Another example is Seoul city completed a soundproof tunnel with solar panels along the Dongbu Expressway in 2019 [32]. Both reducing noise pollution and generating power, the tunnel is the first of its kind in the world According to available data, it generates nearly 830,000 kW/h of electricity per year. This sound barrier is different from ordinary concrete or steel walls. The four-meter wall is composed of panels with three different functions. The panel at the bottom is covered with sound-absorbing materials, the clear panel in the middle is soundproof, and the top panel is formed of 240 W solar panels that can produce energy from both sides. The electricity from these panels is used by a nearby recycling center. It is achieved electricity savings of 45,000 kW/h a year. The annual electricity bill of around $72,000 was reduced by about $4500, which is 6% of the total cost. One of the researchers from the Eindhoven University of Technology in the Netherlands is managing two pilot projects on the Dutch A2 motorway and is testing a new type of solar panels, of which he is the manufacturer [33,34]. A practical test using the new technology is being run along the Netherlands’ A2 highway, one of the nation’s busiest, near the city of Den Bosch. The two sound barriers currently in use measure 4.5 m high by 5 m wide. If the panels manage to pass the testing process, a single kilometer of barriers is expected to be able to generate enough energy to power 50 households.
Another project is a 6-m barrier along Route 128 in Lexington. This innovative pilot project is expected to generate around 800 MWh of energy, which is expected to be sufficient to power 120 homes per year [35].
Although PV sound barrier technology has significant potential for solar energy harvesting, as there is more than 68,714 km of roads in Turkey, it has not yet been implemented. This article presents a method to make a cost-benefit analysis of the PVSB system in Turkey, which has a high solar energy potential, by making use of both shadow and azimuth aspects. Based on the feasibility analysis of sound barrier locations and irradiation levels, PV power potential and energy output for photovoltaic modules were calculated for the Kaman district. The results are presented in the context of using this method to determine the economic feasibility of PVSB in any given country.
2.2. Shadow Effect on Electricity Generation
Shading is an effective factor in solar energy production and in order for it to have high electricity generation, solar cells should be mounted on a shadow-free surface [36]. Sound-absorbing barriers installed along the highway have a significant space between each of the elements, and there are basically no additional elements between the sound barriers that would generate a shadow effect. It is important to underline those smaller shadows, from lampposts or tree branches, that can lead to relatively large energy losses depending on the type of used solar cell, the shape of the shadow, and the direction in it falls. Other factors include the use of bypass diodes (see Figure 2) and their connection diagram [37].
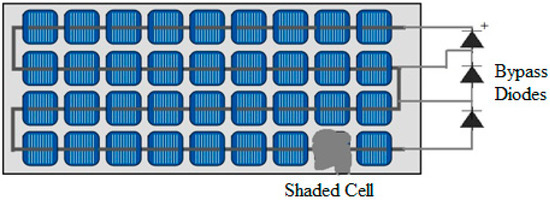
Figure 2.
PV module with three bypass diodes dividing the panel into three strings.
Connecting solar cells in series means that a shaded or damaged cell begins to act as a load, thus eliminating the effect of the entire series [38]. The power consumed in the cell can also turn into heat, and in some cases, damage the facility [39]. If the module containing the defective cell is also connected in series with other modules, this may also lead to a limitation of the current flow. One method to reduce this type of loss and avoid damage is to connect bypass diodes across one or a number of cells [37,40]. Thus, the current bypasses existing shaded or damaged modules or cells.
2.3. Increase in Energy Efficiency
An important element of development processes is increasing the energy efficiency of the panels themselves. It is possible to obtain higher energy per unit area with new-generation double-sided photovoltaic panels, which also use light reflected from the ground and back [41,42]. Although double-sided PV modules have been on the market for some time, their use is quite rare. This new solution was created to function in more difficult weather conditions. The back layer of modules is built like the front one—it is covered with glass, under which the active silicon layer is attached. Double-sided PV modules, unlike single-sided ones, do not have frames. They are constructed using tapered aluminum profiles. Moreover, they have a lower profile and different cabling. This type of solar panel is particularly suitable for applications in integrated photovoltaic panels on noise barriers and similar places where the use of standard PV modules is limited. Thanks to the advanced technology and construction, diffused sun rays also reach the back of the cell and increase its efficiency.
3. Research Method Financial Evaluation of the Investment
There are several financial instruments with varying areas of use for evaluating an investment. The feasibility evaluation model mainly includes the net present value (NPV), and levelized cost of electricity (LCOE). When assessing the profitability of investments, the NPV method is usually used. It is the value reached as a result of discounting the return of investment during the investment period with market interest and discounting it to the present. When calculating the time value of money, the rate of return that the business expects from the investment is taken into account. If the net result is negative, the investment project should not be implemented, if the result is non-negative, its implementation should be considered. The discount occurs using an NPV factor according to the below Equation (1). The NPV is calculated by Formula (1):
where
—the net cash inflow at year t ($),
d—discount rate (%),
t—economic lifespan.
The net cash inflow is calculated as follows:
—the cash inflow of by selling generated electricity ($),
—the expenses ($).
—Electricity price ($/kWh).
The generated power of the PV modules () depends on the air temperature, and solar irradiance which is given by [43]:
where
—the output power of the PV modules,
—the rated power of a PV module at the standard test conditions (standard test conditions: irradiance 1 kW/m2; air mass 1.5; cell temperature 25 °C measuring the uncertainty of power is within ±3%. According to certified IEC61215, IEC61730-1/2) [44],
—the derating factor (%),
—the global solar irradiation on the surface of the PV modules (kW/m2),
—the solar irradiation at the standard test conditions (1 kW/m2),
—the temperature coefficient the PV modules (%/°C),
—the temperature of the PV modules (°C),
—the temperature of the PV modules at the standard test conditions (25 °C).
The LCOE is often considered as the electricity production cost per kWh. It can be calculated as following Equation (5):
where
—the costs over the project lifetime ($),
—the total electricity generation of the facility (kWh).
In this study, a design method has been developed that integrates the solar energy technology sampled in the Kaman district into noise barrier solutions. In the study, a highway with heavy vehicle traffic is discussed. The proposed method for the case study can be divided into two phases (PV&radiation model and Cost&Benefit model) and the flowchart showing the steps is presented in Figure 3.
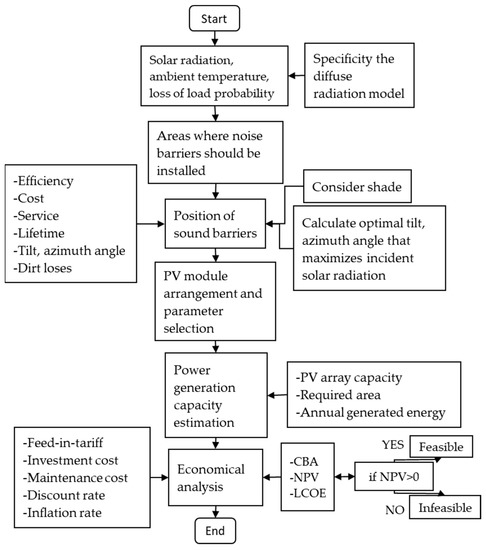
Figure 3.
Flowchart of the proposed method developed in the study.
In this study, GPNE-S144/FNH, 450W module monocrystalline was selected [45]. The derating factor was assumed to be 80%. The lifetime of the PV arrays was assumed to be 25 years. The temperature effect was considered, and the temperature coefficient of power was −0.37%/°C. The nominal operating cell temperature of the PV array was 42 ± 2 °C, and the panel efficiency at standard test conditions was 20.4%. Table 1 shows the detailed specifications of the selected module at the GPPV brand (GPNE-S144/FNH [45]).

Table 1.
Technical parameters of PV arrays.
When the basic investment is subtracted from the present value, the result of the investment is obtained in the form of a capital value. The present value of the investment is calculated through a summation of discounted payment surpluses and residual value.
where
Inv—investment,
—surplus payment.
4. Implementation Process
Solar radiation is different around the country depending on weather conditions, direction, different types of days, and latitude. For the case study, the Kaman district (Central Turkey; Location: 39°20′52.8″ North, 33°44′42.7″ East, Elevation: 1127 m) in Turkey is chosen. Figure 4 shows the monthly average solar radiation, ambient temperature, and clearness index data in the Kaman district. It can be noticed that the monthly average solar radiation ranges from 53 to 221 kWh/m2/month, while the annual average of solar radiation is 134.2 kWh/m2/month. The clearness index ranges from 0.43 to 0.63, while the average daily clearness index is 0.54.
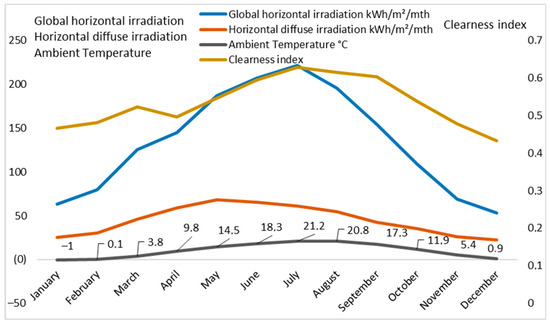
Figure 4.
Realistic resource data of the study area.
Direct radiation is radiation with a fixed direction, coming directly from the center of the Sun and reaching the Earth’s surface, without any dispersion in the atmosphere. Diffuse radiation is a type of radiation that is somewhat diffused (reflected) until it reaches the Earth’s surface. Diffuse radiation waves that undergo only forward reflection can be considered in the same category as direct radiation. Figure 5 shows solar radiation types for Kaman city on 1 June. Table 2 summarizes direct, diffuse radiation at 32°.
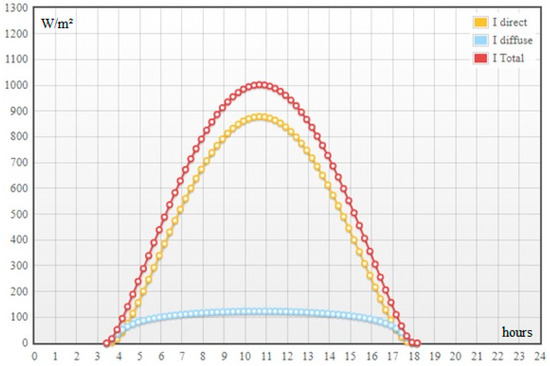
Figure 5.
Solar irradiation for Kaman district on the 1st of June (Total power per m2 is 8.68 kWh).
Table 2.
Solar radiation in the Kaman district (Lat.: 39.3575° N, Long.: 33.7239° E).
A model of the area expected to appear in the future was created in the SketchUp [46] program to perform shading analysis on the facility and to visualize the study. There is a plateau on the west of the road where many buildings are planned. To enable shadow analysis and production calculations, a reference model has been selected and built-in SketchUp. The model is of the top-mounted flush type, with the sound-limiting part made of glass within a steel frame, as shown in Figure 5. Taking into account that a higher proportion of the total production comes from diffuse radiation at a low solar cell angle, the relatively low angle of 32° has consequently been used in the calculations. Finally, the number of square meters of solar cells per meter of the sound barrier has been set to 1 by selecting the height and width of the solar cell as 2 m and 1 m respectively. The solar radiation against a surface with an angle of 32° was retrieved for each location from Photovoltaic Geographical Information System (PVGIS). A 20% efficiency is used in the calculations and the following Equation (7) is used to calculate the total shadowless generation for each lap:
A—solar cell surface area (m2),
—total solar radiation against a surface with an angle of 32° (kWh/m2),
η—efficiency factor (%),
—the relationship between diffuse radiation and ground radiation.
The variables that determine how the shadow falls on the facility are the height of the buildings on the opposite side, the position of the sound barrier relative to these buildings, and the height of the sound barrier. The latter is negligible in principle compared to building heights and therefore has not been investigated. The tested scenarios at different heights and distances from the road are presented in Table 3. Shadows from high-altitude vehicles are in principle negligible compared to buildings and were not examined in this study.
Table 3.
The lengths of the buildings by the roadside for analyzing the shadow.
As a result of the area analysis, suitable places for the installation of a total of 348 m of solar cells were found. After area analysis, the area considered suitable for a possible solar-generating sound barrier is shown in Figure 6.
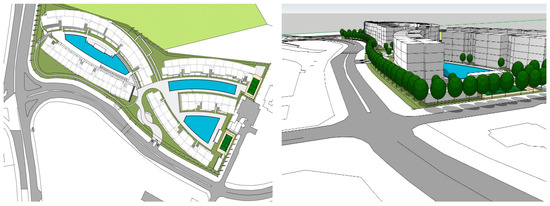
Figure 6.
The study area for PVSB [47].
Since certain parts of the facility are completely overshadowed during parts of the year, the losses on these occasions need to be calculated. The reduced generation in shading is generated by direct solar radiation. Therefore, the ratio between direct and diffuse radiation needs to be calculated. Solar radiation values and their distribution between direct and diffuse solar radiation for the study site and the respective month are taken from the PVGIS database. The diffuse radiation is calculated as follows:
diffuse radiation (kWh/ m2),
ground radiation (kWh/m2).
The ratio of the total emitted radiation striking a surface at an angle of 32° is calculated as:
Since the total radiation on a surface is the sum of direct and diffuse radiation, direct radiation on a surface with an angle of 32° can be defined as:
When the radiation characteristics of all the months are investigated, these data can be combined with the generated shadowless generation of the months and the f value to give the estimated generation in the case of shading in the relevant scenario. Generation from direct solar radiation is calculated as:
where
generated from direct solar radiation.
f—the proportion of months where the surface receives direct sunlight and can be calculated as follow:
where
number of days in the corresponding month,
shadow date.
The financial calculations have been made by developing a basic scenario where probable values of variable factors have been chosen based on the below reasonableness estimates. It is determined that the following factors (Table 4) are variable and have an effect on financial performance.
Table 4.
Variables that have an impact on financial performance.
Today, there are different types of solar-generating sound barriers whose sound and energy properties have been investigated. These models can generally be divided into two main categories where solar cells are installed on an existing sound barrier, and where the solar cells are integrated into the sound barrier (see Table 5). The cost of sound barriers is not included in the financial evaluation.
Table 5.
PV-integrated sound barrier models.
4.1. Generation Results in Energy Production without Shadow Effect
The total expected generation for the facility in shadow-free conditions is 64,551.64 kWh per year. The month with the highest generation is July when a total of 7415 kWh of generation is realized as shown in Figure 7. Less than 4.1% of the total generation takes place in January, as seen in Figure 7. Losses due to azimuth angle are less than 0.02%.
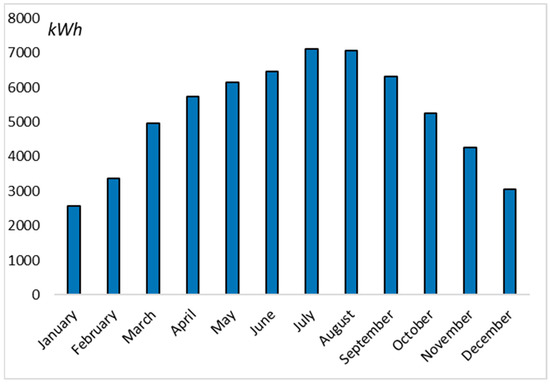
Figure 7.
Distribution of the facility’s total generation over the year.
The area is also divided into two sections with different directions (Azimuth: 0°, 5°, 11°) to highlight the importance of the azimuth angle. Table 6 presents monthly generation results without shadow.
Table 6.
Shadowless generation.
4.2. Results of Generation Losses from Shading
Shadow analysis results were used to calculate the percentage of generation losses due to shadows based on the distance of the barrier from the road and the height of the opposite buildings (see Table 7). The effect of the shadow is shown in Figure 8.
Table 7.
Percentage deviation from shaded generation.
Figure 8.
Shadow effect on top and side view [47].
In the worst possible scenario, there is a loss of approximately 12%. The scenario chosen as most likely is where the building height is 15 m and the facility’s distance from the road is 8 m. In this case, there is a loss of approximately 4% per year and the production will be 57,068 kWh per year (see Table 8).
Table 8.
Generation results in shadow loss.
4.3. Economic Evaluation
A present value calculation is built according to Equation (1) to give an estimate of how the present value of the investment changes. The above factors (Table 4) are made variables that can be changed to examine the outcome of the result. Field analysis was performed for the installation of a 265 m solar panel and the results of the feasibility study were obtained (see Figure 9). In the following financial calculations, a probable base value has been chosen for all variable factors. These baseline values represent the most likely financial results (see Table 9).
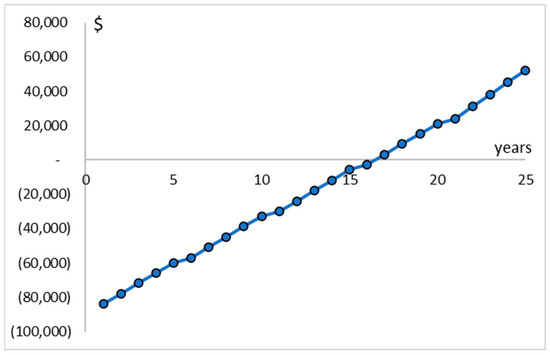
Figure 9.
The study’s financial development for the facility.
Table 9.
Values used for economic evaluation.
The respective scenario presented in Table 9 is examined through present value analysis and produced a diagram that describes the development of the capital value over 25 years. The results are shown in Figure 9.
The capital value at the plant’s expected 25-year lifetime is $83,798 with a calculated interest rate of 5%. Under the same conditions, the payment period is 16 years. Considering the factors (O&M cost, electricity price, and lot of dirt), the generated energy depends directly on the intensity of the radiation, the temperature, and anomalies, such as shading and dirt. Dirt reduces the efficiency of the generation system and compromises the module’s lifetime due to abnormal cell heating. Therefore, the estimation of dirt is an aid tool in the decision-making process to perform module cleanup. Dirt losses can vary from 2% to 25%, maintaining an average of 5%, and can be allowed to vary between worst and best value to give an idea of how risky the investment is. The analysis shows the NPV of the investment after 25 years can fluctuate between $−12,694 and $729 depending on electricity prices.
If the facility is built according to the proposed model, it is expected to provide approximately 62,257 kWh of energy per year. The LCOE is estimated to be 6.1 ¢/kWh. This corresponds to the average use of household electricity for 24 apartments or to providing energy for a selected electric vehicle for one year of its operation For example, in 2020, emission intensity was 375 g CO2/kWh, around the average for Turkey [51], which means the total annual emission reduction for this investment is about 23.3 tons of CO2. If the installation is assumed to have a viability of 25 years, there will be a total reduction of 582.5 tons of CO2. At this stage, it is worth noting that young trees absorb about 5.8 kg of CO2 per year, and 10-year-old trees are estimated to absorb 22 kg of CO2 per year [52]. Assuming a tree absorbs 7 kg of CO2 per year, the facility thus contributes to the same benefit as planting 3328 trees a year.
5. Conclusions
The presented considerations on the modular installation of solar cells on sound barriers focused on answering the question of whether such a combination could be profitable from an economic point of view while contributing to the reduction of the greenhouse effect. The following results were obtained by calculations of solar radiation, solar production, and payback period:
- The results of the analyses indicated that a total of 348 m of the road (in the case of the analyzed destination) can be adapted to noise barriers for generating energy from solar panels.
- The investment should take into account the shadow effect. In some places a model with solar cells mounted on top is recommended, and in other places any model can be used as the space is devoid of shadows.
- Economic analysis made with the assumption of probable values of estimable variables gives a capital value of $83,798 after 25 years. The investment in the facility is estimated at USD $−12,694 to USD $729, depending on electricity prices after 25 years.
- Despite the negative results in the profitability of the investment, this effect can be compensated for by other benefits of the installation in question, e.g., the electricity generated in the buildings can supply 24 apartments with renewable energy each year or power an electric car for one year of its operation.
- The modular installation reduces CO2 emissions by 582.5 tons over 25 years. This is equivalent to planting around 3328 trees per year for 25 years.
- The possible implementation of investments in other regions must be supported by careful research taking into account financial, weather, and topographic factors.
- In the future, an increase in the profitability of investments can be achieved with the use of double-sided photovoltaic panels.
- The use of the available road infrastructure for the production of electricity can contribute to the synergy effect. As a result, it will have a positive dimension in increasing public awareness and interest in renewable energy.
The obtained results show that the production of renewable energy is possible in the connection system with noise barriers and photovoltaic panels. Such a solution would lead to the achievement of the desired synergy effect. The modern market is currently dominated by one-sided photovoltaic modules. However, it is expected that in the next 10 years, bifacial panels will gain as much as 60% of the global market. This is due to the ability of double-sided solar panels to generate more power. It is estimated that they have up to 20–30% higher efficiency than standard components because they can use sunlight reflecting off the ground. They do well in cloudy and snowy conditions. Of course, a lot depends on the proper setting of the installation and the quality of the components used. Researchers also believe that latitude largely affects the performance of double-sided panels. If the installation is installed below 65° latitude, the panels will generate 12% more energy compared to traditional models. However, already at latitudes of 65° and higher, they will produce as much as 70% more energy. In the opinion of the authors, this postulate may constitute an incentive to re-analyze the profitability of investment implementation not only in the destination analyzed by the authors but also in other areas.
As for the infrastructure on highways and within cities, after its modernization (combined with photovoltaic panels), it can provide some electricity. Therefore, in the future, for the success of this category of projects, close cooperation of the main road infrastructure managers in the country with electricity producers and information institutions may prove very important.
Like any study, this also has its limitations. A large part of the results in this exploration t is dependent on the accuracy of the 3D model construction. While evaluating the heights and distances from the ground, values from Google Maps were used. In this study, the top-mounted flush reference model is used for calculations, shading analysis, and visualization. Such a facility can be installed on an existing sound barrier, which facilitates the estimation of investment costs and makes it possible to decide on the facility afterward. The solar cells are also elevated a couple of meters from ground level, which means that reflections toward vehicle drivers can be avoided. Shadows from lighting and traffic are very small in relation to buildings. The impact of this shading on production has therefore been neglected. If neither bypass diodes nor individual inverters are used, somewhat higher losses may occur. The height of the solar cells from ground level depends on which sound barrier model is used and how it is designed. How the height of the solar cells affects the total production has not been investigated separately. The method developed in this study is quite flexible and can be applied in other countries.
In conclusion, considering the fact that the combination of solar cells and sound barriers is not a popular phenomenon, but also considering that research in this area is limited, according to the researchers, it is possible to carry out a wide variety of additional studies and analyses in this area, including aspects such as: the environmental impact of the combination of solar cells and noise barriers and the reasons why solar cells in noise barriers cannot be retrofitted, namely traffic safety issues. An important area in the future seems to be the study of the impact of traffic pollution after the facility is commissioned. Therefore, the authors plan to expand their research in these areas in the future, in order to adopt a systemic approach to the wide implementation of the described solution in the near future in the use of the integration of highway sound screens and solar panels in the process of generating green energy. Design guidelines that address both noise barriers and photovoltaic systems should be prepared for future work. The impact of design variables on generation effectiveness and cost should also be investigated. Future work could further explore the solar photovoltaic potential of noise barriers by considering different designs and sizes. Moreover, sound abatement modeling is recommended for different PV module laminates to determine sound abatement characteristics, and large-scale experiments of model predictive control on several PVSB facilities would be useful to further validate the current results. In addition, a much longer experimental period would be beneficial, especially given the seasonal conditions and the variation of PVs used, as well as the large fluctuations in the energy demand profile.
Author Contributions
Conceptualization H.H.C. and W.L.; methodology, H.H.C., W.L., R.M. and W.D.; software, H.H.C. and W.L.; validation, H.H.C. and W.L.; formal analysis, H.H.C. and W.L.; investigation, H.H.C., W.L., W.D. and R.M.; resources, H.H.C.; data curation, H.H.C. and W.L.; writing—original draft preparation, H.H.C., W.L., R.M. and W.D.; writing—review and editing, H.H.C. and W.L.; visualization, H.H.C. and W.L.; supervision, H.H.C., W.L., R.M. and W.D.; project administration, H.H.C. and W.L., funding acquisition H.H.C., W.L., R.M. and W.D. All authors have read and agreed to the published version of the manuscript.
Funding
This research received no external funding.
Conflicts of Interest
The authors declare no conflict of interest.
Abbreviations
| NPV | Net Present Value |
| LCOE | Levelized Cost of Electricity |
| CO2 | Carbon Dioxide |
| PVSB | Photovoltaic sound barriers |
| FHWD | US Federal Highway Administration |
| O&M | Operation and Maintenance |
| the net cash inflow at year t ($) | |
| d | discount rate (%) |
| t | economic lifespan |
| the cash inflow of by selling generated electricity ($) | |
| the expenses ($) | |
| Electricity price ($/kWh) | |
| the output power of the PV modules | |
| the rated power of a PV module at the standard test conditions | |
| the derating factor (%) | |
| the global solar irradiation on the surface of the PV modules (kW/m2) | |
| the solar irradiation at the standard test conditions (1 kW/m2) | |
| the temperature coefficient the PV modules (%/°C) | |
| the temperature of the PV modules (°C) | |
| the temperature of the PV modules at the standard test conditions (25 °C) | |
| the costs over the project lifetime ($) | |
| the total electricity generation of the facility (kWh) | |
| Inv | investment |
| surplus payment | |
| A | solar cell surface area (m2) |
| total solar radiation against a surface with an angle of 32° (kWh/ m2) | |
| η | efficiency factor (%) |
| the relationship between diffuse radiation and ground radiation | |
| diffuse radiation (kWh/m2) | |
| ground radiation (kWh/m2) | |
| generated from direct solar radiation | |
| f | the proportion of months where the surface receives direct sunlight |
| number of days in the corresponding month | |
| shadow date |
References
- Hassan, A.; Ilyas, S.Z.; Jalil, A.; Ullah, Z. Monetization of the environmental damage caused by fossil fuels. Environ. Sci. Pollut. Res. 2021, 28, 21204–21211. [Google Scholar] [CrossRef]
- International Renewable Energy Agency. Global Energy Transformation: A Roadmap to 2050; International Renewable Energy Agency: Masdar City, United Arab Emirates, 2019. [Google Scholar]
- Paris agreement. Paris agreement. Paris Agreement. In Report of the Conference of the Parties to the United Nations Framework Convention on Climate Change; The United Nations: New York, NY, USA, 2015. [Google Scholar]
- Tanaka, K.; O’Neill, B.C. The Paris Agreement zero-emissions goal is not always consistent with the 1.5 °C and 2 °C temperature targets. Nat. Clim. Chang. 2018, 8, 319–324. [Google Scholar] [CrossRef]
- Kilickaplan, A.; Bogdanov, D.; Peker, O.; Caldera, U.; Aghahosseini, A.; Breyer, C. An energy transition pathway for Turkey to achieve 100% renewable energy powered electricity, desalination and non-energetic industrial gas demand sectors by 2050. Sol. Energy 2017, 158, 218–235. [Google Scholar] [CrossRef]
- Bulut, U.; Muratoglu, G. Renewable energy in Turkey: Great potential, low but increasing utilization, and an empirical analysis on renewable energy-growth nexus. Energy Policy 2018, 123, 240–250. [Google Scholar] [CrossRef]
- Zakeri, B.; Paulavets, K.; Barreto-Gomez, L.; Echeverri, L.G.; Pachauri, S.; Boza-Kiss, B.; Zimm, C.; Rogelj, J.; Creutzig, F.; Ürge-Vorsatz, D.; et al. Pandemic, War, and Global Energy Transitions. Energies 2022, 15, 6114. [Google Scholar] [CrossRef]
- Nerlinger, M.; Utz, S. The impact of the Russia-Ukraine conflict on the green energy transition—A capital market perspective. Swiss Financ. Inst. Res. Pap. Electron. J. 2022, 22–49. [Google Scholar] [CrossRef]
- Ozturk, M.; Dincer, I. System development and assessment for green hydrogen generation and blending with natural gas. Energy 2022, 261, 125233. [Google Scholar] [CrossRef]
- Notton, G.; Nivet, M.-L.; Voyant, C.; Paoli, C.; Darras, C.; Motte, F.; Fouilloy, A. Intermittent and stochastic character of renewable energy sources: Consequences, cost of intermittence and benefit of forecasting. Renew. Sustain. Energy Rev. 2018, 87, 96–105. [Google Scholar] [CrossRef]
- Georgilakis, P.S. Technical challenges associated with the integration of wind power into power systems. Renew. Sustain. Energy Rev. 2008, 12, 852–863. [Google Scholar] [CrossRef]
- Shahsavari, A.; Akbari, M. Potential of solar energy in developing countries for reducing energy-related emissions. Renew. Sustain. Energy Rev. 2018, 90, 275–291. [Google Scholar] [CrossRef]
- Stambouli, A.B. Promotion of renewable energies in Algeria: Strategies and perspectives. Renew. Sustain. Energy Rev. 2011, 15, 1169–1181. [Google Scholar] [CrossRef]
- Kabir, E.; Kumar, P.; Kumar, S.; Adelodun, A.A.; Kim, K.-H. Solar energy: Potential and future prospects. Renew. Sustain. Energy Rev. 2018, 82, 894–900. [Google Scholar] [CrossRef]
- Stambouli, A.B.; Khiat, Z.; Flazi, S.; Tanemoto, H.; Nakajima, M.; Isoda, H.; Yokoyama, F.; Hannachi, S.; Kurokawa, K.; Shimizu, M.; et al. Trends and challenges of sustainable energy and water research in North Africa: Sahara solar breeder concerns at the intersection of energy/water. Renew. Sustain. Energy Rev. 2014, 30, 912–922. [Google Scholar] [CrossRef]
- Global Solar Atlas. Available online: https://globalsolaratlas.info/map?c=42.779275,-37.661133,4 (accessed on 29 September 2022).
- Eurostat. Electricity Production, Consumption and Market Overview. Available online: https://ec.europa.eu/eurostat/statistics-explained/index.php?title=Electricity_production%2C_consumption_and_market_overview (accessed on 29 September 2022).
- Net Electricity Consumption Worldwide in Select Years from 1980 to 2019. Available online: https://www.statista.com/statistics/280704/world-power-consumption/ (accessed on 29 September 2022).
- McCann, K. 10,000 sq km of Solar in the Sahara Could Provide All the World’s Energy Needs; Energy Post EU: Amsterdam, The Netherlands, 2020. [Google Scholar]
- De Schepper, E.; Van Passel, S.; Manca, J.; Thewys, T. Combining photovoltaics and sound barriers—A feasibility study. Renew. Energy 2012, 46, 297–303. [Google Scholar] [CrossRef]
- Nordmann, T.; Clavadetscher, L. PV on noise barriers. Prog. Photovoltaics Res. Appl. 2004, 12, 485–495. [Google Scholar] [CrossRef]
- Sudimac, B.; Dubljević, A. Application of PV modules on noise barriers. In Proceedings of the 2nd International Academic Conference on Places and Technologies, Nova Gorica, Slovenia, 18–19 June 2015; pp. 498–504. [Google Scholar]
- Seong, J.C.; Park, T.H.; Ko, J.H.; Chang, S.; Kim, M.; Holt, J.B.; Mehdi, M.R. Modeling of road traffic noise and estimated human exposure in Fulton County, Georgia, USA. Environ. Int. 2011, 37, 1336–1341. [Google Scholar] [CrossRef] [PubMed]
- Cameron, J. Were These Highway Barriers a Sound Expense? 2021. Available online: https://ctmirror.org/2021/12/20/were-these-highway-barriers-a-sound-expense/ (accessed on 29 September 2022).
- Ow, L.F.; Ghosh, S. Urban cities and road traffic noise: Reduction through vegetation. Appl. Acoust. 2017, 120, 15–20. [Google Scholar] [CrossRef]
- Remmer, D.; Rocha, J. Photovoltaic noise barrier: Canada. In Proceedings of the Conference The 30. Annual International Conference of the Solar Energy Society of Canada: SESCI 2005: Solar and the Built Environment, Burnaby, BC, Canada, 20–24 August 2005. [Google Scholar]
- Rüther, R.; Kleiss, G. Advantages of thin film solar modules in façade, sound barriers and roofmounted PV systems 1990. In Proceedings of the EUROSUN’96, Freiburg im Breisgau, Germany, 16–19 September 1996. [Google Scholar]
- Subramanian, R. The Current Status of Roadways Solar Power Technology: A Review. In Environmental Sustainability in Transportation Infrastructure; ASCE Library: Reston, VA, USA; pp. 177–187. [CrossRef]
- Andriopoulou, S. A Review on Energy Harvesting from Roads; KTH: Stockholm, Sweden, 2012. [Google Scholar]
- Brabullerplank. 2022. Available online: https://brabullerplank.se/produkt/bullerplank-med-solpaneler/ (accessed on 29 September 2022).
- van Eck, R. Design of a ‘Fit for Person’ Comfort Assessment Tool within a BIM-Environment; Eindhoven University of Technology: North Brabant, The Netherlands, 2019. [Google Scholar]
- Bellini, E. South Korea Tests Photovoltaics on Railroad Noise Barriers; PV Magazine: Berlin, Germany, 2022. [Google Scholar]
- Bognár, Á.; Kusnadi, S.; Slooff, L.H.; Tzikas, C.; Loonen, R.C.; de Jong, M.M.; Hensen, J.L.; Debije, M.G. The solar noise barrier project 4: Modeling of full-scale luminescent solar concentrator noise barrier panels. Renew. Energy 2020, 151, 1141–1149. [Google Scholar] [CrossRef]
- Debije, M.G.; Tzikas, C.; de Jong, M.M.; Kanellis, M.; Slooff, L.H. The solar noise barrier project: 3. The effects of seasonal spectral variation, cloud cover and heat distribution on the performance of full-scale luminescent solar concentrator panels. Renew. Energy 2018, 116, 335–343. [Google Scholar] [CrossRef]
- Poe, C.; Plovnick, A.; Hodges, T.; Hastings, A.; Dresley, S. Highway Renewable Energy: Photovoltaic Noise Barriers. 2017. Available online: https://rosap.ntl.bts.gov/view/dot/32521 (accessed on 20 September 2022).
- Zhang, Q.; Liang, Q.; Nandakumar, D.K.K.; Ravi, S.K.; Qu, H.; Suresh, L.; Zhang, X.; Zhang, Y.; Yang, L.; Wee, A.T.S.; et al. Energy harvesting from shadow-effect. Energy Environ. Sci. 2020, 13, 2404–2413. [Google Scholar] [CrossRef]
- Diaz-Dorado, E.; Suarez-Garcia, A.; Carrillo, C.; Cidras, J. Influence of the shadows in photovoltaic systems with different configurations of bypass diodes. In Proceedings of the SPEEDAM 2010, Pisa, Italy, 14–16 June 2010; pp. 134–139. [Google Scholar] [CrossRef]
- Wang, A.; Xuan, Y. Close examination of localized hot spots within photovoltaic modules. Energy Convers. Manag. 2021, 234, 113959. [Google Scholar] [CrossRef]
- Meyer, E.; van Dyk, E. Assessing the Reliability and Degradation of Photovoltaic Module Performance Parameters. IEEE Trans. Reliab. 2004, 53, 83–92. [Google Scholar] [CrossRef]
- Vieira, R.; de Araújo, F.; Dhimish, M.; Guerra, M. A Comprehensive Review on Bypass Diode Application on Photovoltaic Modules. Energies 2020, 13, 2472. [Google Scholar] [CrossRef]
- Appelbaum, J. Bifacial photovoltaic panels field. Renew. Energy 2016, 85, 338–343. [Google Scholar] [CrossRef]
- Egido, M.A.; Lorenzo, E. Bifacial Photovoltaic Panels with Sun Tracking. Int. J. Sol. Energy 1986, 4, 97–107. [Google Scholar] [CrossRef]
- He, L.; Zhang, S.; Chen, Y.; Ren, L.; Li, J. Techno-economic potential of a renewable energy-based microgrid system for a sustainable large-scale residential community in Beijing, China. Renew. Sustain. Energy Rev. 2018, 93, 631–641. [Google Scholar] [CrossRef]
- Owolabi, A.B.; Nsafon, B.E.K.; Roh, J.W.; Suh, D.; Huh, J.-S. Validating the techno-economic and environmental sustainability of solar PV technology in Nigeria using RETScreen Experts to assess its viability. Sustain. Energy Technol. Assess. 2019, 36, 100542. [Google Scholar] [CrossRef]
- ENF Solar. 2022. Available online: https://www.enfsolar.com/pv/panel-datasheet/crystalline/47197 (accessed on 29 September 2022).
- Sketchup. 2022. Available online: https://www.sketchup.com/ (accessed on 30 September 2022).
- Sketchup Database. 2022. Available online: https://app.sketchup.com/app?3dwid=ec97acfe086cebd4a04f46b741f75e0b (accessed on 29 September 2022).
- Santos, R.; Batista, E.; Brito, M.; Quinelato, D. Dirt Loss Estimator for Photovoltaic Modules Using Model Predictive Control. Electronics 2021, 10, 1738. [Google Scholar] [CrossRef]
- Turkey Electricity Prices. 2022. Available online: https://www.globalpetrolprices.com/Turkey/electricity_prices/#:~:text=Turkey%2CDecember2021%3ATheprice,ofpower%2Cdistributionandtaxes (accessed on 28 September 2022).
- Feldman, D.; Ramasamy, V.; Fu, R.; Ramdas, A.; Desai, J.; Margolis, R.U.S. Solar Photovoltaic System and Energy Storage Cost Benchmark (Q1 2020); National Renewable Energy Laboratory: Golden, CO, USA, 2021. [Google Scholar] [CrossRef]
- Climate Transparency Report: Comparing G20 Climate Action towards Net Zero. 2021. Available online: https://www.climate-transparency.org/wp-content/uploads/2021/10/CT2021Turkey.pdf (accessed on 29 September 2022).
- Maina, Y.B.; Kyari, B.; Jimme, M.A. Impact of household fuel expenditure on the environment: The quest for sustainable energy in Nigeria. Cent. Asian J. Environ. Sci. Technol. Innov. 2020, 1, 109–118. [Google Scholar] [CrossRef]


Disclaimer/Publisher’s Note: The statements, opinions and data contained in all publications are solely those of the individual author(s) and contributor(s) and not of MDPI and/or the editor(s). MDPI and/or the editor(s) disclaim responsibility for any injury to people or property resulting from any ideas, methods, instructions or products referred to in the content. |
© 2022 by the authors. Licensee MDPI, Basel, Switzerland. This article is an open access article distributed under the terms and conditions of the Creative Commons Attribution (CC BY) license (https://creativecommons.org/licenses/by/4.0/).