Article

Environmental, Social, and Economic Aspects of the Green Economy in Polish Rural Areas—A Spatial Analysis

by
Aleksandra Jezierska-Thöle
1,*,
Marta Gwiaździńska-Goraj
2 and
Małgorzata Dudzińska
2
1
Institute of Geography, Kazimierz Wielki University, 85-033 Bydgoszcz, Poland
2
Institute of Spatial Management and Geography, University of Warmia and Mazury in Olsztyn, 10-720 Olsztyn, Poland
*
Author to whom correspondence should be addressed.
Energies 2022, 15(9), 3332; https://doi.org/10.3390/en15093332
Submission received: 6 April 2022 / Revised: 28 April 2022 / Accepted: 29 April 2022 / Published: 3 May 2022

Abstract

:
The global climate, ecological, and energy crisis has increased the interest in the green economy (GE) concept that aims to resolve environmental problems while promoting economic growth, social stabilization, and creating favorable conditions for sustainable economic growth. The implementation of GE solutions requires an assessment system for evaluating the extent to which business operations are consistent with GE principles. In this study, the environmental, economic, and social dimensions of the quality of life were identified, and agricultural factors were considered to determine the progress in the implementation of GE principles. The correlation between the success of GE implementation and the utilization of environmental funding provided by the Common Agricultural Policy (CAP) was analyzed. A composite GE index composed of 19 variables was developed for this purpose with the use of Hellwig’s taxonomic measure of development. The strength of the correlation between GE implementation and the utilization of green payments under the CAP was evaluated by calculating Pearson’s correlation coefficient. Polish rural areas were analyzed at the level of Local Administrative Units (LAU). The study revealed spatial variations in GE development, and it demonstrated that local projects financed from EU funds had a positive impact on the environment. However, the utilization of EU support schemes differs considerably across Polish regions. The analysis revealed that agri-environmental-climate measures (spending per ha) were most strongly correlated with the economic dimension of the quality of life. Southern Poland and suburban areas differed considerably from Eastern Poland where green payments were less effective in promoting GE development. The results of this study are useful for planning, land management, and the development of socioeconomic development strategies at the municipal, regional, and local level.

1. Introduction

Sustainable development is one of the greatest challenges in the contemporary world. Sustainable development has been defined by the United Nations (UN) as an approach to economic planning that aims to foster social and economic growth while preserving the quality of the environment [1]. In 2011, the Organization for Economic Cooperation and Development (OECD) launched the Green Growth Strategy that supports countries’ efforts to achieve economic growth, while preventing environmental degradation, preserving biodiversity, and utilizing natural resources in a manner that does not disrupt the ecological balance. The transition to a green economy (GE) requires considerable effort. Green protectionism and green standards should not obstruct efforts to resolve current socioeconomic problems, and they should promote green economic development [2], increase employment, and improve the standard of living. Environmental protection and GE standards play an increasingly important role in the socioeconomic development of the European Union, including Poland. In addition to conventional environmental protection policies [3], increased emphasis is placed on economic modernization, defined as the eco-friendly management of environmental resources that contributes to harmonious social [4,5], environmental [6], and economic development [7]. The existing economic and social models are undergoing sustainability transition. The GE policy receives financial support under the EU’s regional development policy. In the Rural Development Program for 2014–2020, agri-environment-climate measures, as well as organic farming measures, play a special role in the achievement of GE objectives and sustainable agricultural development [8].
The Implementation of a GE is a long and complex process, so there is a need for an evaluation system to determine the degree of compliance of the business with its principles. So far in the literature, one can find attempts to measure the green economy on three levels. The first was related to the analysis of the transition from the traditional economy to the green economy, the second concerned the study of the state of the green economy based on the elements that distinguish it from the traditional economy, and the third was related to two ways of determining economic growth [9,10].
Linear ordering methods are used in economic and geographical studies to rank or classify objects such as countries and regions. Characteristics of the level of economic development or a green economy are variables whose realizations are not directly measurable.
These variables are aggregates whose values are generated by observations of diagnostic variables that are directly measurable. The obtained realizations of the synthetic variable make it possible to order multidimensional objects in terms of preference (dominance) relations.
With these statements in mind, the main objective of the study was to identify: the environmental dimension of quality of life, agricultural development, economic security, and social inequality, which were used to assess the degree of implementation of green economy principles, and then determine the correlation between the level of GE implementation in rural areas and the use of pro-environmental measures of the Common Agricultural Policy. The paper proposes a multifaceted approach to assess the formation of the green economy concept, and the obtained research results and recommendations can be used in regional policy.

2. Theoretical Background

2.1. Green Economy Concept

In theoretical terms, the concept of a GE and green growth is linked to the concept of sustainable and balanced socio-economic development. However, a GE is more practical and applied in nature, as its ideas are part of economic policy, especially with regards to energy and industry, while its certain elements are also implemented at the enterprise level. Meanwhile, the principles of sustainable development are implemented as part of the social and economic development agenda at both the state and international organization levels. Related to the term “green economy” are the OECD’s proposed concepts of “green growth” and “sustainable development”. According to the Global Green Growth Institute, green growth is a revolutionary new development paradigm that sustains economic growth while ensuring climate and environmental sustainability. It targets poverty reduction, job creation, social inclusion, and ecosystem sustainability. The term “green economy” is more concerned with the state and structure of the economy, its nature, and the way it functions, while the term “green growth” is dynamic in nature and refers to the use of green factors to magnify economic effects, which can give rise to development processes [11,12,13].
Understanding the ideas and principles of a GE requires an in-depth analysis and discussion of the emergence and implementation of the concept in the progress of civilization and socio-economic development. The GE is a concept that operationalizes the notion of sustainable development. The debate on the sustainability transition of the global economy, the scale of the global ecological crisis, and its consequences had begun already in the 1950s. The “Our Common Future” report of the Brundtland Commission [14] and the Rio de Janeiro Earth Summit of 1992 initiated the discussion on the environmental impact of human activities, and these efforts gave rise to the concept of sustainable and resilient development.
The “Limits to Growth” report warned about increasing anthropogenic pressure on the environment, the depletion of fossil fuels, and growing greenhouse gas emissions. The concept of a low-carbon and low-emission economy emerged in the first decade of the 21st century. New solutions for overcoming the global financial crisis (2008–2009) and the ecological crisis were proposed in the international arena. International organizations also sounded the alarm on devastating climate impacts in various parts of the world. In 2006, the British government published the Stern review on the effects of global warming on the world’s economy [15]. In 2007, the Synthesis Report to the Fourth Assessment Report of the Intergovernmental Panel on Climate Change provided new insights into the state of knowledge concerning the science of climate change [16,17]. In 2008, these efforts inspired the UN to launch the Green Economy Initiative. A Strategy for Smart, Sustainable, and Inclusive Growth was adopted by the EU. The Global Green New Deal concept was outlined by the United Nations Environment Program (UNEP) [18,19]. The European Sustainable Development Strategy was revised in 2006 by incorporating environmental and social dimensions into the sustainable development concept [20]. In contrast to the 1990s of the twentieth century, when the most important factors were the pace and growth factors of national income, in the twenty-first century the European Union began to concentrate on new priorities related to the quality of life and the fight against poverty and social exclusion [21,22]. The Green Economy became part of the knowledge-based economy, which consisted of implementing new rules for the functioning of economic entities using information technology while respecting the principles of environmental protection. Similar to a green economy, the knowledge-based economy is popular in descriptions of socio-economic transformations and civilization progress.; however, it does not take up ecological issues as clearly as the “green economy”.
The GE concept has also laid the foundations for the Europe 2020 strategy, which aims to move the European economy to a low-carbon, resource efficient, and climate resilient economy by 2050 [23,24]. The European Green Deal (EGD) was announced in 2019 as a set of policy initiatives implementing the UN’s sustainable development goals. The main objective of the EGD is to transform the EU into a modern, competitive, and low-carbon economy with no net emission of greenhouse gasses [25]. The GE concept promotes a triple bottom line by sustaining and advancing economic, environmental, and social well-being. Therefore, the measures initiated in rural areas should contribute to environmental protection (and the development of the required technical infrastructure), promote the development of a healthy and environmentally friendly food system, improve working conditions, the quality of life, and increase rural incomes. The main objectives and policy areas of the EGD are presented in Figure 1.
The concepts of a “green economy” and “green growth” were shaped in a similar period, at the beginning of the second decade of the 21st century, but in different environments and addressed to different audiences. The evolution of the GE concept in successive decades was analyzed based on a review of the literature, and the main policy papers are presented in Table 1. The green economy can be considered from a conceptual and theoretical perspective, which allows the creation of strategies for social and economic development, creating policies, and designing development programs. On the other hand, it can be considered from an application-implementation perspective, which enables the preparation and implementation of plans and practical actions, e.g., green products and services, green investments, green economy sectors, and green jobs [29].
The GE concept is most closely related to eco-friendly economic transition, and it promotes a low-emission, closed-loop economy as well as a bioeconomy [18,19]. In the EU, a GE is defined as an economic system that contributes to sustainable and resilient development. The bioeconomy encompasses sustainable production in agriculture, forestry, fisheries, and aquaculture, and the application of biological processes in industrial production and services [30].
Table 1. Evolution of the green economy concept.
YearDocumentConcepts, Policies and Actions
1972Sustainable development theoryThe theory postulates the need for harmonious relations between economic growth, society, and the environment to meet the needs of the present and future generations.
1987Our Common FutureConcept of sustainable and resilient development.
1989Blueprint for a Green Economy Practical policy measures for “greening” modern economies and putting them on a path to sustainable development.
1996Cork DeclarationThe main aim of the Cork Declaration; namely, sustainable development of agriculture and rural areas, was integrated into the EU’s policy framework during the 2nd European conference on rural development held in Salzburg in 2003.
1999Factor Four
von Weizsäcker, A.B. Lovins, L.H. Lovins
Doubling wealth, halving resource use.
2006The EU’s Sustainable Development Policy
Common Agricultural Policy
Agenda 2000
The green economy as a means of implementing the sustainable development concept (low-carbon economy, reduced demand for energy, reduced greenhouse gas emissions).
The EU’s strategic goals encompass the social, economic, and environmental dimensions.
The aim of this policy is to exert greater control over production and to improve the competitiveness of European agriculture on global markets.
2007Synthesis Report to the Fourth Assessment Report of the IPCCLow-carbon and resource-efficient economy.
2008United Nations Environment Program (UNEP)
Green Economy Initiative
Global Green New Deal
The Green Economy initiative calls for greater spending on greening projects. Main goals: economic revival, eradication of poverty, reduction in greenhouse gas emissions, prevention of ecosystem degradation.
2010Europe 2020Resource-efficient Europe, shift towards a low-carbon economy.
2019 European Green Deal Modern, competitive, low-carbon and climate-neutral economy. Food safety, territorial cohesion, protection of the EU’s financial interests
2020EU Strategy for Smart, Sustainable and Inclusive GrowthAction plan: greening of the EU economy, transition to a competitive, resource-efficient, and low-carbon economy by 2050.
Source: own elaboration based on: [25,26,31,32,33,34,35].
Summarizing the above considerations, it should be emphasized that a GE means a concept that aims in practice to ensure an increase in prosperity and an increase in the quality of life and social equality, while halting the depletion of natural resources and reducing environmental risks. The green economy is treated as a tool aimed at realizing sustainable development and as an element that combines economic, social, and environmental goals. The green economy does not replace the concept of sustainable development but is its narrower scope, allowing operationalization in three main levels and showing the effects of management [36]. Thus, the green economy can be seen as a set of principles, goals, and actions that include an adherence to the principles of sustainable development, a rational use of natural and social capital, the creation of green jobs, and the eradication of poverty. The practical application of the above principles and actions is revealed in green growth [11].

2.2. Financial Instruments

The financial instruments provided under the EU’s regional development policy support the implementation of GE objectives. In the Rural Development Program for 2014–2020, agri-environment-climate measures as well as organic farming measures play a special role in minimizing the farming sector’s environmental impact [5,8,9]. The main aim of these measures is to strengthen the following agricultural functions:
(1)
green functions: farmland management to maintain high soil quality, protect animal welfare, and preserve biodiversity;
(2)
blue functions: improvements in water quality, flood prevention, hydropower, and wind energy generation;
(3)
yellow functions: maintaining rural cohesion and vitality, protecting and enhancing culture, traditions and identity of rural areas and regions, development of agritourism and hunting;
(4)
white functions; food security and food safety.
As part of the initiated agri-environmental measures, agricultural producers are encouraged to actively protect the environment, preserve biodiversity [8,21], and protect rural landscapes. These measures contribute to the development of GE, in particular the environmental (non-market) functions of agriculture (green and blue) that are linked with land and water resources. Poland, in comparison with other EU countries, has high employment in the bioeconomy sector, mainly in agriculture (>50%) and forestry (highest in the EU).

3. Materials and Methods

3.1. Materials

Rural areas play a significant role in the socioeconomic development of every country. In addition to traditional agricultural farms, rural areas increasingly often host modern industrial facilities, services, tourist and recreational sites, as well as housing construction projects. This study analyzed the sustainable development of Polish counties that represent first-level Local Administrative Units (LAU) (Figure 2).

3.2. Methods

Regular monitoring of the progress made in the implementation of the GE concept plays a very important role in EU policy. The development of an assessment system for evaluating the alignment of economic activities with GE principles, and the selection of measuring methods and diagnostic variables is a difficult and complex process. In this study, the adopted approach to measuring GE implementation is consistent with the methods for assessing sustainable development [34,37] and socioeconomic development [38,39].
The following indices for evaluating GE implementation have been identified based on a review of the literature:
-
The Green Economy Progress Index developed by PAGE [37];
-
The Global Green Economy Index (GGEI) [40] that has been developed by Dual Citizen LLC, a US consulting company, since 2010;
-
The Green Economy Index (GEI) proposed by A. Nahman, B. Mahumani and W. de Lange [38];
-
The Green Growth Index (GGI) developed by the Global Green Growth Institute.
The present study was conducted in three stages:
Stage 1: Identification of the environmental, economic, and social dimensions of the quality of life and agricultural performance to assess the progress in the implementation of GE principles in rural areas.
Four types of indicators that account for the complexity and multiplicity of GE objectives were adopted in this study based on a review of the literature and the methods for assessing GE implementation that have been proposed by international organizations, including the OECD Green Growth Indicators Database, United Nations Environment Program (UNEP), and the Green Economy Progress Measurement Framework developed by the Partnership for Action on Green Economy (PAGE) in 2017 [41,42,43]). Diagnostic variables for the study were selected based on the main objectives of the European Green Deal, which are to minimize the negative impacts of economic growth on the environment and the climate, and to improve social welfare. Potential diagnostic variables for evaluating the environmental, economic, and social dimensions of the quality of life and the development of agriculture were determined and divided into groups of stimulants and destimulants. Data availability at the regional level was also used as a criterion (Table 2).
Variables characterized by relatively low variation (with a coefficient of variation of less than 10%) and variables that were strongly correlated with other diagnostic attributes were eliminated from the dataset. The selected variables were validated for their ability to discriminate between objects (Table 2).
Stage 2: Evaluation of progress in the implementation of GE principles in rural areas.
The adopted tool for evaluating progress in the implementation of GE principles accounted for environmental problems that are directly related to GE as well as all issues relating to socioeconomic development. This approach was applied to extend the scope of the study and to measure sustainable development. The proposed composite GE index comprised 19 variables that were aligned with the main goals of the EU Cohesion Policy (Smart, Sustainable, and Inclusive Growth). The GE concept and its implementation are complex and multifaceted problems, which is why analytical and taxonomic methods were used in the evaluation process, and the composite GE index was developed based on Hellwig’s taxonomic measure of development (Smi). This method is applied to classify various types of data from sets of diagnostic attributes, and the analyzed object is described with the use of a single (aggregated) index on a scale of 0 to 1. A lower value of Smi denotes a higher level of the analyzed phenomenon [49,50]. This measure has two important characteristics: the greater the progress in GE implementation, the higher the value of Smi. Development is evaluated on a scale of [0; 1]; therefore, “ideal” development with optimal values of all explanatory variables equals 1 [51]. Hellwig’s taxonomic measure of development was calculated with the use of the following formula:
zoj = max(zij)
where: zij—is the normalized value that is observed in the (entire) dataset;
The Euclidean distance (di) for every object was calculated with the following formula:
d i = 1 m j = 1 m ( z ij z oj ) 2
where: i = 1, …, m—is the number of objects; j = 1, m—is the number of variables; zij—is the normalized value of variable j for object i; zoj—is the normalized value of variable j.
Hellwig’s taxonomic measure of development was normalized with the use of the following formula
z i = 1 d i d 0
where the value of d0 is calculated as d0 = max(di).
The general composite GE index Wge was used to classify counties based on their progress in the implementation of GE principles. The counties were divided into four groups (I, II, III, and IV) based on the arithmetic mean of the synthetic evaluations for all counties (Rav) with standard deviation (s) (Table 3).
The above method was used to present the following partial indicators: Wn—environmental dimension of the quality of life, Wagr—agriculture, We—economic dimension of the quality of life, Ws—social dimension of the quality of life.
The above indicators were applied to determine the relationships between the implementation of GE principles and the identified environmental, economic, and social dimensions of the quality of life as well as agricultural factors. These relationships were described with the use of a linear regression model.
The analyses were performed in Excel and the cartograms were made using ArcGIS Pro commercial software (version 2.9.2).
Stage 3: Correlation between the implementation of GE principles in rural areas and the utilization of CAP funds earmarked for environmental protection.
Pearson’s correlation coefficients were calculated to determine the relationships between the composite GE index (Wge) and partial indicators (Wn, Wagr, We, Ws) vs. total spending on environmental protection in Polish municipalities in 2015–2018 and local spending on environmental protection per hectare in 2015–2018. Statistica software version.13.1 was used to determine Pearson’s correlation.

4. Results and Discussion

The progress in the implementation of GE principles in Polish rural areas was evaluated with the use of partial indicators (Wn, Wagr, We, Ws). The analysis revealed considerable spatial variation in natural conditions, socioeconomic development, and functions of the studied regions. Greenhouse gas emissions and natural resource use differed in areas with various types of economic specialization. These parameters were high in areas with diverse economic profiles (energy generation, industry) that also provide services for other regions.

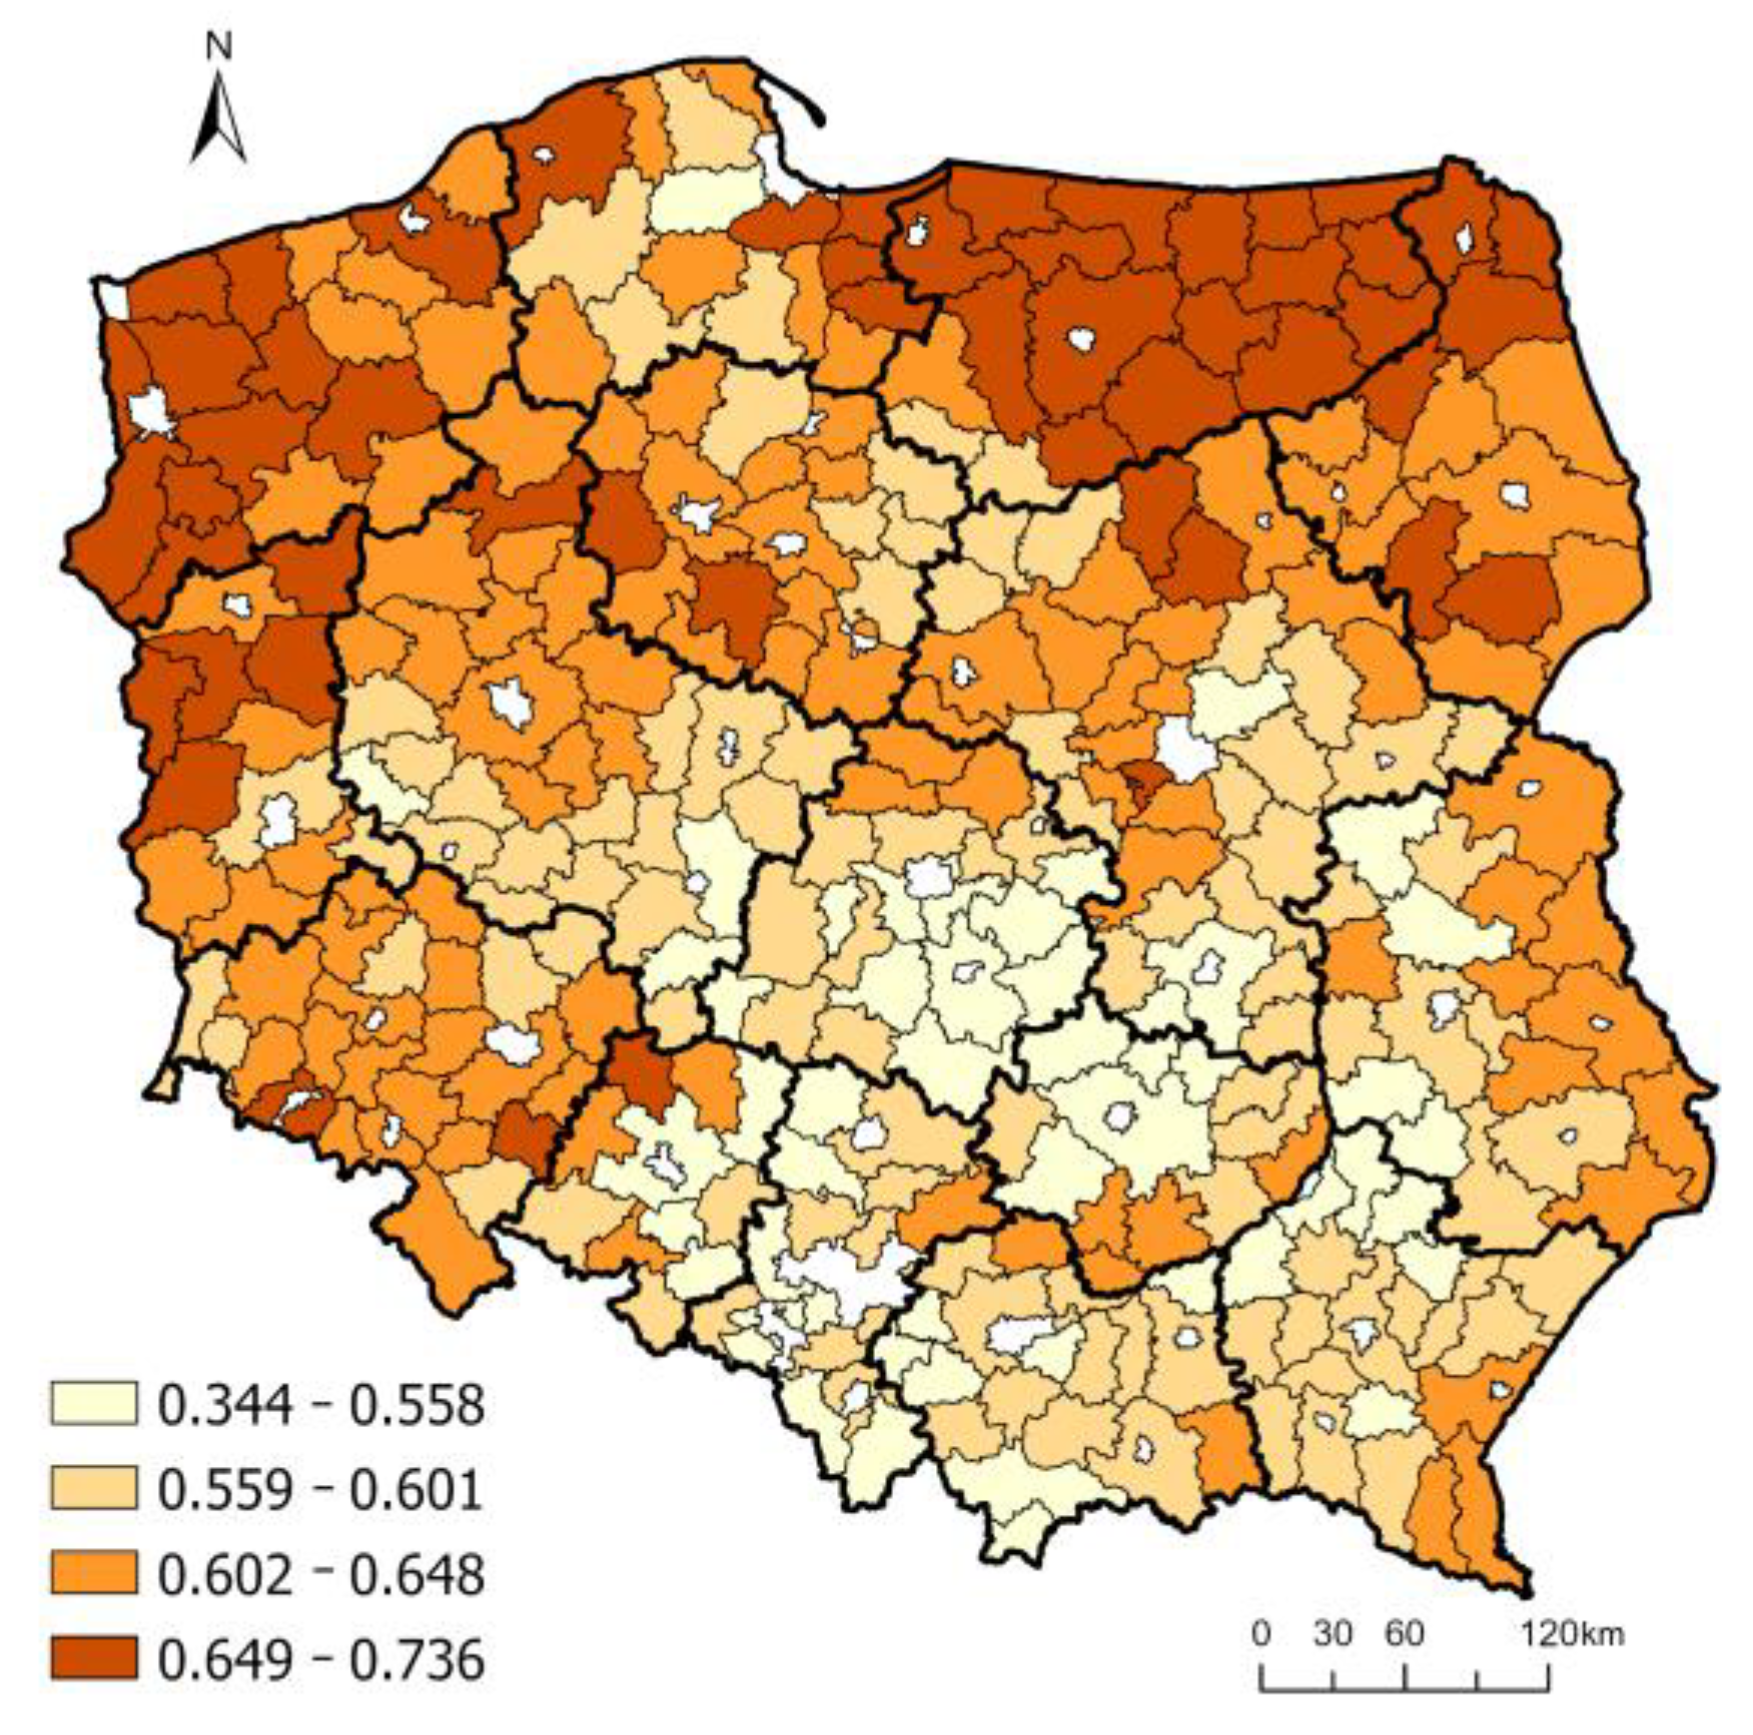
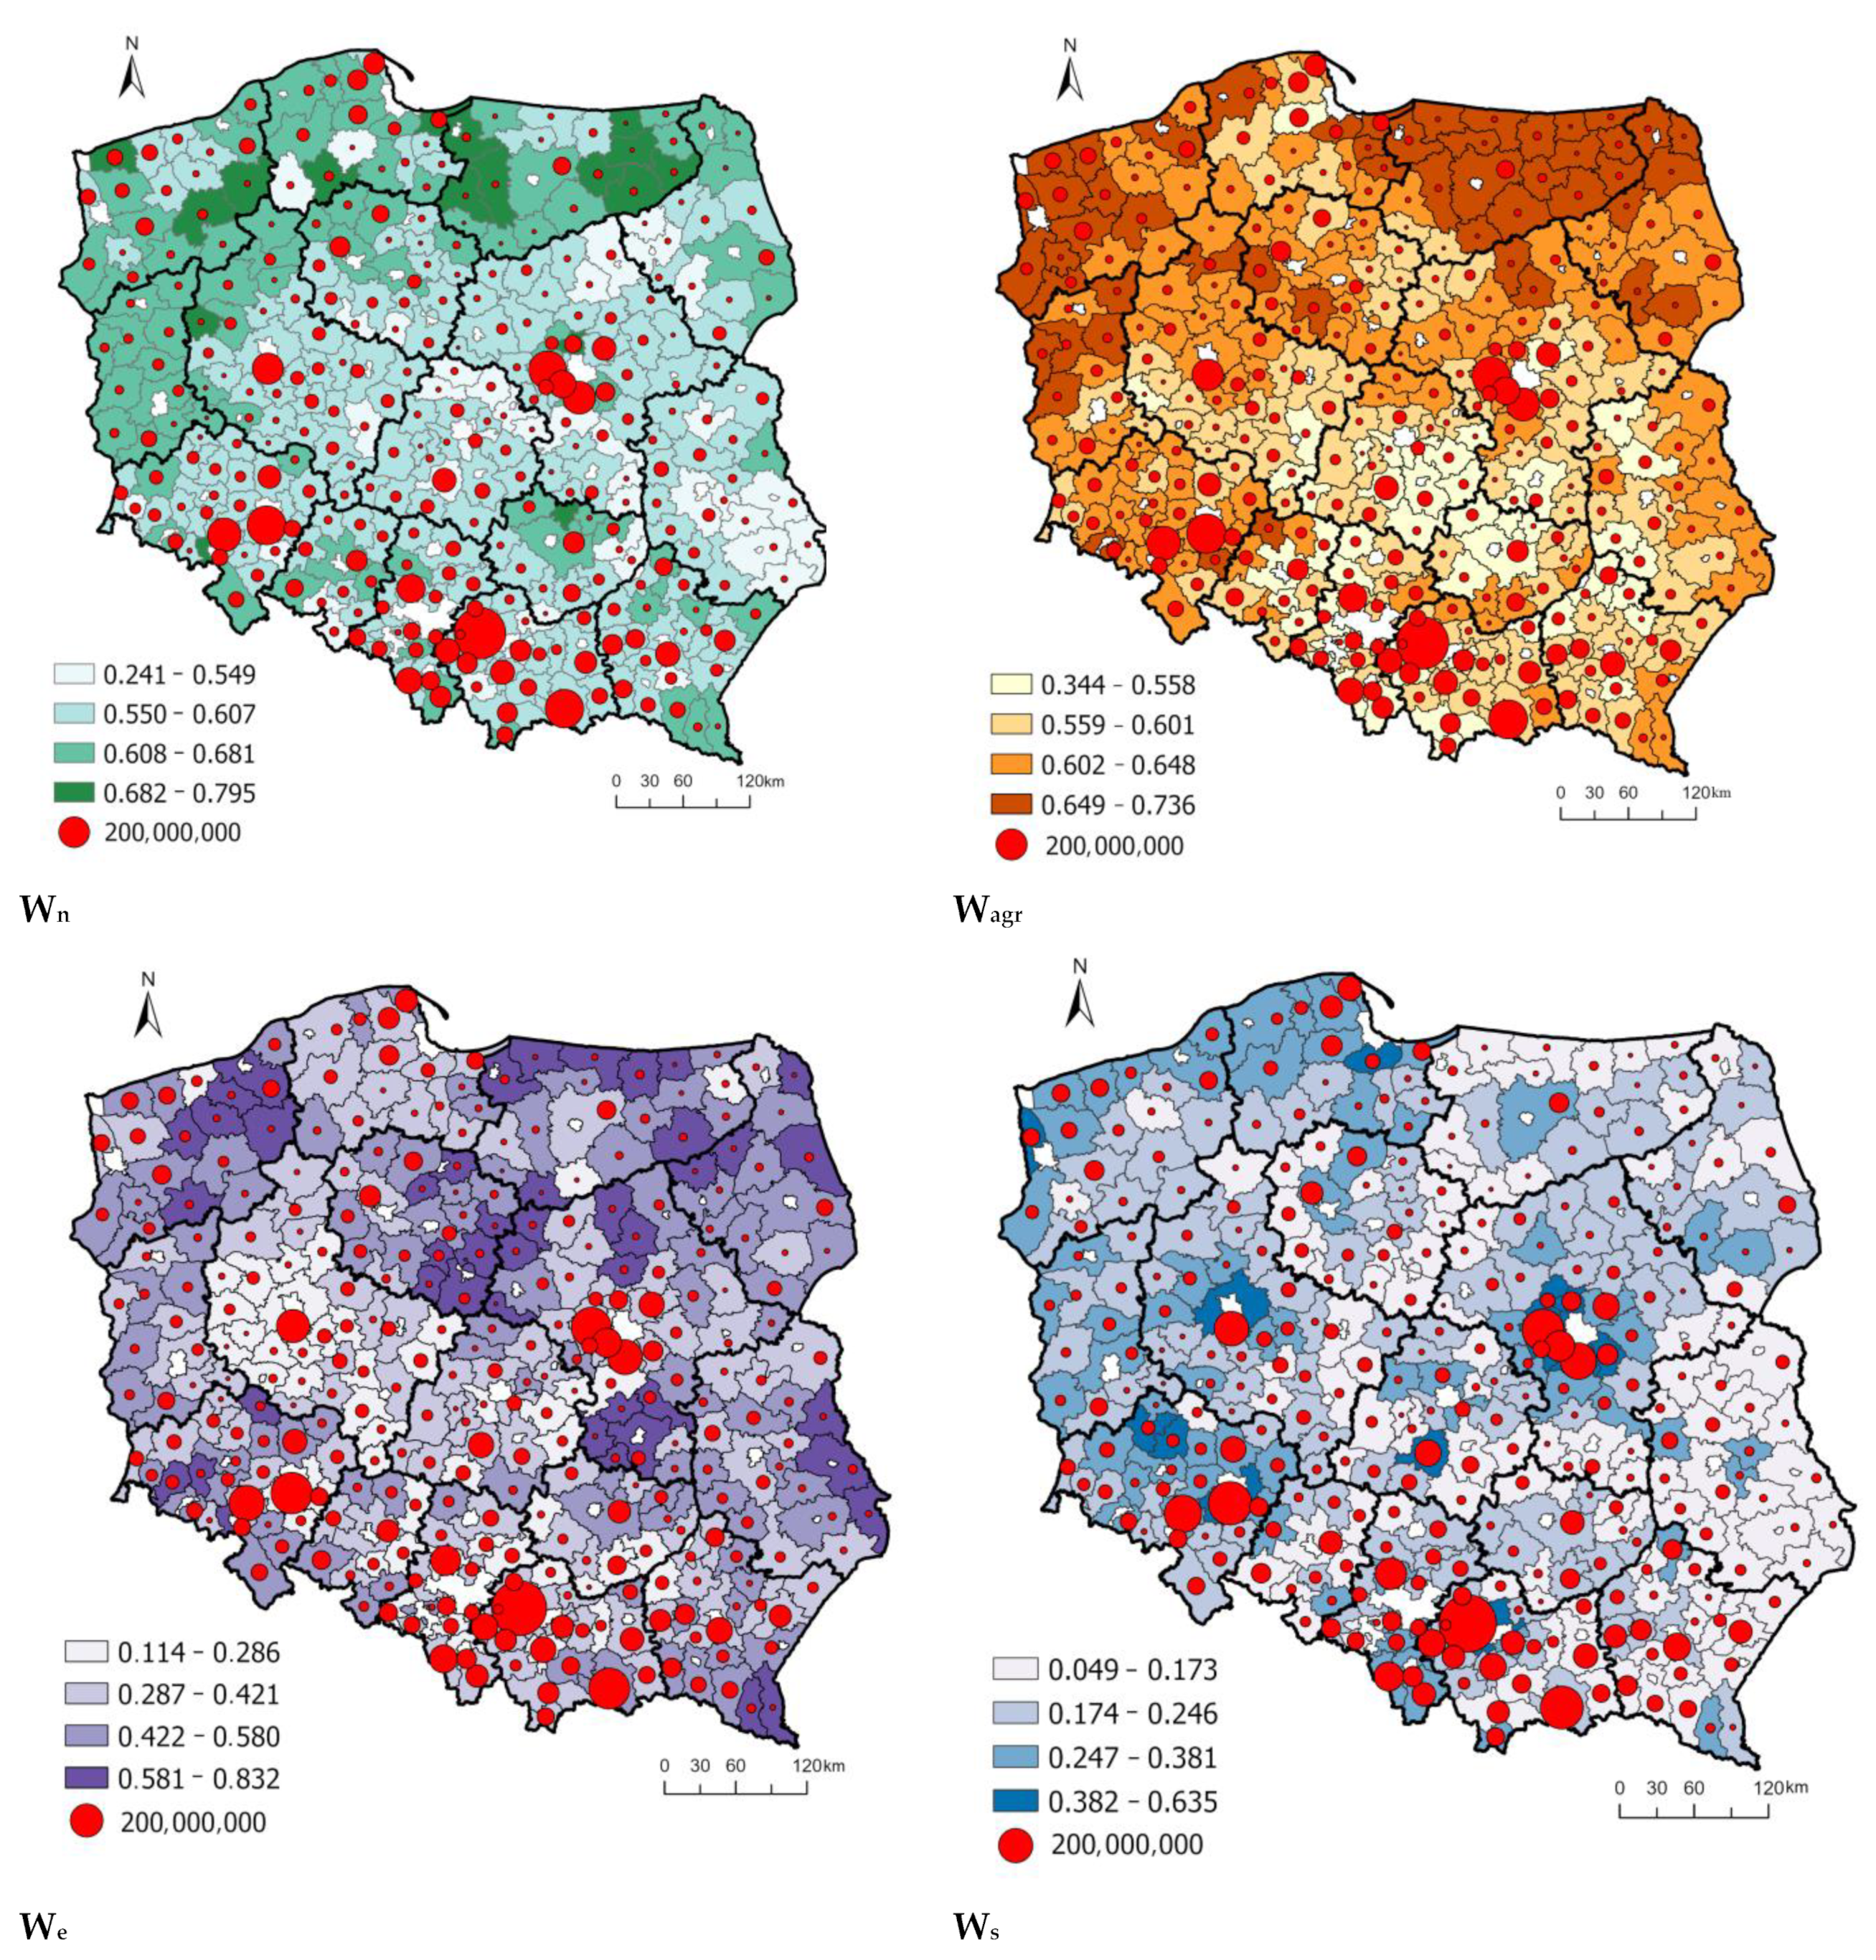
4.1. Environmental Dimension of the Quality of Life (Wn)

One of the key goals of GE policies is to enhance environmental conditions that directly influence human health and well-being [52]. Access to green recreational areas, the availability of clean drinking water, and the absence of surface water pollution are critical considerations in the environmental dimension. Forest cover (x7), a component of indicator Wn, varied considerably across regions, from 51% in Lubusz Voivodeship and 41% in Podkarpacie Voivodeship to 22% in Łódź Voivodeship, with a national average of 31%. The spatial distribution of Wn clearly indicates that the value of this indicator is higher in areas that are abundant in lakes and have a high nature value (Figure 3). Indicator Wn was highest in North-Western Poland that abounds in forests and water bodies, and in the mountainous regions of Southern Poland. Indicator Wn was lowest in industrial regions (energy generation, paper industry, chemical industry) characterized by high pollutant emissions from industrial sources (in t/y/km2) (x4) and high-water pollution (BOD5) (x7), i.e., in the Voivodeships of Silesia and Świętokrzyskie. It should also be noted that pollutant emissions were highest in regions with the highest population density (Upper Silesia, Urban Agglomeration of Kraków), which further exacerbates the problem. Access to safe drinking water (x5) and the public sewage system (x6) are also important considerations in this category. More than 80% of Polish households have access to a public water supply, ranging from 80.9% in Podkarpacie Voivodeship to 96.8% in Opole Voivodeship. Considerable spatial variations in these parameters can be attributed to the shortage of funds for the construction of water supplies and sewage infrastructure in the past [32] as well as highly dispersed settlements in rural areas [53]. In submontane (Małopolska and Podkarpacie Voivodeships) and montane regions, difficult terrain conditions and dispersed settlements additionally obstruct the construction of water supplies and sewage systems. As a result, local communities in these regions do not have equal access to utility networks [54]. In many areas, the development of water supplies and sewage systems is not feasible for financial reasons [55]. However, the average value of indicator Wn for all of Poland (0.594) is satisfactory.

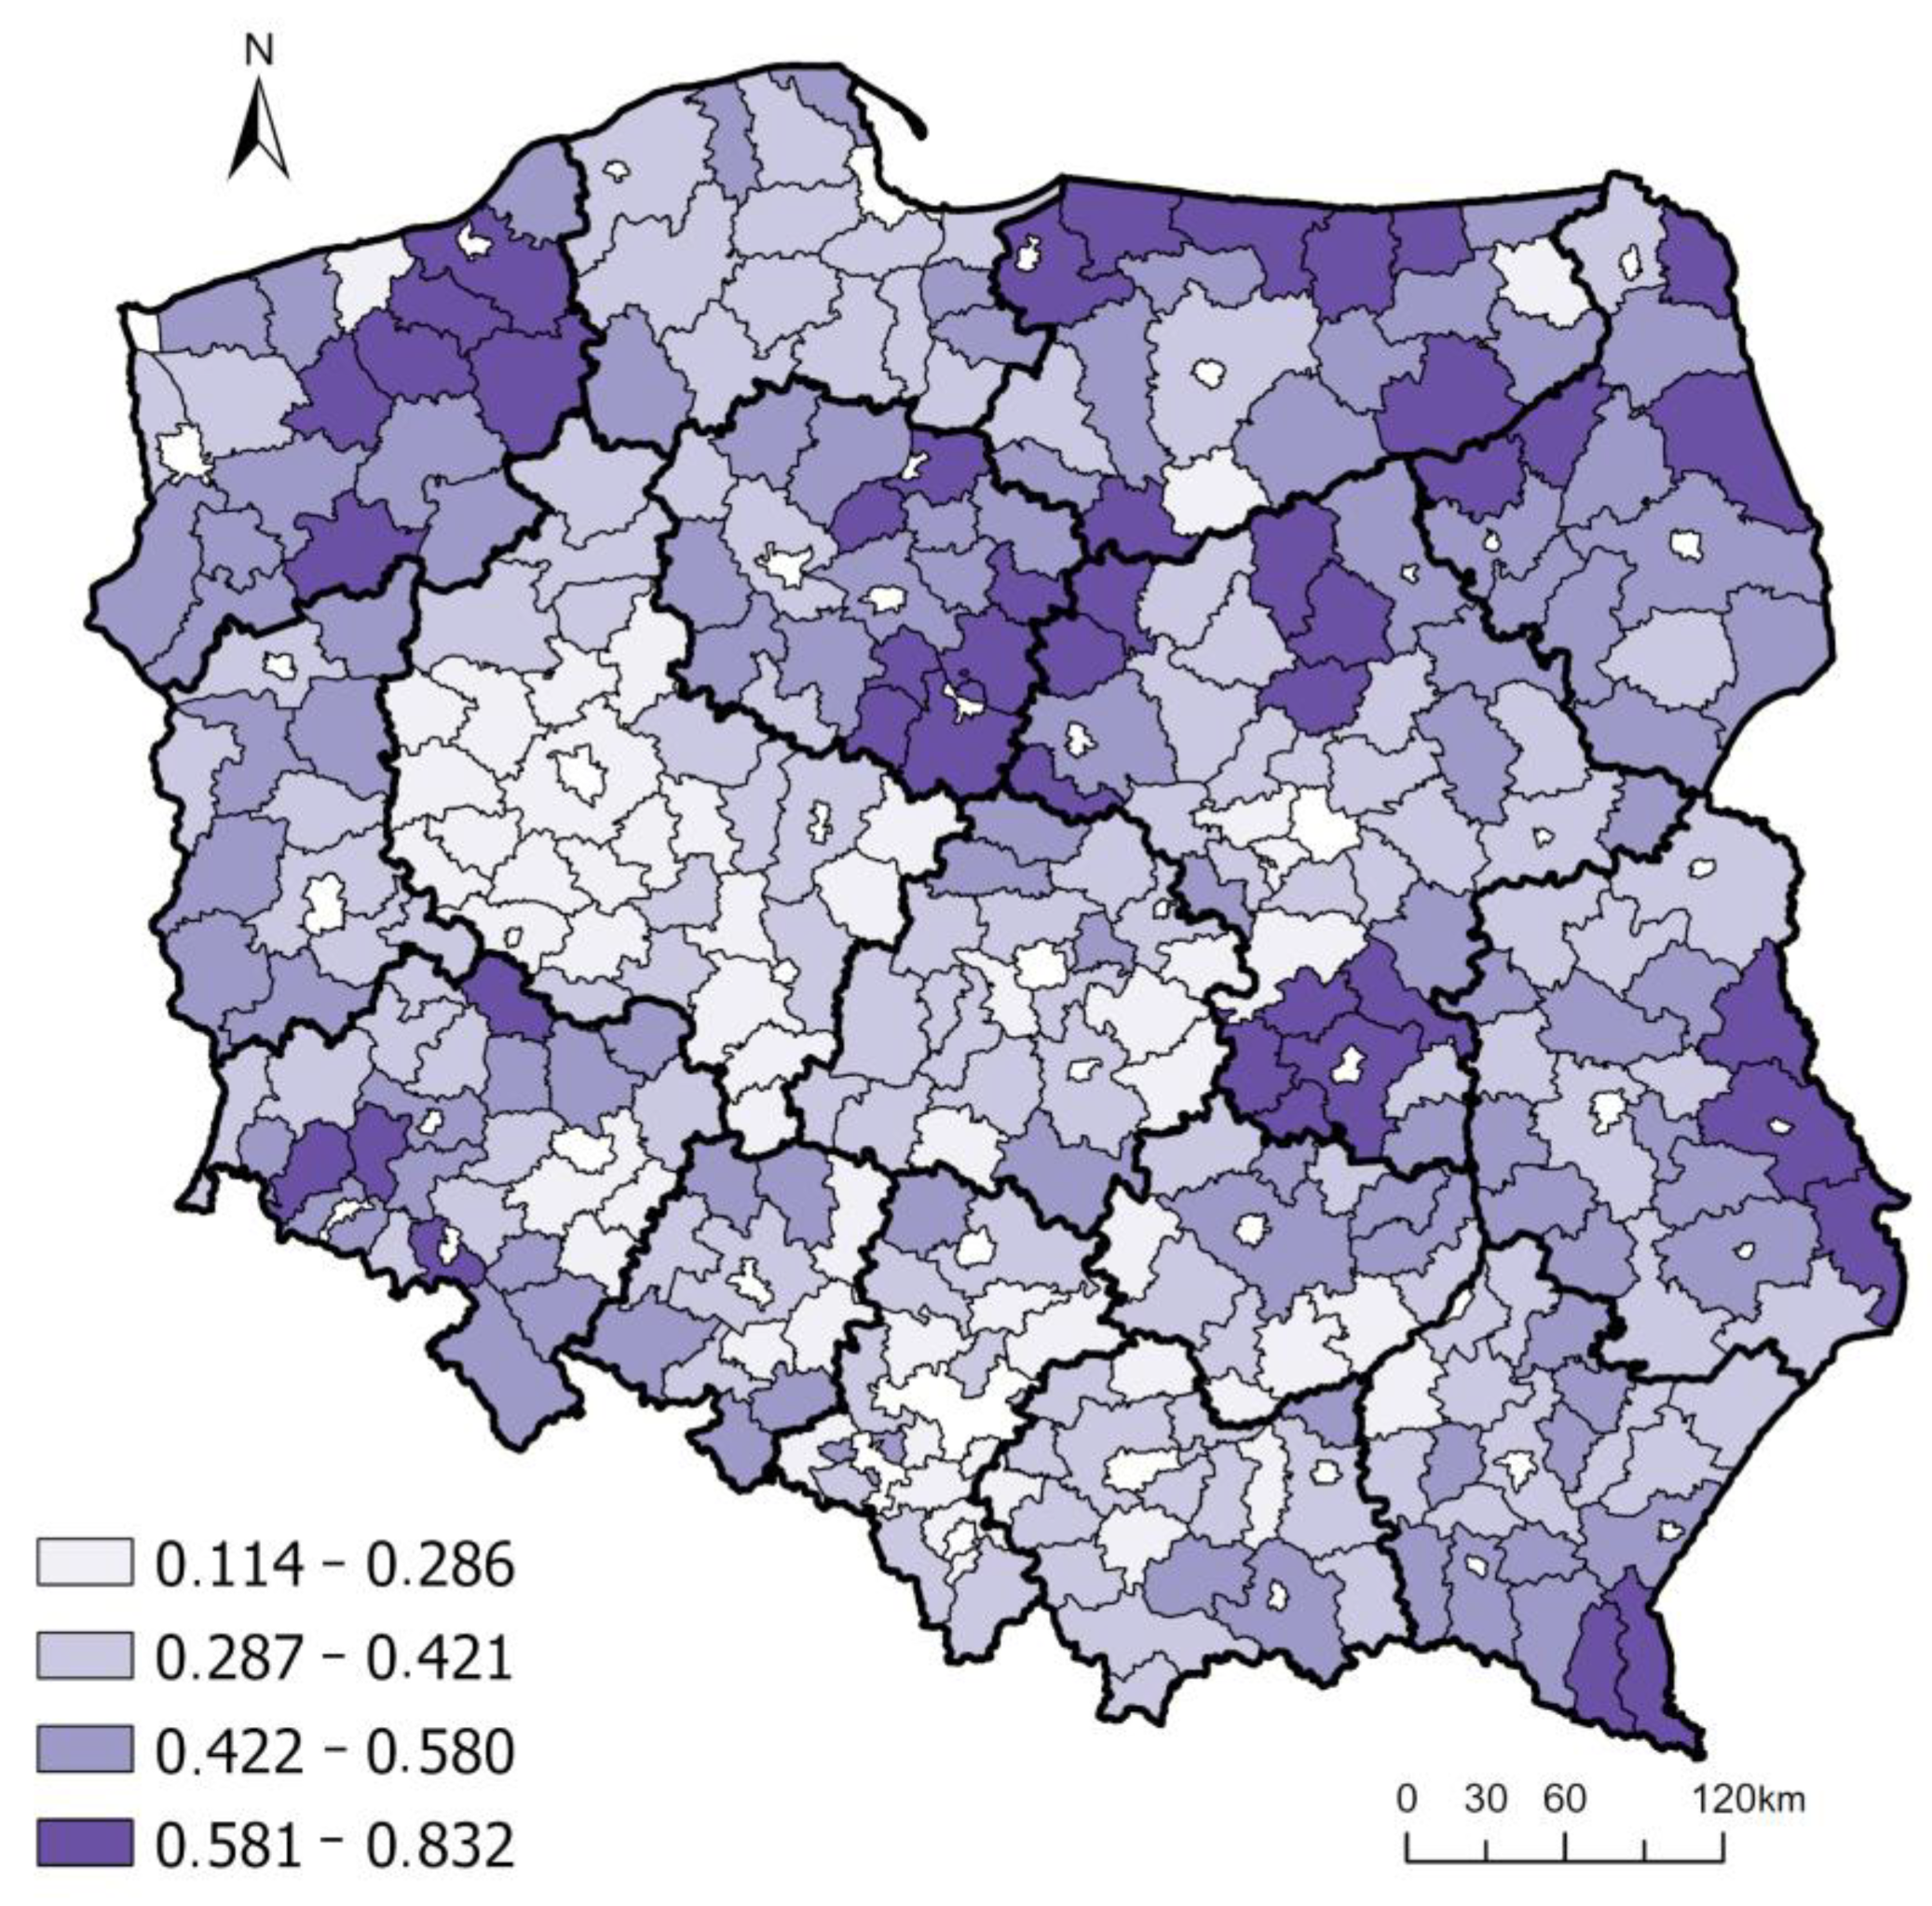
4.2. Agriculture (Wagr)

Agricultural factors that determine the performance of the farming sector are very important indicators of GE development. In this study, agricultural factors were selected in view of the classification proposed by Rudnicki [5,56], and the natural value of land (x12), farm ownership and management (x4, x11), farm organization, structure, and production technology (x10) were regarded as important spatial indicators of agricultural production. The age and education of farm managers (x9) influence agricultural production and farms’ ability to apply for CAP payments. The spatial distribution of indicator x9 suggests that large-area farms in Northern Poland have the highest number of managers with university education (Western Pomerania, Kuyavia-Pomerania, and Warmia and Mazury Voivodeships), whereas university-educated managers are least prevalent in South-Eastern Poland. The implementation of GE principles was also assessed based on the area under non-cereal crops in total cropped area (x10), which indicates the extent to which monoculture is replaced by other types of production with higher levels of biodiversity. This parameter was highest in rural areas with small farms and in farms with a large share of grasslands (pastures, meadows). The share of farmland with high nature value (x12) was highest in rural areas situated on the territory of national parks. An analysis of the spatial distribution of all constituent elements of indicator Wagr revealed three regions that had made the greatest progress towards green transition. The first region stretches from Western to Eastern Poland and covers selected counties in the Voivodeships of Lubusz, Kuyavia-Pomerania, and Pomerania. The second region covers the entire region of Warmia and Mazury and parts of Podlasie Voivodeship. The third region consists of individual counties in the Voivodeships of Mazovia, Świętokrzyskie, Lower Silesia, and Podkarpacie (Figure 4). The indicator Wagr ranged from 0.344 (min) to 0.736 (max), and it was regarded as unsatisfactory. The performance of agricultural producers is considerably influenced by the availability of CAP payments. According to Rudnicki [5,57], only 18.7% of the allocated funds were used to improve farming production, mostly to purchase agricultural equipment and machines (53.5%). These results indicate that the way in which EU funds are spent by Polish farmers does not contribute to the achievement of GE objectives, and it prevents Polish agricultural producers from catching up with Western Europe (former EU—15 countries). This is a highly worrying phenomenon because it prevents an increase in the number of Polish farms able to compete effectively on the international market [58,59].

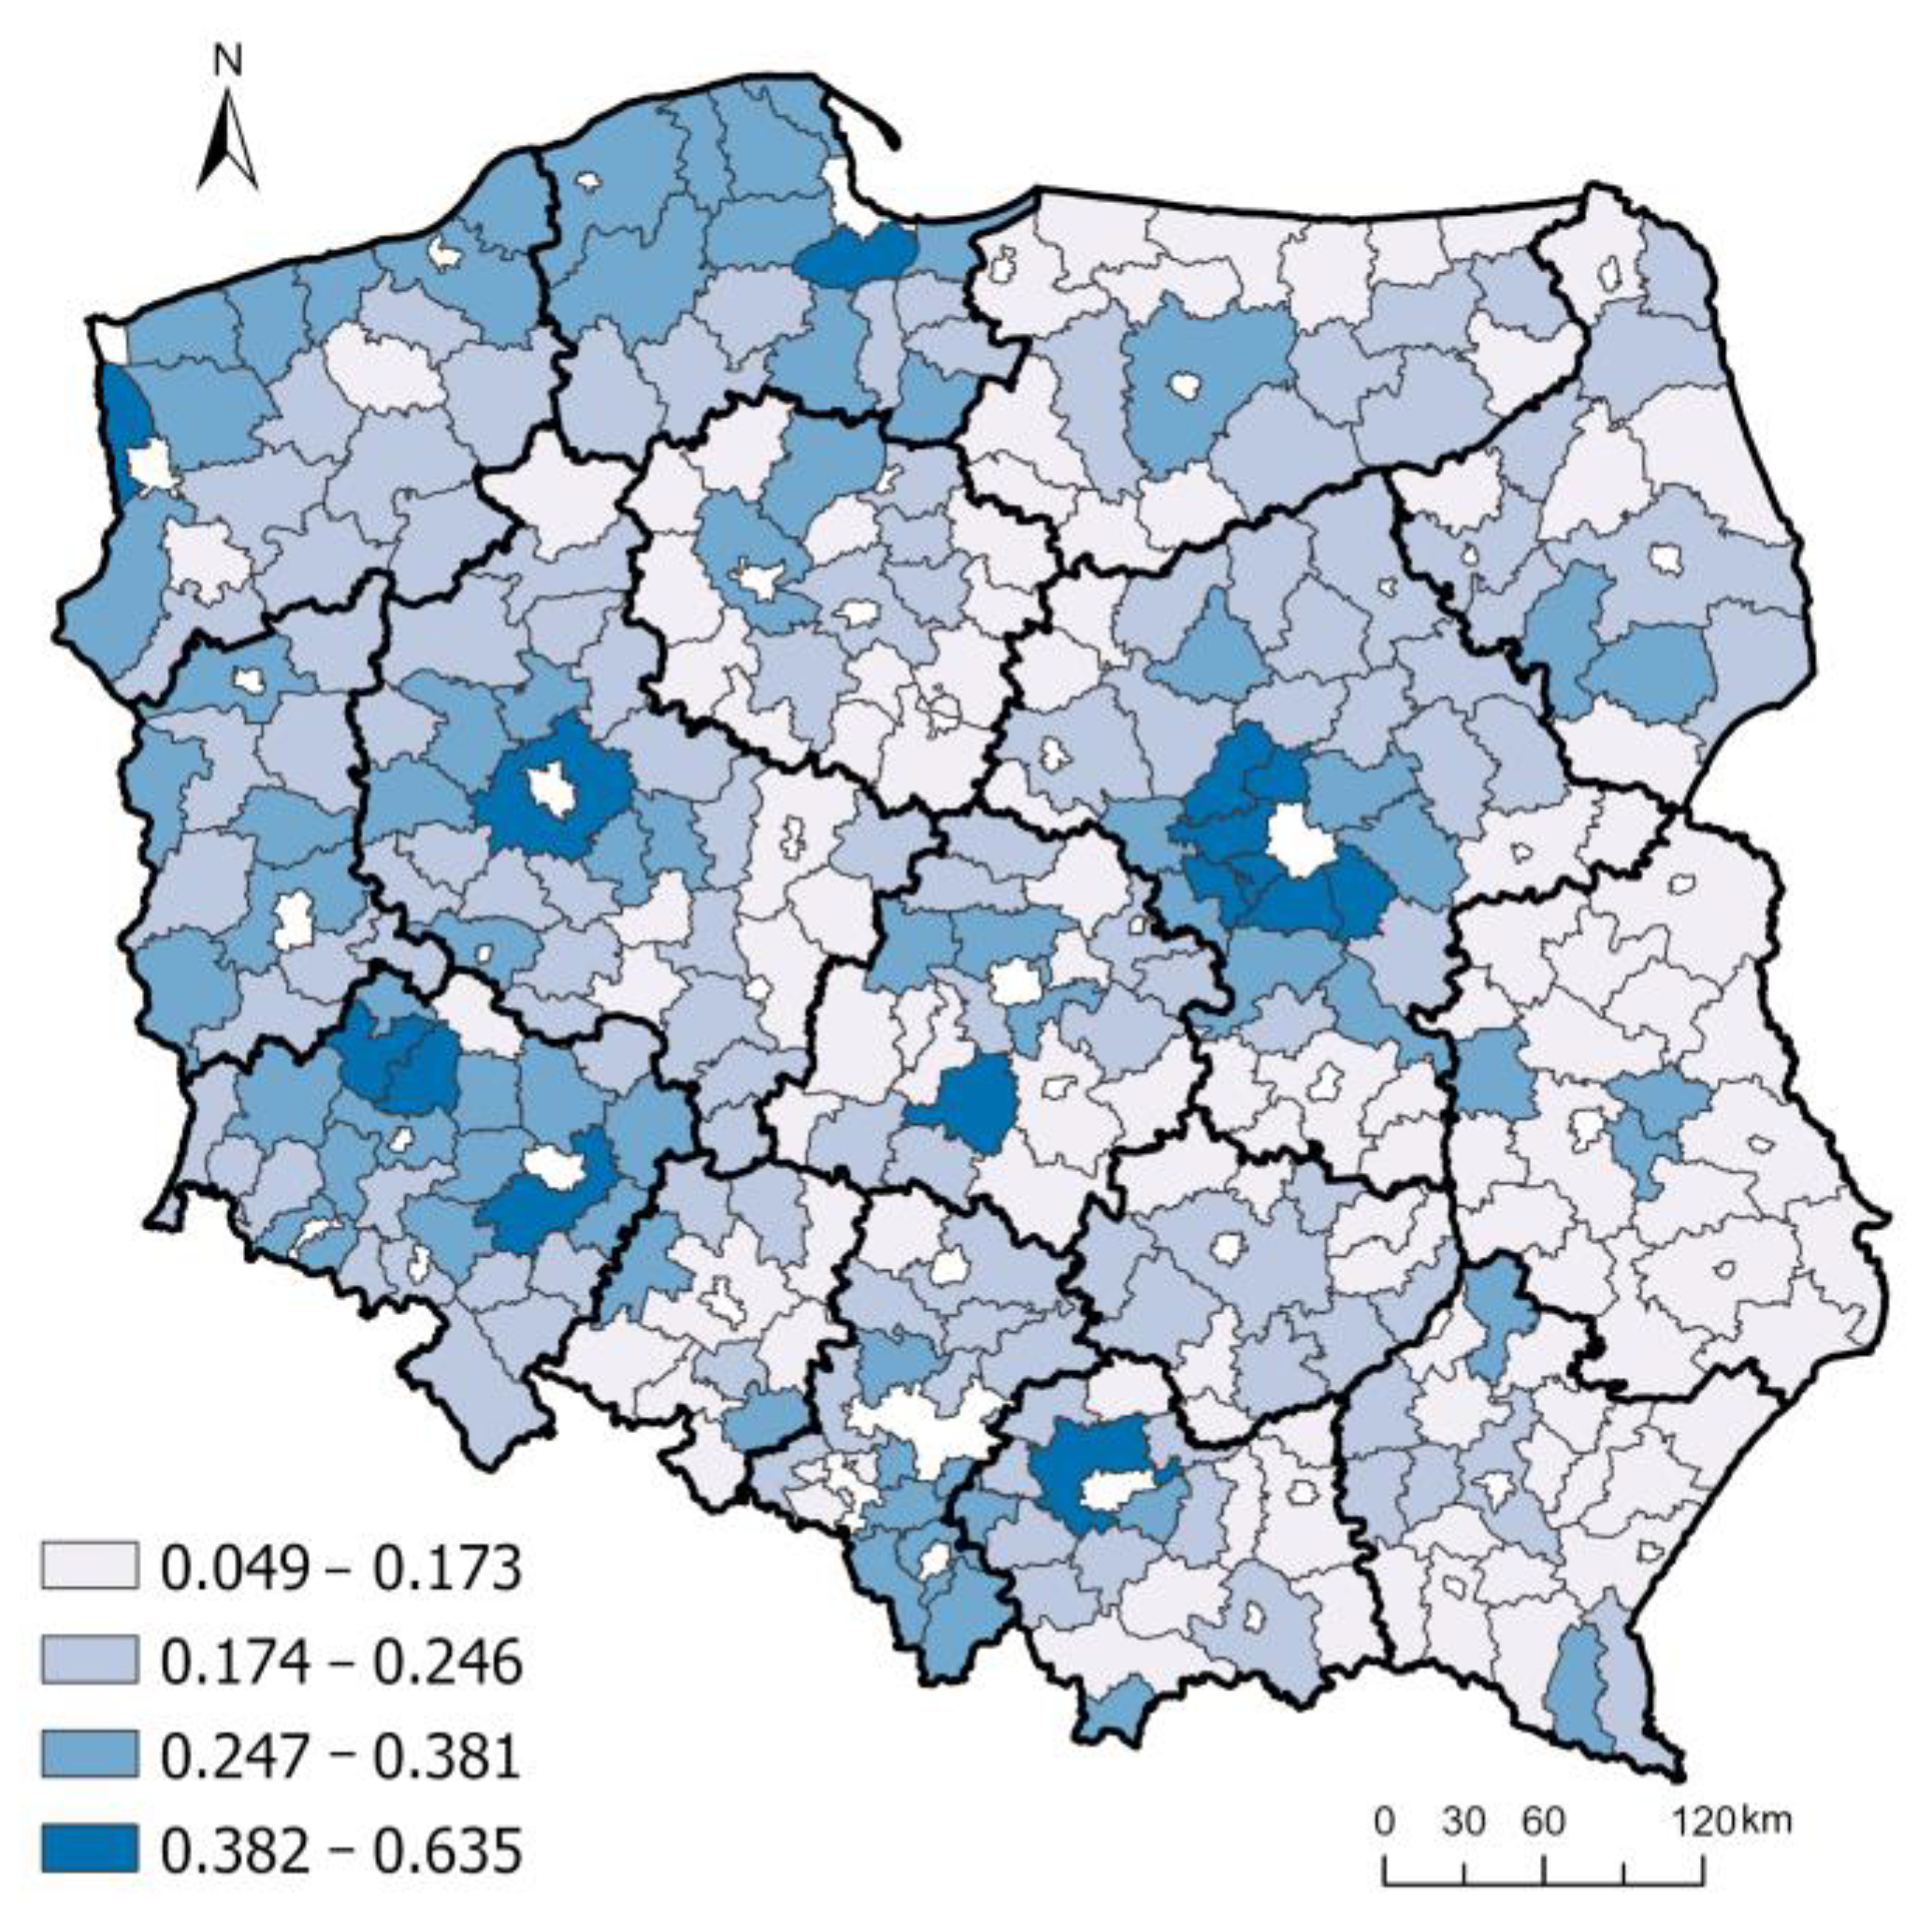
4.3. Economic Dimension of the Quality of Life (We)

The implementation of GE principles was also assessed based on the economic dimension of the quality of life. The value of this indicator (We) ranged from 0.049 to 0.635. The spatial distribution of the values of indicator We points to the polarization of economic growth across regions. Differences were observed between the urban core and peripheral areas (the value of We was highest in the largest cities, including Warsaw, Kraków, Gdańsk, Poznań, Wrocław, and Szczecin, and it decreased with distance from their respective suburban zones) and between Eastern and Western Poland (the value of We decreased gradually from the west to the east) (Figure 5). The only exception were coastal areas that are popular tourist destinations and where the value of We was moderately high. The average gross monthly income and the number of dependents per 10,000 working-age population also affected the value of We. It should be noted that per capita, income is correlated with many indicators of environmental degradation [60]. According to Teixidó-Figueras et al. [61], energy consumption and waste generation are income-related parameters that exert the greatest impact on the environment. A higher production and higher incomes do not always improve the quality of life because high levels of economic activity can adversely affect the natural environment and the well-being of local communities. For this reason, the priority goal of GE policies should be to minimize economic pressures on the environment by decreasing resource use, waste generation, and emissions of solid, liquid, and gaseous pollutants [62].

4.4. Social Dimension of the Quality of Life (Ws)

The social dimension of the quality of life (Ws) was analyzed in the process of evaluating the implementation of GE principles. An analysis of the spatial distribution of indicator Ws revealed considerable spatial variation across Polish regions (Figure 6). The value of Ws ranged from 0.114 to 0.823, and significant differences were observed between highly industrialized regions and regions with a predominance of large agricultural estates that had been established on the premises of the former State-owned farms. In the first years of political and economic transformations in Poland, effective political and organizational measures had not been implemented to protect the employees of collective farms who were deprived of income and social support [63]. These processes contributed to social inequality, in particular in Western Pomerania and Warmia and Mazury, as well as in south-eastern regions, where agricultural land had remained highly fragmented since the partitions of Poland [64].
An analysis of the spatial distribution of indicators Wn, Wagr, We, Ws at the LAU level (counties) revealed certain regularities (Table 4). In class IV, considerable differences were observed between the number of counties with high values of Wagr (16.60%) and We (4.80%), which suggests that high agricultural performance did not improve the quality of life in the economic dimension. In classes IV and III, a total of 50.8% of counties were characterized by high values of Wagr, which could imply that GE principles had been effectively applied in agricultural practice. In class I, a high percentage of counties with low values of We indicates that effective measures should be implemented in these areas to improve the economic dimension of the quality of life.

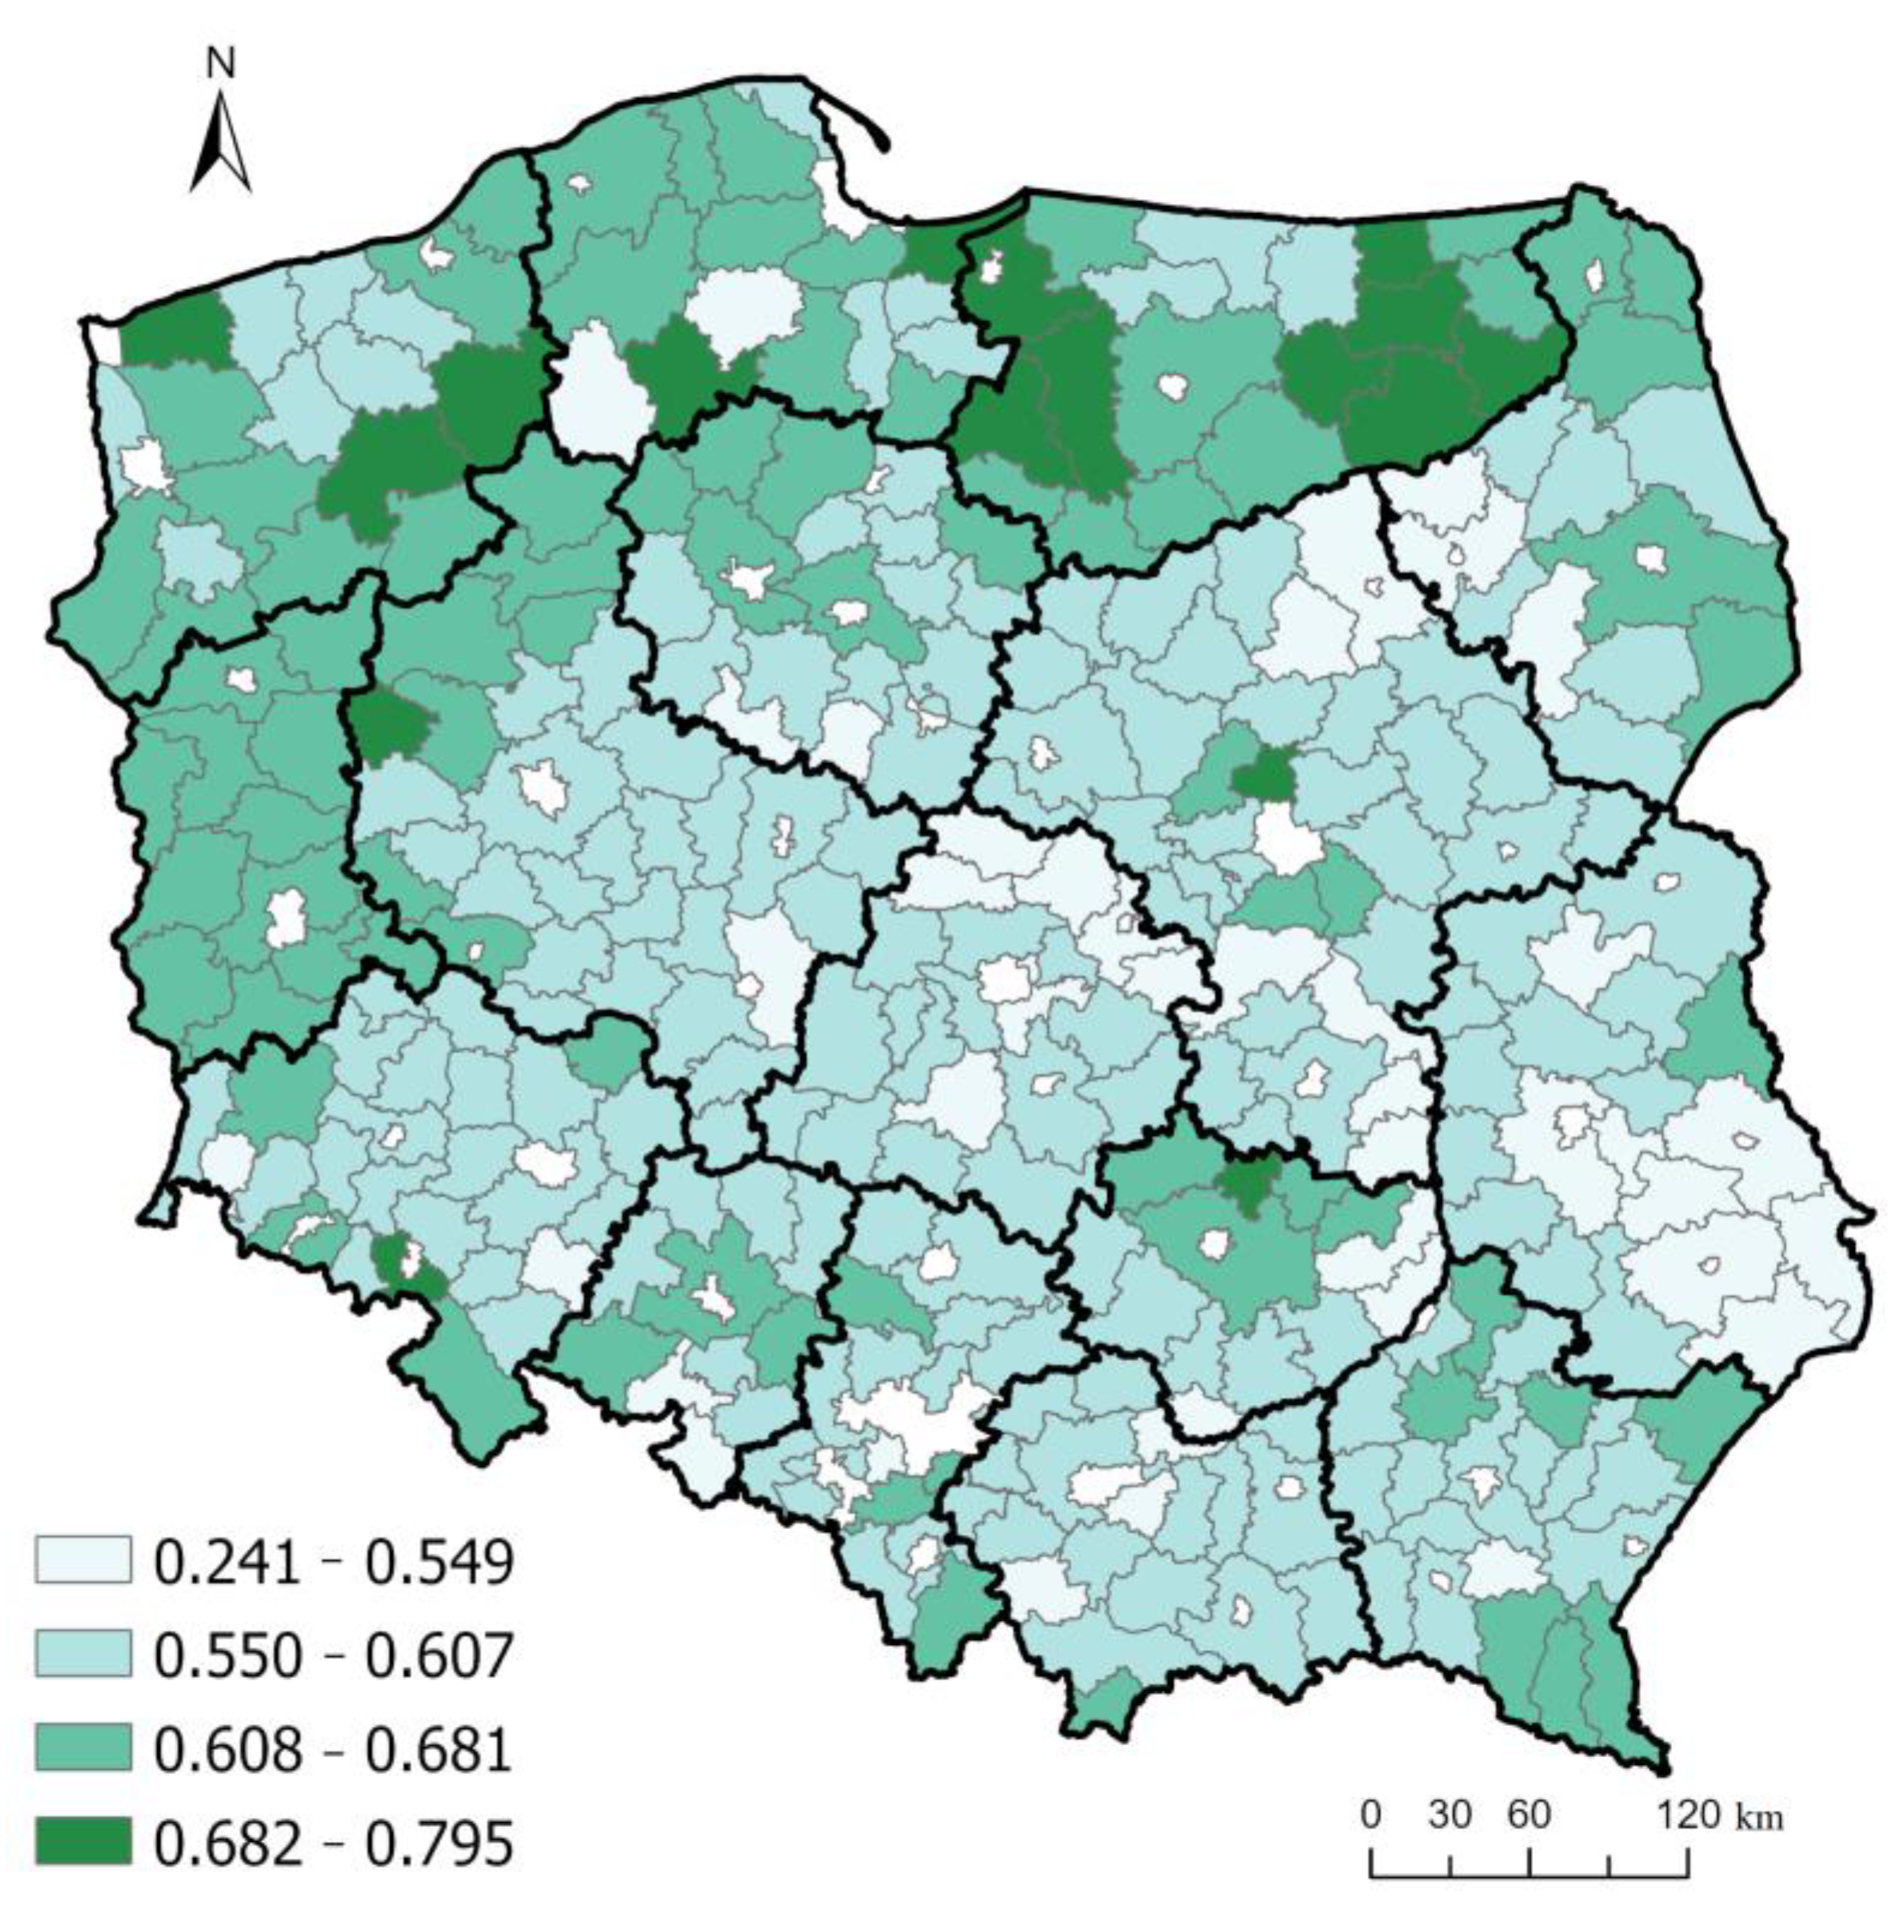
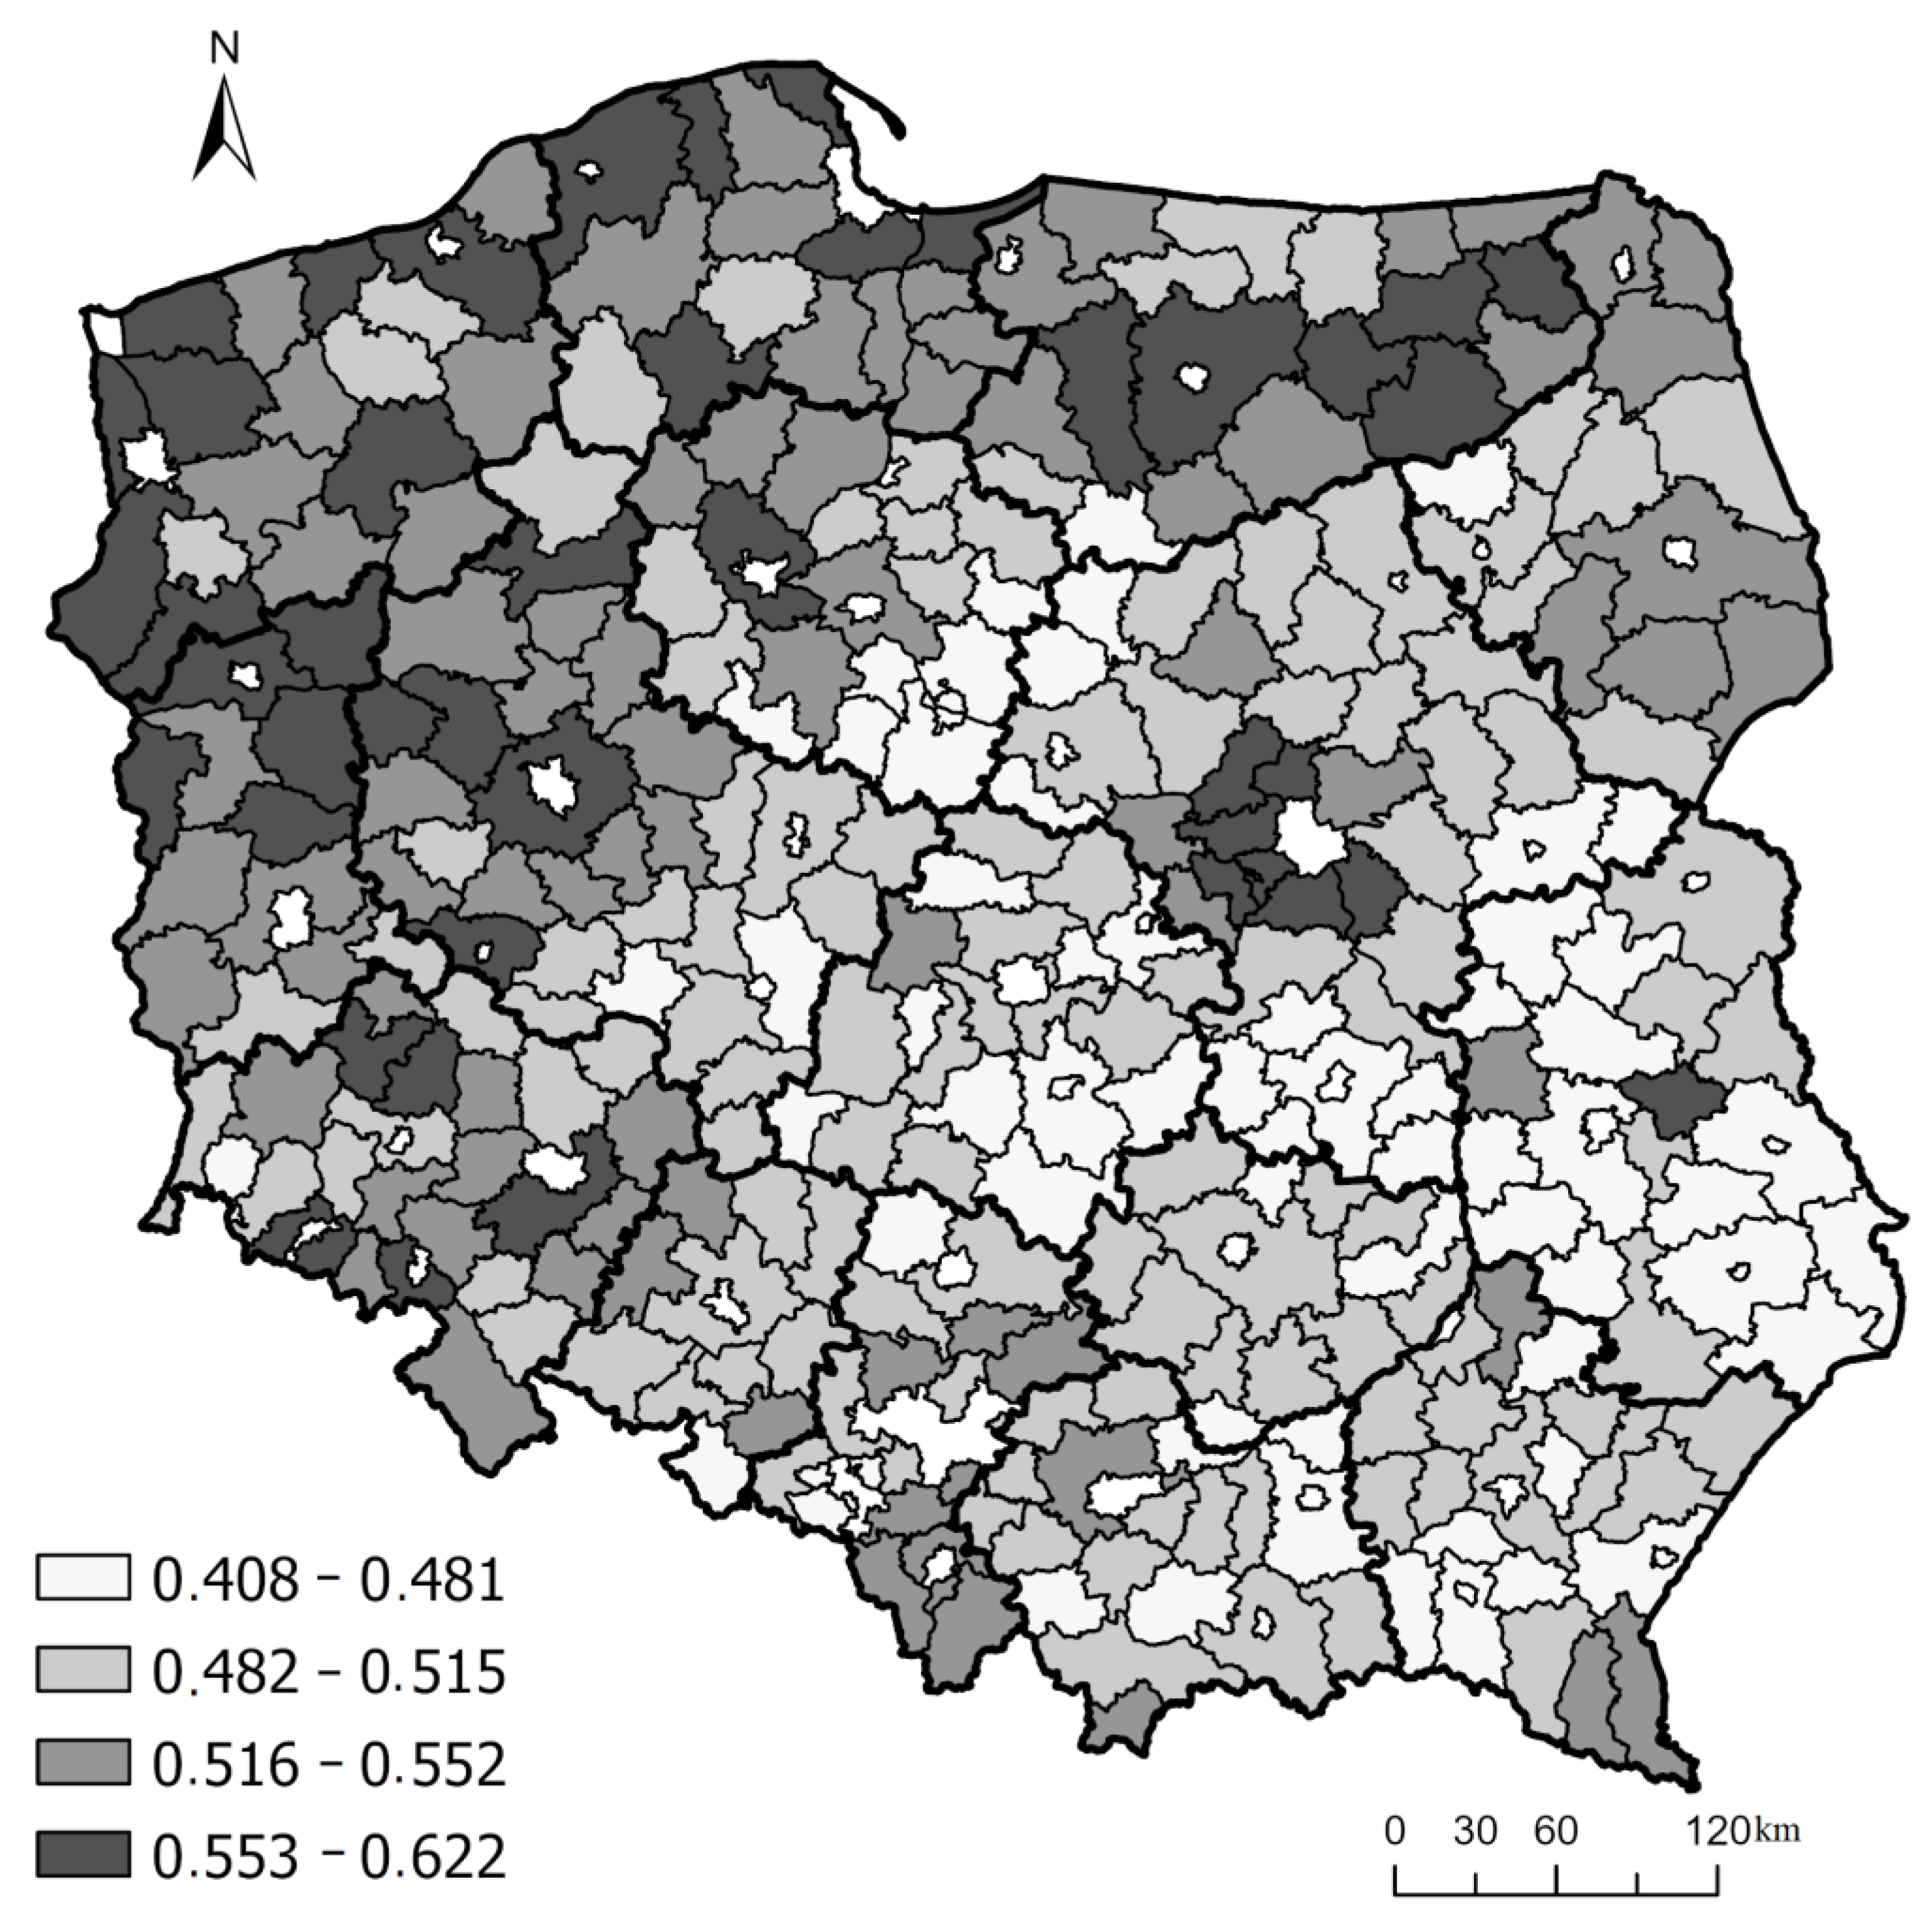
4.5. Evaluation of Progress in the Implementation of GE Principles

The progress in the implementation of GE principles was evaluated with the use of the composite GE index Wge. Based on the calculated values of Wge (0.448–0.668), the analyzed counties were divided into four GE development classes (Table 5). The analysis revealed that 41.1% of LAUs (classes III and IV) made above-average progress in the implementation of GE principles, whereas below-average progress was noted in 58.9% of the studied counties (classes I and II).
A spatial analysis of the composite GE index Wge revealed considerable differences between regions (Figure 7). Significant progress in GE transition had been made in the Voivodeships of Lubusz, Western Pomerania, Warmia and Mazury, selected parts of Lower Silesia, and in the Warsaw suburban zone. In these areas, Wge ranged from 0.553 to 0.622. Green economy principles were least effectively implemented in the Voivodeships of Świętokrzyskie, Lublin, Łódź, and in parts of Kuyavia-Pomerania, where the value of Wge was determined in the range of 0.408 to 0.481. The spatial analysis also demonstrated that successful GE implementation was most closely linked with the environmental dimension of quality of life and the development of agriculture (cf. Figure 3, Figure 4 and Figure 7).
In the next stage of the study, the relationships between GE and indicators Wn, Wagr, We, and Ws were analyzed with the use of a linear regression model [32,65,66]. The relationships between independent variable Wge and dependent variables Wn, Wagr, We, and Ws were presented in two-dimensional scatter plots in Figure 8. In each scatter plot, points denote individual LAUs. The model’s goodness of fit was determined based on the calculated value of r2. Each diagram contains one or several outliers. However, based on the scatter plots in Figure 8, the model can be interpreted as follows:
-
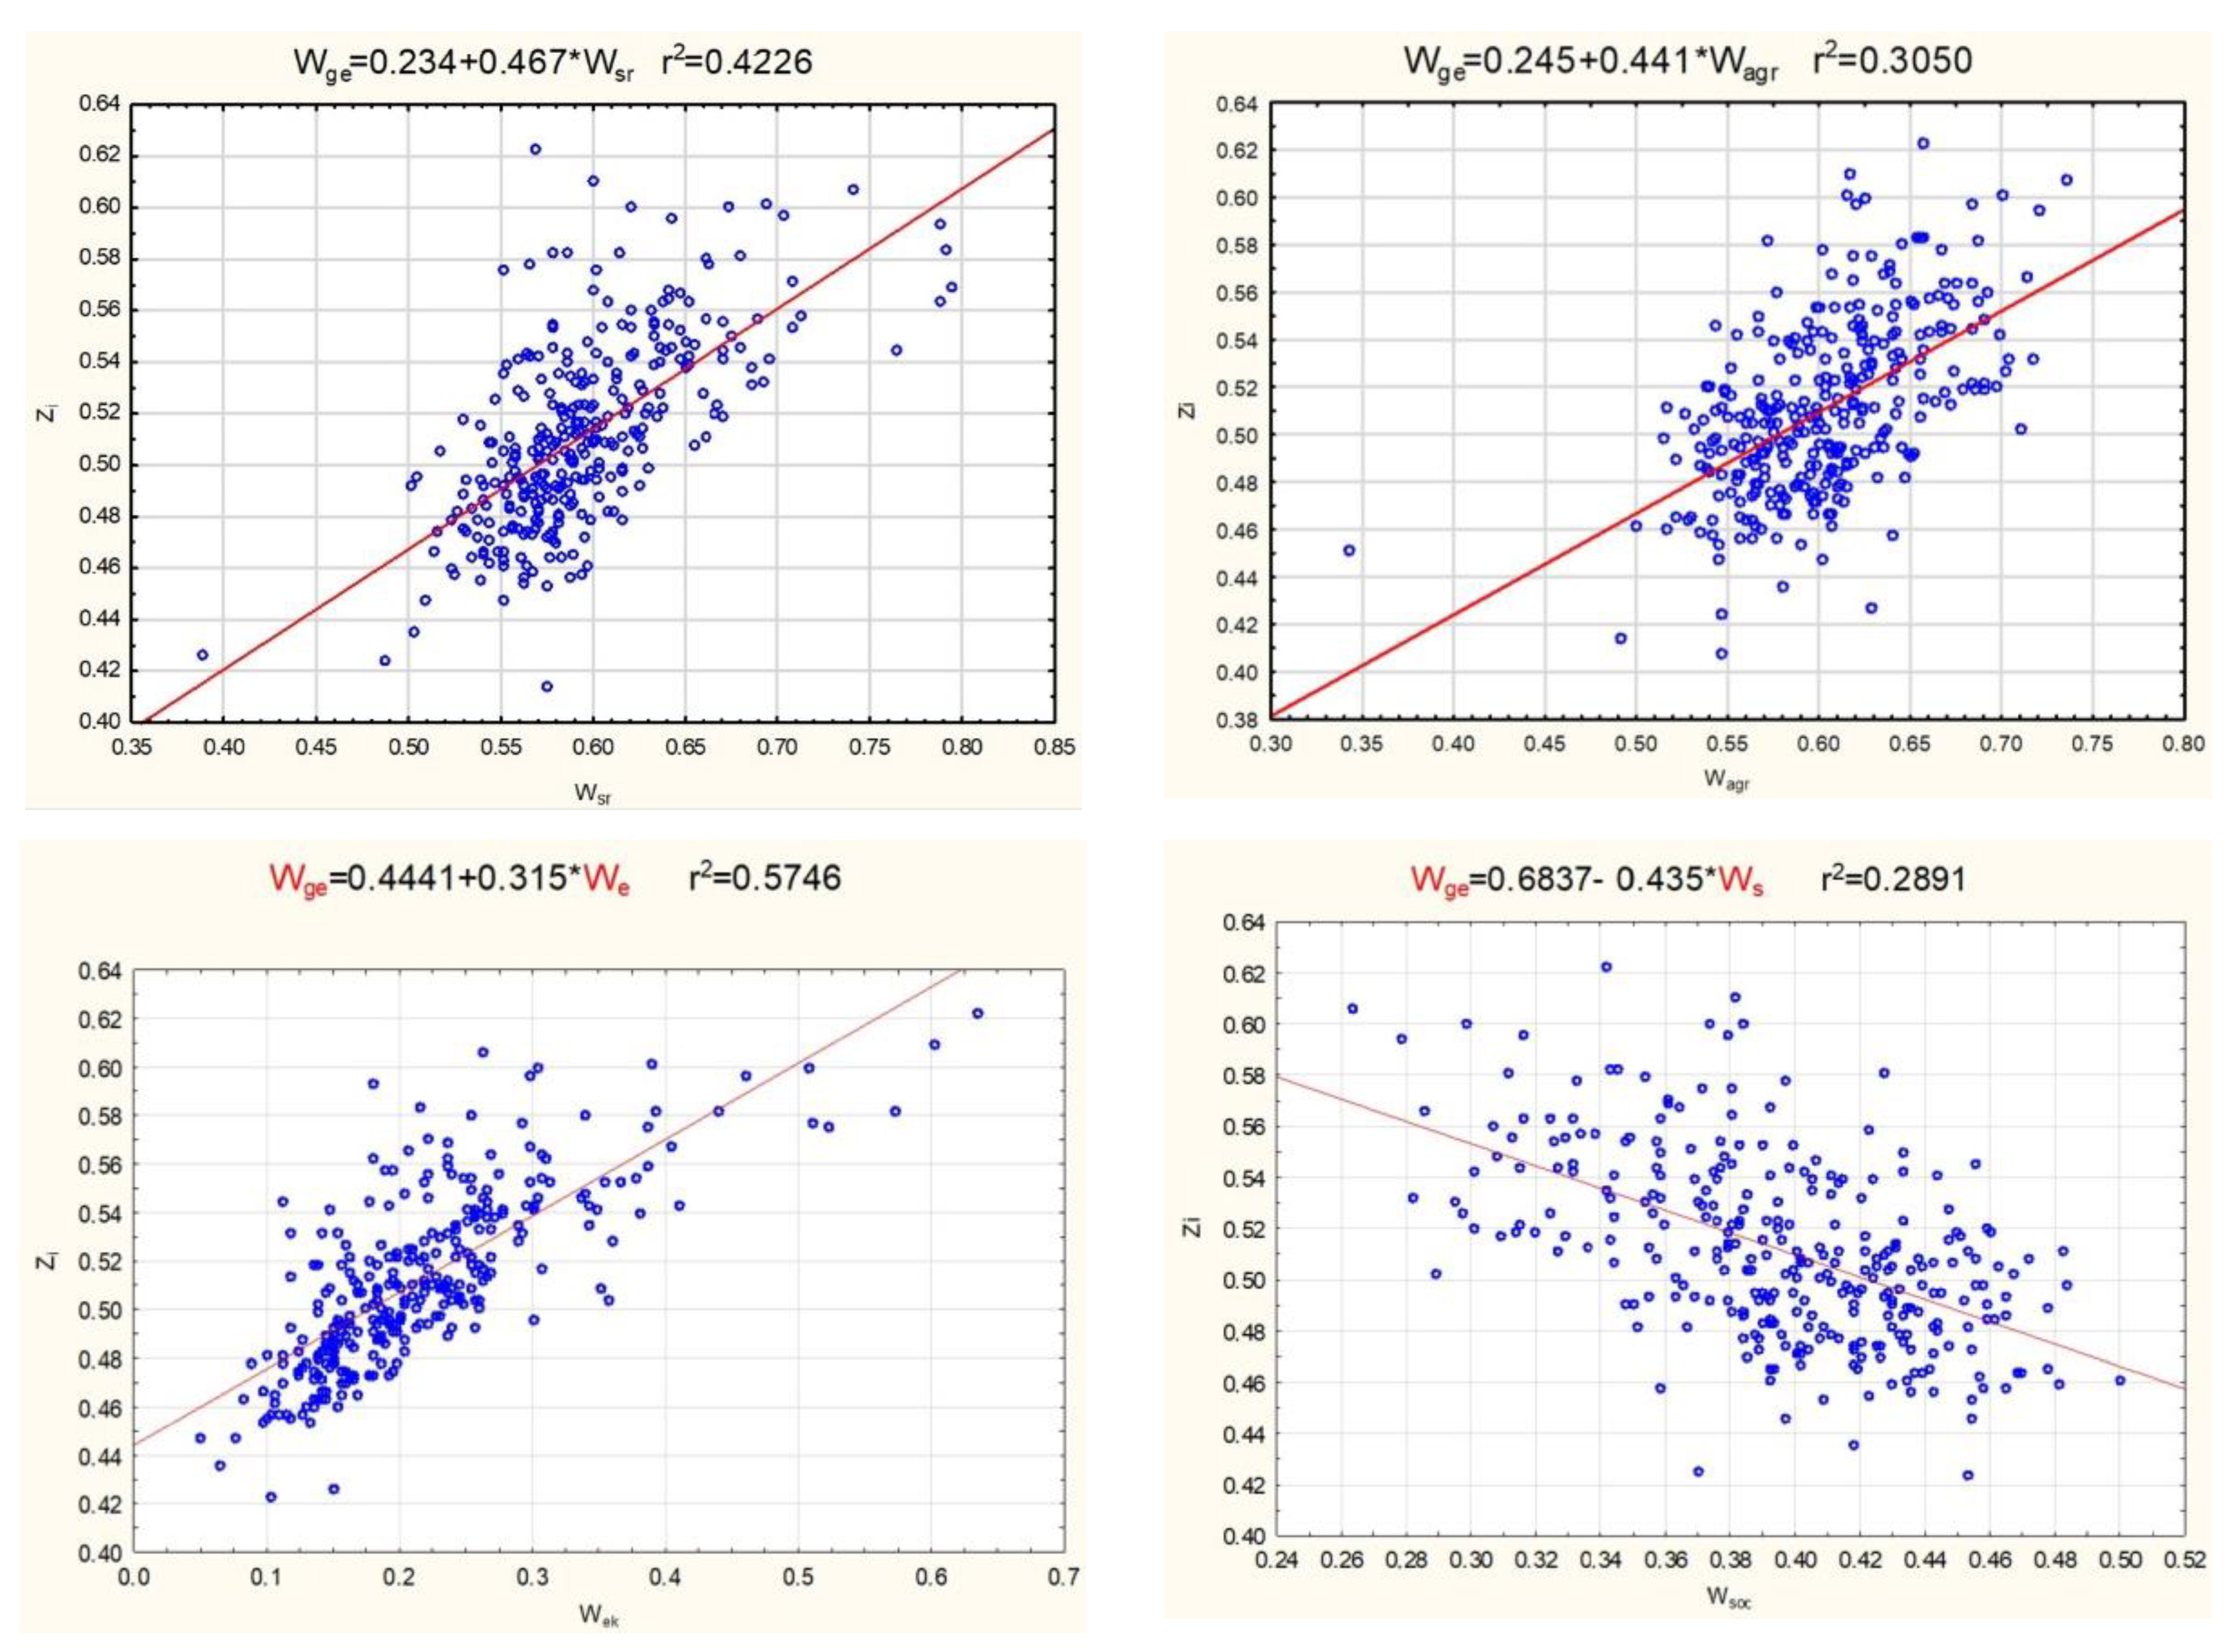
if the value of variable Wn increases by one unit, the value of the composite GE index Wge will increase by 0.467,
-
if the value of variable Wagr increases by one unit, the value of the composite GE index Wge will increase by 0.441,
-
if the value of variable We increases by one unit, the value of the composite GE index Wge will increase by 0.315,
-
if the value of variable Ws increases by one unit, the value of the composite GE index Wge will decrease by 0.435.
The results of the analysis have important implications for planning GE implementation strategies and selecting the optimal instruments. The analysis demonstrated that financial instruments relating to the environmental dimension of the quality of life and the development of agriculture will make the greatest contribution to GE.
Figure 8. Relationship between the development of green economy (Wge) and the environmental dimension of the quality of life (Wn), development of agriculture (Wagr), economic dimension of the quality of life (We) and social dimension of the quality of life (Ws). Source: own elaboration.
Energies 15 03332 g008

4.6. Relationship between the Implementation of Green Economy Principles in Rural Areas and Agri-Environment-Climate Measures

Green growth is a comprehensive program that promotes structural changes in the economy by relying on environmentally friendly solutions. Poland’s accession to the EU in 2004 created numerous opportunities for GE development, including in the environmental, social, and economic dimensions. The schemes and financial instruments offered under the CAP not only contributed to rural development [67], but also induced positive changes in the environmental [68] and economic dimensions of the quality of life [69]. Agricultural producers became eligible to various financial support programs under the CAP. Agri-environmental-climate measures play a particularly important role in GE development in the agricultural sector [70].
The relationship between GE implementation and the utilization of pro-environmental payments from the CAP was evaluated with the use of two indicators: total spending on environmental protection in Polish municipalities in 2015–2018 (Wpro) and local (municipal) spending on environmental protection per hectare in 2015–2018 (Wproha).
The analysis revealed that agri-environmental-climate measures (spending per ha) were most strongly correlated with the economic dimension of the quality of life. This result could indicate that the implementation of GE principles proceeds much faster in urbanized regions where higher incomes drive the transition to GE (Table 6). According to a study on clean energy transition [71], high-income households are more likely to rely on renewable and low-carbon energy sources such as natural gas, heat pumps, and photovoltaic panels. At the same time, some regions are affected by energy poverty, where costly projects aiming to minimize air pollution and protect the climate cannot be implemented due to low household incomes and insufficient capacity of local budgets.
An analysis of the spatial distribution of agri-environmental-climate measures financed under the CAP in 2015–2018 (per hectare) clearly indicates that pro-environmental spending was highest in the suburban areas of Warsaw, Gdańsk, Poznań, Wrocław, Kraków, and Katowice. This result could imply that local authorities in LAUs in the vicinity of large urban agglomerations are more involved in applying for EU funds than peripheral municipalities. The fact that rural areas with the lowest values of indicator Wge made the smallest use of the available EU eco-schemes is also worrying (Figure 9).
An analysis of the spatial distribution of agri-environmental-climate measures in Polish counties revealed that the implemented eco-schemes:
-
exerted a strong effect on the development of agriculture (Wagr) and the economic dimension of the quality of life (We),
-
exerted a moderate effect on the environmental dimension of the quality of life (Wn),
-
exerted a negligible effect on the social dimension of the quality of life (Ws) in the isolated counties of Wielkopolska, Małopolska and, Podlasie (Figure 10).
The local authorities’ involvement in the process of raising funds for public projects is crucial for GE. The success of GE development is largely dependent on local decision-makers’ attitudes towards environmental issues. Many local leaders recognized infrastructure deficits and raised funds for the construction of water supply and sewage lines or the replacement of coal-fired boilers with more environmentally friendly alternatives. However, in some municipalities, environmental issues were disregarded or received less attention than public transport, culture, or education [72,73].
The following recommendations can be formulated based on the assessment of the implementation of GE principles in Polish rural areas:
-
various GE models can be developed depending on local environmental, economic, social, and agricultural factors,
-
the developed GE models can be applied in a broader geographic context in areas with similar characteristics,
-
GE principles should be implemented gradually by promoting renewable energy sources, eco-friendly transport solutions, improving food and water quality, developing new industrial infrastructure, and IT systems,
-
new financial instruments and support schemes should be introduced to encourage businesses to invest in green solutions, and to provide consumers with access to organic food and eco-friendly services.

5. Conclusions

The green economy is an inevitable strategy for addressing environmental, social, and economic problems in the modern world. It is closely linked with the concept of sustainable and resilient development and embodies this concept in economic practice by “greening” all sectors of the economy and promoting social and environmental cohesion. At the same time, the implementation of GE principles and sustainable development goals requires a system for evaluating the extent to which businesses rely on GE strategies. The resulting knowledge and the identification of regions where GE policies are most and least effectively implemented play a very important role in spatial planning, land management, and the introduction of socioeconomic development strategies at the municipal, regional, and local level. This knowledge is also essential for planning support schemes in areas where GE principles are least effectively implemented.
Since 2017, Statistics Poland (the Central Statistical Office in Poland) has been publishing GE indicators modeled on the OECD standard [74], but these data do not describe the progress in green policy implementation at the local level. This study was undertaken to analyze the success of GE initiatives at the level of LAU.
The identification of rural areas with unsatisfactory performance in environmental, economic, and social dimensions and low levels of agricultural development can speed up the allocation of additional funds and legal instruments for addressing these problems. The indicators adopted in this study did not focus on the GE alone, but they addressed a much broader range of sustainability problems. To date, research studies exploring sustainable development [75] and the environmental [76,77], social [32,78], and economic dimensions [79,80] of quality of life had been undertaken only from an international perspective.
A comparative analysis of rural areas in Poland supported the identification of regions with the highest and lowest values of the composite GE index. The results of the analysis provide valuable inputs for the local authorities and can be used to develop financial and legal instruments for improving the green performance of Polish municipalities. The analysis demonstrated that EU funds significantly contribute to the achievement of GE objectives at the local level. Similar conclusions are presented in studies [13], in which the authors emphasize that a GE, especially developed after 2000 in Western Europe and in the USA, became an important instrument for recovering from the economic crisis and fighting unemployment. In Poland, GE implementation processes are progressing much slower than expected [21,30]. Studies [81] show, that on the one hand, the green economy contributes to increased efficiency and savings of energy and raw materials, but on the other hand, the associated transition costs and risks are too high for both society, countries, and businesses.
However, the utilization of EU support schemes differs considerably across Polish regions. The highest number of EU-funded pro-environmental schemes has been implemented in Southern Poland and in the suburban areas of Warsaw, Poznań, Toruń, Bydgoszcz, and Gdańsk, whereas Eastern Poland clearly lags behind in this respect. In this study, factors that support and hinder the implementation of GE principles were identified, and the extent to which Polish regions transitioned to a GE was analyzed. The formulated recommendations can be used by the local authorities to plan sustainable development strategies, improve the quality of life in the environmental and economic dimensions, and implement GE principles.
The proposed method to assess the level of the green economy (GE) has limitations.
The analysis uses a synthetic variable. This variable is a latent variable because its dimension is not directly observed. Instead, its dimension depends on observations of diagnostic variables that are directly measurable. It is up to the researcher to decide which indicators to use in the evaluation process. Some limitations were due to the availability of statistical data. In public statistics, it was necessary in some cases to use intermediate variables. There were no data on the share (%) of the population receiving social assistance. This was replaced by the indicator welfare benefits awarded to households below the poverty line in total welfare benefits (%).
It should also be remembered that the taxonomic methods are strictly quantitative, and it is worth comparing them with the analyses performed by qualitative methods. It allows an analysis of the level of satisfaction or the declared, perceived level of GE. In subsequent studies, we will try to assess the level of GE based on qualitative data.

Author Contributions

Conceptualization, A.J.-T., M.G.-G. and M.D.; methodology, M.G.-G. and M.D.; software, A.J.-T. and M.G.-G.; validation, A.J.-T., M.G.-G. and M.D.; formal analysis, A.J.-T., M.G.-G. and M.D.; investigation, M.G.-G. and M.D.; resources, A.J.-T., M.G.-G. and M.D.; data curation, M.G.-G. and M.D.; writing—original draft preparation, A.J.-T., M.G.-G. and M.D.; writing—review and editing, A.J.-T., M.G.-G. and M.D.; visualization, M.G.-G. and M.D.; supervision, A.J.-T., M.G.-G. and M.D.; project administration, A.J.-T., M.G.-G. and M.D. All authors have read and agreed to the published version of the manuscript.

Funding

The publication of the paper was also co-financed by the Kazimierz Wielki University in Bydgoszcz (Poland) and the University of Warmia and Mazury in Olsztyn (Poland).

Institutional Review Board Statement

Not applicable.

Informed Consent Statement

Not applicable.

Data Availability Statement

Not applicable.

Acknowledgments

This research was funded by Project Supporting Maintenance of Research Potential at Kazimierz Wielki University in Bydgoszcz (Poland) and the University of Warmia and Mazury in Olsztyn (Poland).

Conflicts of Interest

The authors declare no conflict of interest.

References

  1. Parkin, S.; Sommer, F.; Uren, S. Sustainable development: Understanding the concept and practical challenge. In Proceedings of the Institution of Civil Engineers—Engineering Sustainability; Thomas Telford, Ltd.: London, UK, 2003; Volume 156, pp. 19–26. [Google Scholar]
  2. Chapple, K. Defining the Green Economy: A Primer on Green Economic Development; Center for Community Innovation, University of California: Berkeley, CA, USA, 2008. [Google Scholar]
  3. Yu, J.L.; Wu, J. The sustainability of agricultural development in china: The agriculture-environment nexus. Sustainability 2018, 10, 1776. [Google Scholar] [CrossRef] [Green Version]
  4. Czyzewski, B.; Matuszczak, A.; Grzelak, A.; Guth, M.; Majchrzak, A. Environmental sustainable value in agriculture revisited: How does common agricultural policy contribute to eco-efficiency? Sustain. Sci. 2021, 16, 137–152. [Google Scholar] [CrossRef]
  5. Rudnicki, R.; Wisniewski, L.; Biczkowski, M. A spatial typography of environmentally friendly common agricultural policy support relevant to european green deal objectives. Land 2021, 10, 1092. [Google Scholar] [CrossRef]
  6. Boyd, E.; Folke, C. Adapting Institutions: Governance, Complexity and Social-Ecological Resilience; Cambridge University Press: Hong Kong, China, 2011. [Google Scholar]
  7. Geels, F.W. The impact of the financial-economic crisis on sustainability transitions: Financial investment, governance and public discourse. Environ. Innov. Soc. Transit. 2013, 6, 67–95. [Google Scholar] [CrossRef] [Green Version]
  8. Jezierska-Thöle, A.; Rudnicki, R.; Wiśniewski, Ł.; Gwiaździńska-Goraj, M.; Biczkowski, M. The agri-environment-climate measure as an element of the bioeconomy in poland—A spatial study. Agriculture 2021, 11, 110. [Google Scholar] [CrossRef]
  9. Wiśniewski, Ł.; Biczkowski, M.; Rudnicki, R. Natural potential versus rationality of allocation of common agriculture policy funds dedicated for supporting organic farming development–assessment of spatial suitability: The case of poland. Ecol. Indic. 2021, 130, 108039. [Google Scholar] [CrossRef]
  10. Wilkin, J. Wielofunkcyjność Rolnictwa: Kierunki Badań, Podstawy Metodologiczne i Implikacje Praktyczne; Instytut Rozwoju Wsi i Rolnictwa Polskiej Akademii Nauk: Warszawa, Poland, 2010. [Google Scholar]
  11. Adamowicz, M. Zielona gospodarka, zielony wzrost i zazielenienie jako formy realizacji koncepcji zrównoważonego rozwoju. Wieś Rol. 2021, 2, 13–33. [Google Scholar] [CrossRef]
  12. Adamowicz, M. The potential for innovative and smart rural development in the peripheral regions of eastern poland. Agriculture 2021, 11, 188. [Google Scholar] [CrossRef]
  13. Aldieri, L.; Vinci, C.P. Green economy and sustainable development: The economic impact of innovation on employment. Sustainability 2018, 10, 3541. [Google Scholar] [CrossRef] [Green Version]
  14. Holdgate, M.W. The report of the world commission on environment and development. Oxford university press, oxford & new york. Environ. Conserv. 1987, 14, 282. [Google Scholar]
  15. Stern, N.; Stern, N.H. The Economics of Climate Change: The Stern Review; Cambridge University Press: Hong Kong, China, 2007. [Google Scholar]
  16. Pachauri, R.K.; Reisinger, A. Climate Change 2007. Synthesis Report. Contribution of Working Groups i, ii and iii to the Fourth Assessment Report; Intergovernmental Panel on Climate Change: Geneva, Switzerland, 2008. [Google Scholar]
  17. Prus, P. The role of higher education in promoting sustainable agriculture. J. East Eur. Manag. Stud. 2019, 99–119. [Google Scholar] [CrossRef]
  18. Barbier, E.B. A Global Green New Deal: Rethinking the Economic Recovery; Cambridge University Press: Hong Kong, China, 2010. [Google Scholar]
  19. Barbier, E. How is the global green new deal going? Nature 2010, 464, 832–833. [Google Scholar] [CrossRef]
  20. Kozłowski, S. Nowa strategia rozwoju zrównoważonego unii europejskiej (2006). Cz 1. Probl. Ekol. 2007, 11, 3–10. [Google Scholar]
  21. Wanner, T. The new ‘passive revolution’of the green economy and growth discourse: Maintaining the ‘sustainable development’of neoliberal capitalism. New Political Econ. 2015, 20, 21–41. [Google Scholar] [CrossRef]
  22. Lorek, S.; Spangenberg, J.H. Sustainable consumption within a sustainable economy–Beyond green growth and green economies. J. Clean. Prod. 2014, 63, 33–44. [Google Scholar] [CrossRef]
  23. Commission UE. Annex to the Communication from the Commission to the European Parliament, the European Council, the Council, the European Economic and Social Committee and the Committee of the Regions the European Green Deal; Commission UE: Brusseles, Belgium, 2019. [Google Scholar]
  24. Szpak, K. Polityka Klimatyczna Unii Europejskiej W Perspektywie 2025 Roku. In Polityka Klimatyczna i Jej Realizacja w Pierwszej Połowie XXI Wieku; Gajewski, J., Paprocki, W., Eds.; Publikacja Europejskiego Kongresu Finansowego: Sopot, Poland, 2020. [Google Scholar]
  25. Commission UE. The European Green Deal, Com(2019) 640 Final, 11 December. Available online: https://ec.europa.eu/info/sites/info/files/europeangreen-deal-communication_en.pdf (accessed on 6 December 2021).
  26. Pearce, D.; Markandya, A.; Barbier, E. Blueprint 1: For a Green Economy; Routledge: London, UK, 2013. [Google Scholar]
  27. Chai, B.; Gao, J.; Pan, L.; Chen, Y. Research on the impact factors of green economy of china—from the perspective of system and foreign direct investment. Sustainability 2021, 13, 8741. [Google Scholar] [CrossRef]
  28. Denona Bogovic, N.; Grdic, Z.S. Transitioning to a green economy—Possible effects on the croatian economy. Sustainability 2020, 12, 9342. [Google Scholar] [CrossRef]
  29. Loiseau, E.; Saikku, L.; Antikainen, R.; Droste, N.; Hansjürgens, B.; Pitkänen, K.; Leskinen, P.; Kuikman, P.; Thomsen, M. Green economy and related concepts: An overview. J. Clean. Prod. 2016, 139, 361–371. [Google Scholar] [CrossRef]
  30. Ronzon, T.; M’Barek, R. Socioeconomic indicators to monitor the eu’s bioeconomy in transition. Sustainability 2018, 10, 1745. [Google Scholar] [CrossRef] [Green Version]
  31. UNEP. Using Indicators for Green Economy Policymaking; United Nations Environment Programme: Nairobi, Keneya, 2014. [Google Scholar]
  32. Jezierska-Thöle, A. Development of Rural Areas of Northern and Western Poland and Eastern Germany; Scientific Publishing House of the Nicolaus Copernicus University: Toruń, Poland, 2018. [Google Scholar]
  33. Sachs, D.J. Common Wealth: Economics for a Crowded Planet; Penguin: London, UK, 2009. [Google Scholar]
  34. Stiglitz, J.E.; Sen, A.; Fitoussi, J.-P. Report by the Commission on the Measurement of Economic Performance and Social Progress; Citeseer: State College, PA, USA, 2009. [Google Scholar]
  35. Forrester, J.W. World Dynamics; Wright-Allen Press: Cambridge, MA, USA, 1971. [Google Scholar]
  36. Górka, K.; Łuszczyk, M. Zielona gospodarka i gospodarka oparta na wiedzy a rozwój trwały. Optimum. Studia Ekon. 2014, 3, 22–31. [Google Scholar] [CrossRef]
  37. PAGE. The Green Economy Progress Measurement Framework. Methodology; United Nations Escap: Bangkok, Thailand, 2017. [Google Scholar]
  38. Nahman, A.; Mahumani, B.K.; de Lange, W.J. Beyond gdp: Towards a green economy index. Dev. South. Afr. 2016, 33, 215–233. [Google Scholar] [CrossRef]
  39. Narloch, U.; Kozluk, T.; Lloyd, A. Measuring Inclusive Green Growth at the Country Level. Taking Stock of Measurement Approaches and Indicators; Working Paper; Green Growth Knowledge Platform (GGKP), UNEP: Nairobi, Kenya, 2016. [Google Scholar]
  40. The 2012 global green economy index, dual citizen inc. Available online: http://old.adapt.it/adapt-indice-a-z/wp-content/uploads/2013/08/dualcitizen_2012.pdf (accessed on 5 December 2021).
  41. Gavurova, B.; Megyesiova, S.; Hudak, M. Green growth in the oecd countries: A multivariate analytical approach. Energies 2021, 14, 6719. [Google Scholar] [CrossRef]
  42. Szyja, P. Transition to a green economy: Programming for a low-carbon economy at the voivodeship level. In Finance and Sustainability; Springer: Berlin/Heidelberg, Germany, 2020; pp. 89–101. [Google Scholar]
  43. Georgeson, L.; Maslin, M.; Poessinouw, M. The global green economy: A review of concepts, definitions, measurement methodologies and their interactions. Geo Geogr. Environ. 2017, 4, e00036. [Google Scholar] [CrossRef]
  44. Sidorczuk-Pietraszko, E. Wdrażanie Koncepcji Zielonej Gospodarki W Regionach Polski; Wydawnictwo Uniwersytetu w Białymstoku: Białystok, Poland, 2020. [Google Scholar]
  45. Flouros, F.; Pistikou, V.; Plakandaras, V. Geopolitical risk as a determinant of renewable energy investments. Energies 2022, 15, 1498. [Google Scholar] [CrossRef]
  46. Jezierska-Thöle, A.; Rudnicki, R.; Kluba, M. Development of energy crops cultivation for biomass production in poland. Renew. Sustain. Energy Rev. 2016, 62, 534–545. [Google Scholar] [CrossRef]
  47. Gwiazdzinska-Goraj, M.; Pawlewicz, K.; Jezierska-Thole, A. Differences in the quantitative demographic potential-a comparative study of polish-german and polish-lithuanian transborder regions. Sustainability 2020, 12, 9414. [Google Scholar] [CrossRef]
  48. Jezierska-Thöle, A. Przekształcenia Społeczno-Gospodarcze Obszarów Wiejskich Pomorza Nadwiślańskiego w Latach 1988–1998; Wydawnictwo Uniwersytetu Mikołaja Kopernika: Toruń, Poland, 2006. [Google Scholar]
  49. Przybyła, K.; Kulczyk-Dynowska, A.; Kachniarz, M. Quality of life in the regional capitals of poland. J. Econ. Issues 2014, 48, 181–196. [Google Scholar] [CrossRef]
  50. Pomianek, I.; Chrzanowska, M. A spatial comparison of semi-urban and rural gminas in poland in terms of their level of socio-economic development using hellwig’s method. Bull. Geogr. Socio-Econ. Ser. 2016, 33, 103–117. [Google Scholar] [CrossRef] [Green Version]
  51. Dudzinska, M.; Bacior, S.; Prus, B. Considering the level of socio-economic development of rural areas in the context of infrastructural and traditional consolidations in poland. Land Use Policy 2018, 79, 759–773. [Google Scholar] [CrossRef]
  52. Dziekański, P.; Prus, P.; Maitah, M.; Wrońska, M. Assessment of spatial diversity of the potential of the natural environment in the context of sustainable development of poviats in poland. Energies 2021, 14, 6027. [Google Scholar] [CrossRef]
  53. Gibas, P.; Heffner, K. Koncentracja zabudowy na obszarach wiejskich. Wieś Rol. 2018, 2, 189–207. [Google Scholar] [CrossRef]
  54. Pawełek, J. Problematyka wodociągów i kanalizacji wiejskich w regionach górskich. Przegląd Komunal. 2000, 5, 114–116. [Google Scholar]
  55. Ciura, G. Warunki życia ludności wiejskiej. Studia BAS 2010, 4, 159–178. [Google Scholar]
  56. Rudnicki, R.; Wisniewski, L.; Kluba, M. Poziom i struktura przestrzenna rolnictwa polskiego w świetle wyników powszechnego spisu rolnego 2010. Rocz. Nauk. Stowarzyszenia Ekon. Rol. Agrobiz. 2015, 17, 337–343. [Google Scholar]
  57. Biczkowski, M.; Jezierska-Thöle, A.; Rudnicki, R. The impact of rdp measures on the diversification of agriculture and rural development—seeking additional livelihoods: The case of poland. Agriculture 2021, 11, 253. [Google Scholar] [CrossRef]
  58. Jasiulewicz, M. Potencjał rozwoju rolnictwa energetycznego polski. Rocz. Nauk. Stowarzyszenia Ekon. Rol. Agrobiz. 2009, 11, 79–84. [Google Scholar]
  59. Bański, J. Uwarunkowania rozwoju przedsiębiorczości na wsi–wybrane zagadnienia. Rocz. Nauk. Ekon. Rol. Rozw. Obsz. Wiej. 2015, 102, 59–69. [Google Scholar]
  60. Schandl, H.; Hatfield-Dodds, S.; Wiedmann, T.; Geschke, A.; Cai, Y.Y.; West, J.; Newth, D.; Baynes, T.; Lenzen, M.; Owen, A. Decoupling global environmental pressure and economic growth: Scenarios for energy use, materials use and carbon emissions. J. Clean. Prod. 2016, 132, 45–56. [Google Scholar] [CrossRef]
  61. Teixido-Figueras, J.; Steinberger, J.K.; Krausmann, F.; Haberl, H.; Wiedmann, T.; Peters, G.P.; Duro, J.A.; Kastner, T. International inequality of environmental pressures: Decomposition and comparative analysis. Ecol. Indic. 2016, 66, 634. [Google Scholar] [CrossRef] [Green Version]
  62. Martinico-Perez, M.F.G.; Schandl, H.; Fishman, T.; Tanikawa, H. The socio-economic metabolism of an emerging economy: Monitoring progress of decoupling of economic growth and environmental pressures in the philippines. Ecol. Econ. 2018, 147, 155–166. [Google Scholar] [CrossRef]
  63. Jasiulewicz, M. Przekształcenia strukturalne i przestrzenne obszarów wiejskich pomorza środkowego w okresie transformacji systemowej. Wyd. Uczel. Politech. Koszalińskiej Koszal. 1998, 65, 279. [Google Scholar]
  64. Gwiaździńska-Goraj, M. Przemiany Społeczno-Gospodarcze Obszarów Wiejskich Województwa Warmińsko-Mazurskiego; Ośrodek Badań Naukowych im. Wojciecha Kętrzyńskiego: Olsztyn, Poland, 2004. [Google Scholar]
  65. Churski, P. Problem areas in polish regional policy. Morav. Geogr. Rep. 2010, 18, 23–35. [Google Scholar]
  66. Stanny, M.; Komorowski, Ł.; Rosner, A. The socio-economic heterogeneity of rural areas: Towards a rural typology of Poland. Energies 2021, 14, 5030. [Google Scholar] [CrossRef]
  67. Stanny, M.; Strzelczyk, W. Kondycja Finansowa Samorządów Lokalnych a Rozwój Społeczno-Gospodarczy Obszarów Wiejskich: Ujęcie Przestrzenne; Polska Akademia Nauk, Instytut Rozwoju Wsi i Rolnictwa: Warszawa, Poland, 2018. [Google Scholar]
  68. Kenig-Witkowska, M.M. Prawo Srodowiska Unii Europejskiej; Wolters Kluwer: Alphen aan den Rijn, The Netherlands, 2012. [Google Scholar]
  69. Rudnicki, R.; Wiśniewski, Ł. Single area payments as an instrument to monitor agrarian changes in Poland (in 2004–2013). Intercathedra 2018, 34, 63–72. [Google Scholar]
  70. Fagiewicz, K.; Churski, P.; Herodowicz, T.; Kaczmarek, P.; Lupa, P.; Morawska-Jancelewicz, J.; Mizgajski, A. Cocreation for climate change—Needs for actions to vitalize drivers and diminish barriers. Weather. Clim. Soc. 2021, 13, 555–570. [Google Scholar] [CrossRef]
  71. Olszewski, P. Green deal a zielona agenda dla bałkanów zachodnich. Sprawy Międzynarodowe 2021, 74, 75–88. [Google Scholar] [CrossRef]
  72. Sanetra-Półgrabi, S.; Ostachowski, P. Bezpieczeństwo ekologiczne w polityce inwestycyjnej gmin powiatu żywieckiego w latach 2011–2015. Przedsiębiorczość Zarządzanie 2017, 18, 217–230. [Google Scholar]
  73. Wansacz, E. Zarządzanie srodkami europejskimi przez jednostki samorządu terytorialnego, jako ich beneficjentów. In Instrumenty Zarządzania Finansami Jednostek Samorządu Terytorialnego; Wyszkowska, D., Ed.; Wydawnictwo Uniwersytetu w Białymstoku: Białystok, Poland, 2013. [Google Scholar]
  74. Wyszkowska, D.; Rogalewska, A. Wskaźniki zielonej gospodarki dla polski oraz pozostałych krajów unii europejskiej. Wiadomości Stat. Pol. Stat. 2016, 10, 54–74. [Google Scholar]
  75. Senetra, A.; Pawlewicz, K.; Pawlewicz, A. The dynamics of changes and spatial differences in the synthetic indicator for evaluating environmental performance in poland: Current state. Int. J. Environ. Res. Public Health 2019, 16, 4490. [Google Scholar] [CrossRef] [PubMed] [Green Version]
  76. Liu, B.; Gao, Q.; Liang, L.; Sun, J.; Liu, C.; Xu, Y. Ecological relationships of global construction industries in sustainable economic and energy development. Energy 2021, 234, 121249. [Google Scholar] [CrossRef]
  77. Yurui, L.; Xuanchang, Z.; Zhi, C.; Zhengjia, L.; Zhi, L.; Yansui, L. Towards the progress of ecological restoration and economic development in china’s loess plateau and strategy for more sustainable development. Sci. Total Environ. 2021, 756, 143676. [Google Scholar] [CrossRef]
  78. Gwiaździńska-Goraj, M.; Jezierska-Thöle, A.; Dudzińska, M. Assessment of the living conditions in polish and german transborder regions in the context of strengthening territorial cohesion in the european union: Competitiveness or complementation? Soc. Indic. Res. 2022. online ahead of print. [Google Scholar] [CrossRef]
  79. Ahmed, M.M.; Shimada, K. The effect of renewable energy consumption on sustainable economic development: Evidence from emerging and developing economies. Energies 2019, 12, 2954. [Google Scholar] [CrossRef] [Green Version]
  80. Vasylieva, T.; Lyulyov, O.; Bilan, Y.; Streimikiene, D. Sustainable economic development and greenhouse gas emissions: The dynamic impact of renewable energy consumption, gdp, and corruption. Energies 2019, 12, 3289. [Google Scholar] [CrossRef] [Green Version]
  81. Szyja, P. Zielona gospodarka w Polsce–stan obecny i perspektywy. Nierówności Społeczne Wzrost Gospod. 2015, 41, 432–447. [Google Scholar]
Figure 1. Main objectives of the European Green Deal. Source: own elaboration based on [26,27,28].
Energies 15 03332 g001
Figure 2. Location of the study area. (A)—Location of Poland on a map of Europe. (B)—Local Administrative Units in Poland. Source: own elaboration.
Energies 15 03332 g002
Figure 3. Environmental dimension of the quality of life—Wn. Source: own elaboration.
Energies 15 03332 g003
Figure 4. Agriculture—Wagr. Source: own elaboration.
Energies 15 03332 g004
Figure 5. Economic dimension the quality of life—We. Source: own elaboration.
Energies 15 03332 g005
Figure 6. Social dimension of the quality of life—Ws. Source: own elaboration.
Energies 15 03332 g006
Figure 7. Spatial variation in the development of green economy—Wge. Source: own elaboration.
Energies 15 03332 g007
Figure 9. Relationship between the implementation of green economy principles and pro-environmental spending. Source: own elaboration.
Energies 15 03332 g009
Figure 10. Influence of agri-environmental-climate measures on the environmental, economic, and social dimensions of the quality of life. Source: own elaboration.
Energies 15 03332 g010
Table 2. Diagnostic variables for evaluating the implementation of green economy principles.
Diagnostic VariablesTypeAvailability of Statistical Databases at LAU LevelChoice of
Variables
1234
Environmental dimension of the quality of life—(Wn)
Legally protected areas in total area (%)stimulantavailableaccepted—x1
Forest cover (%) stimulantavailableaccepted—x2
Total area of inland water bodies (%) stimulantavailableaccepted—x3
Gaseous emissions from major sources of industrial pollution in t/y/km2destimulantavailableaccepted—x4
Dust emissions from major sources of industrial pollution in t/y/km2destimulantavailablerejected
Population with access to public water supply (%)stimulantavailableaccepted—x5
Population with access to public sewage system (%)stimulantavailableaccepted—x6
Households with central heating (%)stimulantavailablerejected
Water pollution index (BOD5) (average for 2015–2020)—pollutant loads in wastewater evacuated to water or to soil in industrydestimulantavailableaccepted—x7
Agriculture—(Wagr)
Average farm area in ha stimulantunavailable accepted—x8
Farm managers with secondary and university education in the total number of farm managers (%)stimulantavailableaccepted—x9
Area under non-cereal crops in total cropped area (based on the Agricultural Census of 2010) (%)stimulantavailableaccepted—x10
Young farm managers (up to 34 years) in the total number of farm managers (%) stimulantunavailable accepted—x11
Land with high natural value in total farm area (%) (forests, land under forestry, meadows and permanent pastures, fallow land, including green manure crops) (based on the Agricultural Census of 2010)stimulantavailableaccepted—x12
Nature value of farmland
(indicator WjRpp developed by the Institute of Soil Science and Plant Cultivation in Puławy)
stimulantavailablerejected
Economic dimension of the quality of life (We)
Per capita incomestimulantavailableaccepted—x13
Average gross monthly incomestimulantavailableaccepted—x14
Number of dependents per 10,000 working-age populationstimulantavailableaccepted—x15
Social dimension of the quality of life (Ws)
Number of welfare centers per 100 km2destimulantavailablerejected
Number of indebted households in public housing units in the total number of housing units (%) destimulantavailablerejected
Welfare benefits awarded to households below the poverty line in total welfare benefits (%)destimulantavailableaccepted—x18
Welfare benefits awarded to households with an alcohol addiction problem in total welfare benefits (%)destimulantavailablerejected
Registered unemployment ratedestimulantavailableaccepted—x19
Source: own elaboration based on [8,44,45,46,47,48].
Table 3. Division of counties into classes based on the applied classification criteria.
ClassClassification CriterionEvaluation
IRav-s  >  Rilow
IIRav  >  Ri  >  Rav–smedium low
IIIRav  +  s > Ri  >  Ravmedium high
IVRi > Rav  +  shigh
Source: own elaboration.
Table 4. Structure of counties based on the environmental, social, and economic dimensions of the quality of life.
ClassEnvironmental Dimension of the Quality of Life—WnAgriculture—WagrEconomic Dimension of the Quality of Life—WeSocial Dimension of the Quality of Life—Ws
Value%Value%Value%Value%
I≤0.54913.10%≤0.55816.00%≤0.17334.80%≤0.28616.90%
II≤0.60755.70%≤0.60133.20%≤0.24638.00%≤0.42137.60%
III≤0.68125.50%≤0.64834.20%≤0.38122.40%≤0.58031.20%
IV≤0.7955.70%≤0.73616.60%≤0.6354.80%≤0.83214.30%
Source: own elaboration.
Table 5. Classification of Local Administrative Units (LAUs) implementing green economy principles based on indicator Wge.
ClassEvaluationNumber of LAUs% LAUs
ILow6320.1%
IIMedium low12238.9%
IIIMedium high8527.1%
IVHigh4414.0%
Source: own elaboration.
Table 6. Relationship between the implementation of green economy principles and agri-environmental-climate measures.
VariableWnWagrWeWsWge
Wpro−0.071 *−0.229 **0.507 ***−0.327 **0.228 **
Wproha−0.025 *−0.179 *0.474 ***−0.280 **0.252 **
*** moderate dependence ** low dependence * no linear relationship. Source: own elaboration.
Publisher’s Note: MDPI stays neutral with regard to jurisdictional claims in published maps and institutional affiliations.

