Article

Impact of Gas Saturation and Gas Column Height at the Base of the Gas Hydrate Stability Zone on Fracturing and Seepage at Vestnesa Ridge, West-Svalbard Margin

by
Hariharan Ramachandran
1,*,
Andreia Plaza-Faverola
1 and
Hugh Daigle
2
1
CAGE—Centre for Arctic Gas Hydrate, Environment and Climate, Department of Geosciences, UiT—The Arctic University of Norway, 9037 Tromsø, Norway
2
Center for Subsurface Energy and the Environment, The University of Texas at Austin, Austin, TX 78712, USA
*
Author to whom correspondence should be addressed.
Energies 2022, 15(9), 3156; https://doi.org/10.3390/en15093156
Submission received: 5 March 2022 / Revised: 21 April 2022 / Accepted: 22 April 2022 / Published: 26 April 2022

Abstract

:
The Vestnesa Ridge, located off the west Svalbard margin, is a >60 km long ridge consisting of fine-grained sediments that host a deep-marine gas hydrate and associated seepage system. Geological and geophysical observations indicate the predominance of vertical fluid expulsion through fractures with pockmarks expressed on the seafloor along the entire ridge. However, despite the apparent evidence for an extended free gas zone (FGZ) below the base of the gas hydrate stability zone (BGHSZ), present-day seafloor seepage has been confirmed only on the eastern half of the sedimentary ridge. In this study, we combine the relationships between aqueous phase pressure, capillary pressure, sediment clay fraction, porosity, and total stress to simulate how much gas is required to open preexisting fractures from the BGHSZ towards the seafloor. Data from four specific sites with different lithology and pressure regime along the ridge are used to constrain the simulations. Results demonstrate that fracturing is favored from the FGZ (with gas saturations < 0.1 and gas column heights < 15 m) towards the seafloor. Neglecting the capillary pressure overpredicts the size of the gas column by up to 10 times, leading to erroneous maximum gas vent volume predictions and associated ocean biosphere consequences. Further parametric analyses indicate that variations in the regional stress regime have the potential to modify the fracture criterion, thus driving the differences in venting across the ridge. Our results are in line with independent geophysical observations and petroleum system modeling in the study area, adding confidence to the proposed approach and highlighting the importance of the capillary pressure influence on gas pressure.

1. Introduction

The release of methane from the seafloor is a widespread phenomenon commonly revealed by sonar data as gas bubbles rise through the water column. There are several regions in the world’s oceans where the release of methane appears as continuous and abundant gas fluxes: the US Atlantic margin [1]; the Barents Sea [2]; the west Svalbard continental margin [3]; the Marmara Sea [4]; the Black Sea [5]; and Makran continental margin [6] among other margins. Often, the release of methane is correlated with the up-dip limit of the gas hydrate stability at continental margins and in other cases the seepage is associated with deep reservoir dynamics. The amount and periodicity of gas release have been shown to vary significantly depending on the geological setting, ranging from systems that are controlled by sea-level changes [7] to systems dominated by large-scale sedimentary and tectonic processes [8,9]. Gas release or venting typically occurs through high-permeability conduits, such as fractures that span the entire hydrate stability zone [10,11,12,13,14]. The ability of the gas phase to open such fractures depends on the complex interactions between geomechanics, gas volumes and the nature of the sediments present at the respective depth [15].
This study investigates the pressure regimes and fracturing controlling one of these complex seepage systems at a gas hydrate bearing deep marine sedimentary drift, the Vestnesa Ridge (VR), off the west Svalbard coast. The presence of gas hydrates is suggested by the observation of a bottom simulating reflection (BSR) in seismic data [16,17], and present-day venting is identified as acoustic flares in the water column originating from large seafloor pockmarks [18,19]. There is active thermogenic and microbial gas venting on the eastern segment of the ridge from 1 m pits within ca. 500 m wide seafloor pockmarks [20,21]. Although there are pockmarks in the western segment of the ridge, they are considered inactive or to seep at a rate that is harder to identify from acoustic data and seafloor observations [22]. Previous studies suggest that the spatial and temporal variability of seepage along the ridge is primarily related to variations in the stress field controlled by (1) mid-ocean ridge tectonics, (2) glacio-tectonic evolution of this region and (3) pore fluid pressure evolution [22,23]. Although other factors such as sediment loading, glacial flexure, thermoelastic stress constraints, basal drag forces, and spatial density contrasts were not considered here [23], they are also known to affect stress evolution at other passive continental margins [24,25,26]. The evidence of gas flares in the water column [19] and vertical fractures observable at both the resolution of sediment cores [27] and seismic data [18] indicate the presence of conduits for gas release at the seafloor. Such fracture-controlled gas seepage has been documented and modeled at deep marine gas hydrate deposits on several continental margins [10,11,12,13,14,15,16,18,28]. These studies proposed gas-driven tensile fracturing as an important mechanism to explain such gas release.
The aim here is to constrain the role of gas below and within the gas hydrate stability zone (GHSZ) in the opening of fractures and release of gas from the base of the GHSZ (BGHSZ) along the VR. The modeling approach combines a fracture criterion derived from regional stress and porosity predictions with gas phase pressure estimated using capillary pressure models. The model predicts the minimum gas saturation required and the gas column height (depth of gas column below the BGHSZ) of the free gas zone (FGZ) needed to open fractures in shallow marine sediments. Models were constrained with seismic data-driven BSR predictions, particle size data from four sites along the ridge, and porosity of marine sediments across the region, amongst others. The results highlight the importance of the capillary pressure influences on the gas phase pressure and how its consideration prevents overprediction of the gas column height and gas saturation required to open fractures at the BGHSZ. Parametric analyses highlight the impact of stress constraints and sediment clay fraction variations on fracture-related seepage evolution. The physical processes we illustrate here advance our understanding of the current seepage distribution and future seepage potential along the VR and other comparable deep marine gas hydrate systems at continental margins.

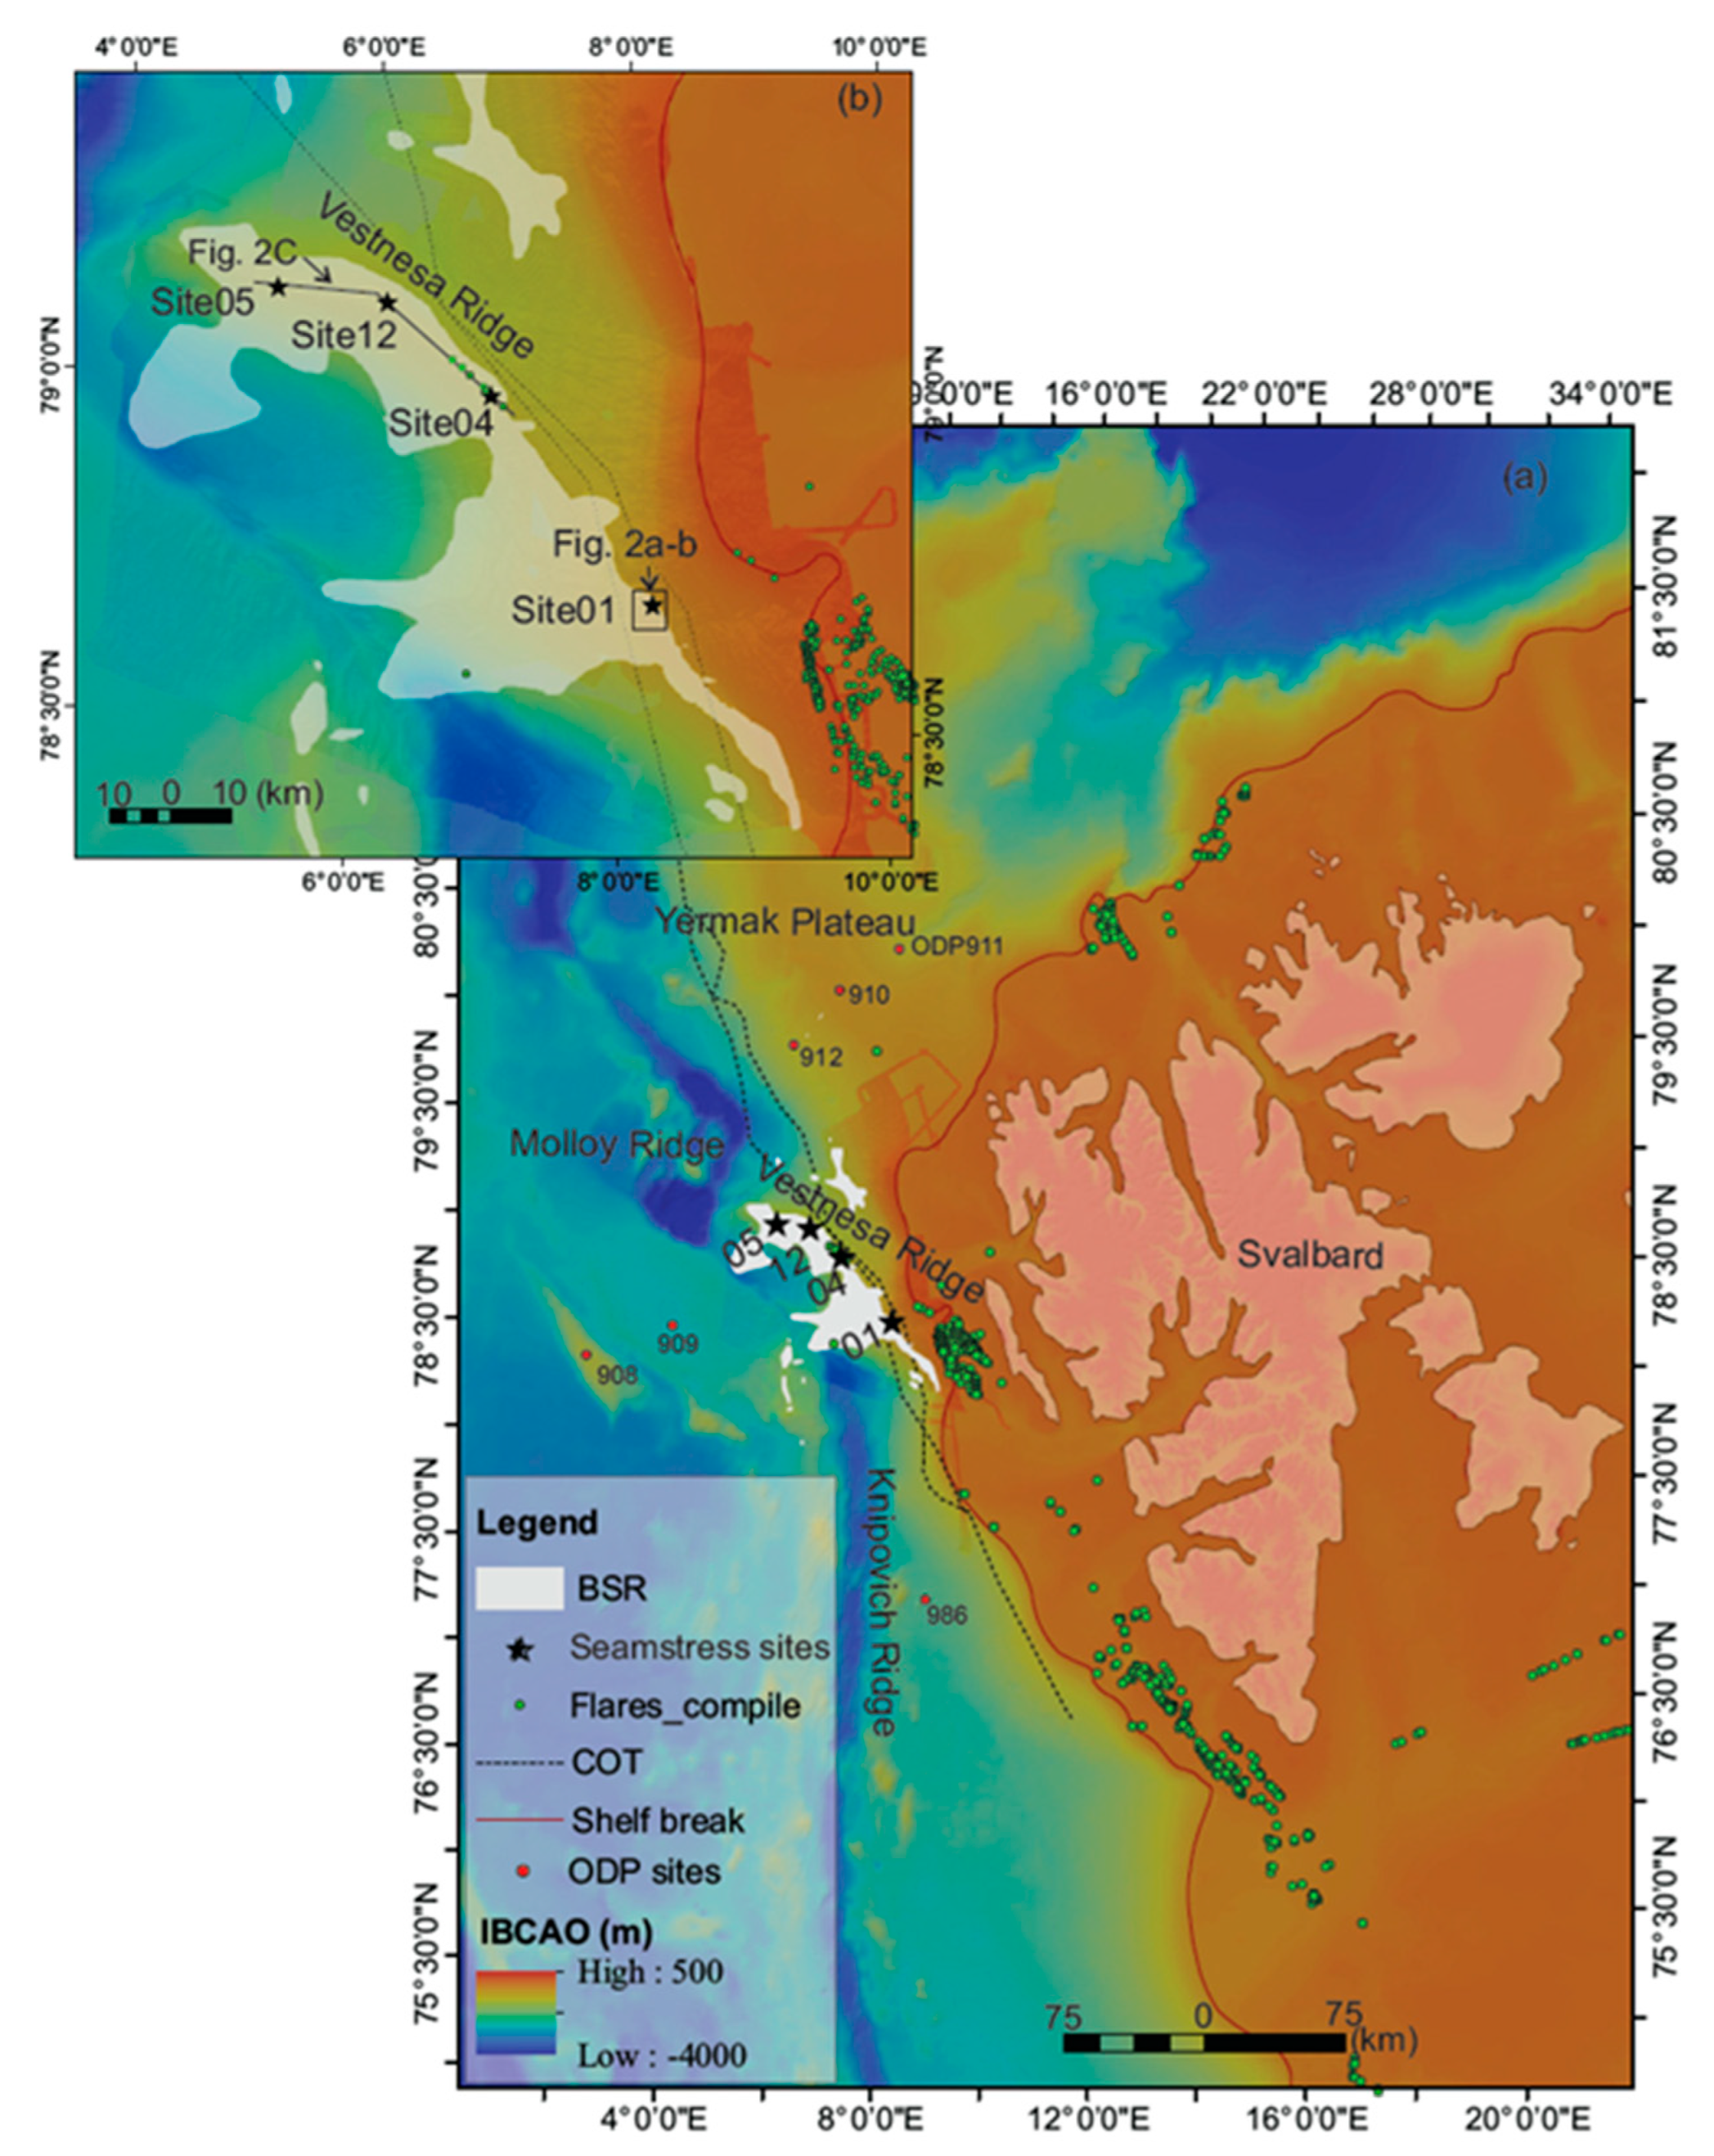
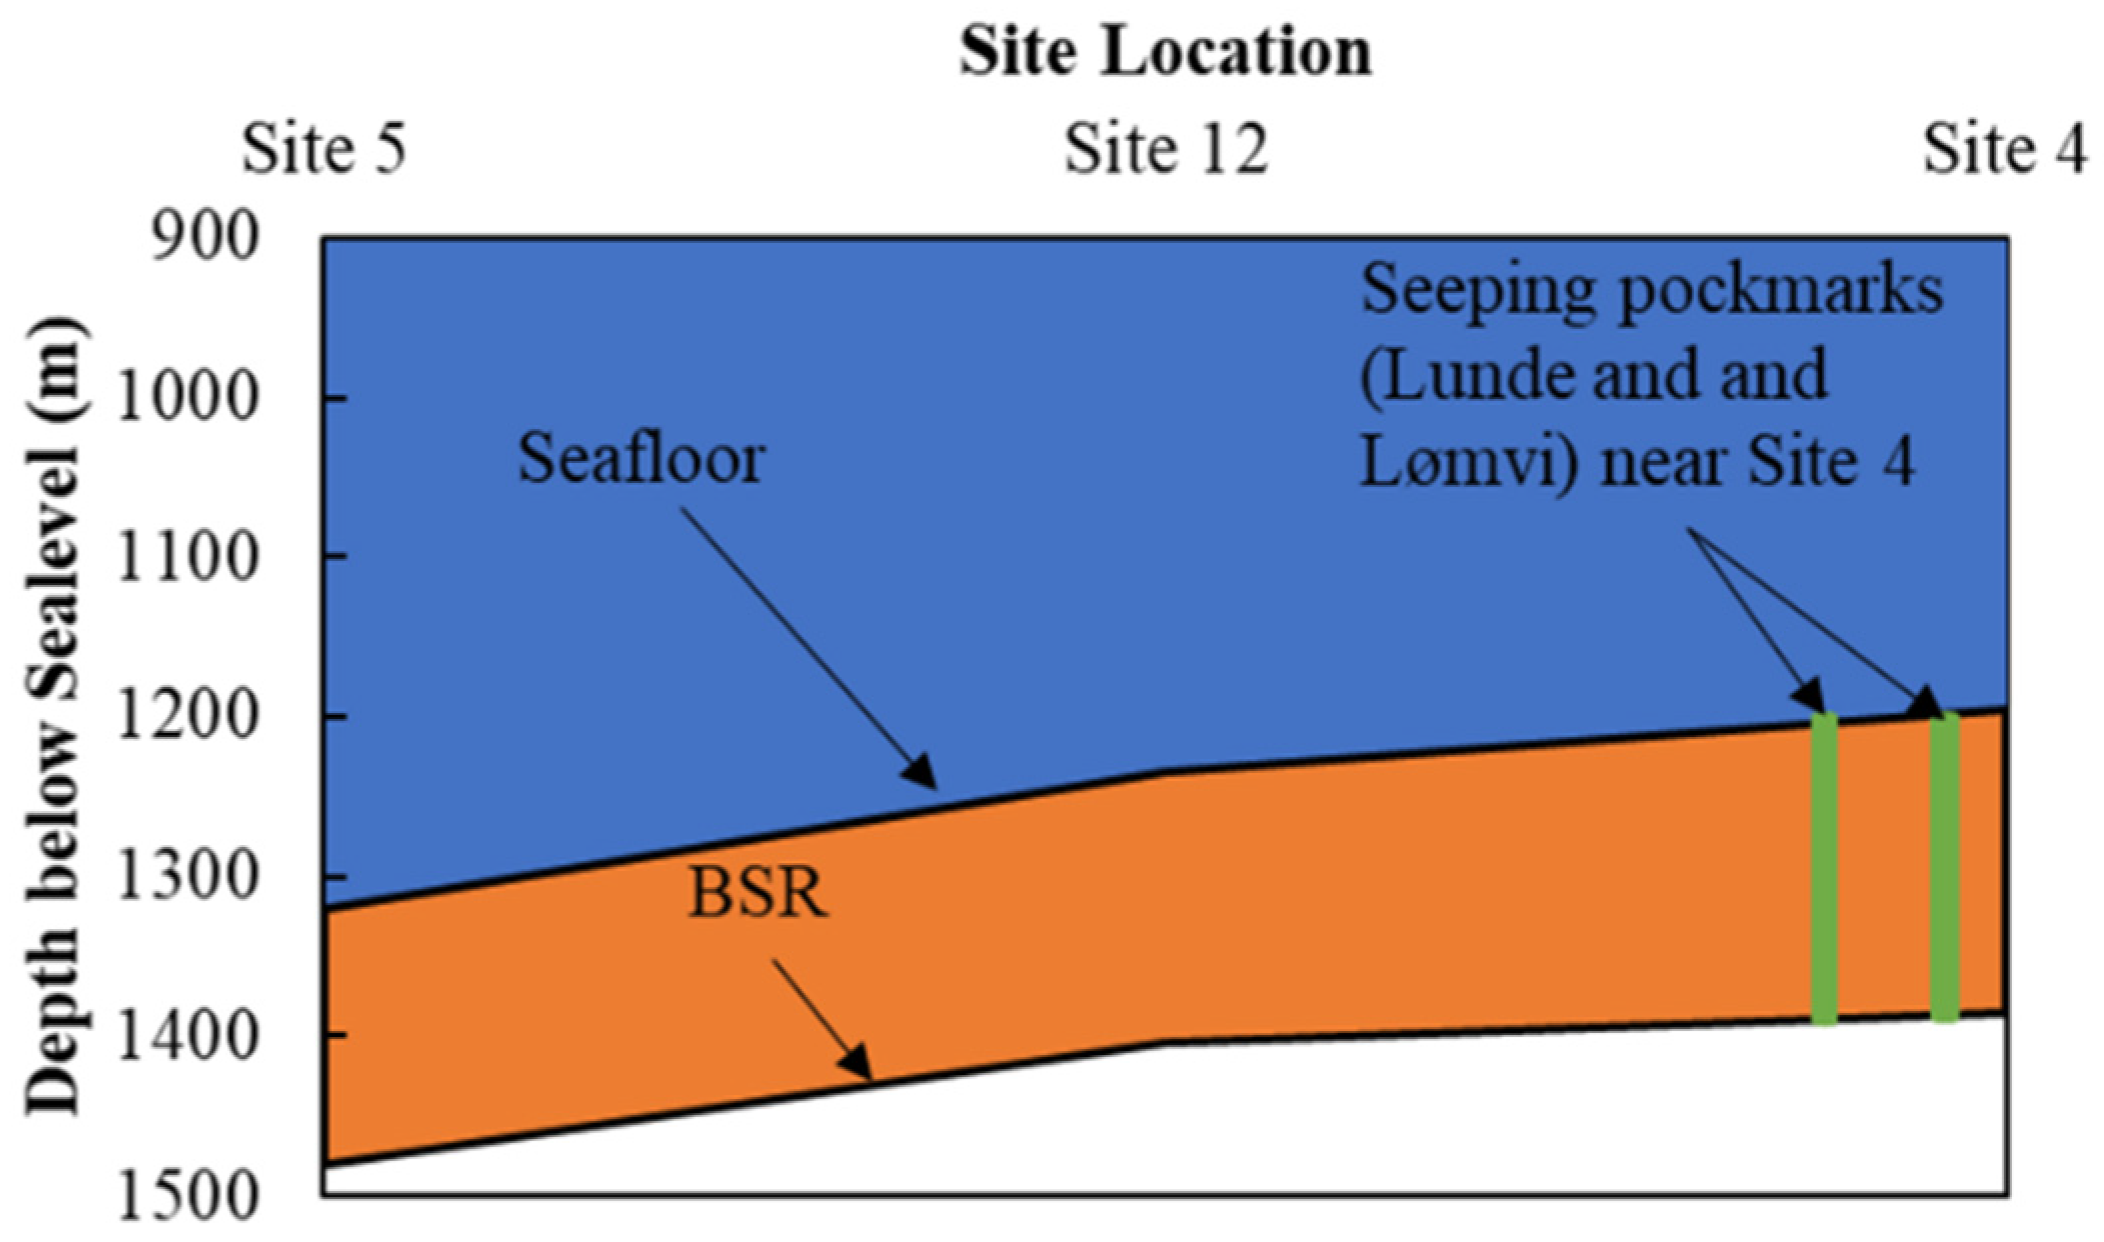
2. Geological Context and Site Description

The continental margin to the west of the Svalbard Archipelago is a passive margin [29] by definition (i.e., the transition from oceanic to continental crust occurs at an inactive plate boundary where the expected tectonic activity is minimal). However, the distance between the continental shelf break and the suspected continental-oceanic transition (COT; Figure 1a) is only a few km in places [30]. The continental margin is therefore in proximity to the slow-spreading Molloy and Knipovich Ridges and the major Spitsbergen (STF) and Molloy (MTF) transform faults (Figure 1a). Due to such proximity to the mid-ocean ridge structures, off-ridge tectonic activity has an influence on near-surface deformation and earth system dynamics along the entire west-Svalbard continental margin [22,23]. Rifting from the mid-ocean ridges and post-glacial lithospheric rebound have shaped the oceanic crust into structures that interact to generate complex stress regimes [31,32,33] that affect the sedimentary cover. The sedimentary cover along the margin can be up to 5 km in areas where bottom currents have built large sediment drifts (contourites; [34]). These sediment drifts are perfect places to collect migrating fluids (e.g., microbial or thermogenic gas) [35,36,37] and sustain deep marine gas hydrate systems.
The VR is one of these sediment drifts hosting a widespread gas hydrate and seepage system (Figure 1b). Although the amplitude of seismic data varies spatially, a continuous BSR is present along the ridge. There are subtle structural and lithological differences, as the margin passes from a more continental to a more oceanic setting, that apparently control the timing and periodicity of gas seepage into the ocean. The four sites (Sites 5, 12, 4 and 1 from west to east; Figure 1) are spread along the ridge. Site 1 is the shallower setting and more proximal to the continental shelf, whilst Site 5 is the deepest and more proximal to the Molloy mid-ocean ridge (Figure 1a). Active seepage from the seafloor has been documented in the form of acoustic flares in sonar data in the surroundings of Site 4. Seafloor pockmarks and fluid flow features such as gas chimneys are observed in the bathymetry of all the sites. The sediment clay fraction (fc) (particles less than 2 μm in diameter) was obtained from index tests (Table 1) performed on the Calypso cores (Figure 2a). The major characteristics of the four investigated sites are described next.
Site 5—This is the westernmost site and proximal to the Molloy mid ocean ridge. The BSR is shallower than the other sites despite an increase in water depth because of the increase in heat flow from the mid-ocean ridge [21]. This site is the least investigated among the four sites. High amplitude in seismic data and the presence of seabed pockmarks indicate that there has been an active fluid flow and seepage system in the past. However, in situ temperature and pressure data hint that there are no pulses of gas release into the ocean.
Site 12—This site represents the transition from the eastern ridge segment, where all the active seepage is concentrated in the present and the western ridge segment, where seafloor pockmarks are the only evidence of gas seepage from the seafloor in the past [22].
Site 4—This site represents the only area where gas seepage has been documented from sonar data (Figure 2c) over multiple expeditions to the area [16,18,19,20,21]. The gas chimneys and pockmarks have a diameter of 500–600 m and they are closely associated with faults and brecciated (fractured) strata [22]. Acoustic flares have been documented to reach up to 900 m from the seafloor [19]. Seismic velocity analyses indicate the presence of hard material (i.e., gas hydrates and/or authigenic carbonate) infilling faults and fractures at discrete intervals within the GHSZ [38,39,40].
Site 1—This is the easternmost site, and it is located on the continental slope, at ca. 24 km westward from the continental shelf (Figure 1a). This area is characterized by an NNE-SSW oriented, ca. 3.5 km long seafloor depression. The depression contains three major pockmarks with diameters ranging from 300–600 m (Figure 2b). Whilst in situ pore fluid pressure and temperatures from piezometer data suggested sporadic seepage in response to daily sea-level changes [41], acoustic flares have not been documented here. Gas hydrate has been sampled within the upper 5 m of sediment along the depression [42]. Small-scale vertical fractures are visible at the resolution of the seismic data in the upper strata.
Table 1. Summary of site parameters and sediment clay fraction data. The sites are reported from west to east. Nearly 17 m long calypso cores were retrieved from the corresponding site locations (name, latitude, longitude, water depth). The BSR depth for the respective locations inferred from previous seismic studies [21,42] is mentioned here. Two samples were selected at the mentioned depths for each calypso core. The sediment clay fraction is obtained from index test performed on these samples.
Site NameCalypso
Core Site
LatitudeLongitudeWater
Depth (mbsl)
BSR
Depth (mbsf)
Sample Depth (mbsf)Sediment
Clay Fraction
Site 5C19-3_GPC0579.14275.27491321.00160.0005.410.6370
16.280.5388
Site 12C19-3_GPC1279.12856.12851234.13170.0006.600.5811
14.590.5882
Site 4C19-3_GPC0478.99676.96351194.74190.0006.130.4885
14.000.3230
Site 1C19-3_GPC0178.69298.24310891.00160.0007.050.4227
12.400.6425

3. Modeling Approach

We integrate field data available for the 4 sites into a geomechanical model and estimate the minimum gas saturations and gas column heights required to open tensile fractures and promote gas migration from BSR to the seafloor. This section describes the data used for constraining the sediment properties in the simulations.

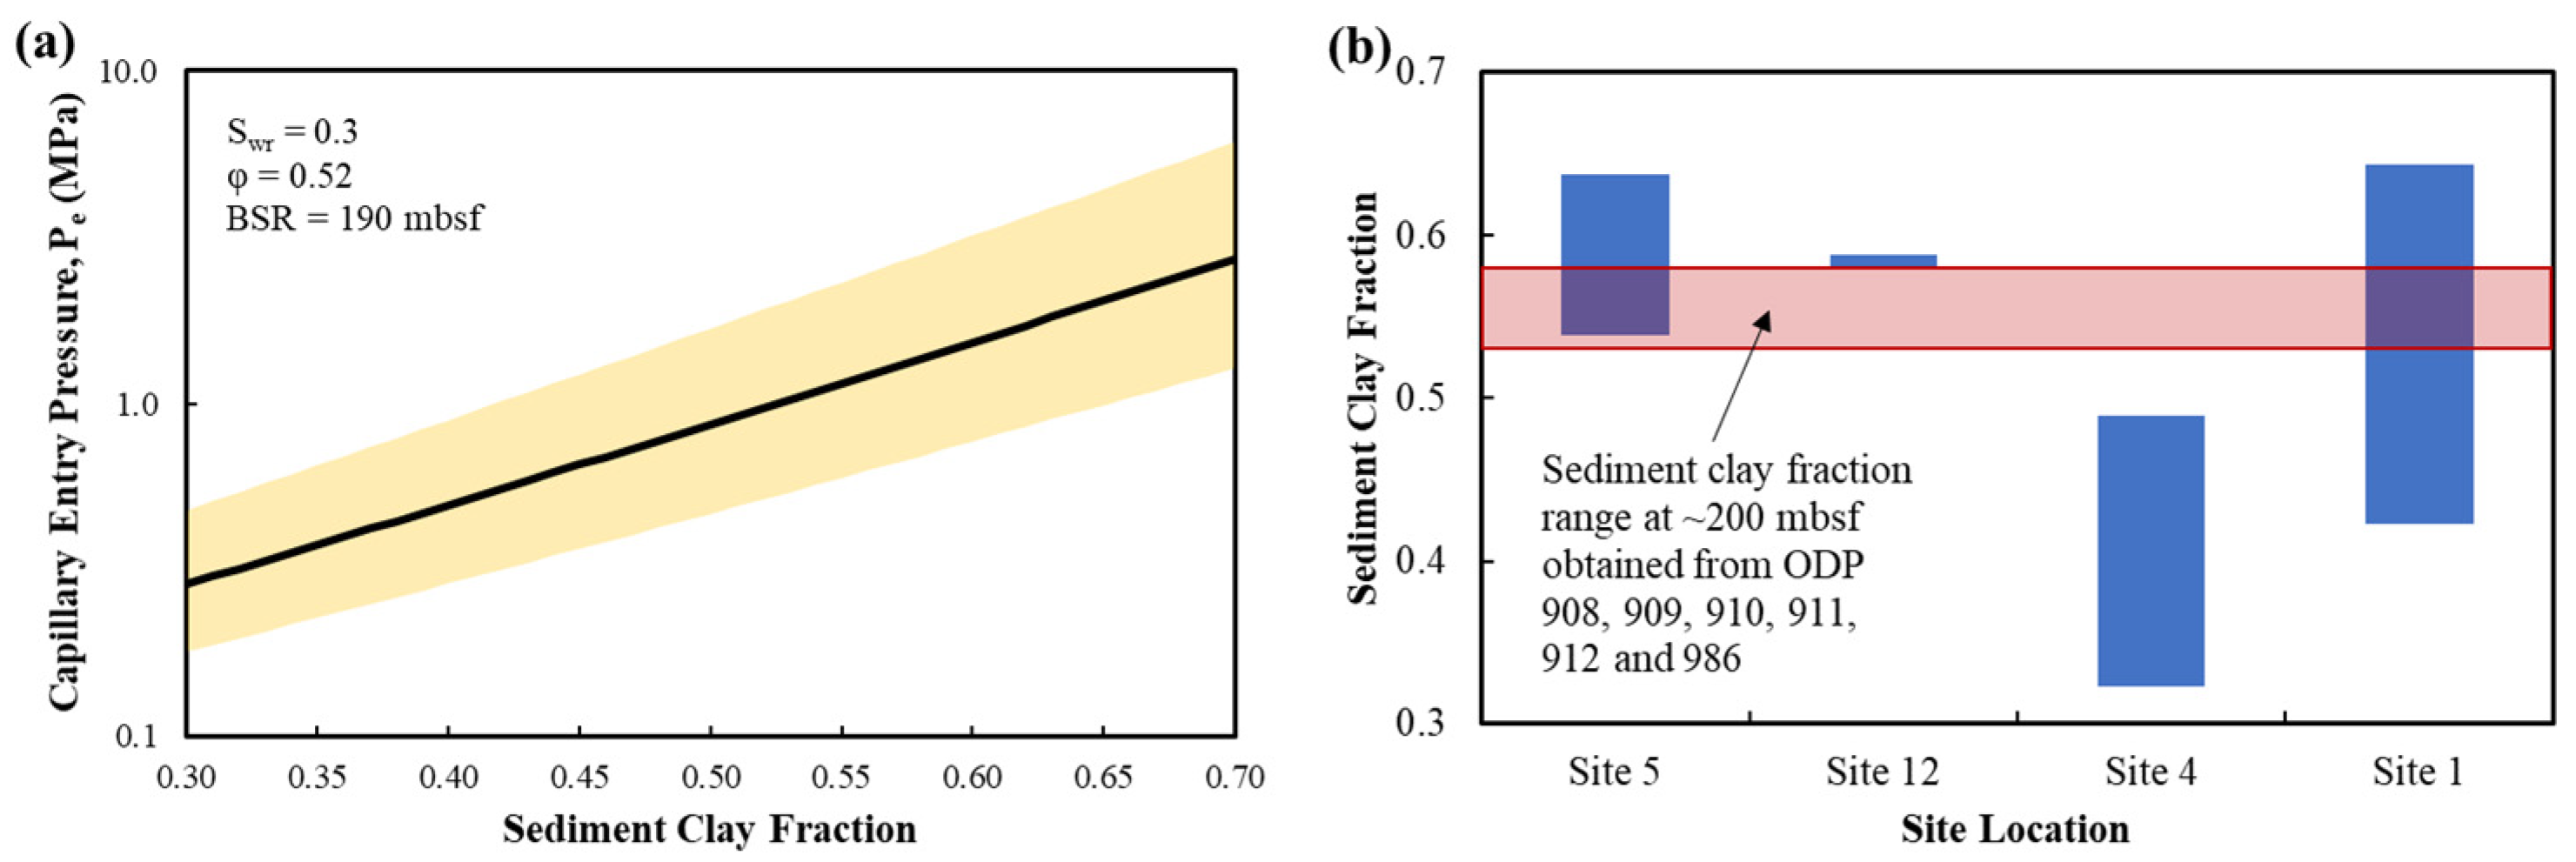
3.1. Sediment Grain Size and Porosity Determination

Three distinct stratigraphic units (YP1-YP3) have been identified from chronostratigraphic analysis of Vestnesa Ridge obtained by correlation with markers from Ocean Drilling Program (ODP) sites 910, 911, 912 at the Yermak Plateau (YP) [34,43,44,45]. The gas hydrate system lies within the YP3 unit, correlated with age ca. 2.7 Ma, and dominated by intercalations of hemipelagic and glaciomarine sediments [43,46,47]. Hence, the lithological data (grain size, porosity, etc.) obtained from the ODP wells are used to characterize the sediments. The sediment grain size is constrained with data obtained from the ODP wells at Site 986 located 200 km to the southeast of the VR [16,48], Site 908 and 909 (located in the Fram strait, ca. 100 km south from VR) and Site 910, 911 and 912 (located at Yermak Plateau at ca. 100 km to the north of the VR) [44,45] (Figure 1a). The logs indicate clay-rich sediments with sediment clay fraction greater than 0.5 for all logs up to 200 mbsf. Higher sediment clay fraction indicates sediments to be fine-grained with the finer particles (clay) controlling the pore characteristics [49]. Experimental studies have shown that an increase in clay particles limit the maximum hydrate saturation (<0.25) within the sediments (consistent with hydrate saturation predictions [16,17,18,50]) and increases the likelihood of gas-driven tensile fracturing [51,52,53]. Although there were thin sections of sediments that were silty than clayey, they largely followed the same trend of being clay rich. The sediment clay fraction varied between 0.53 to 0.57 in the ODP logs at depths of 160–200 mbsf and it agreed well with the predictions from age-depth-lithology model for the VR [54]. We assume a constant sediment clay fraction of 0.55 for this study (unless mentioned otherwise; Refer Section 4.3). Chimney structures such as the ones observed at the VR, typically form in relatively homogenous (constant fc) sediments [15]. The porosity-depth curve is estimated from a polynomial fit equation for the results from Hustoft et al. [16] shown as,
φ = i = 0 21 A i z i
where φ is porosity of the sediment, z is depth in m below seafloor (mbsf), and Ai are equation constants given in Table 2. This equation is valid for sediments up to 1000 mbsf.

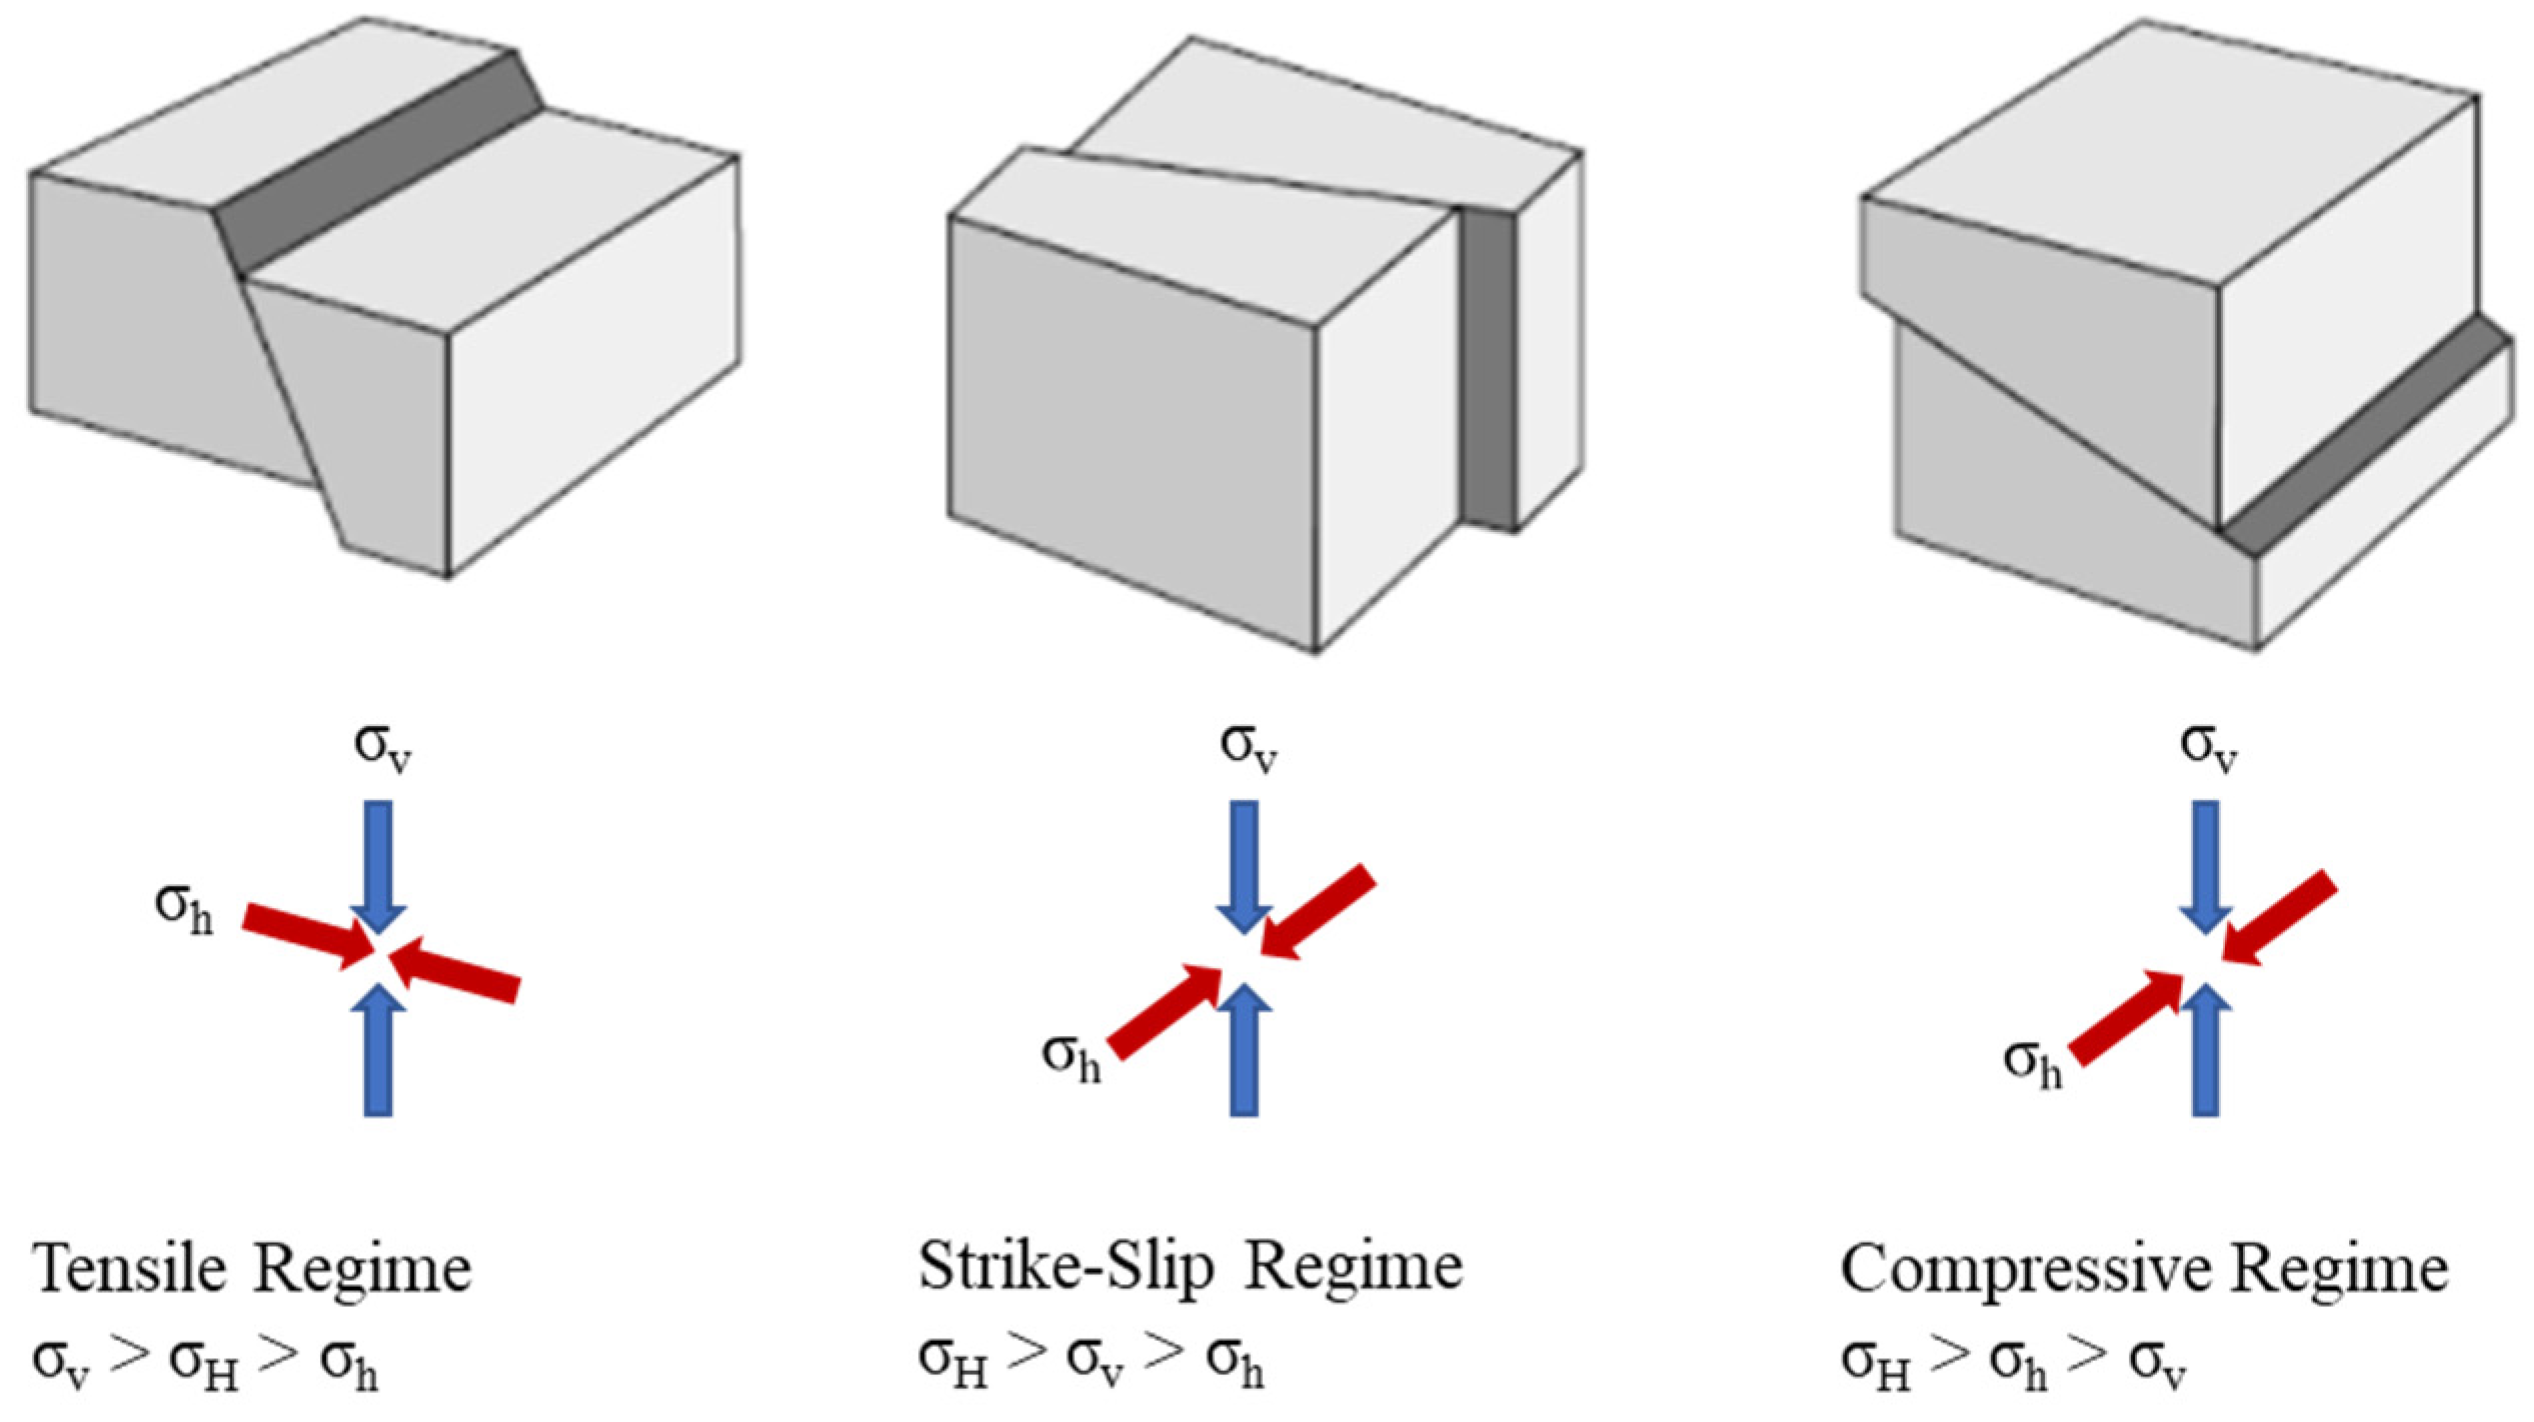
3.2. Stress and Pressure Determination

This section describes the pressure and stress of the GHSZ and the FGZ at the VR. It also explains the method to calculate the gas column height of the FGZ and the minimum gas saturation within the FGZ required to open fractures through the GHSZ towards the seafloor. The total vertical stress is calculated by integrating wet bulk density data with depth. The wet bulk density data, parameterized in terms of porosity (Equation (2)), are used to estimate total vertical stress (Equation (3)). Assuming the pore fluid to be water and water pressure as hydrostatic (Equation (4)), the vertical effective stress is obtained by subtracting the water pressure from the total vertical stress (Equation (5)).
ρ b u l k = 1 φ ρ m + φ ρ w
σ v z = 0 z g 1 φ τ ρ m + φ τ ρ w d τ
P w = ρ w g z
σ v z = σ v z P w = 0 z g ρ m ρ w 1 φ τ d τ
where σv is the vertical effective stress in MPa, σv is the total vertical stress in MPa, Pw is the water phase pressure in MPa, g is the acceleration due to gravity in ms−2, ρbulk is the sediment bulk density in kgm−3, ρm is the sediment grain density in kgm−3 (2750 kgm−3), ρw is pore-water density in kgm−3 (1029 kgm−3), z is the depth below sea level in m and τ is the depth variable for integration.
We assume the shallow marine sediments to be linearly elastic media where tensile fractures form. The pore fluid pressure (Pf) must overcome the sum of the least principal stress (σ3) and tensile strength (T) of the sediment for favoring such fracture opening [12]. This study focuses on fracture opening by reactivating preexisting fractures and does not consider fracture propagation or any dynamic mechanical response once the fracture criterion is met. Irrespective of the opening, the fractures would still propagate vertically because of the decreasing vertical stress as sediment depth decreases [55]. Although the gas hydrate saturation at the BSR is quite low (<10%) [16], hydrate cementation still contributes to the strength of the rock [50,56]. The tensile strength and the minimum horizontal stress of the shallow sediments containing hydrate can be estimated by the method described in [15], where the VR-specific P-wave velocity estimates and Poisson’s ratio values [39] are used. The tensile strength in hydrate-bearing sediments was found to be roughly equal to 7–10% of the vertical effective stress, and the minimum horizontal effective stress (σh) is within 87–90% of the vertical effective stress. Here, we assume (1) tensile stress regime where the minimum horizontal stress is the least principal stress, (2) the P-wave velocities are affected by hydrates and hence the rock cementation effect is accounted for implicitly, and (3) water phase pressure is hydrostatic. Since (σh + T) value is roughly equal to the vertical effective stress, as a conservative estimate, the vertical effective stress is assumed to be the fracture criterion. The pore fluid pressure must overcome the total vertical stress to open fractures (Equation (6)). A similar fracture criterion has been used to study fracturing and seepage from comparable shallow marine hydrate accumulations [14,28,57,58].
P f > σ v
P-wave velocity analysis confirms the presence of a FGZ below the BSR [38,39,59]. This FGZ is assumed to be a water-wet porous medium which consists of water and gas phase. Since the gas phase pressure (Pg) is greater than the water phase pressure (Pw) (with pressure difference defined as the capillary pressure (Pc = PgPw)), it leads to situations where gas-driven fracturing occurs. At the BGHSZ, the gas phase pressure needs to overcome the vertical stress (σv) and open fractures for gas to migrate through the GHSZ. Although this fracture criterion works for gas-driven fractures at any depth within the sediments, this study is only interested in fracture opening from the BGHSZ. The relationship between capillary pressure and phase saturation depends on the grain size and pore geometry, amongst other factors, and is computed using the capillary pressure curves. These curves describe the changes in capillary pressure as gas displaces water in the pore space. Several studies constrained capillary pressure terms with grain size and porosity based on mercury intrusion capillary pressure measurements conducted on sediment samples of shallow marine sediments across the world and developed correlations as summarized in Daigle et al. [15]. This work parametrized capillary pressure with a Brooks-Corey capillary curve as shown in Equation (7) [60] and the correlations for capillary pressure terms in Equations (8)–(10).
P c S w = P g S w P w S w = P e S w S w r 1 S w r 1 λ
ln P e = 6.59 ± 0.584 1 φ + S w r f c 2.76 ± 0.224
ln λ = 1.64 ± 0.162 f c 0.921 ± 0.0774
S w r = 0.326 ± 0.022 f c 0.219 ± 0.103 + 0.0262 ± 0.00915 φ
where Pc is the capillary pressure in MPa, Pe is the capillary entry pressure in MPa, Sw is the water saturation, Swr is the irreducible water saturation, λ is the pore-size parameter. The equations are reported with ± 1 standard deviation (SD) since these are generalized equations and represent sediments across the world. The R2 for Equations (8)–(10) are 0.81, 0.47 and 0.81, respectively. The capillary pressure at the gas-water contact (GWC) is called the capillary entry pressure, Pe (Figure 3). This is the minimum capillary pressure necessary for the gas to displace the pore water to form an interconnected phase. Beneath the GWC, the pressure of the gas phase will be less than the capillary entry pressure (Pe) and hence will not exist as an interconnected phase, but as discontinuous gas bubbles trapped within pores. Figure 3 shows an example of pressure and stress at the VR.
The relation between the capillary pressure and the fracture criterion is expressed by first taking the gas phase pressure as pore fluid pressure as shown in Equation (11). The gas phase pressure can be rewritten as the sum of capillary pressure and water pressure as shown in Equation (12). Subtracting both sides by water pressure makes the vertical stress to be written as the vertical effective stress as shown in Equation (13). Hence, the gas saturation at which the capillary pressure exceeds the vertical effective stress is the minimum gas saturation required to open the fractures (estimated by simultaneously solving Equations (7) and (13)). The gas phase will favor porous flow through the matrix at all saturations greater than the mobility threshold [15]. Although the mobility threshold was reported to be around 0.1 based on the work of Schowalter [61], other researchers have reported a considerably lower value of 0.02 [13,57,62,63,64]. The mobility threshold is taken as 0.02 for this study where the gas saturation is given by Sg = 1 − Sw. Once the fractures are opened, the maximum size of the gas release is limited by the thickness of the gas column within the FGZ. The height of this gas column needed to open fractures (vertical stress as the fracture criterion) at the BGHSZ is calculated based on the methods discussed in other studies [11,28] as shown in Equation (14). Assuming capillary-gravity equilibrium below the BGHSZ, the gas saturation within the gas column can be linked through the capillary pressure curve (Equation (7)).
P g > σ v
P c + P w > σ v
P c > σ v
h = σ v P e g ρ w ρ g
where h is the height of the gas column in m and ρg is the gas density in kgm−3 calculated at BSR pressure and temperature conditions [21] with the equation of state mentioned at the NIST Webbook for methane [65,66]. The feedback between the above-mentioned factors and gas hydrate thermodynamics are not considered in this study [67,68].

4. Results and Discussion

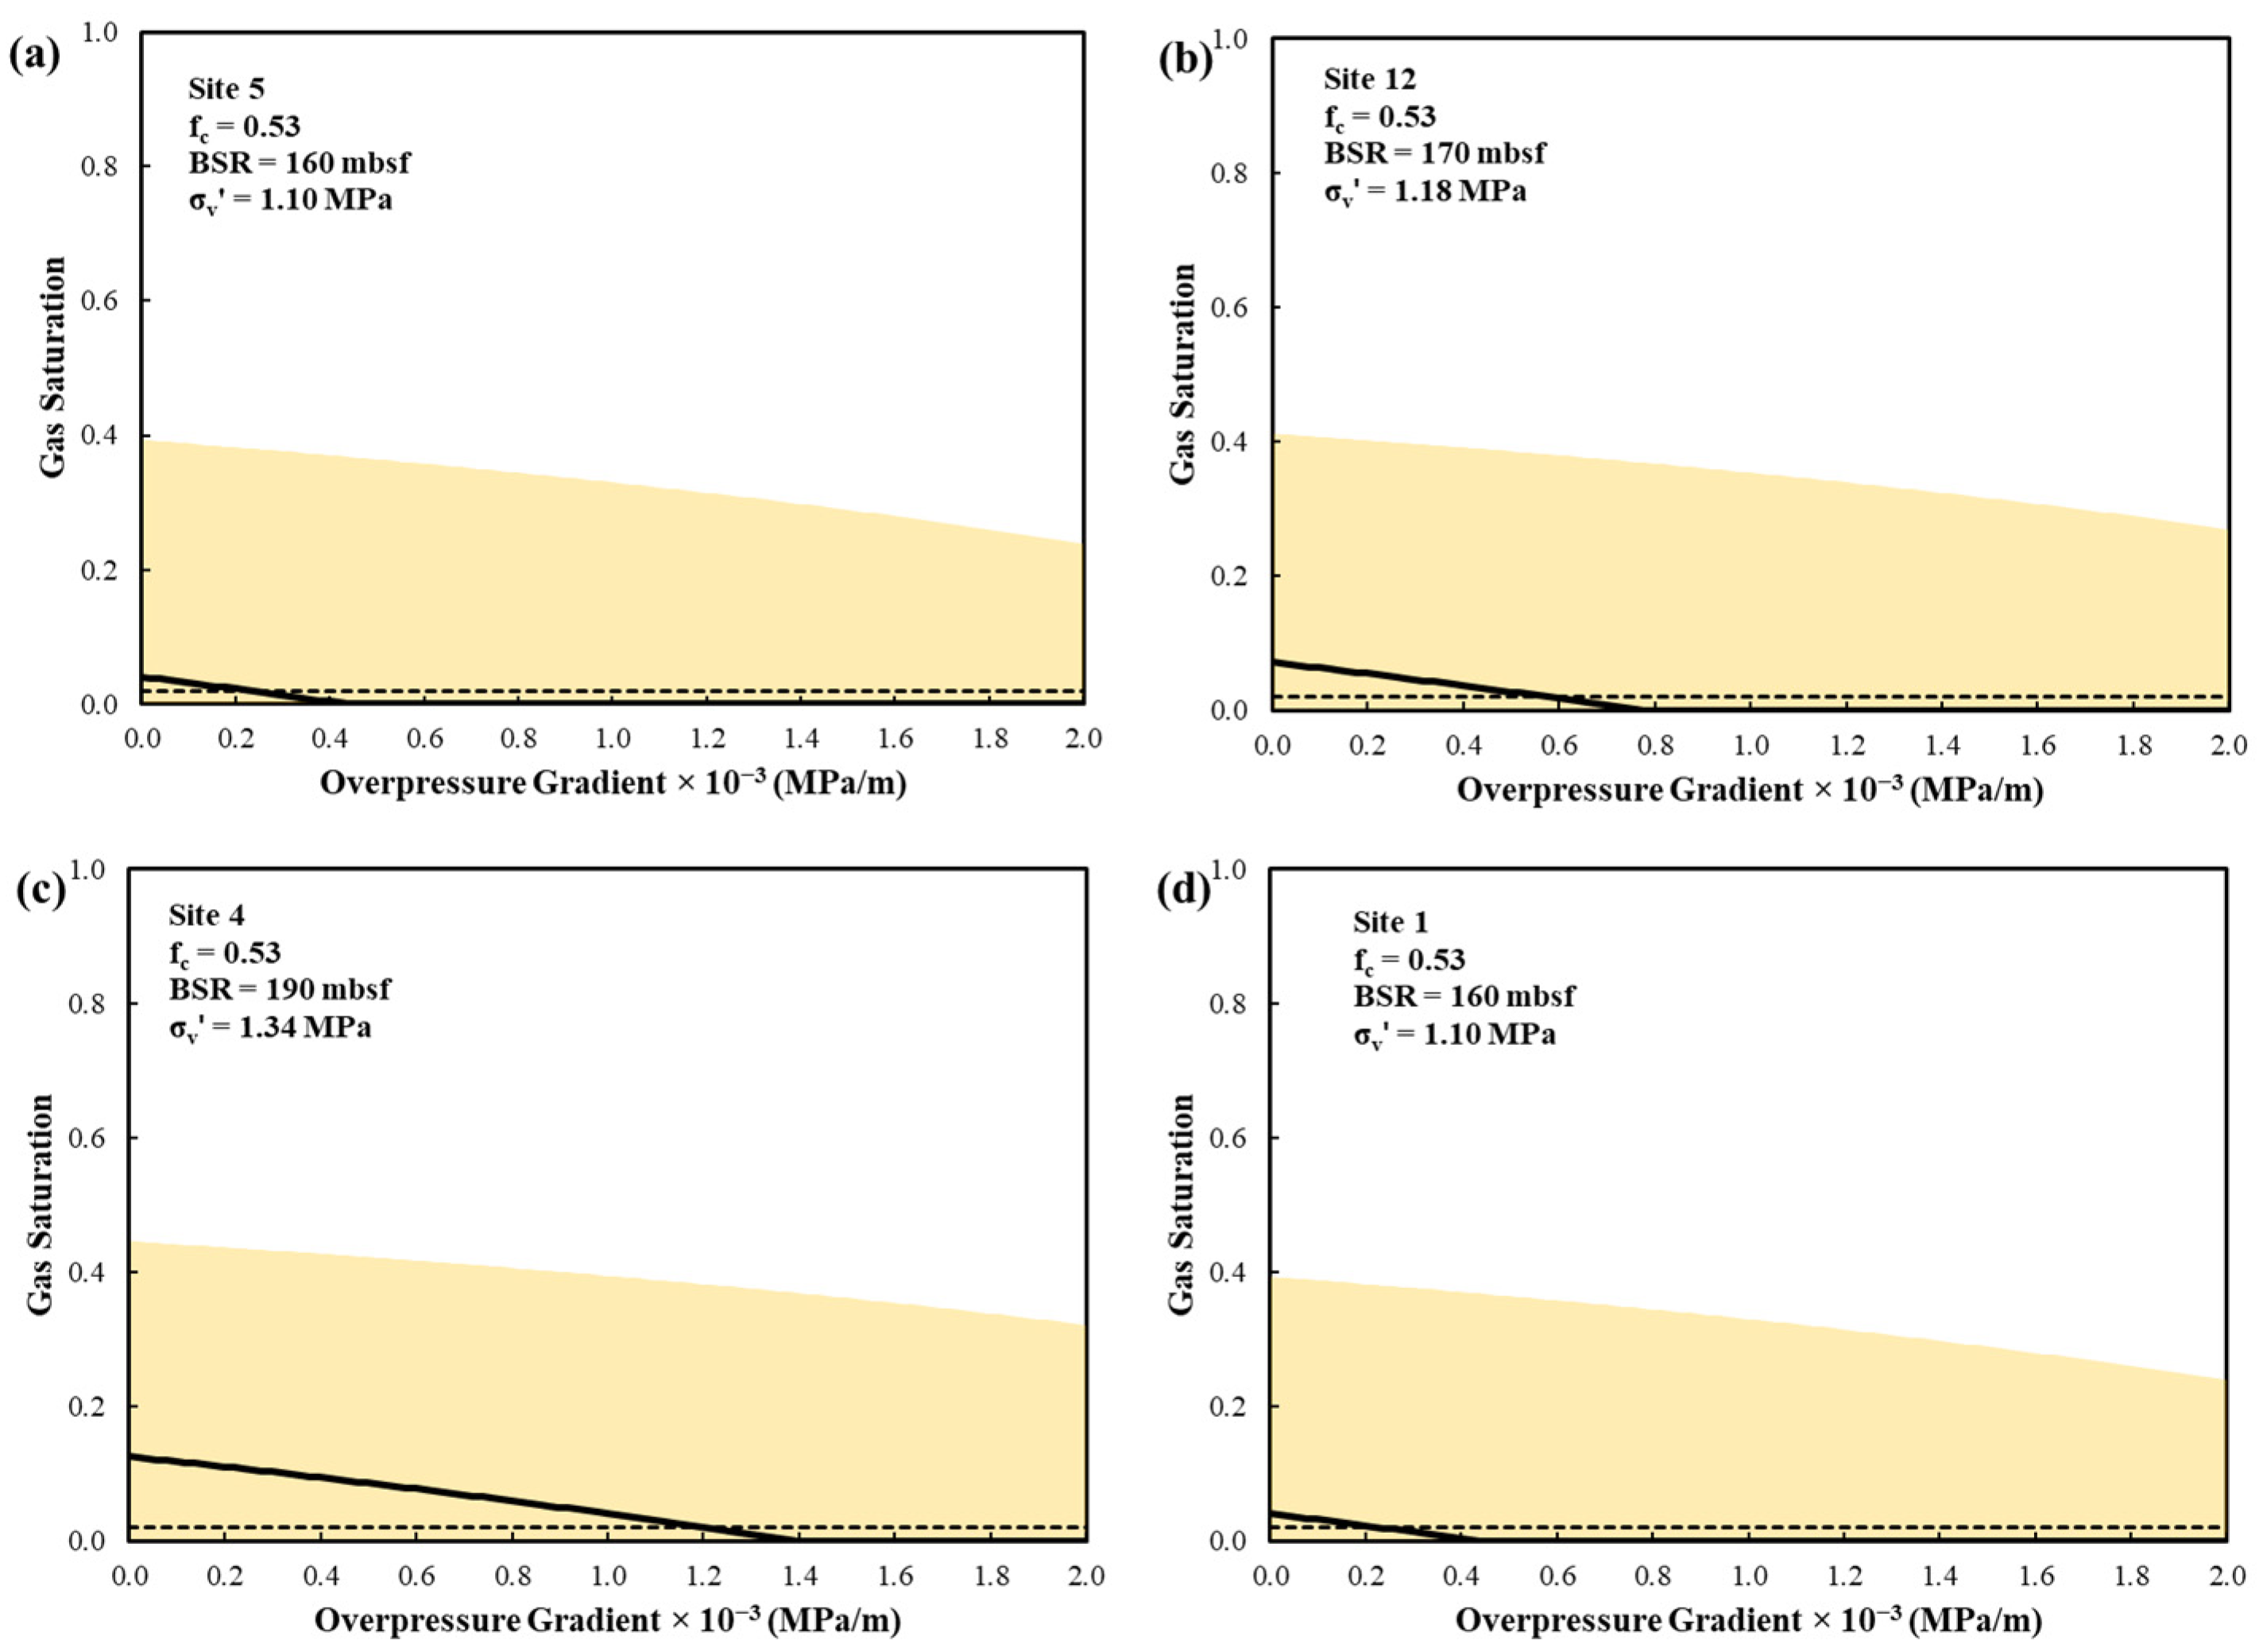
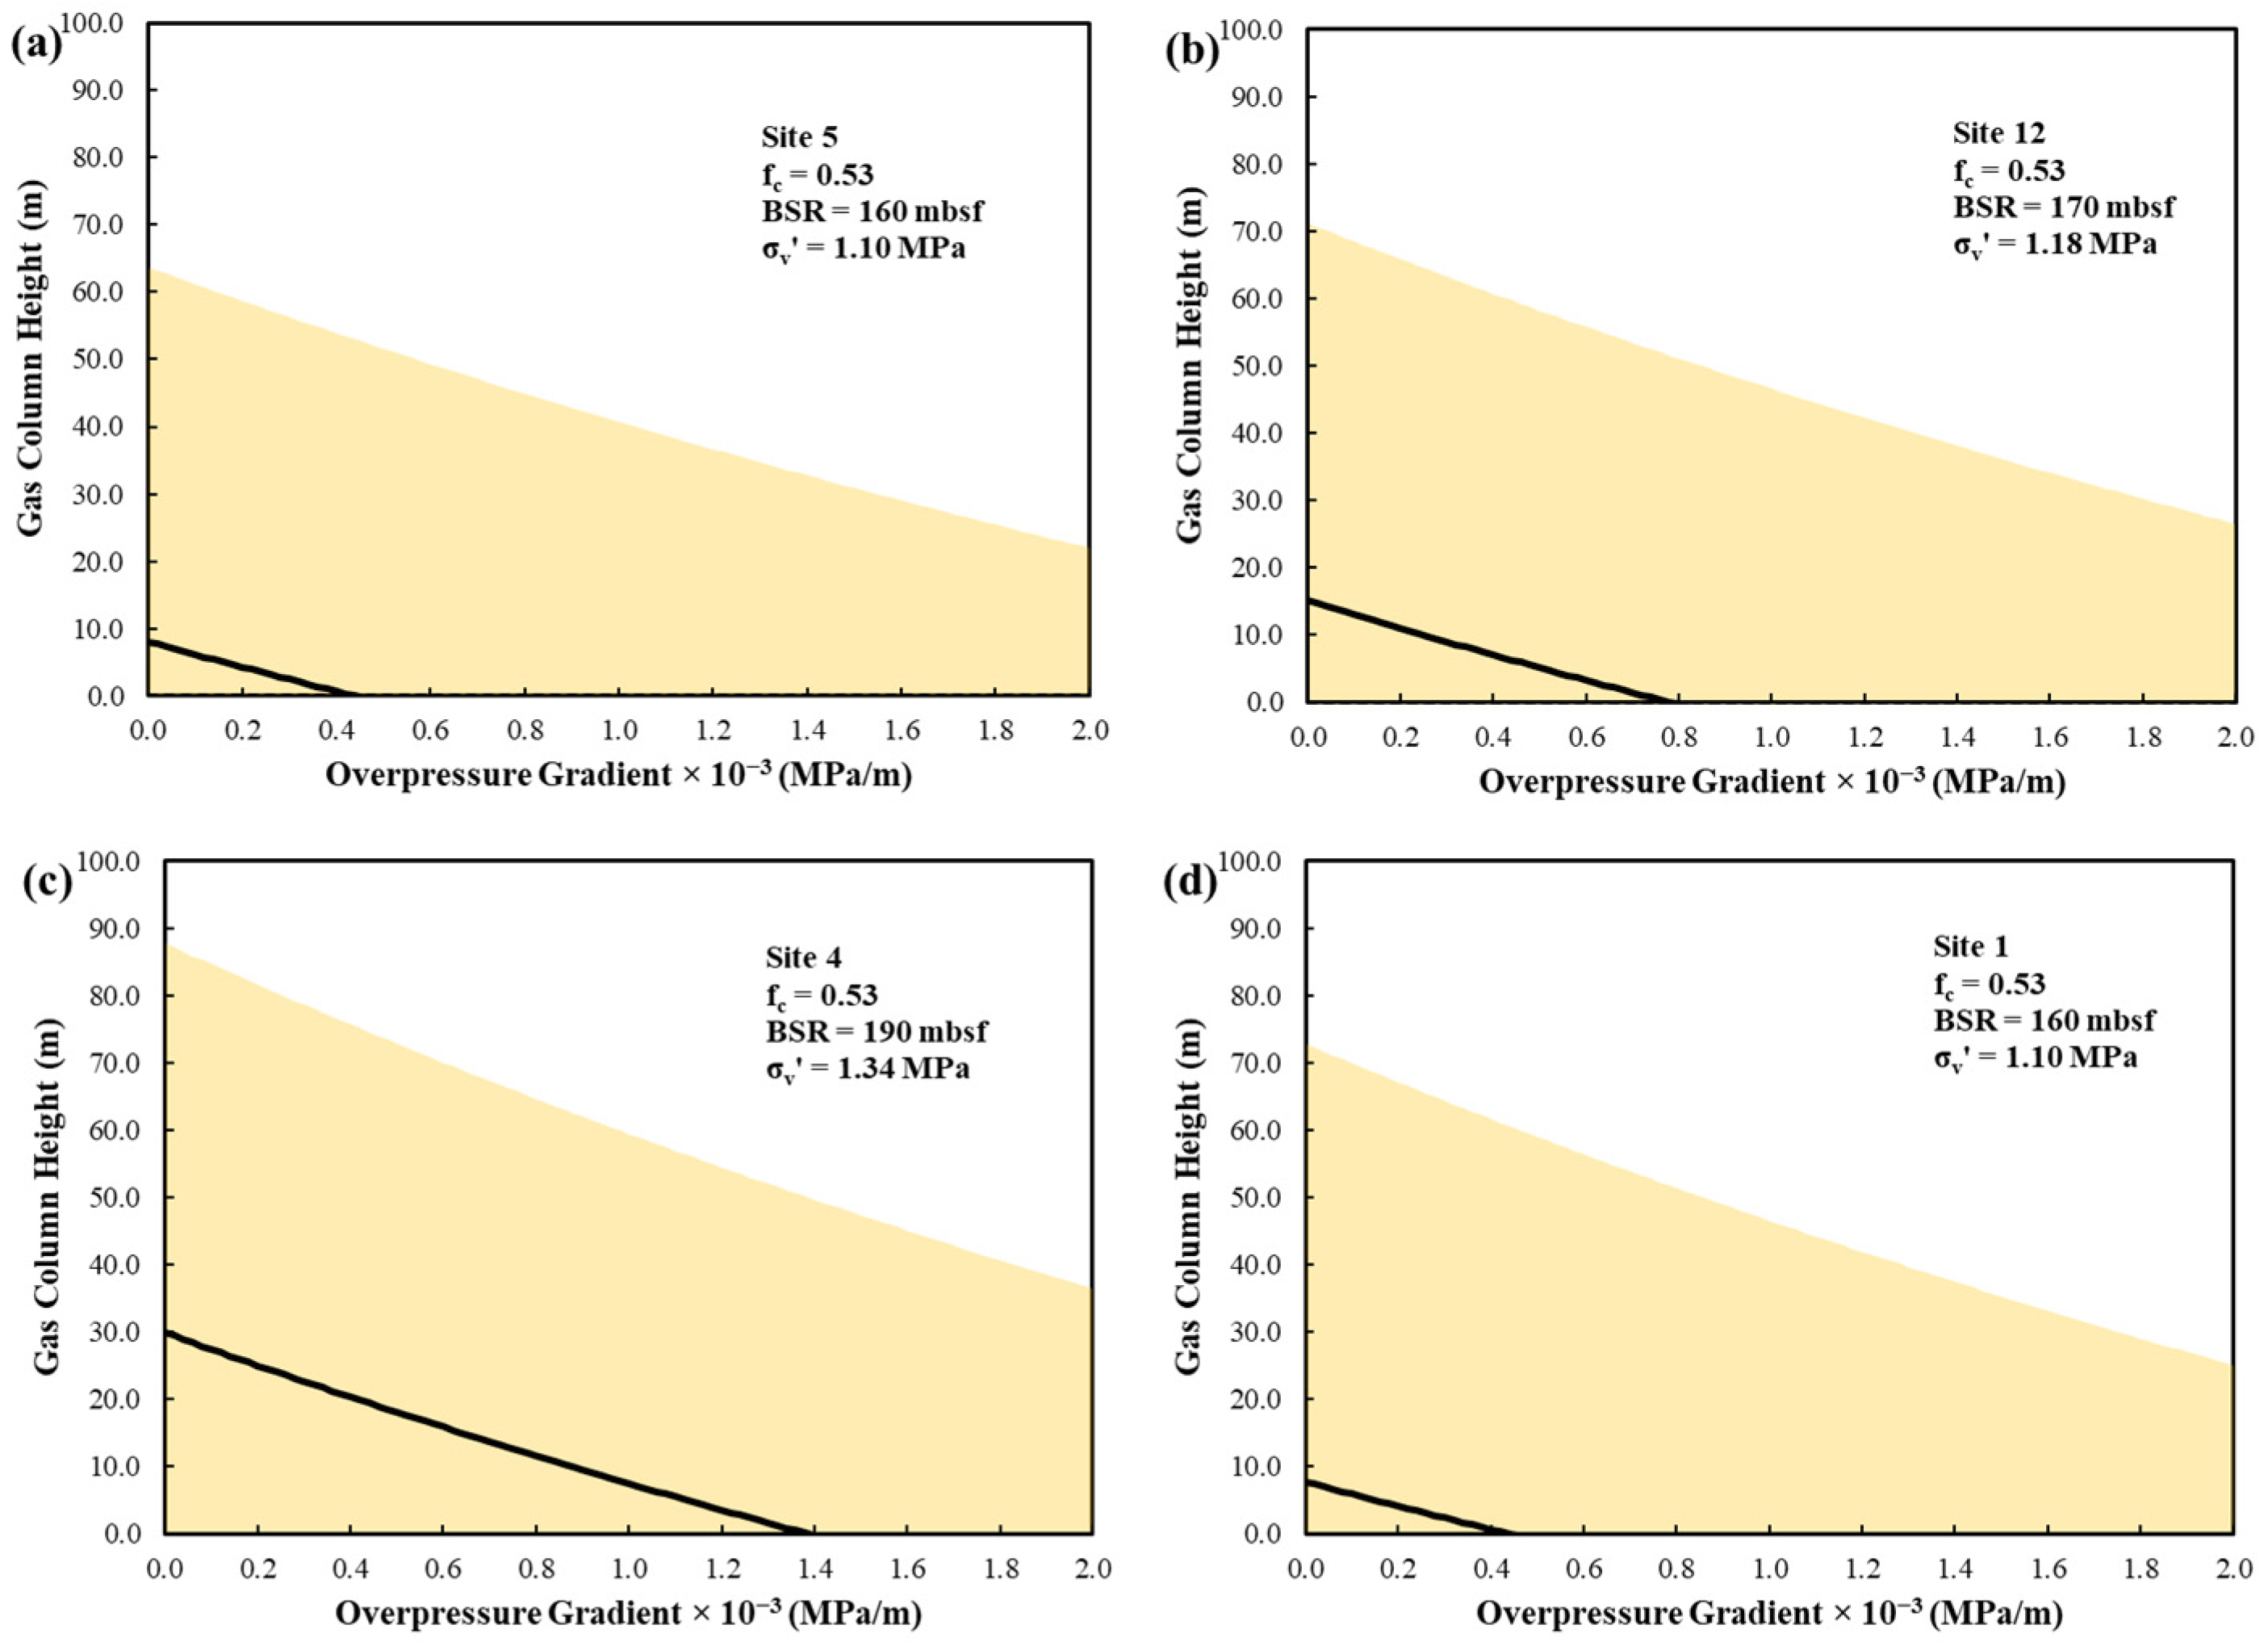
4.1. The Free Gas Zone

Our simulations start at the FGZ beneath the BGHSZ. At sites 5, 12 and 4, the FGZ is clearly visible in seismic data. It is characterized by high amplitude layers (Figure 2c) (i.e., some of the layers show higher amplitudes than surrounding strata) and lower seismic velocities (i.e., velocity decreases from >1700 m/s at overlying layers to <1500 m/s at the FGZ) [17,59,69]. Site 1 appears somehow disconnected from the fluid flow system along the VR. Although a BSR and high amplitude layers are still recognizable in seismic data, specifically at dipping layer segments, where up-dip fluid migration is promoted (Figure 2a,b), this site is characterized by a less developed FGZ. A strong lithological change (due to its proximity to the more glaciogenic continental shelf) and structural variations result in different fluid flow dynamics at Site 1 when compared with other sites on the VR.
BSR maps from previous studies [21,42] are used as the basis for establishing the BGHSZ for our analysis (Table 1). For the three sites located along the VR (sites 5, 12 and 4), the BSR depths increase progressively from east (site 4) to west (site 5) as shown in Figure 4. The FGZ is at a greater depth in the west (site 5) and this depth decreases as we move east (Site 4). Gas, owing to its lower density compared to the aqueous phase (i.e., buoyancy effect), accumulates preferentially beneath the BGHSZ at structural highs. Site 4 is located at one such structural high on the eastern VR [18] and its FGZ (shallowest depth from the sea level when compared with other sites) seems to be the preferential focus for gas accumulation (Figure 4). This zone sustains continuous seepage as reported by several authors [16,18,19] and such buoyancy-driven accumulation facilitates methane seepage as observed at other marine gas hydrate systems such as the Horizon A reservoir at South Hydrate Ridge [14].

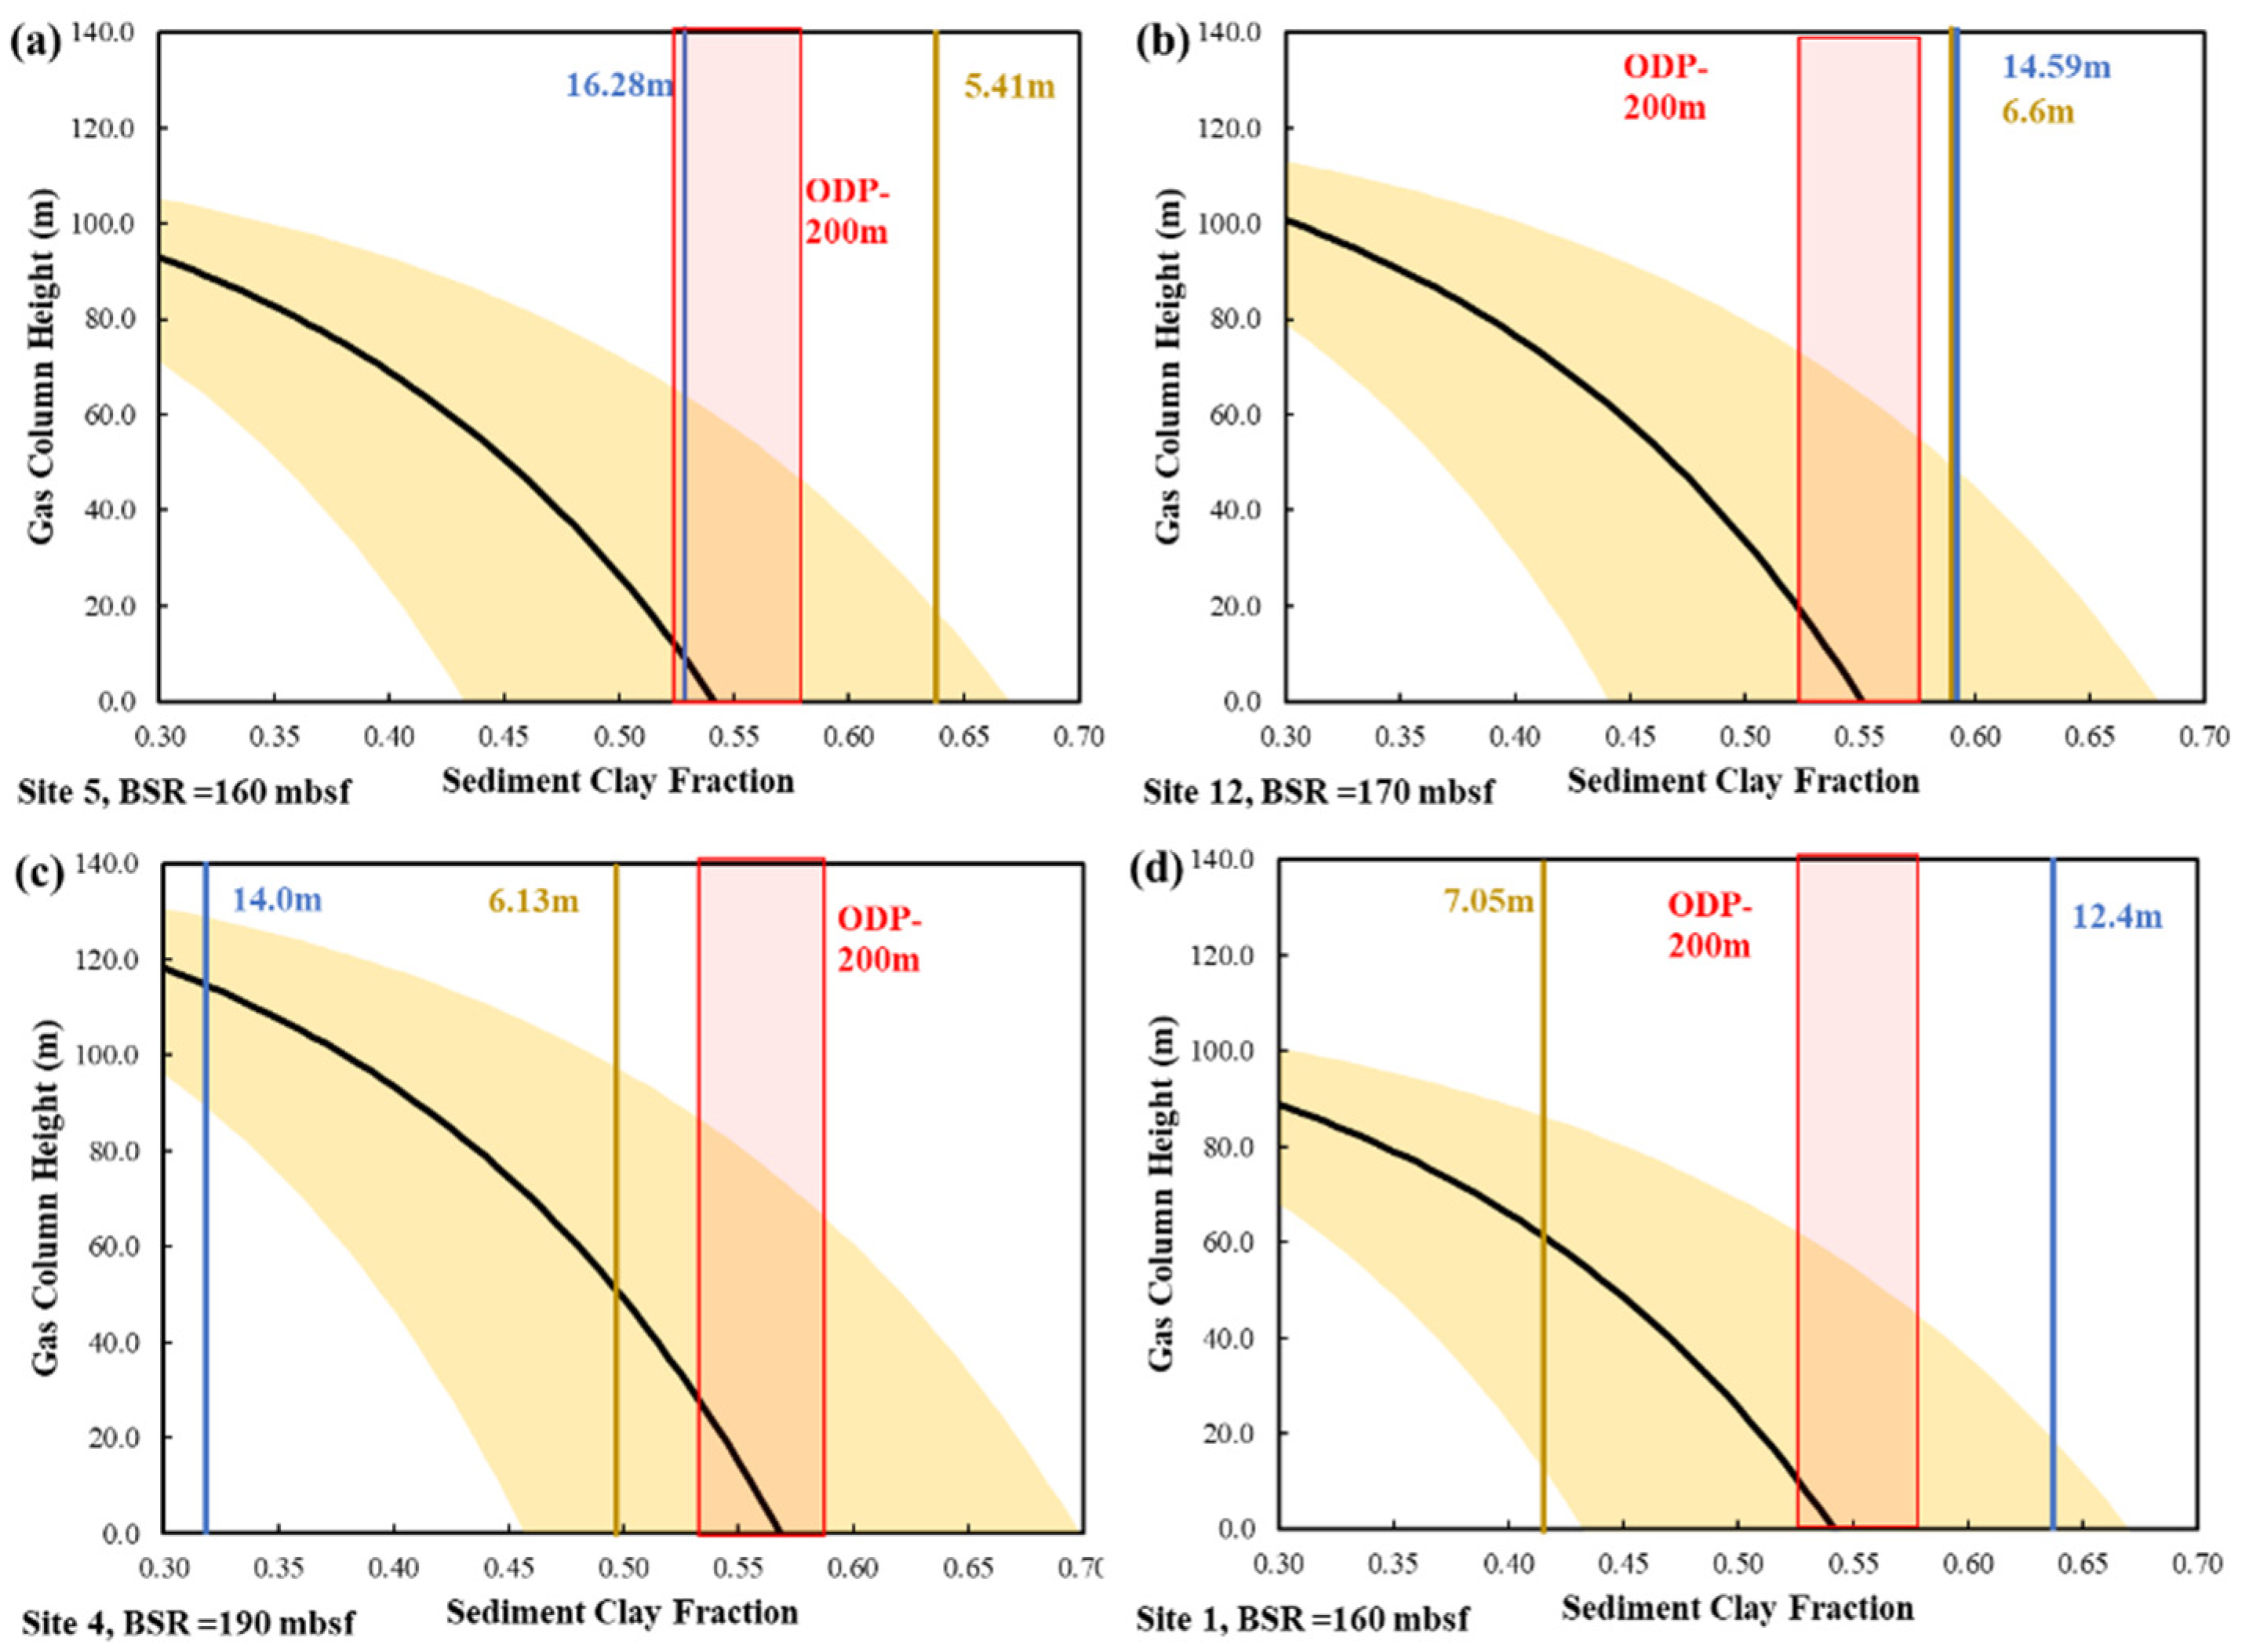
4.2. Base Case Analysis

This section presents the results of gas column height and minimum gas saturation required to open fractures at the BGHSZ for the four investigated sites (Figure 5). Fractures were assumed to originate from the BGHSZ towards the seafloor. The vertical effective stress at the respective BSR depths was taken as the fracture criterion for the four sites. Site 4 has the deepest BGHSZ with respect to the seafloor and the highest fracture criterion (i.e., 1.34 MPa). Site 5 and Site 1 have the lowest fracture criteria (i.e., 1.1 MPa). The fracture criterion at BSR depth for Site 12 is estimated to be 1.18 MPa. The porosity predicted with Equation (1) at the BSR depth for Site 12 is 0.531, for Site 4 is 0.523 and for Site 1 and Site 5 is 0.535. A constant sediment clay fraction (fc) of 0.55 is used in this section. Figure 6a shows the capillary entry pressure for all 4 sites along with the fracture criterion. The median capillary entry pressure for Site 12 is 1.17 MPa, and almost equal to the fracture criterion (Pe = 1.17 MPa, σv = 1.18 MPa). Similarly, for Site 1 and Site 5, the median capillary entry pressure is 1.15 MPa, which is greater than the fracture criterion at Site 1 and Site 5 (Pe = 1.15 MPa, σv = 1.1 MPa).
From the capillary curve (Sites 5, 12 and 1), Figure 5a,b,d, the fracture criterion either intersects the median capillary pressure curve close to zero gas saturation (Site 12) or below the median capillary pressure curve (Site 1 and 5). Figure 6c shows the gas saturation predictions (intersection points from Figure 5) for all 4 Sites. The minimum gas saturation (median prediction) required to open fractures for Site 1 and 5 is 0.0 and for Site 12 is 0.005. Figure 6b shows the gas column height (from Equation (14)) of the FGZ needed open fractures. Only Site 12 has median gas column height (0.8 m) greater than zero when compared to Site 5 and Site 1. The results indicate that these sites are critically pressured where very small gas saturations are enough to open fractures.
Site 4, located close to active venting pockmarks, has different predictions when compared with the other sites. The median capillary entry pressure for Site 4 is 1.2 MPa, and nearly equal to the fracture criterion (Pe = 1.2 MPa, σv = 1.34 MPa). The minimum gas saturation (median prediction) required to open fractures is 0.06 and the median gas column height is 15.01 m. The results presented for Site 4 agree well with the gas trap height of ~13 m below the BSR predicted using a petroleum system modeling approach for VR [54] and the reported gas saturations of 0.04 below the BSR (from velocity analysis by regional studies [16,59]. The minimum gas saturation required (0.06) to open fractures is slightly greater than the assumed gas mobility threshold of 0.02 and hence prefers porous flow. For the same calculation, fracturing becomes likely for sediments with higher gas mobility threshold (0.1) reported based on the work of Schowalter [61]. Hence, lower gas mobility threshold presents a conservative fracture opening prediction when compared with higher gas mobility threshold. Gas flow experiments on sediments from the VR will help ascertain the exact value for the gas mobility threshold and constrain our analysis.
The gas saturation buildup within the FGZ will depend on the rate of gas generated/entering the zone below the BSR and the sediment permeability which controls the rate of gas flow out of it [51]. Gas saturation buildup is a likely scenario at the VR since the type of sediments found here are typically of low permeability (<10−17 m2), when compared to other margins [70]. Fracturing is favored once the gas saturation reaches the required value to open fractures. The gas will migrate through the GHSZ towards the seafloor through these recently opened fractures with some of the gas dissolving and forming hydrates within the GHSZ. This mechanism has been proposed to explain the increase in gas hydrate thickness inside the GHSZ [58,71]. Similar observations were made at the active Lunde and Lømvi pockmarks near Site 4 [16,18,19,20] and other hydrate systems around the world [11,28,55,57,72]. Once opened, fractures remain open until all the gas phase is exhausted below the BGHSZ [10,57,73]. This scenario is consistent with observations from Site 4 where seepage is expected to be sustained for a long time. Once the gas is exhausted in the FGZ, the systems undergo a buildup phase until the gas phase pressure overcomes the fracture criterion potentially setting up a venting phenomenon that is episodic. The maximum size of each venting release is limited by the gas column height of, and gas saturation within, the interconnected gas column before opening fractures.
The analyses presented here reveal the importance of capillary pressure and its influence on fracturing opening conditions. Accounting for capillary influences shows that lower gas saturations (<0.1) and shorter gas column heights (<15 m) are sufficient to open fractures (Figure 5), even for deep (>1000 mbsl) marine hydrate deposits such as the VR. For instance, neglecting the capillary entry pressure in Equation (14), the gas column height required to open fractures for Site 4 is ~150 m. This is nearly 10 times greater than the median prediction of 15.01 m taking the capillary influence into account, even greater than the uncertainties presented in the model. Such inaccurate predictions would not only overestimate the amount of gas present in the FGZ, but they also lead to overpredictions of the gas fluxes during venting episode. This has implications for quantitative modeling of seafloor methane-related ecosystem processes.
The calculation presented here only comments on the estimates of the gas saturation and column height required to open fractures and not on how the gas saturation is attained below the BGHSZ. Although high R2 values for Equations (8)–(10) (Section 3.2) indicate the median predictions are reasonably representative, the uncertainties presented in these results are still by virtue of the generalized capillary pressure model used in the analysis [15] due to the lack of capillary pressure and gas flow experimental results for sediments from the VR. Other sources of uncertainty are related to the assumption made with the calculations shown here such as the constant sediment clay fraction assumption from the seafloor to BSR, porosity model from ODP wells in neighboring area, lack of compaction-related overpressure data within the sediments and the impact of varying stress regimes along the VR. These factors are discussed in the following sections.

4.3. Effect of Sediment Clay Fraction on Fracturing Predictions

The gas saturation and column height predictions for the four sites made in the previous section were based on the constant sediment clay fraction assumption of 0.55. However, the assumed clay fraction has some uncertainties as shown in Figure 7b. The sediment clay fraction has a direct impact on the capillary pressure terms as shown in Equations (8)–(10) and indirectly on porosity (this effect is not explored in this study). We performed a simple test with a range of sediment clay fractions and their effect on minimum gas saturations to open fractures (Figure 8) and the gas column height (Figure 9).
The median prediction for minimum gas saturation required to open fractures lie between 0.03 and 0.00 for Site 5 and 0.07 and 0.00 for Site 12 in the western segment of the ridge corresponding to the sediment clay fraction variation from 0.53 to 0.57, respectively, as shown in Figure 9. Similarly, low gas saturation (0.03 to 0.00) is required to open fractures at the easternmost location, Site 1, and a bit higher (0.13 to 0.00) at Site 4. The gas saturation required to open fractures nears zero as the sediment clay fraction becomes greater than 0.57. The median gas column height prediction for Site 5 is 8 to 0 m corresponding to a sediment clay fraction variation from 0.53 to 0.57 as shown in Figure 9. The median gas column height prediction for Site 12 is 15 to 0 m, for Site 4 is 29.8 to 0 m, and for Site 1 is 7.7 to 0 m. This analysis shows that the minimum gas saturation required to open fractures and the gas column height of the interconnected gas phase decreases with the increase in the sediment clay fraction. Lower sediment clay fraction allows for thicker gas accumulations with larger gas saturations. This could explain certain regions within the ridge where substantial gas saturations (in the western segment near Site 5 and 12) [16,17,59] are present without opening fractures. The capillary entry pressure increases when there is more clay in the sediment (Figure 7a), as a result, the sediment fractures easier at lower gas saturations and shorten gas column heights.
The sediment clay fractions reported in Table 1 from index tests performed on the upper 20 m of the sediments is compared with the ODP data (Figure 7b). If we assume these sediment clay fraction values remain constant until the BGHSZ, the corresponding minimum gas saturation (Figure 8) and gas column height (Figure 9) required to open fractures is shown by the blue and dark yellow lines. For sediment clay fraction values greater than the ODP data (>0.57), the capillary entry pressure (median prediction) is so high (>1.4 MPa) (Figure 7a) that the fractures open at the mere presence of gas. The minimum gas saturation and gas column height required to open fractures increased with the decrease in sediment clay fraction below the ODP data (<0.53). For instance, using the sediment clay fraction value of 0.32 (14 m, Site 4) at the BGHSZ, the minimum gas saturation (median prediction) required to open fractures is 0.42 and median gas column height is 115 m. This result shows the importance of accurate knowledge of sediment clay fractions since a 40% reduction in sediment clay fraction value from ODP data (0.55) would increase the minimum gas saturation and gas column height required to open fractures by up to eight times. Recovering sediments from depth up to the BGHSZ would better constrain the sediment clay fraction values at the VR and consequently reduce uncertainties in the fracturing predictions. Although there were thin sections of sediments that were silty than clayey in the ODP well logs, the sediment clay fraction largely followed the same trend of being clay rich at depths greater than 150 mbsf and these results agreed well (Section 3.1) with the age-depth-lithology model for the VR [54]. The sediment clay fraction from the western segment (Site 5 and 12) of the ridge is consistently greater than the 0.5 which agrees better with the ODP data. Since the eastern segment (Site 4 and 1) has been subjected to active venting, sediment remobilization could affect the sediment clay fraction distribution locally. Similar observations were made at the upper 10 s of meters at other sites [49,51]. Interestingly, palaeoceanographic proxies on gravity cores from the eastern VR segment document erosion of the Holocene in the sediment [47] and subsequent variations in sediment clay fraction. The decrease in sediment clay content in this part of the ridge may be related as well to the strength and pattern of the ocean bottom currents in the region.

4.4. Effect of Porosity on Fracturing Predictions

The porosity predicted from Equation (1) is used to estimate the capillary pressure curves (Equation (7)) and the fracture criterion (Equation (5)) at the BSR. The porosity model used was calibrated with ODP data from neighboring areas (Section 3.1). Although they are the closest information we have, they are not necessarily the most accurate representation of the VR. Hence, a simple parametric analysis is performed to understand the impact of porosity on the minimum gas saturation required to open fractures and the gas column height (Figure 10).
The porosity relationship developed by [74] for marine clayey sediments was used to model porosity as a function of depth (z in mbsf) to compare with the existing model (Equation (1)). The equation is given as,
φ = 0.775 e z 1251
A constant sediment clay fraction (fc) of 0.55 is used. The vertical effective stress was estimated using the porosity model described in Equation (15). The vertical effective stress at the respective BSR depths (fracture criterion) for Site 4 is 0.87 MPa, for Site 1 and 5 is 0.71 and for Site 12 is 0.77 MPa. The porosity predicted with Equation (15) at the BSR depth for Site 12 is 0.676 for Site 4 is 0.665 and for Site 1 and Site 5 is 0.682. The porosity predicted with Equation (15) is considerably higher than Equation (1) (Figure 10e) and the fracture criterion is lower. The capillary pressure obtained as a function of gas saturation for all four sites is shown in Figure 10. Although the fracture criterion for the four sites is considerably smaller when compared to the base case analysis (Section 4.2) with porosity model described in Equation (1), that does not translate into increased likelihood of fracturing. On the contrary, the minimum gas saturation required to open fractures (median prediction) and the median gas column height prediction is considerably higher than the values predicted in the base case analysis. This is because the porosity affects the capillary pressure curve model too, specifically the capillary entry pressure (Equation (8)) and the irreducible water saturation (Equation (10)). The median capillary entry pressure for Site 4 from the base case analysis was 1.2 MPa whereas it is 0.69 MPa with porosity predicted from Equation (15). Hence, more gas saturation and larger gas column height are required to open fractures (when compared with Equation (1)), due to increased porosity resulting from the current model (Equation (15)). Porosity of the sediments is strongly controlled by the sedimentation rates and regional compaction behavior [75]. More porous sediments lead to gas accumulation before fracturing compared to less porous sediments which are critically pressured and overcome the fracture criterion even at near zero gas saturations. Hence, a well constrained porosity predictions will help reduce the uncertainties in the gas saturation and gas column height predictions.

4.5. Effect of Overpressure on Fracturing Predictions

Predictions from the model described in this study only take the overpressure from the gas column into account and neglect the effect of increased water-phase pressure from sedimentary and deposition behavior. Several mechanisms have been proposed to explain the presence of overpressure in sedimentary basins [76]. Some of the most common mechanisms are (1) disequilibrium compaction of compressible sediments due to rapid sedimentation and porosity loss [77], (2) tectonic compression of sediments due to sudden increase in tectonic stress over short periods of time [76], (3) gas column height with substantial amount of buoyant gas [78]. Other mechanisms include aquathermal expansion, diagenesis, reaction kinetics and hydrocarbon generation amongst several others [76,78]. A simple analysis is performed to calculate the impact of overpressure gradient (dP*/dz) on the minimum gas saturation (Figure 11) required to open fractures and the gas column height (Figure 12). Taking the overpressure gradient into account, the fracture criterion (Equation (13)) and the gas column height (Equation (14)) is rewritten as,
P c > σ v d P d z d B S R
h = σ v P e d P d z d B S R g ρ w ρ g + d P d z
where dP*/dz is the overpressure gradient in MPa/m and dBSR is the BSR depth in mbsf (Table 1). Due to the lack of any pertinent data, the overpressure gradient value is assumed for this analysis. The overpressure contribution at the BSR depth is calculated as the product of the assumed overpressure gradient and the BSR depth. As shown in the sediment clay fraction analysis (Section 4.3), the minimum gas saturation (median prediction) required to open fractures is greater than the gas mobility threshold for all Sites for a sediment clay fraction of 0.53 when compared with sediment clay fraction values of 0.55 (greater than gas mobility threshold only for Site 4). To clearly illustrate the effect of overpressure gradient on fracturing predictions a constant sediment clay fraction of 0.53 is used for the purpose of this analysis. This 0.53 value signifies the lower bound from ODP well logs data for all depths greater than 160 mbsf (Figure 7b). The overpressure contribution term at the BSR for a gradient of 0.5 kPa/m for Site 5 and Site 1 is 0.08 MPa, for Site 12 is 0.085 MPa and 0.095 MPa for Site 4. This contribution term is roughly ~8% of the vertical effective stress and the contribution term increases with the increase in the overpressure gradient. The fracture criterion is reduced by a factor of this overpressure contribution term (Equation (16)) making the fracture opening more likely when compared with no overpressure scenario. Consequently, the minimum gas saturation required to open fractures and the gas column height decreases for all the sites with the increase in the overpressure gradient as shown in Figure 11 and Figure 12. The values at the zero-overpressure gradient correspond to the pore pressures governed by hydrostatic pressures as shown in the base case analysis (Section 4.2). The overpressure gradient at which the median prediction for the minimum gas saturation required to open fractures reaches zero was highest for Site 4 and lowest for Site 1 and 5 (0.4 kPa/m for Site 1 and 5, 0.75 kPa/m for Site 12 and 1.35 kPa/m for Site 4). A rigorous analysis using sediment-compaction model with lab constrained sediment physical properties, sedimentation rates and ODP data will help predict realistic overpressure estimates for the VR and constrain our fracturing analysis [78,79].

4.6. Effect of Fracture Criterion on Fracturing Predictions

The previous analyses were performed assuming the vertical effective stress as the fracture criterion (Equation (13)). This assumption is a conservative estimate because the current approach predicts lesser likelihood of fracturing when compared with using the minimum horizontal stress as fracture criterion (since the minimum horizontal stress is lower than the vertical stress for most stress regimes). The current assumption does not explicitly account for the stress regime of the ridge, the tectonic contribution to the stresses owing to its proximity to mid-oceanic ridges, or the hydrate cementation contribution amongst several other factors. Since the gas hydrate system in question is within the upper 200 m within the sedimentary column, it is natural to assume that the vertical stress is the maximum principal stress. However, the location of the VR over oceanic crust and its proximity to oblique spreading mid-ocean ridges makes this a particular geological setting where the stress regime remains poorly understood. Analytical tectonic stress modeling in the region suggests that the eastern VR segment may be in in a more tensile stress regime (i.e., due to its proximity to the northward termination of the Knipovich Ridge; Figure 1a) and the western segment of the ridge in a more strike-slip regime (i.e., due to its proximity to the Molloy Ridge; Figure 1a) [22,23]. A variation in the faulting pattern also suggests that there are variations in the stress regime and the pressure field that controls near-surface deformation and fluid dynamics on the eastern compared to the western VR segments [22]. Proxies from sediment cores and a correlation between inferred periods of maximum methane release from the seafloor and key glacial interglacial transitions suggest that glacial-related dynamics have influenced the stress regime in the region and triggered methane release events either associated with gas hydrate dissociation or with leakage form the reservoirs [23,80,81]. Under the assumption that the amount of horizontal forcing exerted along the ridge varies spatially and extends to the sedimentary cover, we perform a simple analysis by varying the fracture criterion to understand the impact of stress regime changes on fracture opening predictions.
Based on Anderson’s classification, the stress regimes can be defined as either tensile (σv > σH > σh), or strike-slip (σH > σv > σh) or compressive regime (σH > σh > σv) as shown in Figure 13. The value needed to overcome for opening fractures is the sum of the least principal stress and tensile strength of the sediment [12]. Irrespective of the fracture opening, the fractures would still propagate vertically because of the decreasing vertical stress as we move towards the seafloor from the BSR (stress gradient) [55]. The least principal stress is the vertical stress (σv) in the compressive regime and the minimum horizontal stress (σh) in the tensile and strike-slip regime. The vertical stress can be expressed in terms of the bulk density of the sediments (Equation (5)). The minimum horizontal stress can be expressed as a function of the vertical stress from Section 3.2 where the minimum horizontal effective stress is between 87–90% of the vertical effective stress for a tensile regime at the BSR depths. The minimum horizontal effective stress will be considerably higher than the tensile regime, reaching nearly 100% of the vertical effective stress for strike-slip regime since the vertical stress is the intermediate stress [76]. The tensile strength in hydrate-bearing sediments was found to be roughly equal to 7–10% of the vertical effective stress for fine grained and hemipelagic sediment comparable to that from VR (Section 3.2). Based on the rough estimates shown, the fracture criterion can be represented as a function of the vertical effective stress for all the stress regimes. For instance, the criterion required for opening fractures—(1) in the tensile regime would extend up to 95% of the vertical effective stress, —(2) lies between 95 to 105% of the vertical effective stress in the strike-slip regime and —(3) it is greater than 100% of the vertical effective stress in the compressive regime as shown in Figure 14e. Hence, the impact of stress regimes changes along the ridge on fracture opening predictions could be captured by a parametric analysis on the fracture criterion term by varying it from 85% to 115% of the vertical effective stress (at respective BSR depths for the four sites) (Figure 14).
As expected, the minimum gas saturation required to open fractures increases with the increase in fracture criterion (as a fraction of the vertical effective stress) (Figure 14). Porous flow is preferred over fracture driven venting at higher fracture criterions since the gas saturation required to open fractures is greater than the gas mobility threshold. Hence, the likelihood of fracture opening goes down with the increase in fracture criterion with the tensile regime being the more favorable for fracture opening and the compressive regimes being the less favorable criterion. The fracture criterion at which the minimum gas saturation required to open fractures is greater than the gas mobility threshold is 94% of the vertical effective stress for Site 1 and 5, 90% of the vertical effective stress for Site 12 and less than 85% of the vertical effective stress for Site 4. All these values fall within the tensile regime. This demonstrates that all sites favor opening fractures within the tensile stress regime. At fracture criterion of 100% of the vertical effective stress (strike-slip regime), the gas saturation required to open fractures is 0.04 for Site 5 and 0.07 for Site 12 in the western segment of the VR (Figure 14a,b). Similarly, at fracture criterion of 85% of the vertical effective stress (tensile regime), the gas saturation required to open the fractures is less than 0.01 for the same Site 5 and Site 12 (Figure 14a,b). Hence, higher gas saturations are required to open fractures at typical fracture criterion for strike-slip regime conditions suggested for the western VR segment [23] compared to a criterion assuming a tensile stress regime. The results from velocity analyses indicate the gas saturation within the FGZ is around 0.02 in the western segment of the ridge [17]. The gas saturations reported in the western segment (Site 5 and 12) of the ridge would then be below the minimum gas saturation required to open fractures for typical strike-slip conditions as predicted here. Such conditions favor porous flow instead of fracture opening. Seeping methane does reach seafloor in porous flow conditions, but they take considerably longer times and in rates quite small that they are harder to identify [55].
The results from velocity analyses indicate the gas saturation within the FGZ is around 0.04 in the eastern segment of the ridge [16,39,82]. At fracture criterion of 100% of the vertical effective stress (strike-slip regime), the gas saturation required to open the fractures is 0.04 for Site 1 and 0.13 for Site 12 in the western segment of the VR (Figure 14c,d). Similarly, at fracture criterion of 85% of the vertical effective stress (tensile regime), the gas saturation required to open the fractures is less than 0.01 for the same Site 1 and Site 4 (Figure 14c,d). Hence, low gas saturations are enough to open fractures at typical fracture criterion for tensile regime conditions suggested for the eastern VR segment [23]. The gas saturations reported in the eastern segment (Site 1 and 4) of the ridge are higher than the minimum gas saturation required to open fractures for typical tensile regime conditions as shown in the numerical example here. Such conditions favor fracture opening and there is evidence of active methane seepage and venting near these sites.
The results presented here show the stress regimes may play a major role in constraining the fracture opening predictions across the VR with the gas saturation requirement to opening fractures increasing with the fracture criterion. This result may explain why seepage is restricted to the eastern part of VR at present day [16,18,19]. Although physical properties with very little overlap were used in the respective model approaches, the results shown here supports the notion that spatial variations in the stress regime along the VR may be affecting near-seafloor deformation and seepage dynamics as reported in previous studies [22,23]. The presented results are specifically sensitive to the sediment clay fractions and overpressure within the sediments amongst other factors. Increase in sediment clay fractions and pore fluid overpressures will make the fracture opening at saturations lower than the gas mobility threshold more likely, even at higher fracture criteria.

5. Conclusions

The modeling approach presented here helps constrain the gas saturation and gas column height of the FGZ required to open fractures at the BGHSZ towards the seafloor along the sedimentary VR on the west-Svalbard margin. Our results indicate that the VR becomes a critically pressured system once sufficient gas is present, where the gas seepage occurs through fractures opened by the gas phase trapped at the BGHSZ. The FGZ with a gas column height <15 m and gas saturation less than 0.1 is enough to open fractures at the BGHSZ. The gas saturation and column height estimates are a limit for the volumes of free gas trapped below the BGHSZ as the gas is rapidly transported to the seafloor once the fractures are opened, consistent with observations from the active seepage location (Site 4). Once exhausted, the systems undergo a buildup phase in the FGZ until the gas phase overpressure overcomes the fracture criterion setting up the possibility of episodic phenomenon. Ignoring capillary pressure results in the size of the gas column being overestimated by up to 10 times. The use of these incorrect predictions would not only overestimate the quantity of gas within the FGZ, but also lead to alarming overpredictions of the size of venting episodes and their associated effects on the ocean biosphere.
The results show that lower sediment clay fraction allows for thicker gas accumulations with larger gas saturations at the BGHSZ. This could explain certain regions within the ridge where substantial gas saturations (in the western segment, Sites 5 and 12) are present without opening fractures. The results from the sediment clay fraction analysis indicate when there is more clay in the sediment, the sediment fractures easier at lower gas saturations and shorter gas column heights. The key observation from overpressure analysis is that overpressure decreases the fracture criterion and necessitates less gas saturations and column heights to open fractures. Porosity was found to affect the capillary pressure predictions as well as the total vertical stress predictions which lead to non-linear gas volumes prediction with the increase in porosity. Overall, no major differences are observed across the different sites of the VR when it relates to sediment clay fraction and overpressure analysis. However, the fracture criterion analysis shows the stress regime changes due to tectonic forcing have the potential of driving differences in venting across the ridge. A rigorous analysis using a sediment-compaction model with lab constrained sediment physical properties, sedimentation rates and ODP data will help predict realistic overpressure estimates, porosity, and sediment clay fraction for the VR and constrain our analysis. The physical processes illustrated here improve our understanding of the current seepage distribution and future seepage potential along the VR. The modeling approach presented in this work can be applied to other comparable marine gas hydrate systems at continental margins but would require detailed regional description and knowledge of several parameters. However, due to the clayey nature of most marine sediments, the capillary influences would lead to predicting lesser amounts of gas required to open fractures.

Author Contributions

H.R.—conceptualization, methodology, formal analysis, investigation, visualization, writing—original draft preparation; A.P.-F.—data curation, formal analysis, funding acquisition, supervision, writing—original draft preparation, writing—review and editing; H.D.—methodology, formal analysis, writing—review and editing. All authors have read and agreed to the published version of the manuscript.

Funding

This work is part of the SEAMSTRESS project, and it is supported by grants from the Tromsø Research Foundation (project nr. A31680) and the Research Council of Norway (project nr. 287865). The work is also supported by the Research Council of Norway through its Centers of Excellence funding scheme grant nr. 223259 (Centre for Arctic Gas Hydrate, Environment and Climate—CAGE).

Institutional Review Board Statement

Not applicable.

Informed Consent Statement

Not applicable.

Data Availability Statement

The ODP dataset used in this study can be found at: https://web.iodp.tamu.edu (accessed on 21 April 2022).

Acknowledgments

Geophysical data used for describing the geological setting were acquired on board R/V Helmer Hansen over numerous expeditions to the area. We are thankful to the ship crew and to the scientific crew for data acquisition and processing. We thank the anonymous reviewers and academic editor for the constructive feedback that helped improve the final publication.

Conflicts of Interest

The authors declare no conflict of interest.

References

  1. Skarke, A.; Ruppel, C.; Kodis, M.; Brothers, D.; Lobecker, E. Widespread Methane Leakage from the Sea Floor on the Northern US Atlantic Margin. Nat. Geosci. 2014, 7, 657–661. [Google Scholar] [CrossRef]
  2. Andreassen, K.; Hubbard, A.; Winsborrow, M.; Patton, H.; Vadakkepuliyambatta, S.; Plaza-Faverola, A.; Gudlaugsson, E.; Serov, P.; Deryabin, A.; Mattingsdal, R. Massive Blow-out Craters Formed by Hydrate-Controlled Methane Expulsion from the Arctic Seafloor. Science 2017, 356, 948–953. [Google Scholar] [CrossRef] [PubMed] [Green Version]
  3. Westbrook, G.K.; Thatcher, K.E.; Rohling, E.J.; Piotrowski, A.M.; Pälike, H.; Osborne, A.H.; Nisbet, E.G.; Minshull, T.A.; Lanoisellé, M.; James, R.H. Escape of Methane Gas from the Seabed along the West Spitsbergen Continental Margin. Geophys. Res. Lett. 2009, 36, L15608. [Google Scholar] [CrossRef] [Green Version]
  4. Dupré, S.; Scalabrin, C.; Grall, C.; Augustin, J.-M.; Henry, P.; Şengör, A.C.; Görür, N.; Çağatay, M.N.; Géli, L. Tectonic and Sedimentary Controls on Widespread Gas Emissions in the Sea of Marmara: Results from Systematic, Shipborne Multibeam Echo Sounder Water Column Imaging. J. Geophys. Res. Solid Earth 2015, 120, 2891–2912. [Google Scholar] [CrossRef] [Green Version]
  5. Römer, M.; Sahling, H.; Pape, T.; Bahr, A.; Feseker, T.; Wintersteller, P.; Bohrmann, G. Geological Control and Magnitude of Methane Ebullition from a High-Flux Seep Area in the Black Sea—the Kerch Seep Area. Mar. Geol. 2012, 319, 57–74. [Google Scholar] [CrossRef]
  6. Römer, M.; Sahling, H.; Pape, T.; Bohrmann, G.; Spieß, V. Quantification of Gas Bubble Emissions from Submarine Hydrocarbon Seeps at the Makran Continental Margin (Offshore Pakistan). J. Geophys. Res. Oceans 2012, 117, C10015. [Google Scholar] [CrossRef]
  7. Römer, M.; Riedel, M.; Scherwath, M.; Heesemann, M.; Spence, G.D. Tidally Controlled Gas Bubble Emissions: A Comprehensive Study Using Long-Term Monitoring Data from the NEPTUNE Cabled Observatory Offshore Vancouver Island. Geochem. Geophys. Geosyst. 2016, 17, 3797–3814. [Google Scholar] [CrossRef]
  8. Ostanin, I.; Anka, Z.; di Primio, R.; Bernal, A. Identification of a Large Upper Cretaceous Polygonal Fault Network in the Hammerfest Basin: Implications on the Reactivation of Regional Faulting and Gas Leakage Dynamics, SW Barents Sea. Mar. Geol. 2012, 332, 109–125. [Google Scholar] [CrossRef]
  9. Roberts, H.H.; Carney, R.S. Evidence of Episodic Fluid, Gas, and Sediment Venting on the Northern Gulf of Mexico Continental Slope. Econ. Geol. 1997, 92, 863–879. [Google Scholar] [CrossRef]
  10. Daigle, H.; Bangs, N.L.; Dugan, B. Transient Hydraulic Fracturing and Gas Release in Methane Hydrate Settings: A Case Study from Southern Hydrate Ridge. Geochem. Geophys. Geosyst. 2011, 12, Q12022. [Google Scholar] [CrossRef]
  11. Hornbach, M.J.; Saffer, D.M.; Holbrook, W.S. Critically Pressured Free-Gas Reservoirs below Gas-Hydrate Provinces. Nature 2004, 427, 142–144. [Google Scholar] [CrossRef] [PubMed]
  12. Jain, A.K.; Juanes, R. Preferential Mode of Gas Invasion in Sediments: Grain-Scale Mechanistic Model of Coupled Multiphase Fluid Flow and Sediment Mechanics. J. Geophys. Res. Solid Earth 2009, 114, B08101. [Google Scholar] [CrossRef]
  13. Liu, X.; Flemings, P.B. Dynamic Multiphase Flow Model of Hydrate Formation in Marine Sediments. J. Geophys. Res. Solid Earth 2007, 112, B03101. [Google Scholar] [CrossRef] [Green Version]
  14. Tréhu, A.M.; Flemings, P.B.; Bangs, N.L.; Chevallier, J.; Gràcia, E.; Johnson, J.E.; Liu, C.-S.; Liu, X.; Riedel, M.; Torres, M.E. Feeding Methane Vents and Gas Hydrate Deposits at South Hydrate Ridge. Geophys. Res. Lett. 2004, 31, L23310. [Google Scholar] [CrossRef] [Green Version]
  15. Daigle, H.; Cook, A.; Fang, Y.; Bihani, A.; Song, W.; Flemings, P.B. Gas-Driven Tensile Fracturing in Shallow Marine Sediments. J. Geophys. Res. Solid Earth 2020, 125, e2020JB020835. [Google Scholar] [CrossRef]
  16. Hustoft, S.; Bünz, S.; Mienert, J.; Chand, S. Gas Hydrate Reservoir and Active Methane-Venting Province in Sediments on <20 Ma Young Oceanic Crust in the Fram Strait, Offshore NW-Svalbard. Earth Planet. Sci. Lett. 2009, 284, 12–24. [Google Scholar] [CrossRef]
  17. Petersen, C.J.; Bünz, S.; Hustoft, S.; Mienert, J.; Klaeschen, D. High-Resolution P-Cable 3D Seismic Imaging of Gas Chimney Structures in Gas Hydrated Sediments of an Arctic Sediment Drift. Mar. Pet. Geol. 2010, 27, 1981–1994. [Google Scholar] [CrossRef]
  18. Bünz, S.; Polyanov, S.; Vadakkepuliyambatta, S.; Consolaro, C.; Mienert, J. Active Gas Venting through Hydrate-Bearing Sediments on the Vestnesa Ridge, Offshore W-Svalbard. Mar. Geol. 2012, 332–334, 189–197. [Google Scholar] [CrossRef]
  19. Smith, A.J.; Mienert, J.; Bünz, S.; Greinert, J. Thermogenic Methane Injection via Bubble Transport into the Upper Arctic Ocean from the Hydrate-Charged Vestnesa Ridge, Svalbard. Geochem. Geophys. Geosyst. 2014, 15, 1945–1959. [Google Scholar] [CrossRef] [Green Version]
  20. Panieri, G.; Bünz, S.; Fornari, D.J.; Escartin, J.; Serov, P.; Jansson, P.; Torres, M.E.; Johnson, J.E.; Hong, W.; Sauer, S.; et al. An Integrated View of the Methane System in the Pockmarks at Vestnesa Ridge, 79°N. Mar. Geol. 2017, 390, 282–300. [Google Scholar] [CrossRef] [Green Version]
  21. Plaza-Faverola, A.; Vadakkepuliyambatta, S.; Hong, W.-L.; Mienert, J.; Bünz, S.; Chand, S.; Greinert, J. Bottom-Simulating Reflector Dynamics at Arctic Thermogenic Gas Provinces: An Example from Vestnesa Ridge, Offshore West Svalbard. J. Geophys. Res. Solid Earth 2017, 122, 4089–4105. [Google Scholar] [CrossRef] [Green Version]
  22. Plaza-Faverola, A.; Bünz, S.; Johnson, J.E.; Chand, S.; Knies, J.; Mienert, J.; Franek, P. Role of Tectonic Stress in Seepage Evolution along the Gas Hydrate-Charged Vestnesa Ridge, Fram Strait. Geophys. Res. Lett. 2015, 42, 733–742. [Google Scholar] [CrossRef] [Green Version]
  23. Plaza-Faverola, A.; Keiding, M. Correlation between Tectonic Stress Regimes and Methane Seepage on the Western Svalbard Margin. Solid Earth 2019, 10, 79–94. [Google Scholar] [CrossRef] [Green Version]
  24. Stein, S.; Cloetingh, S.; Sleep, N.H.; Wortel, R. Passive Margin Earthquakes, Stresses and Rheology. In Earthquakes at North-Atlantic Passive Margins: Neotectonics and Postglacial Rebound; Gregersen, S., Basham, P.W., Eds.; Springer: Dordrecht, The Netherlands, 1989; pp. 231–259. ISBN 978-94-009-2311-9. [Google Scholar]
  25. Turcotte, D.L.; Ahern, J.L. On the Thermal and Subsidence History of Sedimentary Basins. J. Geophys. Res. 1977, 82, 3762–3766. [Google Scholar] [CrossRef]
  26. Turcotte, D.L.; Haxby, W.F.; Ockendon, J.R. Lithospheric Instabilities. In Island Arcs, Deep Sea Trenches and Back-Arc Basins; American Geophysical Union (AGU): New York, NY, USA, 1977; pp. 63–69. ISBN 978-1-118-66575-6. [Google Scholar] [CrossRef]
  27. Yao, H.; Hong, W.-L.; Panieri, G.; Sauer, S.; Torres, M.E.; Lehmann, M.F.; Gründger, F.; Niemann, H. Fracture-Controlled Fluid Transport Supports Microbial Methane-Oxidizing Communities at Vestnesa Ridge. Biogeosciences 2019, 16, 2221–2232. [Google Scholar] [CrossRef] [Green Version]
  28. Flemings, P.B.; Liu, X.; Winters, W.J. Critical Pressure and Multiphase Flow in Blake Ridge Gas Hydrates. Geology 2003, 31, 1057–1060. [Google Scholar] [CrossRef]
  29. Myhre, A.M.; Eldholm, O. The Western Svalbard Margin (74°–80°N). Mar. Pet. Geol. 1988, 5, 134–156. [Google Scholar] [CrossRef]
  30. Engen, Ø.; Faleide, J.I.; Dyreng, T.K. Opening of the Fram Strait Gateway: A Review of Plate Tectonic Constraints. Tectonophysics 2008, 450, 51–69. [Google Scholar] [CrossRef]
  31. Fejerskov, M.; Lindholm, C.; Myrvang, A.; Bungum, H. Crustal Stress in and around Norway: A Compliation of in Situ Stress Observations. Geol. Soc. Lond. Spec. Publ. 2000, 167, 441–449. [Google Scholar] [CrossRef]
  32. Fjeldskaar, W.; Lindholm, C.; Dehls, J.F.; Fjeldskaar, I. Postglacial Uplift, Neotectonics and Seismicity in Fennoscandia. Quat. Sci. Rev. 2000, 19, 1413–1422. [Google Scholar] [CrossRef]
  33. Olesen, O.; Bungum, H.; Dehls, J.; Lindholm, C.; Pascal, C.; Roberts, D. Neotectonics, Seismicity and Contemporary Stress Field in Norway—Mechanisms and Implications. Quat. Geol. Nor. Geol. Surv. Nor. Spec. Publ. 2013, 13, 145–174. [Google Scholar]
  34. Eiken, O.; Hinz, K. Contourites in the Fram Strait. Sediment. Geol. 1993, 82, 15–32. [Google Scholar] [CrossRef]
  35. Johnson, J.E.; Mienert, J.; Plaza-Faverola, A.; Vadakkepuliyambatta, S.; Knies, J.; Bünz, S.; Andreassen, K.; Ferré, B. Abiotic Methane from Ultraslow-Spreading Ridges Can Charge Arctic Gas Hydrates. Geology 2015, 43, 371–374. [Google Scholar] [CrossRef] [Green Version]
  36. Mau, S.; Römer, M.; Torres, M.E.; Bussmann, I.; Pape, T.; Damm, E.; Geprägs, P.; Wintersteller, P.; Hsu, C.-W.; Loher, M. Widespread Methane Seepage along the Continental Margin off Svalbard-from Bjørnøya to Kongsfjorden. Sci. Rep. 2017, 7, 42997. [Google Scholar] [CrossRef] [PubMed] [Green Version]
  37. Veloso-Alarcón, M.E.; Jansson, P.; De Batist, M.; Minshull, T.A.; Westbrook, G.K.; Pälike, H.; Bünz, S.; Wright, I.; Greinert, J. Variability of Acoustically Evidenced Methane Bubble Emissions Offshore Western Svalbard. Geophys. Res. Lett. 2019, 46, 9072–9081. [Google Scholar] [CrossRef] [Green Version]
  38. Goswami, B.K.; Weitemeyer, K.A.; Bünz, S.; Minshull, T.A.; Westbrook, G.K.; Ker, S.; Sinha, M.C. Variations in Pockmark Composition at the Vestnesa Ridge: Insights from Marine Controlled Source Electromagnetic and Seismic Data. Geochem. Geophys. Geosyst. 2017, 18, 1111–1125. [Google Scholar] [CrossRef] [Green Version]
  39. Singhroha, S.; Chand, S.; Bünz, S. Constraints on Gas Hydrate Distribution and Morphology in Vestnesa Ridge, Western Svalbard Margin, Using Multicomponent Ocean-Bottom Seismic Data. J. Geophys. Res. Solid Earth 2019, 124, 4343–4364. [Google Scholar] [CrossRef]
  40. Singhroha, S.; Bünz, S.; Plaza-Faverola, A.; Chand, S. Detection of Gas Hydrates in Faults Using Azimuthal Seismic Velocity Analysis, Vestnesa Ridge, W-Svalbard Margin. J. Geophys. Res. Solid Earth 2020, 125, e2019JB017949. [Google Scholar] [CrossRef]
  41. Sultan, N.; Plaza-Faverola, A.; Vadakkepuliyambatta, S.; Buenz, S.; Knies, J. Impact of Tides and Sea-Level on Deep-Sea Arctic Methane Emissions. Nat. Commun. 2020, 11, 5087. [Google Scholar] [CrossRef]
  42. Sarkar, S.; Berndt, C.; Minshull, T.A.; Westbrook, G.K.; Klaeschen, D.; Masson, D.G.; Chabert, A.; Thatcher, K.E. Seismic Evidence for Shallow Gas-Escape Features Associated with a Retreating Gas Hydrate Zone Offshore West Svalbard. J. Geophys. Res. Solid Earth 2012, 117, B09102. [Google Scholar] [CrossRef] [Green Version]
  43. Mattingsdal, R.; Knies, J.; Andreassen, K.; Fabian, K.; Husum, K.; Grøsfjeld, K.; De Schepper, S. A New 6 Myr Stratigraphic Framework for the Atlantic–Arctic Gateway. Quat. Sci. Rev. 2014, 92, 170–178. [Google Scholar] [CrossRef]
  44. Myhre, A.M.; Thiede, J.; Firth, J.V.; Ahagon, K.S.; Black, K.S.; Bloemendal., J.; Brass, G.W.; Bristow, J.F.; Chow, N.; Cremer, M.; et al. (Eds.) Proceedings of the Ocean Drilling Program, 151 Initial Reports; Ocean Drilling Program: College Station, TX, USA, 1995; Volume 151. [Google Scholar]
  45. Thiede, J.; Myhre, A.M.; Firth, J.V.; Johnson, G.L.; Ruddiman, W.F. (Eds.) Proceedings of the Ocean Drilling Program, 151 Scientific Results; Ocean Drilling Program: College Station, TX, USA, 1996; Volume 151. [Google Scholar]
  46. Howe, J.A.; Shimmield, T.M.; Harland, R.; Eyles, N. Late Quaternary Contourites and Glaciomarine Sedimentation in the Fram Strait. Sedimentology 2008, 55, 179–200. [Google Scholar] [CrossRef]
  47. Sztybor, K.; Rasmussen, T.L. Late Glacial and Deglacial Palaeoceanographic Changes at Vestnesa Ridge, Fram Strait: Methane Seep versus Non-Seep Environments. Palaeogeogr. Palaeoclimatol. Palaeoecol. 2017, 476, 77–89. [Google Scholar] [CrossRef]
  48. Raymo, M.E.; Jansen, E.; Blum, P.; Herbert, T.D. (Eds.) Proceedings of the Ocean Drilling Program, 162 Scientific Results; Ocean Drilling Program: College Station, TX, USA, 1999; Volume 162. [Google Scholar]
  49. Terzariol, M.; Park, J.; Castro, G.M.; Santamarina, J.C. Methane Hydrate-Bearing Sediments: Pore Habit and Implications. Mar. Pet. Geol. 2020, 116, 104302. [Google Scholar] [CrossRef]
  50. Yun, T.S.; Santamarina, J.C.; Ruppel, C. Mechanical Properties of Sand, Silt, and Clay Containing Tetrahydrofuran Hydrate. J. Geophys. Res. Solid Earth 2007, 112, B04106. [Google Scholar] [CrossRef]
  51. Jung, J.W.; Jang, J.; Santamarina, J.C.; Tsouris, C.; Phelps, T.J.; Rawn, C.J. Gas Production from Hydrate-Bearing Sediments: The Role of Fine Particles. Energy Fuels 2012, 26, 480–487. [Google Scholar] [CrossRef]
  52. Park, J.; Santamarina, J.C. Revised Soil Classification System for Coarse-Fine Mixtures. J. Geotech. Geoenviron. Eng. 2017, 143, 04017039. [Google Scholar] [CrossRef] [Green Version]
  53. Park, J.; Castro, G.M.; Carlos Santamarina, J. Closure to “Revised Soil Classification System for Coarse-Fine Mixtures” by Junghee Park and J. Carlos Santamarina. J. Geotech. Geoenviron. Eng. 2018, 144, 07018019. [Google Scholar] [CrossRef] [Green Version]
  54. Daszinnies, M.; Plaza-Faverola, A.; Sylta, Ø.; Bünz, S.; Mattingsdal, R.; Tømmerås, A.; Knies, J. The Plio-Pleistocene Seepage History off Western Svalbard Inferred from 3D Petroleum Systems Modelling. Mar. Pet. Geol. 2021, 128, 105023. [Google Scholar] [CrossRef]
  55. Liu, J.L.; Haeckel, M.; Rutqvist, J.; Wang, S.; Yan, W. The Mechanism of Methane Gas Migration Through the Gas Hydrate Stability Zone: Insights from Numerical Simulations. J. Geophys. Res. Solid Earth 2019, 124, 4399–4427. [Google Scholar] [CrossRef] [Green Version]
  56. Madhusudhan, B.N.; Clayton, C.R.I.; Priest, J.A. The Effects of Hydrate on the Strength and Stiffness of Some Sands. J. Geophys. Res. Solid Earth 2019, 124, 65–75. [Google Scholar] [CrossRef]
  57. Daigle, H.; Dugan, B. Effects of Multiphase Methane Supply on Hydrate Accumulation and Fracture Generation. Geophys. Res. Lett. 2010, 37, L20301. [Google Scholar] [CrossRef]
  58. Flemings, P.B.; Stump, B.B.; Finkbeiner, T.; Zoback, M. Flow Focusing in Overpressured Sandstones: Theory, Observations, and Applications. Am. J. Sci. 2002, 302, 827–855. [Google Scholar] [CrossRef]
  59. Goswami, B.K.; Weitemeyer, K.A.; Minshull, T.A.; Sinha, M.C.; Westbrook, G.K.; Chabert, A.; Henstock, T.J.; Ker, S. A Joint Electromagnetic and Seismic Study of an Active Pockmark within the Hydrate Stability Field at the Vestnesa Ridge, West Svalbard Margin. J. Geophys. Res. Solid Earth 2015, 120, 6797–6822. [Google Scholar] [CrossRef] [Green Version]
  60. Brooks, R.H.; Corey, A.T. Hydraulic Properties of Porous Media and Their Relation to Drainage Design. Trans. ASAE 1964, 7, 26–28. [Google Scholar]
  61. Schowalter, T.T. Mechanics of Secondary Hydrocarbon Migration and Entrapment. AAPG Bull. 1979, 63, 723–760. [Google Scholar]
  62. Hildenbrand, A.; Schlömer, S.; Krooss, B.M. Gas Breakthrough Experiments on Fine-Grained Sedimentary Rocks. Geofluids 2002, 2, 3–23. [Google Scholar] [CrossRef]
  63. Hildenbrand, A.; Schlömer, S.; Krooss, B.M.; Littke, R. Gas Breakthrough Experiments on Pelitic Rocks: Comparative Study with N2, CO2 and CH4. Geofluids 2004, 4, 61–80. [Google Scholar] [CrossRef]
  64. Rutqvist, J.; Moridis, G.J. Numerical Studies on the Geomechanical Stability of Hydrate-Bearing Sediments. In Proceedings of the Offshore Technology Conference, OnePetro, Houston, TX, USA, 30 April–3 May 2007. [Google Scholar]
  65. Lias, S.G.; Bartmess, J.E.; Liebman, J.F.; Holmes, J.L.; Levin, R.D.; Mallard, W.G. Ion Energetics Data in NIST Chemistry WebBook, NIST Standard Reference Database Number 69; National Institute of Standards and Technology: Gaithersburg, MD, USA, 2018; Volume 20899. [Google Scholar]
  66. Linstrom, P.J.; Mallard, W.G. (Eds.) NIST Chemistry WebBook, NIST Standard Reference Database 69; National Institute of Standards and Technology: Gaithersburg, MD, USA, 2011. [Google Scholar]
  67. Waite, W.F.; Kneafsey, T.J.; Winters, W.J.; Mason, D.H. Physical Property Changes in Hydrate-Bearing Sediment Due to Depressurization and Subsequent Repressurization. J. Geophys. Res. Solid Earth 2008, 113, B7. [Google Scholar] [CrossRef] [Green Version]
  68. Zhang, T.; Sun, S. Thermodynamics-Informed Neural Network (TINN) for Phase Equilibrium Calculations Considering Capillary Pressure. Energies 2021, 14, 7724. [Google Scholar] [CrossRef]
  69. Singhroha, S.; Bünz, S.; Plaza-Faverola, A.; Chand, S. Gas Hydrate and Free Gas Detection Using Seismic Quality Factor Estimates from High-Resolution P-Cable 3D Seismic Data. Interpretation 2016, 4, SA39–SA54. [Google Scholar] [CrossRef] [Green Version]
  70. Hubbard, B.; Maltman, A. Laboratory Investigations of the Strength, Static Hydraulic Conductivity and Dynamic Hydraulic Conductivity of Glacial Sediments. Geol. Soc. Lond. Spec. Publ. 2000, 176, 231–242. [Google Scholar] [CrossRef]
  71. Gorman, A.R.; Holbrook, W.S.; Hornbach, M.J.; Hackwith, K.L.; Lizarralde, D.; Pecher, I. Migration of Methane Gas through the Hydrate Stability Zone in a Low-Flux Hydrate Province. Geology 2002, 30, 327–330. [Google Scholar] [CrossRef]
  72. Liu, X.; Flemings, P.B. Passing Gas through the Hydrate Stability Zone at Southern Hydrate Ridge, Offshore Oregon. Earth Planet. Sci. Lett. 2006, 241, 211–226. [Google Scholar] [CrossRef]
  73. Foschi, M.; Cartwright, J.A.; MacMinn, C.W.; Etiope, G. Evidence for Massive Emission of Methane from a Deep-water Gas Field during the Pliocene. Proc. Natl. Acad. Sci. USA 2020, 117, 27869–27876. [Google Scholar] [CrossRef]
  74. Kominz, M.A.; Patterson, K.; Odette, D. Lithology Dependence of Porosity In Slope and Deep Marine Sediments. J. Sediment. Res. 2011, 81, 730–742. [Google Scholar] [CrossRef]
  75. Dewhurst, D.N.; Aplin, A.C.; Sarda, J.-P.; Yang, Y. Compaction-Driven Evolution of Porosity and Permeability in Natural Mudstones: An Experimental Study. J. Geophys. Res. Solid Earth 1998, 103, 651–661. [Google Scholar] [CrossRef]
  76. Zoback, M.D. Reservoir Geomechanics; Cambridge University Press: New York, NY, USA, 2010. [Google Scholar]
  77. Swarbrick, R.E.; Osborne, M.J. Memoir 70, Chapter 2: Mechanisms That Generate Abnormal Pressures: An Overview; AAPG: Tulsa, OK, USA, 1998. [Google Scholar]
  78. Dugan, B.; Sheahan, T.C. Offshore Sediment Overpressures of Passive Margins: Mechanisms, Measurement, and Models. Rev. Geophys. 2012, 50, RG3001. [Google Scholar] [CrossRef]
  79. Daigle, H.; Worthington, L.L.; Gulick, S.P.; Van Avendonk, H.J. Rapid Sedimentation and Overpressure in Shallow Sediments of the Bering Trough, Offshore Southern Alaska. J. Geophys. Res. Solid Earth 2017, 122, 2457–2477. [Google Scholar] [CrossRef]
  80. Portnov, A.; Vadakkepuliyambatta, S.; Mienert, J.; Hubbard, A. Ice-Sheet-Driven Methane Storage and Release in the Arctic. Nat. Commun. 2016, 7, 10314. [Google Scholar] [CrossRef] [Green Version]
  81. Wallmann, K.; Riedel, M.; Hong, W.-L.; Patton, H.; Hubbard, A.; Pape, T.; Hsu, C.W.; Schmidt, C.; Johnson, J.E.; Torres, M.E. Gas Hydrate Dissociation off Svalbard Induced by Isostatic Rebound Rather than Global Warming. Nat. Commun. 2018, 9, 83. [Google Scholar] [CrossRef] [PubMed]
  82. Chabert, A.; Minshull, T.A.; Westbrook, G.K.; Berndt, C.; Thatcher, K.E.; Sarkar, S. Characterization of a Stratigraphically Constrained Gas Hydrate System along the Western Continental Margin of Svalbard from Ocean Bottom Seismometer Data. J. Geophys. Res. Solid Earth 2011, 116, B12102. [Google Scholar] [CrossRef] [Green Version]
Figure 1. (a) Overview map showing the investigated site location on the west-Svalbard continental margin with respect to the distribution of BSRs and mapped seepage expressions. (b) Zoom on the VR.
Energies 15 03156 g001
Figure 2. (a) Bathymetry from ship-mounted multibeam (R/V Helmer Hanssen) showing the seabed structures and elongated depression at Site 1. (b) Acoustic blanking indicates vertical fluid migration and sedimentary deformation associated with the depression. C19-3_GPC01 indicates the location of the Calypso core sites in Table 1. C17-5_1401 is the location where gas hydrate nodules were observed in the upper 2 m of sediment (https://cage.uit.no/cruise/geomorphic-mapping-seismic-stratigraphy-cruise/, accessed on 21 April 2022) (c) Gas hydrate and fluid flow system overview for Sites 5, 12, and 4. The seismic, bathymetry and water column acoustic data used for this composite 3D image is from previous study [21]. See Figure 1 for location on the regional map.
Energies 15 03156 g002
Figure 3. Illustrative example (a) of pressure and stress (b) at the VR. The BGHSZ forms a low-permeability seal, and the gas phase is trapped forming the FGZ. The purple line is the free water level (FWL) depth if we only account for the buoyancy effect. The green line is the GWC depth if we account for both the buoyancy and capillary pressure (Pc) where the capillary pressure at GWC is equal to the capillary entry pressure (Pe). Fractures are opened at the BGHSZ once the gas pressure (yellow line) overcomes the vertical stress (orange line) as the fracture criterion (Equation (11)).
Energies 15 03156 g003
Figure 4. Seafloor and BSR depths for Sites 5, 12 and 4 described in this study. The representative locations of the active seeping pockmarks (Lunde and Lømvi) near Site 4 are shown here.
Energies 15 03156 g004
Figure 5. Capillary curves calculated using Equation (7) for the 4 sites. The sites are shown from west to east. Site 5 (a) is the westernmost, followed by Site 12 (b), Site 4 (c) and Site 1 (d). The black curve is the median capillary pressure, and the shaded region is the uncertainty ( ± 1 SD) from the capillary pressure parameters (Equations (8)–(10)). The red line is the fracture criterion calculated using Equation (5). The black dotted line represents the gas mobility threshold. The point where the red line intersects the black curve indicates the minimum gas saturation required to open fractures at BSR which is obtained by substituting Equation (7) into Equation (13) and solving for the saturations. Gas will open fractures at all saturation and pressure values greater than this value at the intersection point. Gas will migrate by porous flow (through rock matrix) instead of opening fractures at saturation values between this intersection point and gas mobility threshold.
Energies 15 03156 g005
Figure 6. The median prediction of different parameters for the 4 sites. The black dots are the median prediction, and the shaded regions are the uncertainty ( ± 1 SD). (a) The capillary entry pressure (Pe) of the sediments at BSR depth is shown here. The red dots are the fracture criterion at the respective sites. (b) The gas column height of the FGZ required to open fractures at the BSR depths is shown here. (c) The minimum gas saturation of the FGZ required to open the fractures at the BSR depths is shown here.
Energies 15 03156 g006
Figure 7. (a) The capillary entry pressure (Pe) (Equation (8)) as function of sediment clay fraction is shown here. The black line is the median prediction and the and the shaded region is the uncertainty ( ± 1 SD). The capillary entry pressure increases with an increase in sediment clay fraction. (b) Sediment clay fraction data obtained from the index tests of the upper 20 m of the sediments for the 4 sites compared with the sediment clay fraction obtained from the ODP data.
Energies 15 03156 g007
Figure 8. Minimum gas saturation required to open fractures for the 4 sites for varying sediment clay fraction (fc). The sites are shown from west to east. Site 5 (a) is the westernmost, followed by Site 12 (b), Site 4 (c) and Site 1 (d). The black curves show the median prediction of minimum gas saturation (obtained by substituting Equation (7) into equation 13 and solving for the saturations) required to open fractures for a given sediment clay fractions and the shaded region is the uncertainty ( ± 1 SD). The red shaded region shows the likely sediment clay fractions (fc = 0.53–0.57) at the BSR obtained from the ODP data (Figure 7b) named ODP-200m. The sediment clay fraction obtained from the calypso cores (Figure 2c) as mentioned in Table 1 are shown by the blue and dark yellow lines. The black dotted line represents the gas mobility threshold. Fracturing is favored for all sediment clay fractions wherever the gas saturation (black curve) is below the gas mobility threshold or equal to zero. Porous flow is favored for all sediment clay fractions where the gas saturation (black curve) is above the gas mobility threshold.
Energies 15 03156 g008
Figure 9. The gas column height required to open fractures for the 4 sites for varying sediment clay fraction (fc). The sites are shown from west to east. Site 5 (a) is the westernmost, followed by Site 12 (b), Site 4 (c) and Site 1 (d). The red shaded region shows the likely sediment clay fractions (fc = 0.53–0.57) at the BSR obtained from the ODP data (Figure 7b) named ODP-200m. The sediment clay fraction obtained from the calypso cores (Figure 2c) as mentioned in Table 1 are shown by the blue and dark yellow lines. The black curves show the median prediction of gas column height required to open fractures and the shaded region is the uncertainty ( ± 1 SD).
Energies 15 03156 g009
Figure 10. Capillary curves calculated using Equation (7) and porosity from Equation (15) for the 4 Sites. The sites are shown from west to east. Site 5 (a) is the westernmost, followed by Site 12 (b), Site 4 (c) and Site 1 (d). The black curve is the median capillary pressure, and the shaded region is the uncertainty ( ± 1 SD). The red line is the fracture criterion calculated using Equation (5) with porosity from Equation (15). The black dotted line is the gas mobility threshold. The minimum gas saturation required (median prediction) to open fractures and the gas column height (median prediction) are higher than the values predicted in Figure 5 with porosity estimated from Equation (1). (e) The porosity prediction from Equation (1) and Equation (15) as a function of depth is shown here.
Energies 15 03156 g010
Figure 11. Minimum gas saturation required to open fractures for the 4 sites for varying overpressure gradients (dP*/dz). The sites are shown from west to east. Site 5 (a) is the westernmost, followed by Site 12 (b), Site 4 (c) and Site 1 (d). The black curves show the median prediction of minimum gas saturation (obtained by substituting Equation (7) into Equation (13) and solving for the saturations) required to open fractures for a given overpressure gradient and the shaded region is the uncertainty ( ± 1 SD). The black dotted line is the gas mobility threshold.
Energies 15 03156 g011
Figure 12. The gas column height required to open fractures for the 4 sites, for varying overpressure gradients (dP*/dz). The sites are shown from west to east. Site 5 (a) is the westernmost, followed by Site 12 (b), Site 4 (c) and Site 1 (d). The black curves show the median prediction of gas column height required to open fractures for a given overpressure gradient and the shaded region is the uncertainty ( ± 1 SD).
Energies 15 03156 g012
Figure 13. Schematic representation of different stress regimes and the principal stress directions based on Anderson’s classification.
Energies 15 03156 g013
Figure 14. Minimum gas saturation required to open fractures for the 4 sites for varying fracture criterion (represented here as a % of the vertical effective stress). The sites are shown from west to east. Site 5 (a) is the westernmost, followed by Site 12 (b), Site 4 (c) and Site 1 (d). The stress regimes and the corresponding fracture criterions boundaries are shown in (e). The orange line shows the gas saturation reported at the respective sites (at BSR depths) from velocity analyses. The black curve is the median gas saturation (obtained by substituting equation 7 into equation 13 and solving for the saturations) prediction, and the shaded region shows the uncertainty ( ± 1 SD). The black dotted line is the gas mobility threshold.
Energies 15 03156 g014
Table 2. Constant values for the porosity-depth relationship shown in Equation (1).
Eqn ConstantValueEqn ConstantValue
A0+7.72334195380221 × 10⁻¹A11−1.35518101733016 × 10⁻²³
A1−1.11004774526740 × 10⁻²A12+2.42580622585201 × 10⁻²⁶
A2+4.34425507785822 × 10⁻⁴A13−3.45480182930488 × 10⁻²⁹
A3−1.14789487122355 × 10⁻⁵A14+3.90463689278808 × 10⁻³²
A4+1.98324670901884 × 10⁻⁷A15−3.47684989316588 × 10⁻³⁵
A5−2.34230235582518 × 10⁻⁹A16+2.40717100585227 × 10−38
A6+1.97427624709482 × 10⁻¹¹A17−1.26806243404536 × 10−41
A7−1.22870027847462 × 10⁻¹³A18+4.90753244518306 × 10−45
A8+5.7935502941264 × 10⁻¹⁶A19−1.31484878192563 × 10−48
A9−2.10963608612415 × 10⁻¹⁸A20+2.17782224669928 × 10−52
A10+6.0147022201964 × 10⁻²¹A21−1.67942595431780 × 10−56
Publisher’s Note: MDPI stays neutral with regard to jurisdictional claims in published maps and institutional affiliations.

