1. Introduction
The level of quality of life, which is an interdisciplinary [
1] and multivariate concept [
2], is influenced by various elements, including the following: health [
3], satisfaction of basic material needs (food, clothing, accommodation), material security (job security and wage level), organisation of life and work, free time for personal activities, family and social bond, contact with nature [
4], education and knowledge, level of independence and personal freedom. In this context, it is no longer reasonable to consider the famous GDP per capita as the key indicator of socioeconomic progress. In fact, the search for correlations between urbanization, economic growth and industrialization progress worldwide is no longer justified. Nowadays, in the context of sustainable urban development, there is a need to go beyond the measurement of economic values and consider the ‘quality of life’ category as a crucial criterion in the evaluation of socioeconomic progress. Additionally, there is a need to implement a systemic–holistic approach, taking into account not only objective factors, but also subjective elements, and even sociocultural context [
5]. Thus, studies claim that in order to ensure the global comparability of data on the development of urban areas, the index approach to measuring urban quality of life is necessary [
6,
7,
8,
9,
10].
At the same time, it is crucial to estimate the losses related to environmental impacts on human health [
11]. Assuming that the value of human life is finite, the assessment of average value of human lives may be expressed by the loss of generalized national income due to people who are sick or die prematurely due to environmental degradation. Therefore, it is important to be aware of the losses arising from the use of degraded elements of the environment in the production or consumption processes and consider the need for leisure, tourism [
12,
13], preservation of the beauty of landscape and improvement of the quality of public spaces [
14,
15]. Air contaminated with oxidants, sulphur, carbon oxides and fluorides causes incalculable losses in terms of impacts on flora and human health. Other significant considerations are the psychological conditions and consequences of industrial and ecological transformations, and the development of positive attitudes towards the protection of nature. Existing industrial plants, or those under construction in the vicinity of population centres, satisfy the need for work and income for local people, but at the same time—with bad technological solutions—the same people are deprived of proper conditions for healthy life and mental development [
16]. This can even become the source of disputes between neighbouring countries, regions or cities.
Meanwhile, diseases of civilization constitute an increasing cause of deaths. It should be emphasized that the devastated natural environment affects human beings in two ways: physiochemically—the body and stress-inducingly—the psyche. The first way occurs outside our consciousness, the second—consists in inducing a chronic state of anxiety in a person, due to recognized ecological changes. This causes obvious symptoms of mental stress. The psychological connection of a human being with the local natural environment, which is the natural environment of people’s lives, is very strong. Thus, the environment has become, in the psychological sense, a “component” of human personality structure and at the same time the quality of their life. Therefore, the proper management of local environment and the development of friendly living conditions for urban residents should be the main and the most important task included in the sustainable development strategy of territorial units in each country [
17].
The European cities, in particular, in terms of climate, environmental degradation and the principles of sustainable development are obliged to implement the assumptions approved by the European Commission, which has adopted a package of legislative proposals adjusting the EU climate, energy, transport and tax policy to improve the well-being and health of citizens and future generations. The main assumptions of the European Green Deal involve achieving net zero greenhouse gas emissions, decoupling economic growth from resource use, equalize the level of development of all regions by 2050 [
18]. Moreover, the strategic changes in the EU policy, such as the “Fit for 55” package with a significant CO
2 emission reduction perspective, promote the development of alternative drives and their introduction to new areas of operation [
19,
20]. It is also worth noting that the circular economy is currently one of the main goals of the European Commission.
The literature to date has offered various models for calculating economic and social losses caused by environmental degradation [
21,
22]. They mainly include air contamination and assessment of losses in terms of health, flora, materials (corrosion) and aesthetic values. The losses caused by the impact of transport and contaminated wastewater on the environment are also assessed [
23]. At the same time, current literature on urban liveability shows gaps in terms of its measurement and assessment, especially from a dynamic point of view. The simulation tools developed by the Chinese researchers (Cao et al. and Han et al.) in may be a support for governance policy evaluation and design. Their methodological framework offers a new scope for understanding the mechanisms of making the urban development liveable and more sustainable [
24,
25]. The Spanish scientists (Sisto et al.) developed a set of urban indicators that has been divided into five areas: economic development and employment, sustainable development, open government, social responsibility, and quality of life. Thanks to the quantitative comparable results and the objective approach, their research shows the methodology based on indicators that could be applied and scaled to other cities to generate a common framework for measuring the impact of public policies on cities [
26]. According to the authors from Latvia (Karnitis et al.), the existing urban sustainable development (SD) indicator systems and indices are not well-suited for the monitoring of specific cities. They claim that benchmarking algorithms and mathematical modelling procedures should be applied to develop a methodology and mathematical model to measure the achieved urban sustainability level and to ensure the most objective selection and proportions of key performance indicators (KPIs) to be included in the model [
27].
Some research conducted in southern Brazil involved selecting indicators with the use of a four-stage methodology. First, the Delphi technique was applied in two rounds of validation with specialists. Then, in the second phase, 64 indicators were evaluated by 19 mayors of analysed cities. The subset of sustainability indicators generated had six guiding axes, namely: nature and social well-being, sustainable public management, historical and cultural management, sustainability education, new savings for sustainability, and urban planning and accessibility. Third, the fuzzy expert system was used to determine a decision tree and, as a fourth step, create a general index for a pilot municipality that fell into an intermediate level of sustainability [
28]. Researchers from Iran (Motealleh et al.) have found out that social sustainability plays a crucial role in sustainable urban development [
29]. According to other research conducted in South Africa, urban neighbourhood spatial and socio-economic inequalities remain considerably ambiguous in regard to urban form and quality of life [
30].
R. Raedo admits that the attempt to compare the value of pure indicators does not allow to prove in an aggregated way the differences between the analysed objects. According to his research, if measuring sustainability is “measuring the immeasurable”, the point is to propose a composite indicator that evaluates only the deficits of sustainability (unsustainability of cities). This approach reveals deficiencies and—at the same time—the priorities that each city must follow. The results emerging from a sample of fifty cities analysed suggest that no city is sustainable, but only less unsustainable, and that in fact the environmental dimension [
23] contributes the most to unsustainability [
31].
One of the latest reviews has showed the differences in the existing approaches that substantially contributed to the current inconsistencies in assessing and measuring sustainable development in cities. The obtained results provide an overview of this issue, e.g., to decision makers, and could concurrently serve as a generally applicable foundation for the creation of new urban sustainability indicator frameworks. According to Asian (Dang et al.) findings, in order to search for sustainability goals, researchers and policy makers should focus on the following indicators: social democracy, quality of life, education, healthcare, water quality, and waste disposal [
32]. Ligarski and Wolny claim to develop a holistic green urban meter for sustainable urban assessment by establishing a comprehensive assessment framework that could increase the quality of life in the long term. Citizens may also play a key role in the development of smart city concept, providing a wealth of information for the sustainable development of cities [
33]. Other Polish researchers (Perło; Guzik et al.) claim that special attention should be paid to urban mobility [
34,
35] and also to the surrounding areas so that socio-economic development is balanced with environmental protection to promote spatial order and improve the quality of life [
36]. The current pandemic experience shows the importance of environmental concerns and the social responsibilities and finally the need to implement smart mobility patterns [
37,
38] and novel business models and other innovative solutions [
39,
40,
41] for smart cities [
42,
43].
The authors of this paper attempted to indicate and measure the impact of specific factors, occurring within the SD dimensions, on the quality of life of residents in the selected European cities and world metropolises. This paper aims, in particular, to investigate the possibility of comparing, in a transparent way, the urban quality of life using the sustainable development indicators based on the ISO 37120 standard. The analysis has been conducted at the example of selected cities: Amsterdam, Buenos Aires, Dubai, Gdynia, London, Los Angeles and Zagreb. The hypothesis reads as follows: the ISO 37120 indicators converted into partial and total utility value and then grouped by sustainable development perspectives (environmental, economic and social ones) may be used to measure the level of urban quality of life. The criterion for selecting the cities for the analysis referred to the data availability as regards the indicators related to ISO 37120 standard. The authors believe that the presented tool may constitute a useful instrument allowing to categorize the cities and assess the level of their sustainability and smart development.
2. Characteristics of Analysed Cities Certified within the ISO 37120 Standard
The analysed cities differ on many levels. Apart from the geographical, cultural and political issues, it is worth paying attention to the approach to sustainable development paradigm. The examined cities implement the main assumptions of sustainable development in many ways. The changes introduced in the analysed cities are of various nature, but these plans are always related to improving the inhabitants’ quality of life.
Table 1. presents selected data regarding analysed cities.
Individual city development strategies are of great importance; they relate to the analysed cities, they are local, not national.The following analysis of the city strategy shows the direction of changes that the authorities intend to follow. In each of the analyzed cities, the Smart City assumptions are implemented in a very different way. Generally, the actions taken by cities concern, among others: transport (Amsterdam, Buenos Aires, Dubai, Gdynia), waste management (Amsterdam, Buenos Aires, Los Angeles), energy saving (Amsterdam, Buenos Aires, London), education (Zagreb), land green (Buenos Aires, Dubai, Los Angeles), quality of life (Amsterdam, Buenos Aires, Dubai, Gdynia, London, Zagreb, Los Angeles). Individual urban development strategies have a narrower or broader scope of activities, but they are united by the concern for the implementation of measures to improve the inhabitants’ quality of life.
Amsterdam is the capital of the Netherlands, a large industrial, scientific, financial and commercial center located in the east of the country. Amsterdam is known as the world’s bicycle capital—32% of road traffic is bicycle-driven. The Smart City paradigm—a bottom-up approach, aimed at moving away from a linear economy to a circular economy—capable of recreating the life cycle of production and consumption of waste later used as raw materials. The Amsterdam Electricity Company turns waste into electricity, district heating and building materials. It is also worth pointing out that as much as 75% of the sewage network is divided into sewage and rainwater, and the residues from sewage treatment are transformed into natural gas. It is worth noting that the circular economy is currently one of the main goals of the European Commission.
The next city to be studied is the capital of Argentina, one of the largest cities in South America, located in the eastern part of the country, on the right bank of the La Plata estuary. Buenos Aires is a huge metropolis with 15.6 million people, and is also a leader in the implementation of sustainable development goals. One of the measures taken by the city authorities is to reduce CO2 emissions by 53% in the coming years, and by as much as 84% by 2050. The provisions regarding changes in the city have been included in the Climate Action Plan 2050, which defines four main pillars of action:
- -
A prepared city—which envisages the use of ecological solutions, introducing more trees and green spaces.
- -
“A city that prioritizes proximity to local amenities”, a more sustainable mobility model (priority for pedestrians, bicycles and public transport) and increases the role of streets as meeting places rather than transit channels.
- -
“An innovative and low carbon city” technologies aimed at reducing the carbon footprint, incl. low-carbon transport, energy-efficient buildings, clean energy, more circular economy “An inclusive city”, better access to health care, cleaner air and greener schools. Dubai is no longer a single city, but an agglomeration in the United Arab Emirates. The capital of the emirate of Dubai. It is located on the southern coast of the Persian Gulf. Dubai is full of innovative communication solutions and great architecture. It is worth pointing out that Dubai is considered the most modern city in the world, providing good living conditions for everyone who wants to commune with the real city of the future. The changes concerning the quality of life in terms of sustainable development assume: 6 innovative programs, the so-called smart city services covering 6 key branches of social life: economy, life, mobility, management, environment, inhabitants. One of the goals is to create the modern DUBAI SILICONE OASIS district, which is to become an independent sustainable, integrated ecosystem. Such actions are to be based on three pillars: communication, integration and interpersonal cooperation—from intelligent cars to public Wi-Fi hotspots and location applications [
44].
Another city surveyed is Gdynia, located in northern Poland and inhabited by 244,000 residents. The main development assumptions of the city of Gdynia are included in the strategy, the main goals of which include increasing the quality of life in a broad sense. The next pillars include investment, organizational and social activities that are to provide Gdynia residents with a high quality of life in individual districts. The strategy also responds to the growing expectations of local communities as to reducing the intensity of car traffic in the city and its negative impact on the environment—following changes in awareness of urban mobility. Therefore, the document defines the directions of activities that prefer the use of public transport to reach places of study, work and services, and appropriate investments in rolling stock, infrastructure and organization of transport [
45]. Also, an integrated smart development model, supported by sustainable urban planning, may contribute to urban ecological resilience of such seaport areas [
46,
47,
48,
49]. This should be also supported by state policy [
13]. For the efficient, friendly and integrated transport system in the city the main assumptions are as follows:
High attractiveness of collective and bicycle public transport for residents and employees of Gdynia enterprises and institutions;
Calm car traffic in the city;
New road, bicycle and pedestrian infrastructure facilitating traffic between districts and improving access to Gdynia;
A metropolitan transport hub of international importance [
50].
The good quality of life in this city is also influenced by clean and healthy air, which is related to low-emission public transport, based on trolleybuses equipped with batteries, which allows them to drive “without poles”. The positive side of ecological activities also refers to financial support for residents in replacing coal furnaces. Invaluable is also the fact that 45% of the area in Gdynia is covered by forests providing opportunities for active recreation, including a new green space—The Central Park. Gdynia is also a place where the first woonerf was developed, i.e., an urban shared zone on one of the streets in the city centre. Whereas the safety of residents is supervised by video monitoring throughout the city—over 140 cameras and the Smart Traffic Control system “Tristar”.
The next city under study is London, the capital of England and Great Britain, the largest city of the kingdom, located in its south-eastern part on the Thames with a population of approx. 8982 million. It is the third largest city in Europe. The London development plan for 2019–2029 has been implemented in the city, assuming sustainable development under six policies: building a strong and inclusive community, making the best use of space, creating a healthy city, meeting housing needs, good economic growthand increased efficiency and vitality—by the middle of the century London is to be a neutral city in terms of CO
2 emissions [
51].
Los Angeles is the most populous city in the US state of California, and at the same time the second most populous city in the United States, thanks to a population of about 4 million. The Los Angeles government has adopted the Our County Sustainable Development Plan, a comprehensive approach to sustainable development. OurCounty proposes making Los Angeles a fairer, prosperous, and resilient region for years to come. The goals of the plan include: power unregistered areas and county facilities 100% renewable energy by 2025, increasing the range of urban trees by 15% by 2035, diversion of over 95% of waste from landfills, development of spatial development tools to limit new investments in areas with high climate risk, single-use plastic phase-out by 2025 to ensure a cleaner ocean and less waste in landfills, limiting imported water by sourcing 80 percent water locally by 2045, provide safe and clean drinking water for all residents, and the fact that rivers, lakes, and the ocean meet federal water quality standards, leading efforts to ensure that at least 65% of new premises are built within 1/2 mile of high frequency traffic by 2035 and supporting the construction of over half a million inexpensive housing by 2045 to improve public health and community sustainability [
52].
The city of Zagreb, the capital and largest city of Croatia. It has about 804,000 inhabitants, and the Zagreb agglomeration is inhabited by 1.2 million. The main development assumptions include: entrepreneurship development, transport investments and education for sustainable development.
It is worth pointing out that Zagreb is an industrial, scientific, educational, research and financial center. Thanks to activities supporting the development of entrepreneurship and employment prospects of the inhabitants, the Zagreb Innovation Center provides support to anyone who wants to set up their own enterprise, developing an innovative idea or product. An important aspect of sustainable development in the city is the continuous investment in public urban transport [
53]. The city of Zagreb has set as its development goal the development of awareness of environmental sustainability at the level of each individual and of society as a whole, with the city of Zagreb paying particular attention to children and young people. That is why Zagreb, among its main projects, is developing eco-schools and eco-kindergartens, the program of which is aimed at environmental education and education.
3. Materials and Methods
It is possible to analyse the data related to the development changes in the cities using the utility method [
54]. It was applied by other researchers—e.g., Alpopi at all. in relation to the sustainable urban development [
55]. These authors also conducted research regarding the quality of electronic government services and in relation to housing sector [
56,
57].
In this research the sustainable development indicators [
58] as per ISO 37120 [
59,
60] have been taken from the World Council on City Data (WCCD) database [
52]. The selection of indicators amounting to 16 meets the comparability criterion, i.e., such a number of indicators was available for each characterized city. The lack of a single indicator already excludes the city from the comparative analysis. The sustainable development indicators included in this database have been converted into partial and total utility indicators. The applied mathematical equation allows to reduce the units adopted for particular sustainable development indicators and the obtained values of real numbers for partial utility in the range 0–1 can be summed up and the total utility can be calculated.
Partial utility is a relative value of indicator for a given city surveyed because it refers to the values characterizing other cities and is calculated as per the following formula:
The individual symbols mean:
Uij—partial utility for i city relative to j indicator,
Cij—value of j sustainable development indicator for i city,
—the lowest (for a stimulant) or the highest (for a destimulant) value of j sustainable development indicator among the cities surveyed,
—the highest (for a stimulant) or the lowest (for a destimulant) value of j sustainable development indicator among the cities surveyed.
Therefore, for the calculations in this method it is important to determine a function of a given indicator, i.e., whether it is a stimulant—the increase in its value is beneficial or a destimulant—the increase in its value is unfavourable. Below, the authors provide an example of calculations in this regard.
For example, for the city of Dubai, for the youth unemployment index (
Table 2), which is a destimulant, the calculation of partial utility value reads as follows:
Whereas for the same city, but for the indicator of the number of firefighters per 100,000 inhabitants, which is a stimulant, the calculation of partial utility value reads as follows:
The value equal to 0 informs that a given city achieved the worst result for a given indicator among the cities surveyed, whereas when the partial utility value is equal to 1, it indicates that the city achieved the best value—the maximum for a given indicator.
Whereas the total utility is calculated as follows:
The above formula indicated that the total utility value depends not only on the partial utility values but also on the number of indicators analysed.
The study presents the assessment of the quality of life in 7 selected cities of different size and different geographical location: Amsterdam, Buenos Aires, Dubai, Gdynia, London, Los Angeles and Zagreb. The quality-of-life assessment was performed under 16 selected sustainable development indicators as per the ISO 37120 standard (
Table 2).
4. Results
Under the adopted methodology, indicators presented in
Table 2 were converted into the value of partial and total utility. The selected indicators were categorized into particular aspects of the sustainable development: environmental (
Figure 1), economic (
Figure 2) and social ones (
Figure 3).
The environmental order indicators indicate that it is the city of London that is distinguished by the highest value of total utility, i.e., 6.13. This result was influenced by high partial utility values (0.84–1.0) for the following indicators:
- -
concentration of fine particulate matter (PM 2.5),
- -
concentration of particulate matter (PM 10),
- -
total amount of solid waste collected in the city per capita,
- -
total water consumption in the city,
- -
green areas per 100,000 inhabitants,
- -
number of cars per capita.
The city of Amsterdam was second with a total utility value of 5.95. This result was influenced by the following 4 indicators with values in the range of 0.99–1.0: concentration of PM 2.5 fine particulate matter, concentration of PM 10 particulate matter, total amount of solid waste collected in the city per capita, number of cars per capita. The city of Gdynia was third with a total utility value of 5.77. Four indicators for this order reached a maximum value of 1.0 and they included: concentration of PM 2.5 fine particulate matter, concentration of PM 10 particulate matter, concentration of NO
2, total amount of solid waste collected in the city per capita, total water consumption in the city. Subsequent places referred to the following cities: Zagreb, Los Angeles and Buenos Aires with total utility values: 4.63; 4.25; 3.3, respectively. The city of Dubai came last with a score of 0.88. Out of 7 indicators analysed, 4 got the value of 0, while 3 fell within the range of 0.08–0.47 and referred to: green areas per 100,000 inhabitants, total water consumption in the city, number of cars per capita (
Figure 1).
In terms of economic order, only two indicators were analysed: the number of companies per 100, 000 inhabitants, and debt servicing ratio. The city of Gdynia obtained the best result with a maximum value of 1 for these indicators. Another European city, Zagreb ranked second with the value of these indicators in the range between 0.63 and 0.67. Comparable values of total utility, in the range between 0.62 and 0.83, referred to cities such as: London, Amsterdam, Buenos Aires and Los Angeles. Whereas the city of Dubai came last with the value of 0.19 (
Figure 2).
In terms of social order, the best place was taken by the city of Gdynia with a total utility value of 5.56. Four indicators reached a partial value within the range between 0.99 and 1, i.e., maximum and these are: number of firefighters per 100,000 inhabitants, under-five mortality rate per 1000 births, violent crime rate per 100,000 inhabitants, percentage of population living in slums. The city of Dubai ranked second with a total utility value of 4.78. This city achieved the highest partial utility values (0.99–1) for indicators such as: youth unemployment, number of police officers per 100,000 inhabitants, percentage of the population living in slums, percentage of violent crime per 100,000 inhabitants.
Subsequent places referred to the following cities: Amsterdam, Los Angeles, Zagreb and London with total utility values: 3.6; 3.41; 3.39; 3.06, respectively. The city of Buenos Aires came last with a score of 1.74. Out of seven indicators analysed, three got the value of 0: ambulance response time from notification received, under-five mortality rate per 1000 births, percentage of the population living in slums (
Figure 3).
Taking into account all sustainable development indicators analysed, the city of Gdynia obtained the most favourable value of total utility (13.33). Out of 16 sustainable development indicators applied in the analysis, as many as 10 obtained a partial value within the range between 0.99 and 1, i.e., maximum. The city of Amsterdam ranked second with a total utility value of 10.17. The other two European cities: Zagreb and London, obtained nearly identical results, in the conducted assessment of the quality of life: 9.32 and 9.91 points of the total utility value, respectively. Subsequent places referred to metropolises, such as: Los Angeles, Dubai, Buenos Aires, with total utility values: 8.49; 5.85; 5.76, respectively (
Figure 4).
5. Discussion
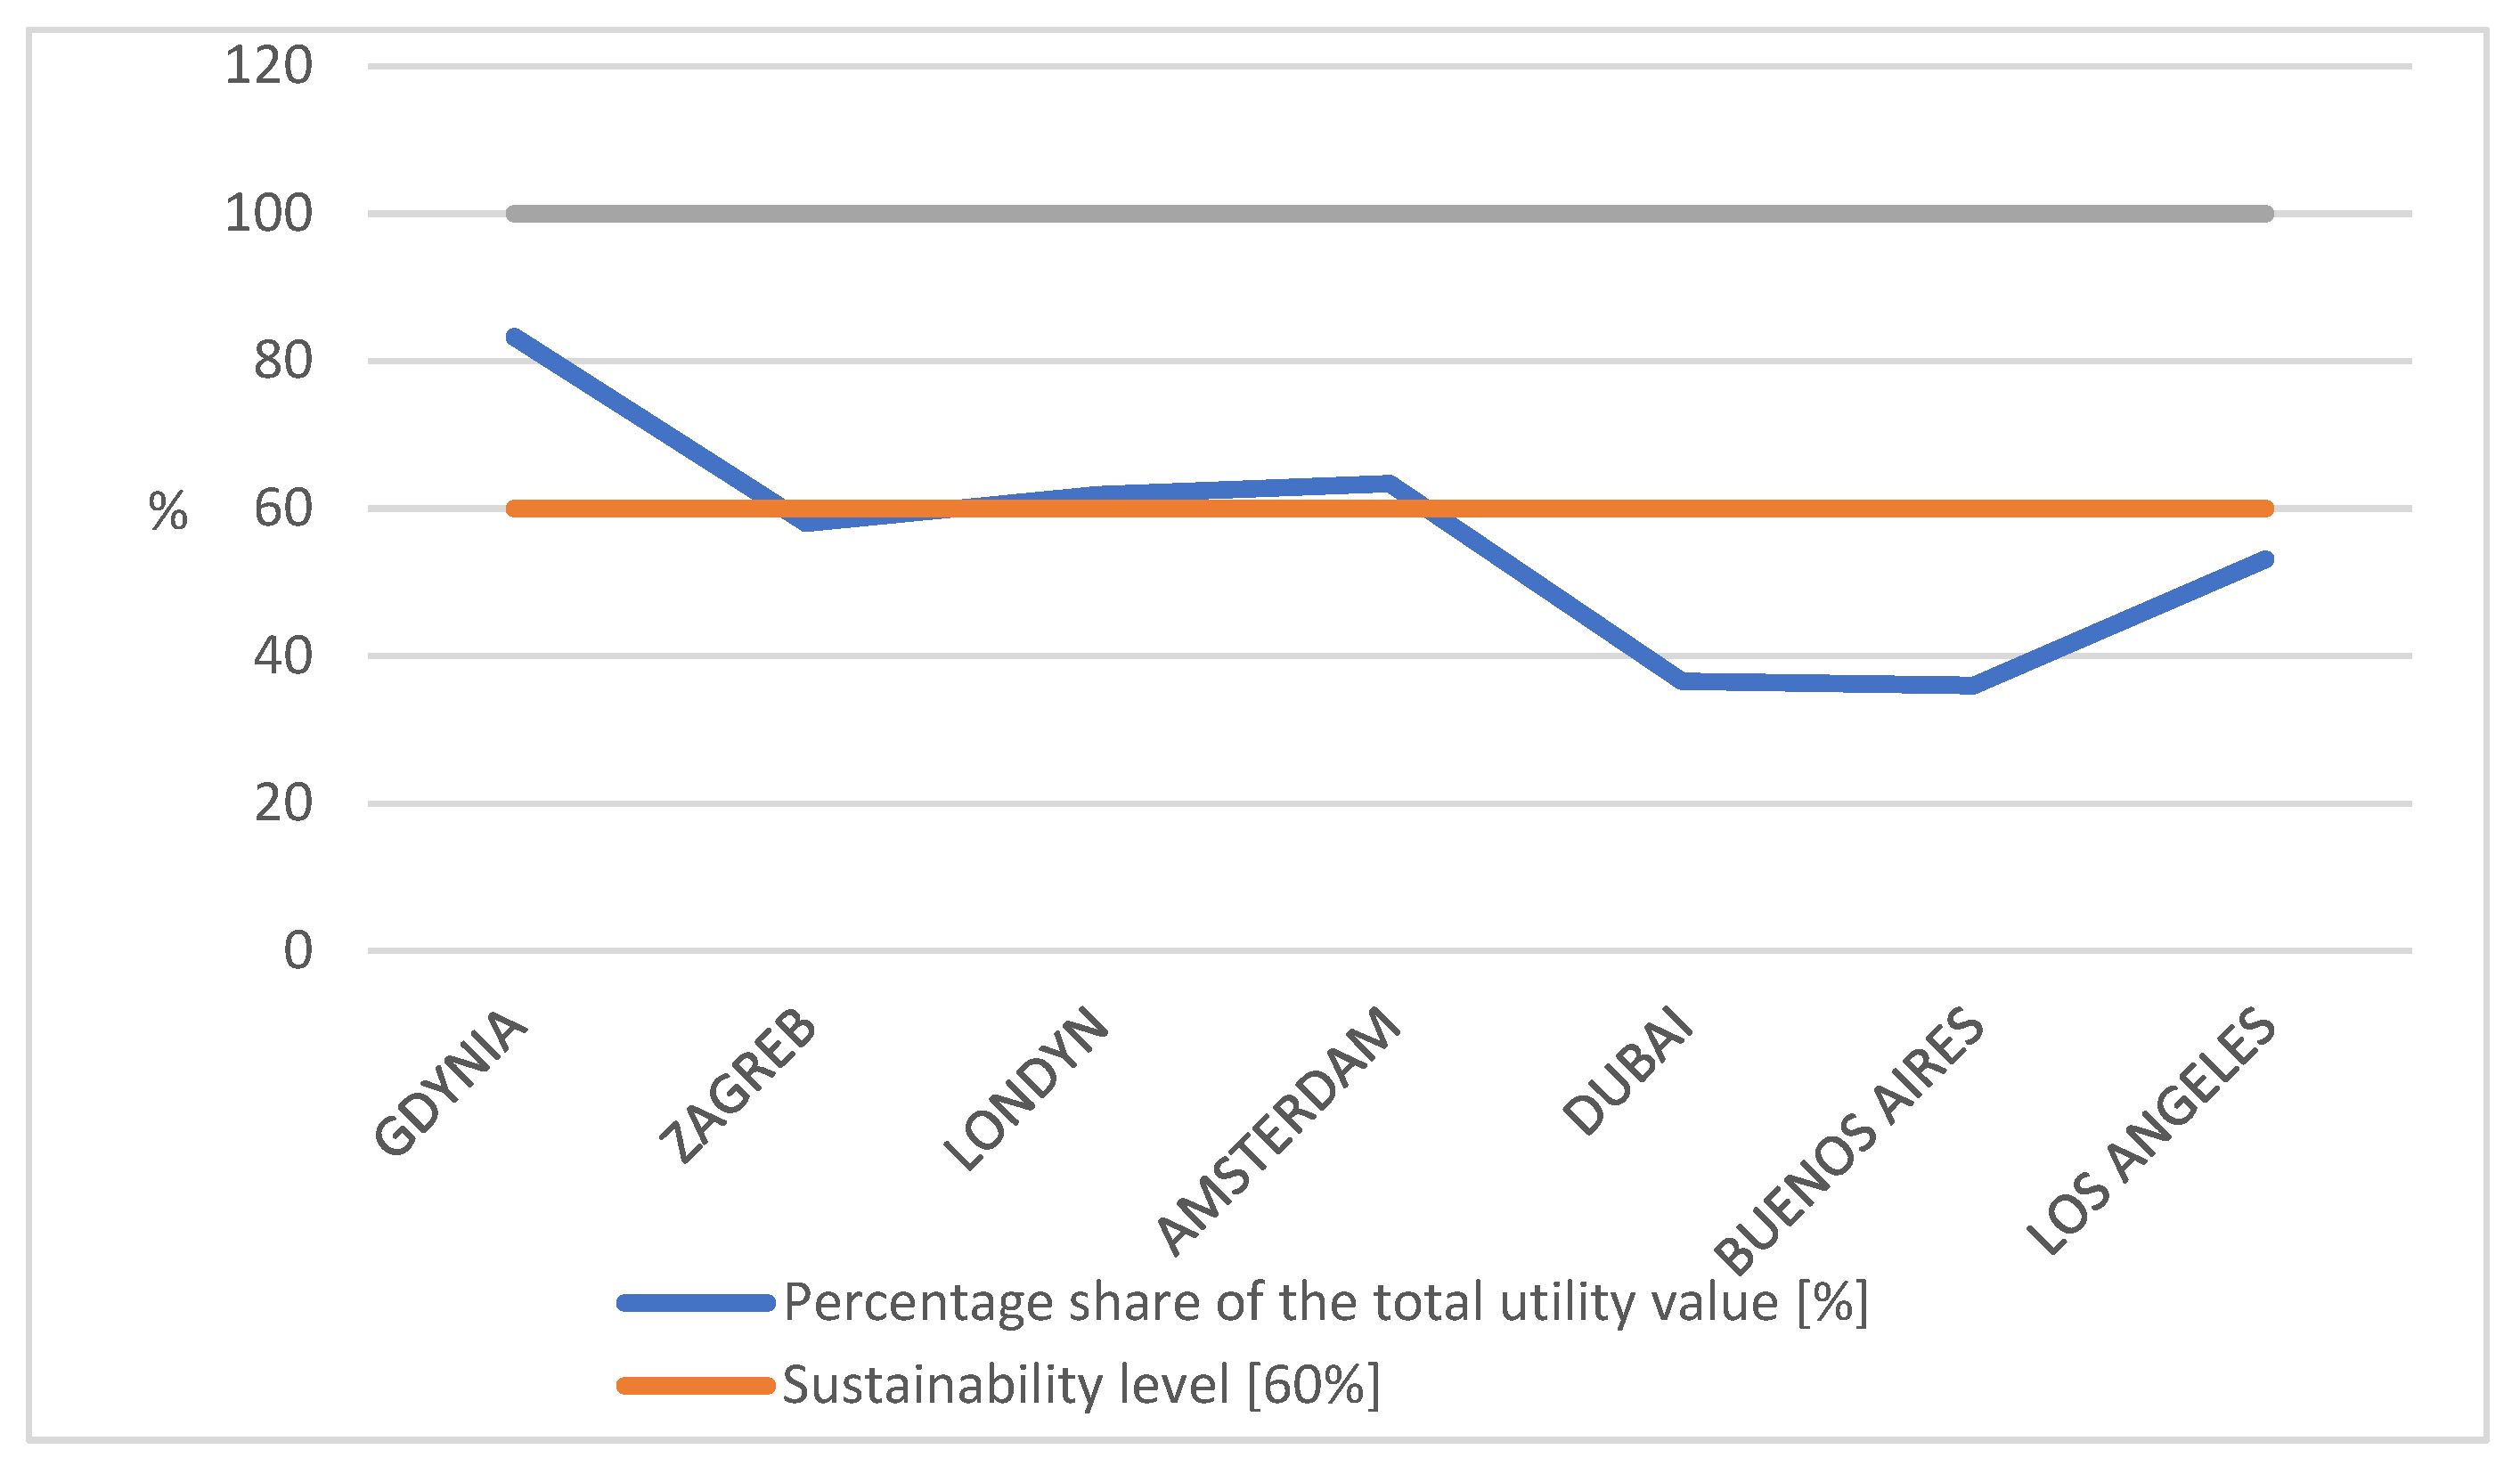
The applied vector of reference is an artificial reference of the most favourable values, equal to the number of all indicators taken into account in the analysis (16) with their highest value possible to obtain, i.e., the value of 1. The authors have assumed that in the analysed cities the sustainable development in the context of objective quality of life occurs when the average values of total utility exceed 60% of the reference value in the analysed dimensions.
The data presented in
Figure 5 and
Figure 6 prove that the most favourable result in this respect was achieved by the city of Gdynia—83% of the value of reference. The city of Amsterdam ranked second with the result of 63.4% and London ranked third with the result of 61.9%. Therefore, it can be considered that these three cities are characterised by sustainable development in the context of objective quality of life with regard to the 16 ISO 37120 standard indicators included in the analysis. Zagreb almost reached the sustainable development threshold with the result of 58.0%. The other three analysed cities fail to meet this condition since the percentage share of the total utility value in the value of reference amounts to: 53.1, 36.6 and 36.0 respectively.
Percentage share of the total utility value with regard to the reference value and sustainability level (60%) for the analysed cities was graphically presented in
Figure 6.
The overall analysis of the obtained results has indicated that the city of Gdynia is characterised by a relatively high level of the quality of life compared to other cities. Actually, the score has been confirmed by the awards received by the city, such as: The International Awards for Liveable Communities. The award honours individual cities for the proper management of local environment and the development of friendly living conditions for their inhabitants. It aims to encourage following good practices, implementing innovations and, above all, developing high-quality services and the environment for the city residents [
61]. Gdynia, as the only Polish city, was among the awarded finalists in the category of cities with a population of 150,000 to 400,000 inhabitants. The LiveCom Awards cover five categories, but Gdynia won in the Whole City Award category, namely the competition covering all aspects of city life. However, it should be emphasized that the Award 2019 edition focused primarily on issues related to climate change. In previous editions, the finalists included e.g., Abu Dhabi—United Arab Emirates, Swedish Malmo, Australian Port Fairy, or American Honolulu.
At that time, 250,000 cities took part in the competition for the world’s best city to live, and Gdynia was among the best 22 cities and in the category of cities from 150,000 to 400,000 inhabitants it ranked third. It proves that the city applies best practices and experiences in developing a friendly city and implementing the sustainable development goals. For years, the city has been consistently implementing the policy of sustainable development, aimed to secure all the needs of current residents as well as the next generations of residents in Gdynia. The city has previously been awarded the Platinum Smart City Certificate. An international group of outstanding experts decided to award to Gdynia the prestigious LivCom Award for activities in many spheres. In terms of care for natural environment, these included: waste management—94% of residents sort waste, modernization of rainwater drainage systems, protection of the waters of the Gulf of Gdańsk, development of rain gardens, campaign related to non-use of plastic, modern sewage treatment plant, thermal modernization of municipal buildings with the EU funds.
Also, as regards the previous investigations [
54], it is worth mentioning that the results of the ranking of the 7 cities analysed, including 4 European and 3 from the continent of North and South America and Middle East, indicate that—in comparison to the results presented in our previous publication—two European cities, Gdynia and London, retain a high position. The city of Gdynia ranked first among 4 European cities (Amsterdam, Gdynia, London, Zagreb), and the city also retained the first position in the ranking of 7 cities analysed: Amsterdam, Gdynia, London, Zagreb, Dubai, Buenos Aires, Los Angeles. The city of Amsterdam retained its second position in both rankings. The ranking results for the city of London are also noteworthy. The city obtained the first place in the ranking of European cities in the environmental order and retained this position in the ranking of the European and non-European cities. In both rankings, this high result was influenced by high values of partial utility of such sustainable development indicators as: concentration of particulate matter (PM 2.5), concentration of suspended dust (PM 10), total amount of solid waste collected in the city per 1 inhabitant, total consumption water in the city, green areas per 100 thousand. inhabitants, number of cars per capita. The studies comparable results for cities such as Amsterdam, Los Angeles, Zagreb and London in relation to the utility value are also noteworthy. In the case of the last two cities, almost identical results were obtained for the total utility value, with a maximum partial value for indicators such as: emergency response time, percentage of population living in slums, total solid waste collected, total water consumption per person. Thus, these are indicators of the social and environmental order that significantly characterize the quality of life in urban agglomerations.
The above results correspond to the results of the city ranking presented in the work of R. Raedo [
31], mentioned already in the Introduction. In his research, the Urban Non-Sustainability Index (UNSI) methodology has been used, based also on the selected indicators from those proposed in ISO 37120:2014 standard. Cities such as Amsterdam, London and Los Angeles achieved high positions in this ranking, which was due to high Environmental Dimension Contribution and Economic and Social Dimension Contribution values. These cities—according to this Spanish author’s calculations—also reached a low level of unsustainability (UNSI): 0.23; 0.19; 0.16 respectively.
We also considered other authors’ points of view regarding innovative ways of the measurement and assessment of the urban quality of life. For example, the proposal for a new concept of urban sustainability composed out of seven (instead of three traditional) pillars [
39], namely: environmental, economic, social, and in addition—cultural, educational, political, and technical ones, seems to be interesting, inspiring and worth taking into account in the future research. Another interesting concept, important for the urban quality of life, [
38], refers to the need to take into consideration not only green strategies, but also blue ones related to stormwater management, water security, flood management, tree health, and even recreation needs.
While searching for more complex tool for urban quality of life measurment, it is also worth mentioning the effective urban governance pillar. It could include various important elements/indicators, such as: decentralization and planning, reduction of inequities, strengthening civil and political rights and also support of local, national, regional and global links [
2]. If such data is available in the future, the Authors consider to take this institutional dimension into account, as they believe it is crucial for the sustainable paradigm operationalization.
Moreover, the authors of this study are fully aware that the conflict between Russia and Ukraine will affect the level and quality of life in Gdynia, because the city has already accepted several thousand refugees from Ukraine, mainly women and children. The city authorities must provide them with social and living conditions, work and education. Therefore, the situation will affect the quality-of-life indicators such as: unemployment among the working age and young people, mortality among children under 5 years old, amount of solid waste collected, total water consumption per person, enrolment rate, expenditure on housing and education, health care, number of inhabitants per 1 health clinic.
The authors of this study believe that the analysed indicators can be used to model the quality of life in cities, and that their analysis may constitute a recommendation for better urban planning. This is indicative of the activities taken by the authorities of the city of Gdynia. Investments in the area of education in the city of Gdynia are invaluable because over 1/4 of the funds from the city budget has been allocated to education. In the city, the Gdynia School of International Baccalaureate was established, and students achieve the matriculation exam best results in the region. The development of education infrastructure was significant. For example, a secondary school was built from scratch as part of the cooperation between Gdynia and Microsoft, participating in the Microsoft Flagship School program. Public transport for children and youth is free of charge. Gdynia is part of the UNICEF network of Child-Friendly Cities. Access to the educational database—e-GIO portal for every resident, parent and student is also worth mentioning. The Experyment Science Centre is one of the largest science centres in Poland.
The following public health services are indicative of a good quality of life in the city: free anti-HPV vaccination for girls, “Fonolandia”—the Gdynia program aimed to counteract digital addiction, Gdynia Health Centre—activities for the health of all residents, telecare system for senior citizens.
Finally, it is worth pointing out that the procedure of collecting and processing the data is time- and cost-consuming and it is difficult to interpret and compare numerous values of indicators of different units. It hinders their interpretation and widespread use. The authors of this publication believe that the applied utility method allows to establish the database of results that are easier to interpret and, first of all, to compare the quality of life on a temporal and spatial scale, in an objective and transparent manner.
6. Conclusions
Humanity has always strived for a better and easier life on planet Earth; however, there are numerous environmental, social and economic challenges on this path, making it impossible to reach the top of the mountain called “good quality of life”. Developing a friendly urban public space does not only refer to comfort and safety of life, but also to ecological aspects. For example, through a number of long-term activities, city residents should be encouraged to give up car mobility in favour of public transport or bicycles. Mobility hubs and further kilometres of bicycle paths must be built. As a matter of fact, the quality of infrastructure in the cities surveyed, requires further modern investments, which is certainly forced by the population density in these metropolises. This indicator is very diverse, which can be seen when comparing cities such as Amsterdam, Buenos Aires, Dubai, Gdynia, London, and Zagreb. Moreover, the electricity consumption per capita in these cities will determine the quality of life. An increase in this consumption usually results in the increase in environmental degradation. The results of eco-balance related to the cumulative value of energy indispensable in transport, food and industrial material production, as well as the air and water pollution and the amount of waste generated, will certainly have a significant physical and chemical impact on people and their psyche.
A large number of sustainable development indicators make it difficult to interpret them in relation to numerous objects surveyed (e.g., cities). Moreover, each of these indicators has its own characteristic unit, which does not allow to aggregate them and provide comparative analysis between the objects surveyed. The authors decided that this barrier could be overcome by applying the theory of utility. Thus, a simple mathematical equation was applied, which allows, as a result of calculations made, to reduce the units characteristic of given sustainable development indicators.
The authors of this paper have attempted to characterize and compare the quality of life of the residents of selected cities in the world based on the Standard 37120 indicators, converted into partial and total utility, which allows to compare, in an objective way, the calculated values relative to the analysed orders: environmental, economic and social ones. The conducted analysis allowed to positively verify the adopted research hypothesis: the ISO 37120 indicators, converted into partial and total utility value, and then grouped within sustainable development dimensions may be used to measure the level of urban quality of life. When we refer the obtained values of sustainable development indicators to environmental, social and economic pillars, we can see a clear and interesting image of the cities evaluated. As regards the environmental dimension, the selected European cities obtained better results than cities from other continents. On the other hand, when it comes to the social pillar, the differences are less significant. The authors are aware that the presented analysis of the city ranking is to some extent limited by the fact that only some indicators were selected for the analysis. Detailed studies would require including all indicators within the WCCD Global Cities Registry™ (GCR) database. Other limitations refer to a relatively small number of cities in this database.
The proposed tool for measuring the urban quality of life, based on the sustainable development indicators, may constitute a step to help and support urban authorities in justifying their regional and local strategies and consequently future investment decisions. The challenge refers to the objective and quantitatively accurate measurement of these phenomena and the related changes. The qualimetrical aspects of assessing the changes in the environment, and social and economic dimensions are and should continue to be the subject of further research, in order to operationalize and implement the sustainability paradigm in modern agglomerations.


