1. Introduction
As environmental pollution has become increasingly severe, sustainable development has emerged as an important research topic. The increased emissions of CO2 caused by the use of fossil fuels have been identified as the biggest cause of global warming. Conventional fossil fuel energy sources threaten the global environment; therefore, the demand for more efficient and eco-friendly polymer electrolyte membrane fuel cells (PEMFCs) is increasing.
A fuel cell is a device that directly generates electricity using hydrogen and oxygen, and an important component of this device is a bipolar plate, which has to perform several functions simultaneously to achieve excellent performance and durability. The bipolar plate is used to supply and distribute reactant gases through a flow channel, facilitate structural support for thin membrane electrode assemblies (MEAs) with weak mechanical properties, and manage water produced inside the fuel cell.
An optimized configuration of the flow channel shape is required for a uniform flow distribution of the supplied reactant gas. To investigate the electrochemical reactions and macroscopic transport phenomena occurring in fuel cells, many researchers have utilized computational fuel cell dynamics (CFCD), which is based on computational fluid dynamics (CFD). This is a useful tool for performance assessment and optimization of the parametric design of fuel cells by providing visualized phenomena occurring in the fuel cells [
1].
The flow field pattern of the fuel cell controls the uniform distribution of the reactant gas in the area between the anode and cathode and the flooding of the water produced. Water flooding leads to a serious adverse effect on the overall mass transport behavior owing to blockage of the reaction channel and subsequently reduces the performance of fuel cells [
2,
3,
4,
5].
As the reactants O
2 and H
2 are consumed in the channel during the operation of a PEMFC, the reaction rates are not uniform throughout the cell, leading to irregularities in the heat of reaction and product formation. Such an irregular distribution causes numerous problems, such as local mechanical stress, temperature, and water content gradients, which may reduce the lifespan and performance of a PEMFC. Many researchers have studied the effects of flow field design on the performance of PEMFCs using CFCD [
6,
7,
8,
9,
10].
Wilberforce et al. [
11], Iranzo et al. [
12], and Xiong et al. [
13] comprehensively reviewed studies by classifying them into flow field patterns, number of channels, flow direction, and design variables of channels/ribs.
Solati et al. conducted a numerical analysis of the internal mass transport behaviors of a straight flow channel and three types of radial flow channels that had the same active area. They noted that according to the radial shape, there was an effect on the reduction in power consumption by the change in internal pressure and the distribution of the reaction gas and that the net power increased by 48% in the flow field that had four radial flow channels [
14].
Yutao et al. conducted evaluated circular flow fields made up of a fan shape and four square-shaped flow fields with ordinary flow channels by numerical analysis. They found that the circular flow fields had excellent current density as oxygen concentration and water content were evenly distributed and that they had an excellent water discharge ability [
15].
Many previous studies have been conducted on the well-known patterns of basic flow fields [
1,
2,
3,
4,
5,
6,
7,
8,
9,
10,
11,
12,
13,
14,
15]. Various phenomena occurring on the anode and cathode sides were visualized through numerical analysis to understand the behaviors and examine the generated output through experiments. However, optimizing the flow field in various aspects is very difficult owing to the limitations of the general patterns and structures of the flow fields. Thus, this study investigated the change in the performance of a round PEM fuel cell through numerical analysis and experiments to examine the flooding phenomenon occurring within the fuel cell as proposed by many researchers, mass transfer behavior through water management, and impact of the discharge of flooding water from the fuel cell on its performance.
2. Materials and Methods
2.1. Model Description
2.1.1. Design of Flow Field
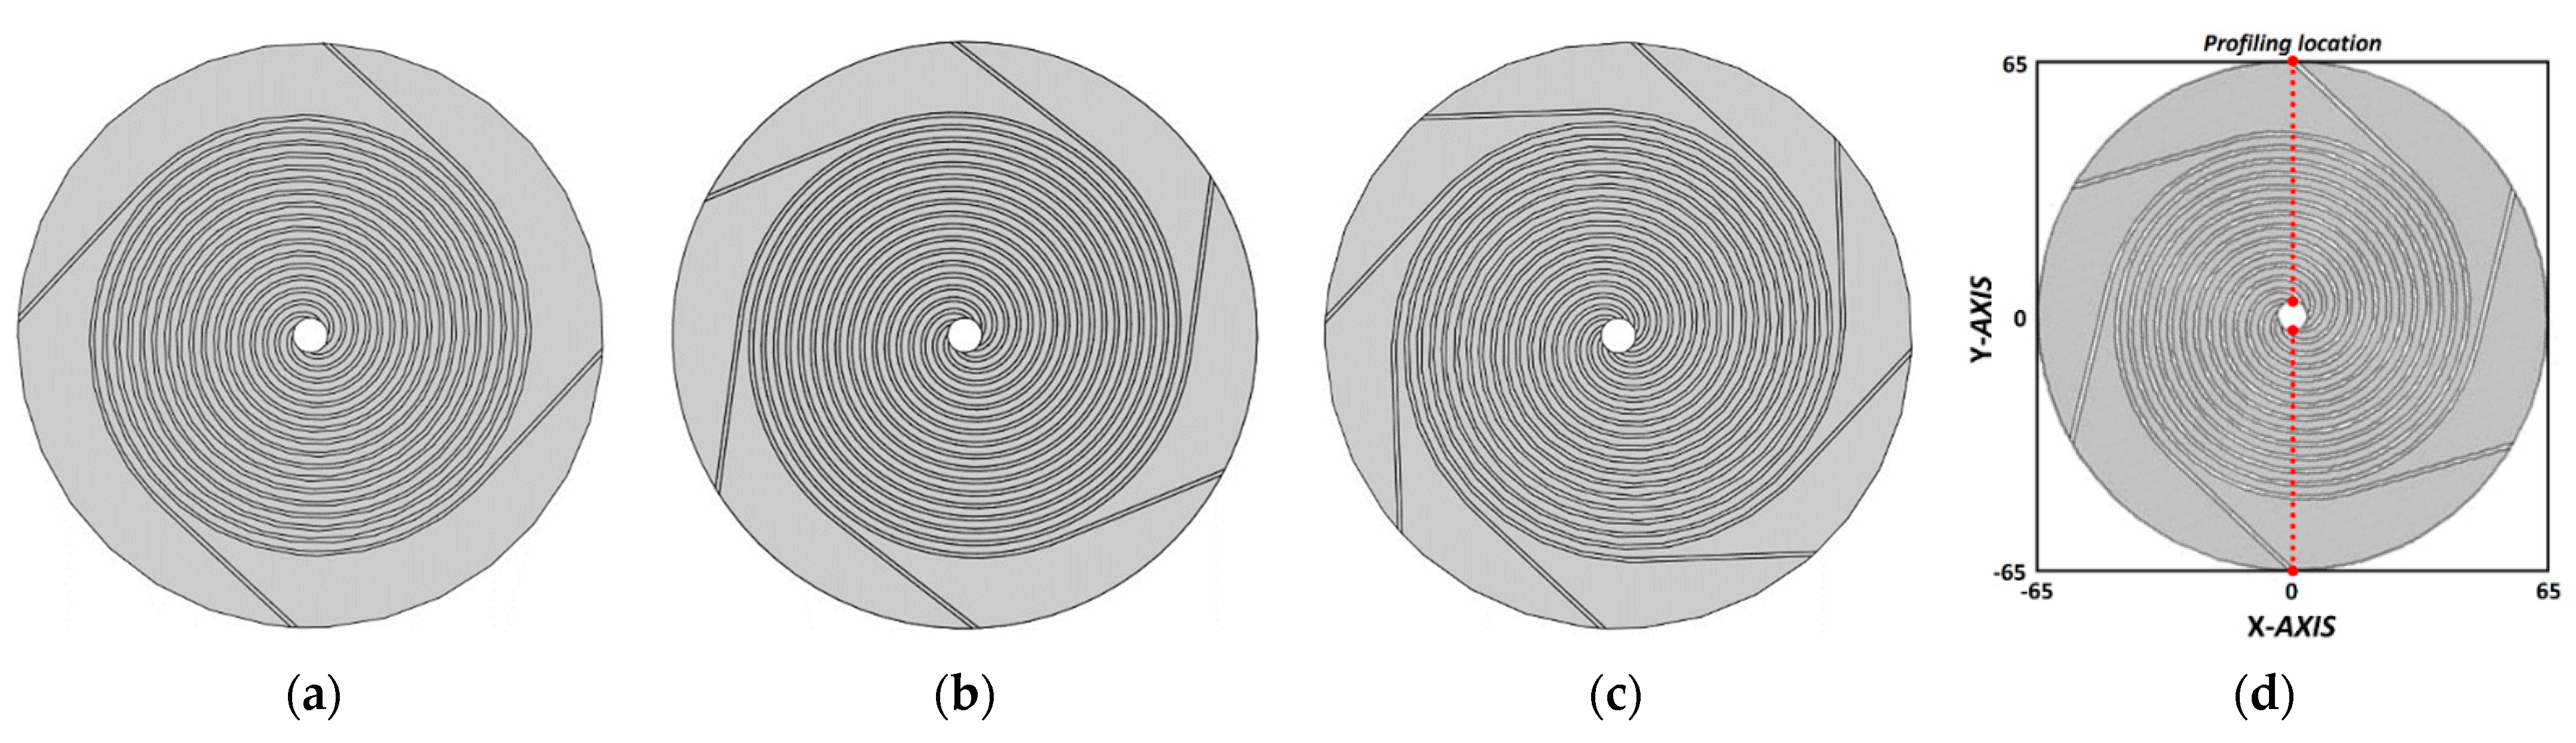
The design of three flow channels used in the numerical analysis was configured such that the spiral diameter in the circular flow channel with an active area of 78.5 cm
2 was maintained constant at 100 mm using Archimedes’ spirals. The detailed data for the numerical analysis are listed in
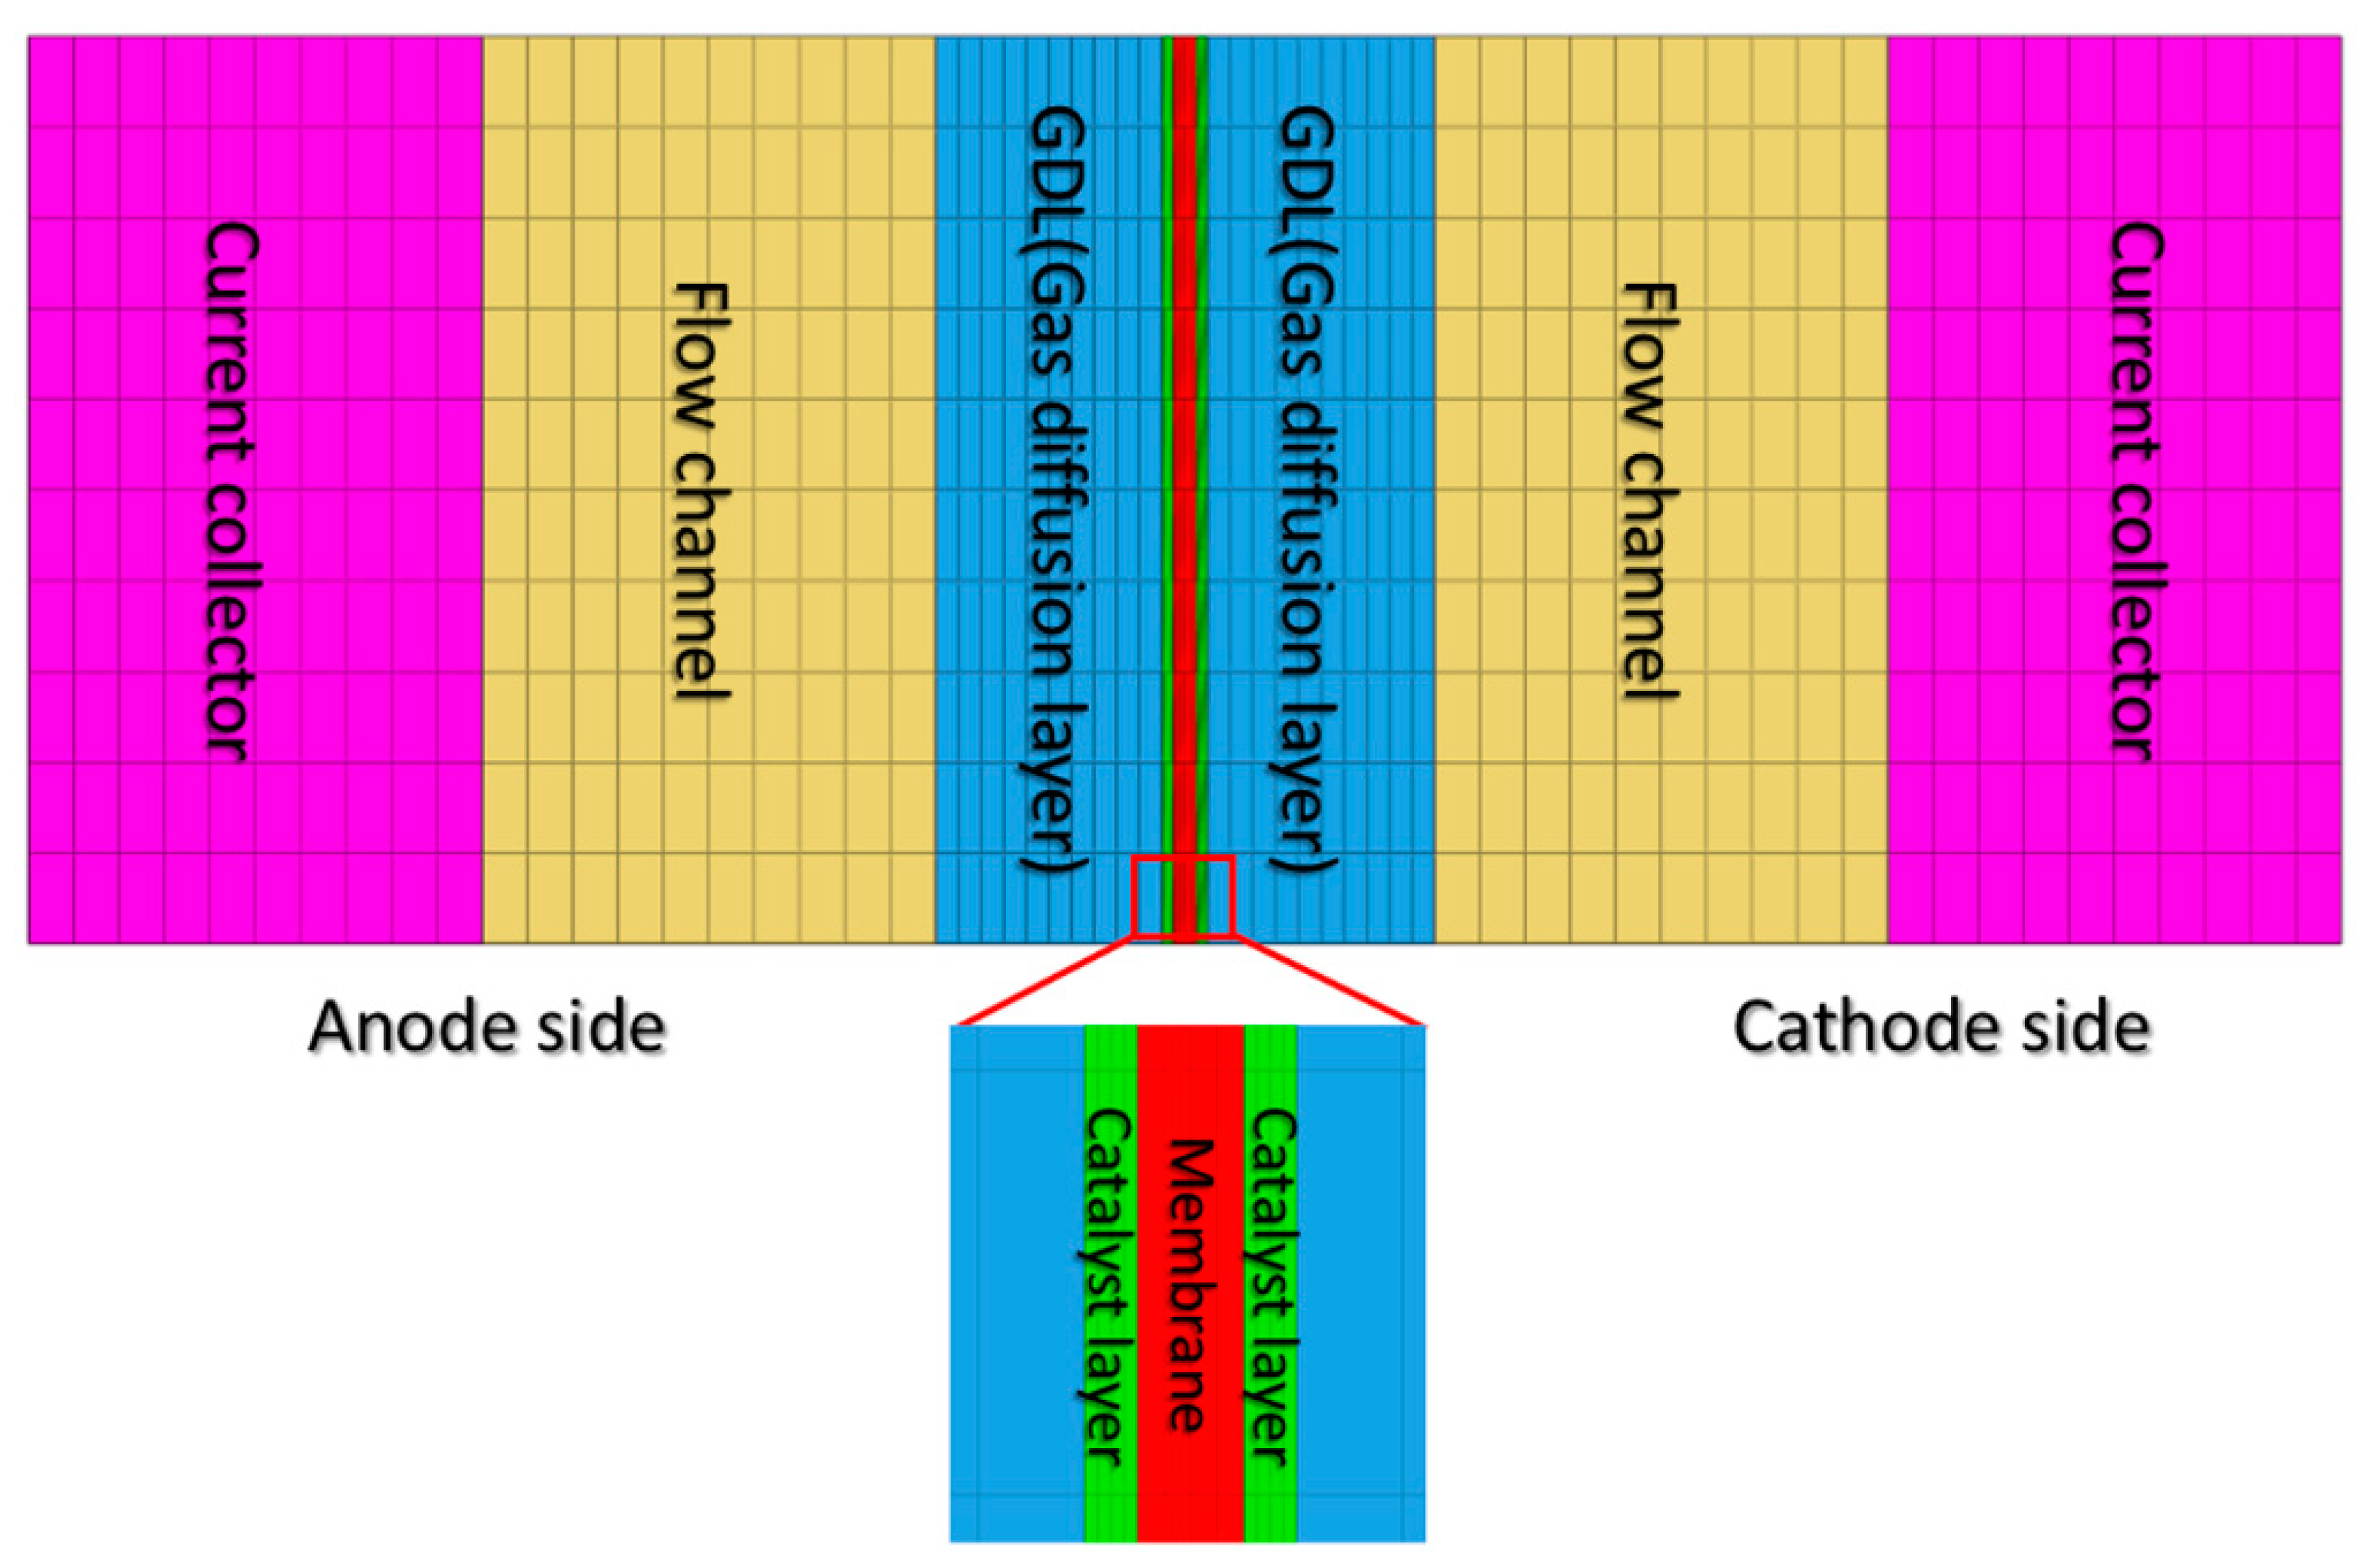
Table 1. The PEMFC is composed of an anode flow channel, anode diffusion layer, MEA, cathode diffusion layer, and cathode flow channel, as shown in
Figure 1. In the circular flow field presented in
Figure 2, reactant gases are supplied through the inlet located at the center of the spiral and discharged through the outlet located on the exterior of the spiral along each flow channel. The diameter of the inlet of three channels with a different shape (CASE #1, CASE #2, and CASE #3) was 7.75 mm, and the outlet had the same dimension as the height and width of the flow channel. The outer diameter of the bipolar plate (BP) was 130 mm, and the flow field diameter was 100 mm, which was the same as the spiral diameter. Other areas acted as simple channels configured to discharge unreacted gases and products. The number of turns of the spirals for the reaction area varied at each channel to maintain the width of the rib constant at 1.75 mm (
Figure 2 and
Table 1).
2.1.2. Governing Equations
Numerical analysis was performed using a commercial ANSYS-FLUENT PEMFC module. The reaction inside a PEMFC involves four chemical species: hydrogen, oxygen, nitrogen, and water. Water exists as a liquid or gas, and nitrogen exists around the membrane electrode assembly. In addition, the condensation of water and dissolution of hydrogen and oxygen occurring on the gas diffusion layer are modeled as a thin water film, and these complex physical phenomena are computed using the mass, momentum, energy, chemical species, and charge conservation equations of an electrochemical reaction [
4,
17,
18]. As described in previous studies [
4,
19,
20,
21], the general governing equations used in the analysis process are affected by various parameters. The analysis model assumes a normal state, ideal gas, and homogeneous two-phase flow [
17].
2.1.3. Boundary Conditions and Numerical Procedure
The numerical analysis model in this study comprises several components: the catalyst layer (CL), gas diffusion layer (GDL), flow channel (CH), and current collector on each of the anode and cathode sides divided by the membrane (MEM) at the center, as shown in
Figure 1.
A numerical analysis was performed to verify the accuracy of the modeled internal mass transfer behavior with that caused by the electrochemical reaction. The details of each material, reaction parameters, and the simulation parameters of the CFD model are presented in
Table 2 and
Table 3. The data used in previous studies [
17,
22,
23,
24,
25,
26] were used for these parameters.
The creation of appropriate grids has a direct impact on the time and results of the simulation. In addition, because the size and number of grids have a considerable impact on the simulation results, they are important factors that must be verified. In this study, a 3D model was created using SOLIDWORKS (Dassault Systèmes SolidWorks Corporation, Waltham, MA, USA) and a grid model suitable for numerical analysis was developed using Altair HyperMesh (Altair Engineering Inc., Troy, MI, USA). To increase the accuracy of the analysis, the node connectivity was uniformly adjusted at the interface of each grid component and grids were formed in the shape of a conformal mesh (quad mesh) using Altair HyperMesh v8.0. The total number of grids for the computation was approximately 3.4 million. The computational process was based on the semi-implicit method for pressure-linked equations (SIMPLE) algorithm using the algebraic multigrid (AMG) technique. To verify the accuracy of the analysis, the sensitivity of the grids and the analysis results were examined using 25 cm
2 serpentine PEM fuel cells [
4,
16]. The convergence residual in this analysis was ≤1 × 10
−7, and for the imbalance of chemical species such as hydrogen, oxygen, and water, the computation was repeated up to 2000 times with 1% or less as the condition for determining convergence. The computation time was approximately 10 h for each operating condition using an HP Workstation (2.0 GHz Tetradeca-core—Dual CPU, 128 GB RAM).
The numerical analysis was based on the profiling locations shown in
Figure 2d. Because of an axial symmetry in the circumferential direction at the center of the circular flow field, only the data in the area of the flow field spiral diameter (100 mm), excluding that of the inlet diameter (7.75 mm) at the center, were compared. Furthermore, to analyze various mass transport behaviors of fuel cells based on the product, the analysis was limited to temperature, current density, water mass fraction, water content, and water activity.
2.2. Experimental Procedure
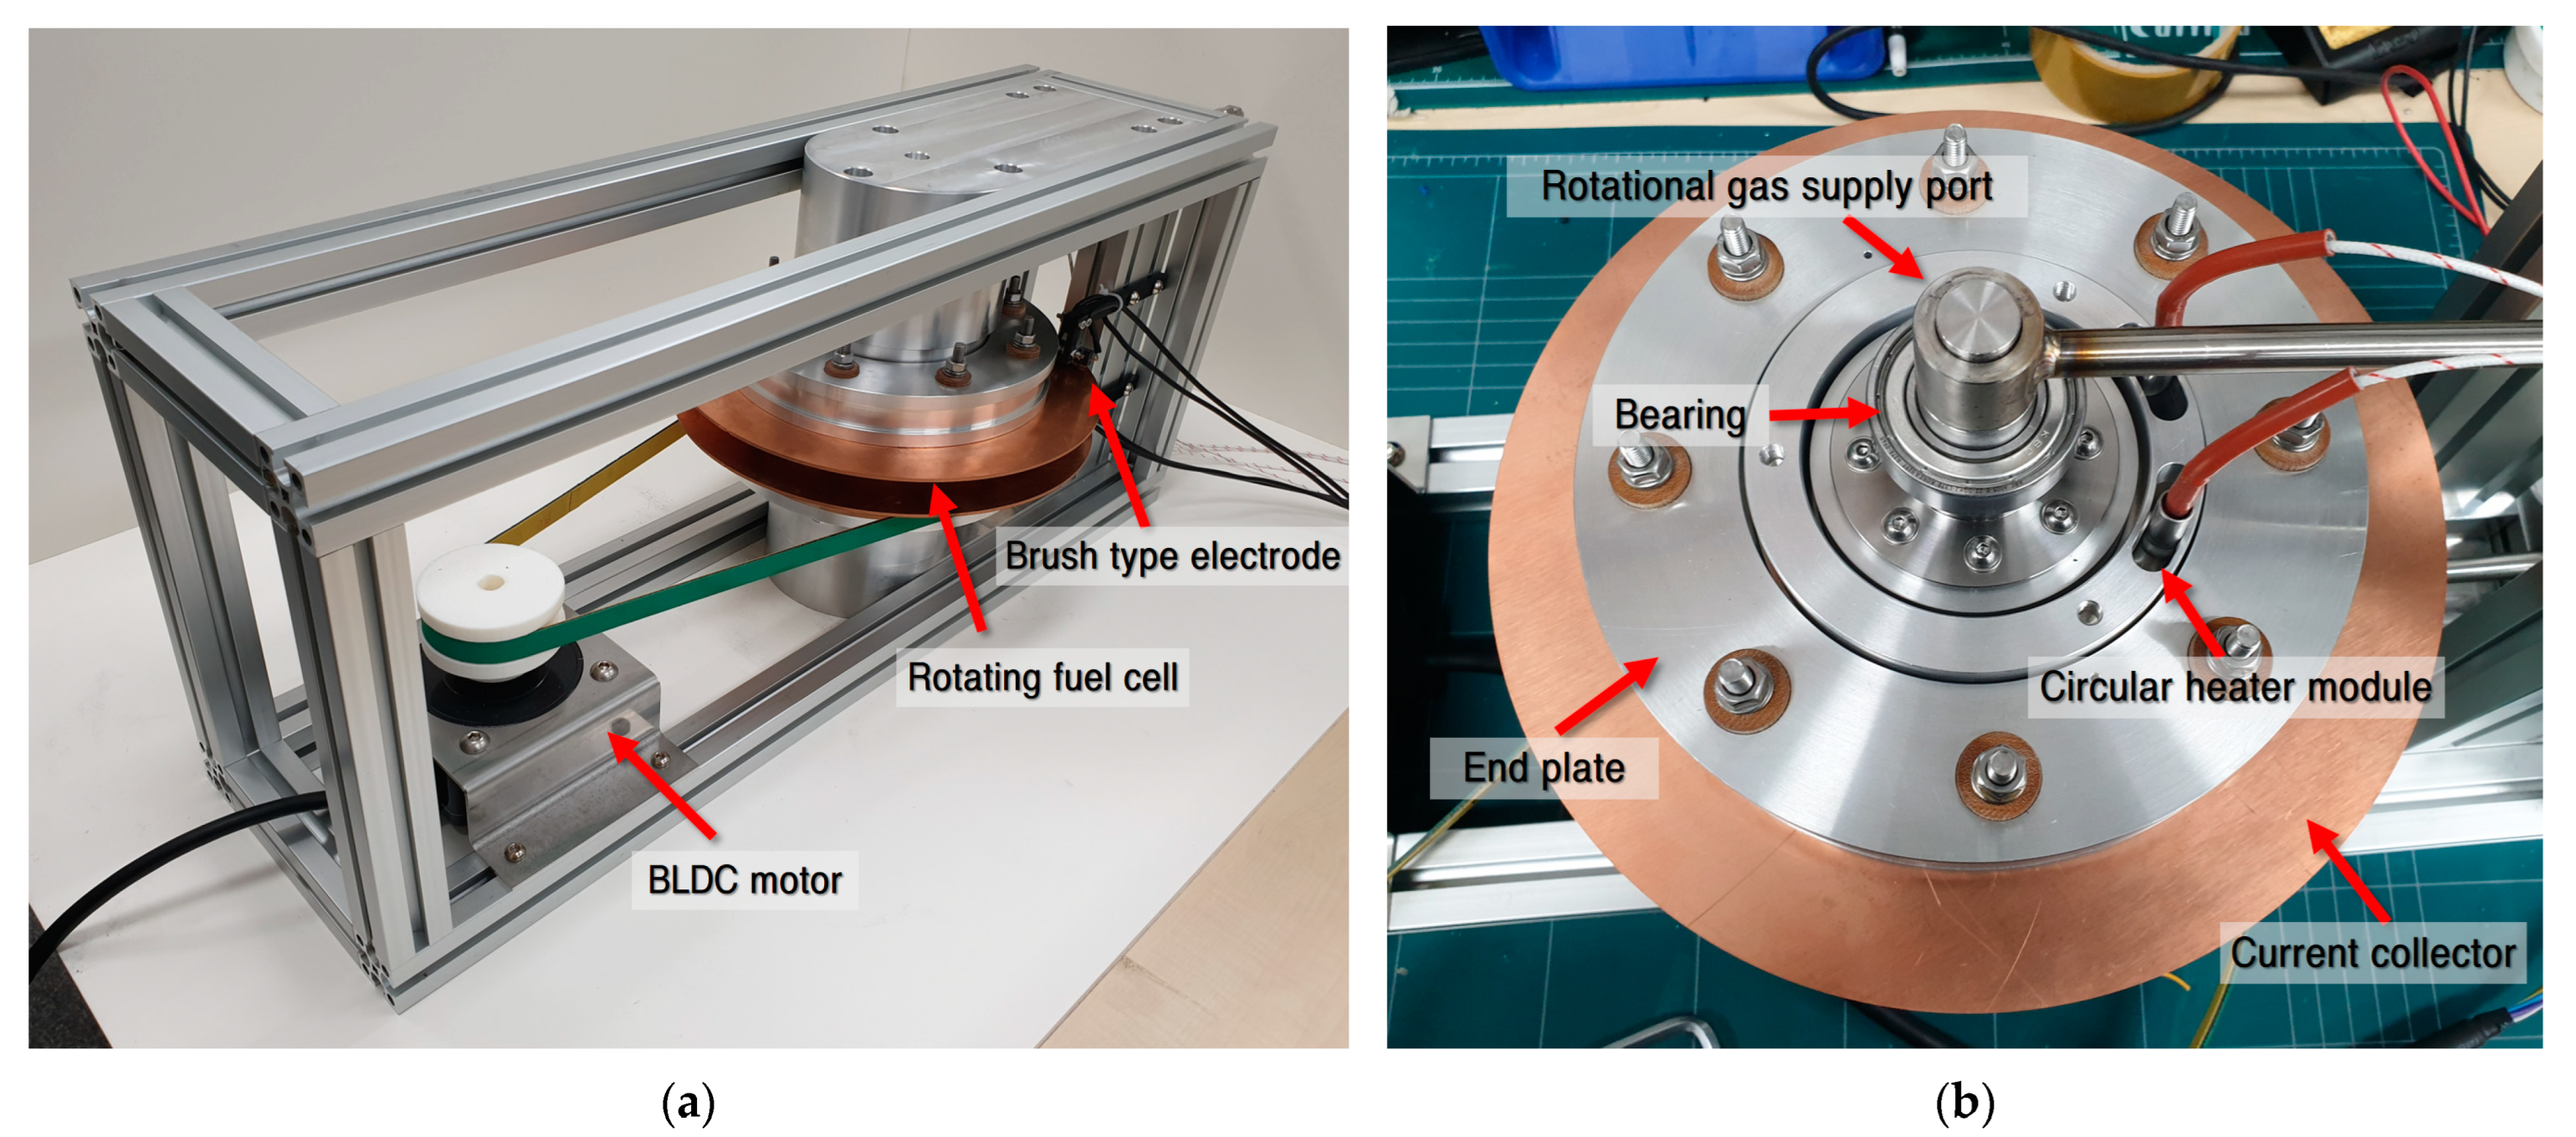
To analyze the performance of the PEMFCs using the polarization curve, the temperature, humidity, and flow rates of the reactant gases were evaluated. Of the three flow fields presented in
Figure 2, the flow field for CASE #1, which had a possibility of flooding, was manufactured (
Figure 3) to experimentally analyze the changes in the performance with the acceleration of water drainage.
The original MEA (G-type MEA, CNL; Ø100 mm, 78.5 cm2) used in the experiment was manufactured by CNL Energy (South Korea). In the MEA, catalyst loading was set at 0.4 mg/cm2 for both the anode and the cathode using the GORE SELECT membrane (15 μm; GORE® Fuel Cell Technologies, Newark, DE, USA), and a 315 μm-thick GDL (39BB, SGL Group, Wiesbaden, Germany) was used.
All devices were controlled with LabVIEW, through RS and GPIB communications, using gas supply device, humidifier, temperature control device, electronic rod, and data measuring device, for the experiment on the round fuel cell. For the precise control of each flow rate in the gas supply devices, an MFC (SLA5850S, Brooks, PA, USA) that could control H2, O2, air, and N2, and a 3.9 L-class bubble-type humidifier were used. To control the temperature by dividing the components and sections of the fuel cell system, five PID temperature controllers on the anode and cathode (NX4, Hanyoung Nux, Incheon, Korea) and K-type thermocouples (produced in this study) were used. The fuel cell performance was measured using GPIB communication for high-speed data measurement, using an electronic load (PLZ-664WA, KIKUSUI, Yokohama, Japan). For all the above devices, an integrated control and monitoring program was developed using LabVIEW 2012 (National Instruments, Austin, TX, USA) and the experimental apparatus composed of eight modules was developed using NI CompactDAQ (cDAQ-9172, National Instruments, TX, USA).
All experimental procedures complied with the well-defined FCTEST net procedures for a single cell [
27]. The experimental conditions were set at a constant operating pressure of 101 kPa (absolute) and a temperature of 75 °C. The inlet supply flow rates of the reaction gases were 1.5 and 2.0, based on the stoichiometric ratio (
Table 3).
3. Results and Discussion
3.1. Simulation Results
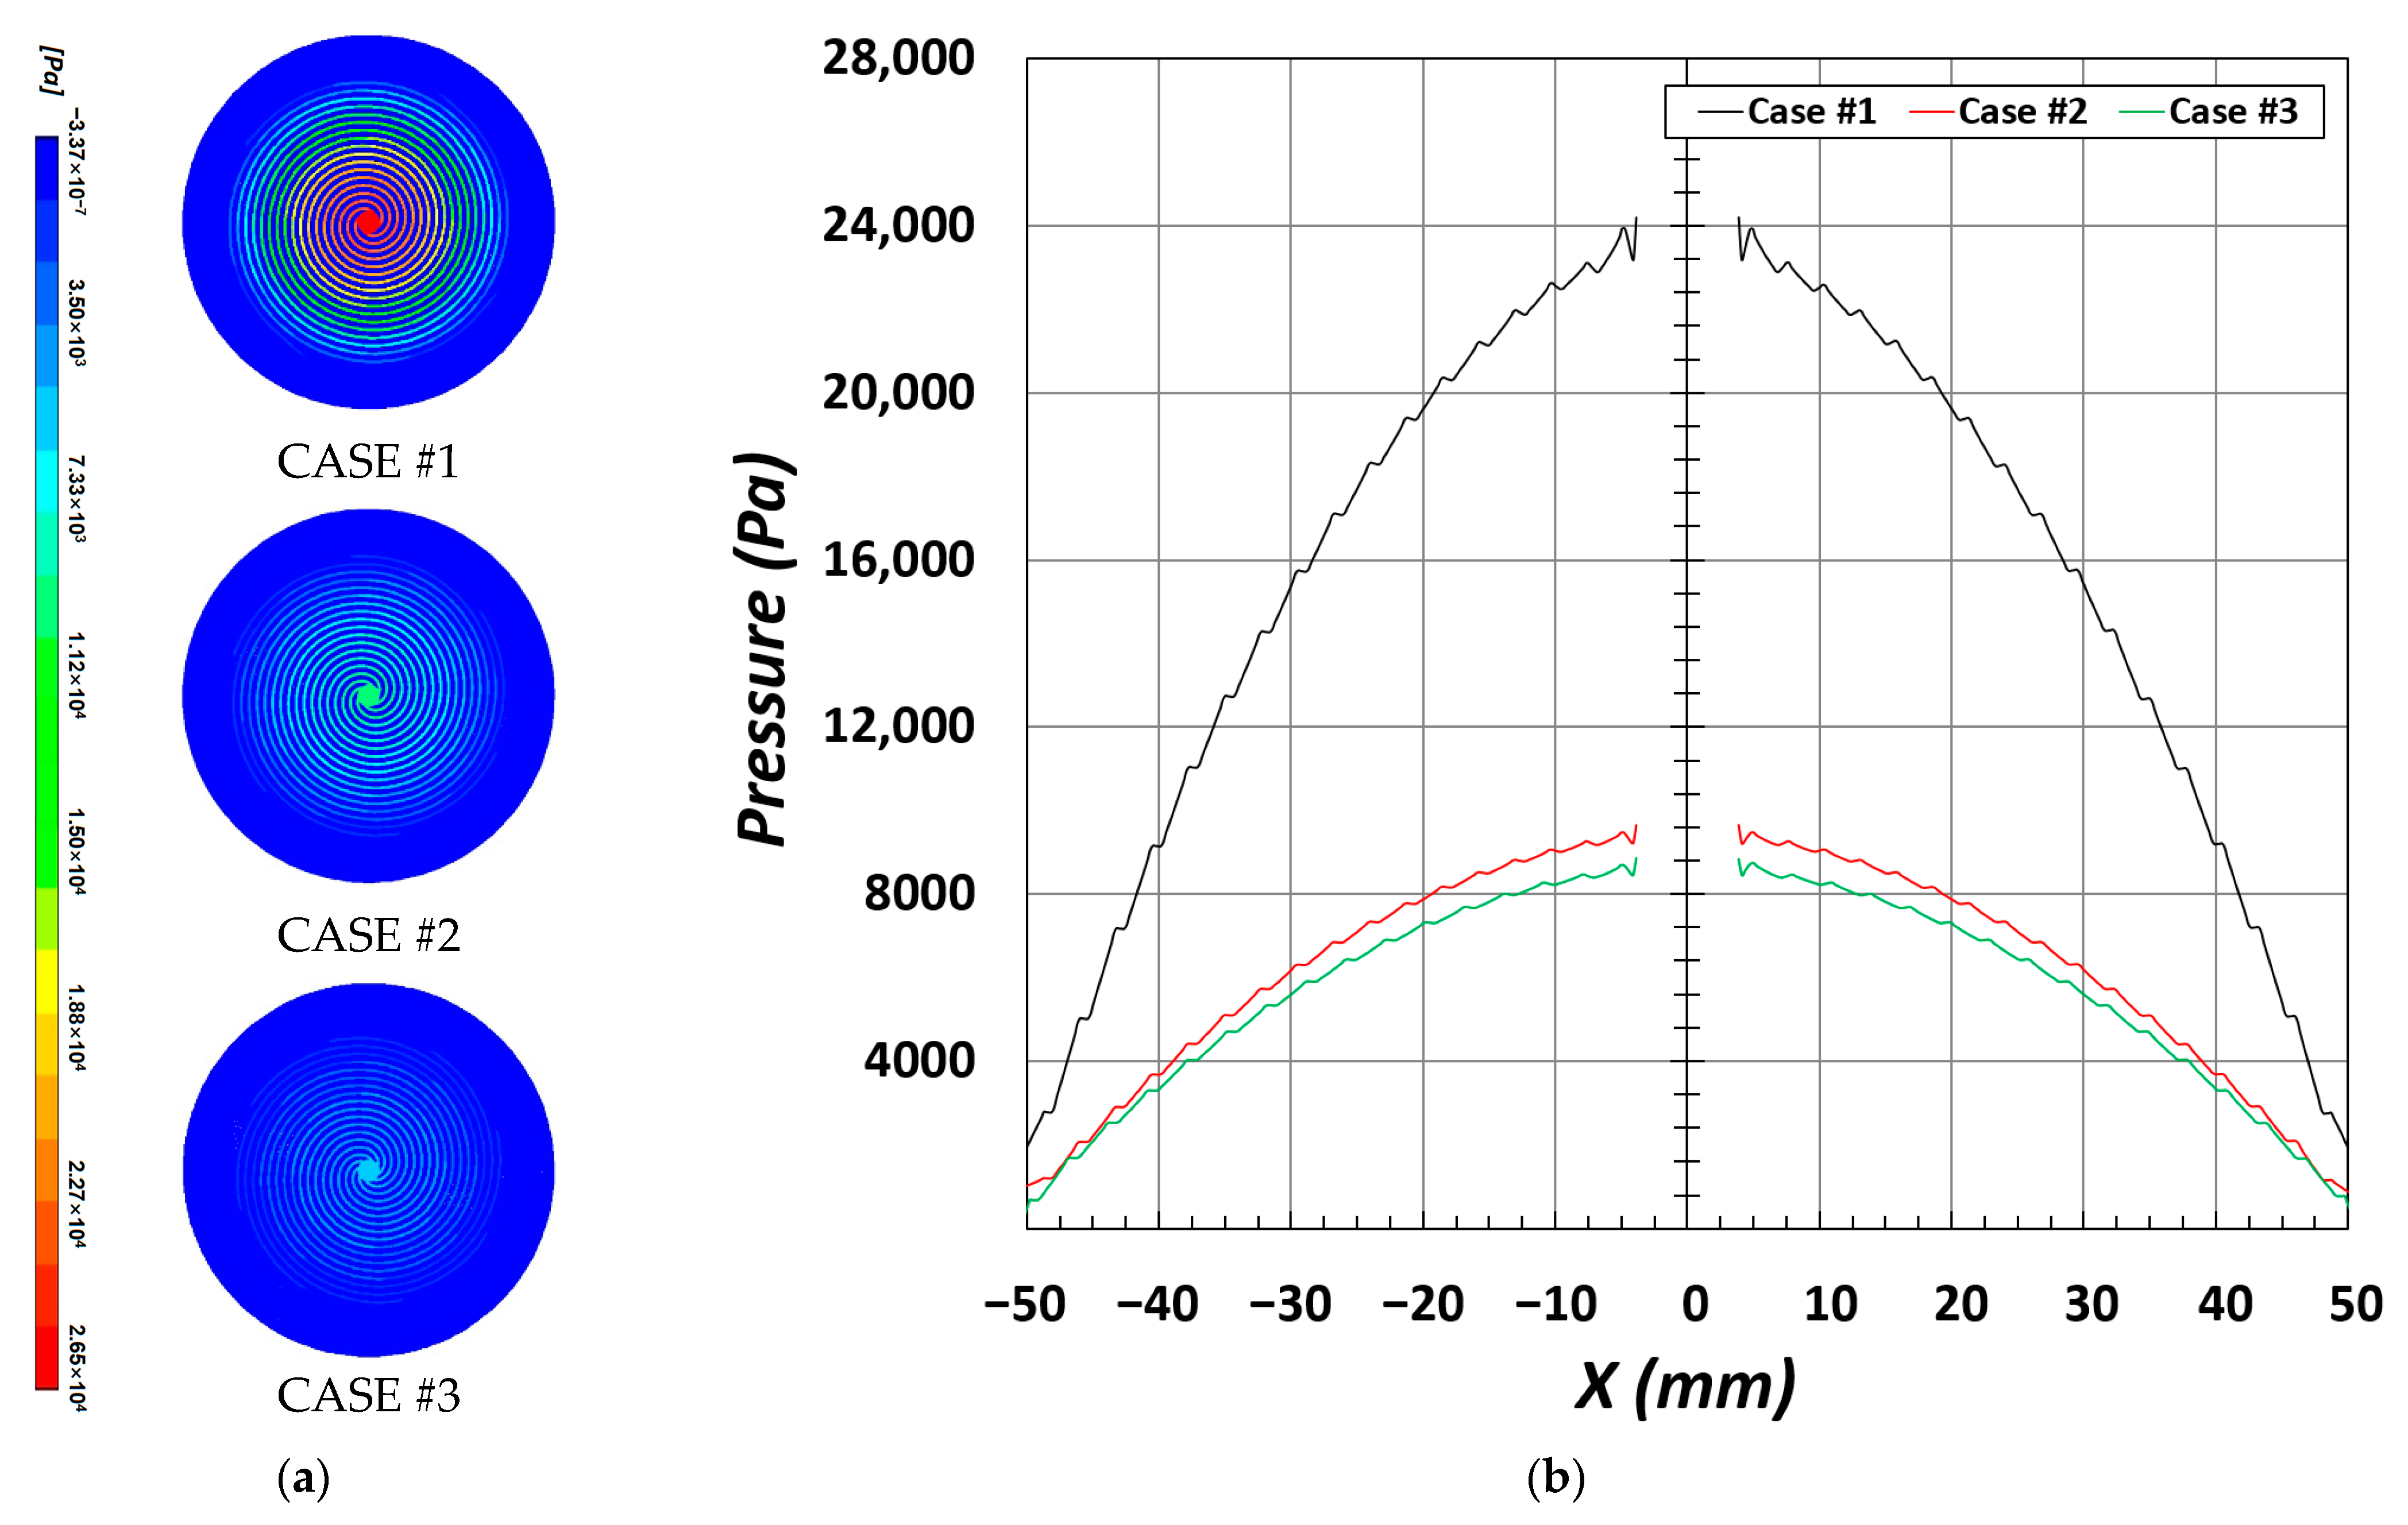
The polarization curve that is most commonly used to analyze the overall performance of PEMFCs is classified into the following sections: activation, ohmic, and mass transport losses. In particular, the section that shows the largest change is the mass transport loss section, and the difference is mostly caused by insufficient supply of reactant gases and flooding by water produced during the electrochemical reaction. Subsequently, the reactant gases supplied to the fuel cell inlet are transported along the flow channel that has an internal geometric shape, and their pressure changes according to the length of the flow channel and width of the channel/rib (
Figure 4). In addition, under-rib convection between the GDL and rib due to the pressure difference developed between channels further activates the electrochemical reaction and increases the reaction rates. Furthermore, under-rib convection also contributes to forcing the water produced by the electrochemical reaction through the channel [
16,
28].
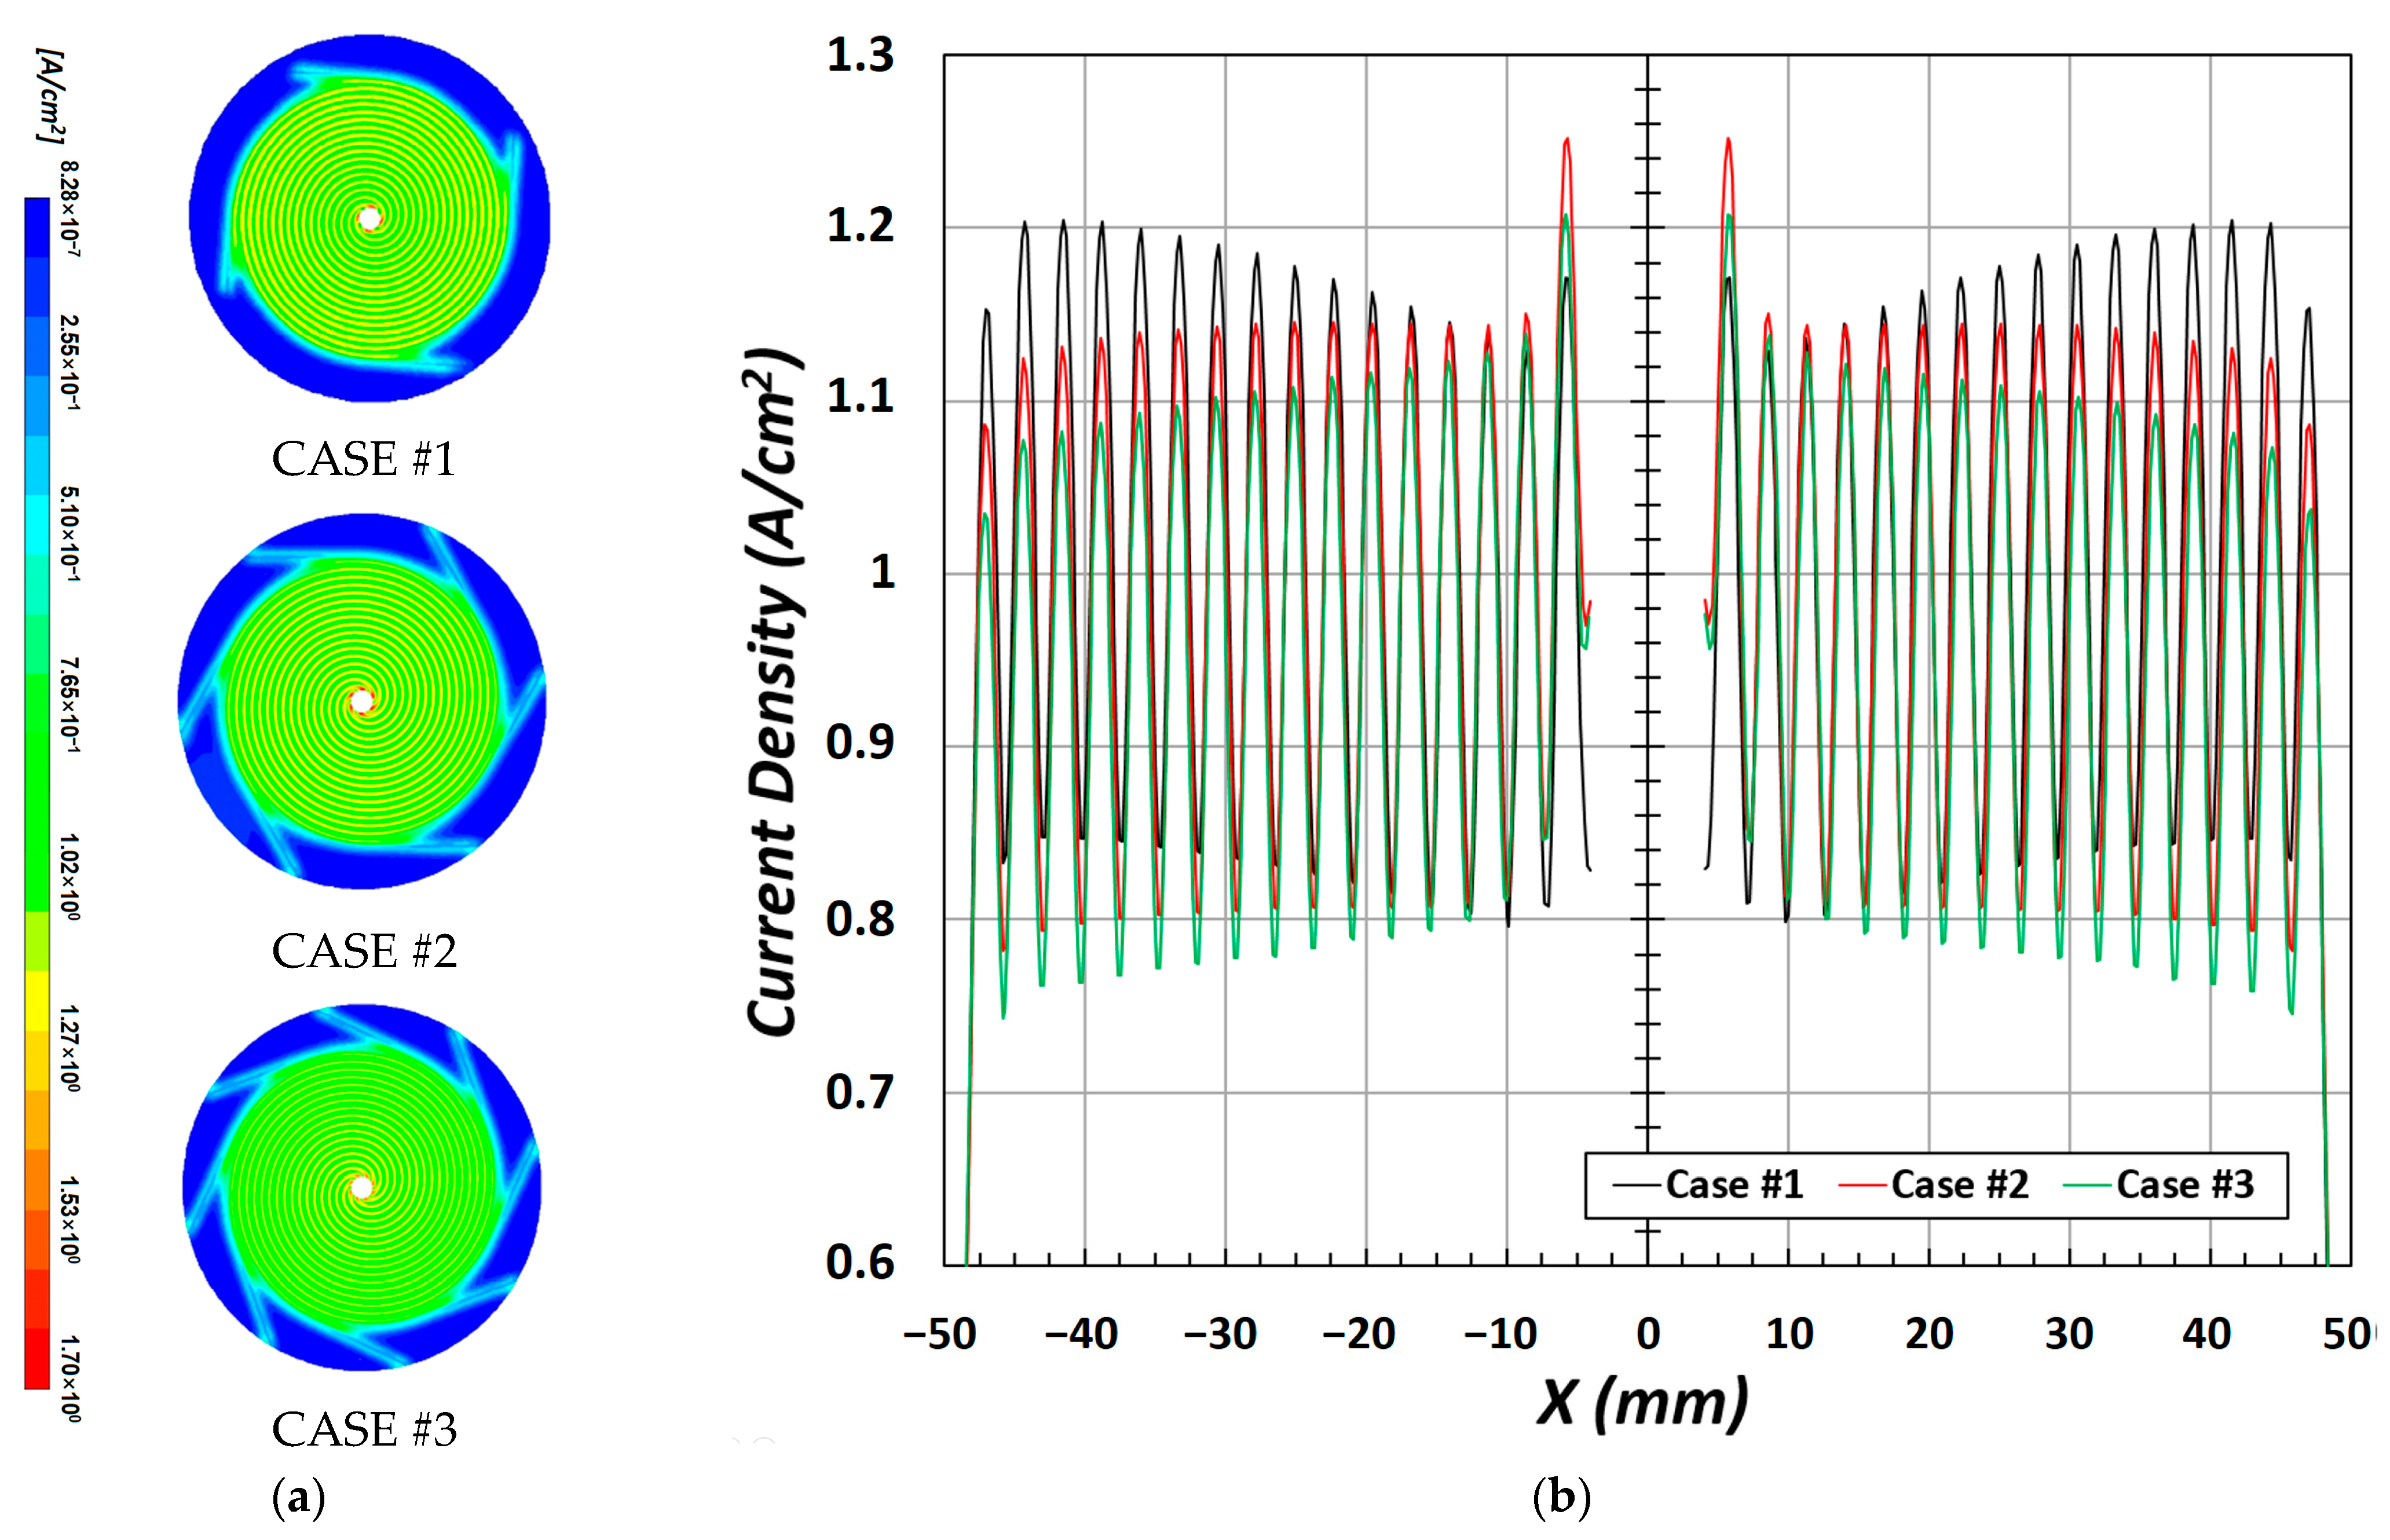
The distribution of the current density due to the electrochemical reaction is shown in
Figure 5a. Notably, all three types of flow channels (CASE #1, CASE #2, and CASE #3) have similar trends in the current density distribution, but show a high current density in the rib area. Particularly, in CASE #1, as shown in
Figure 5b, the amplitude of current density between the channel and rib is larger than that in CASE #2 and CASE #3 in the section of X = ±25 mm to X = ±50 mm.
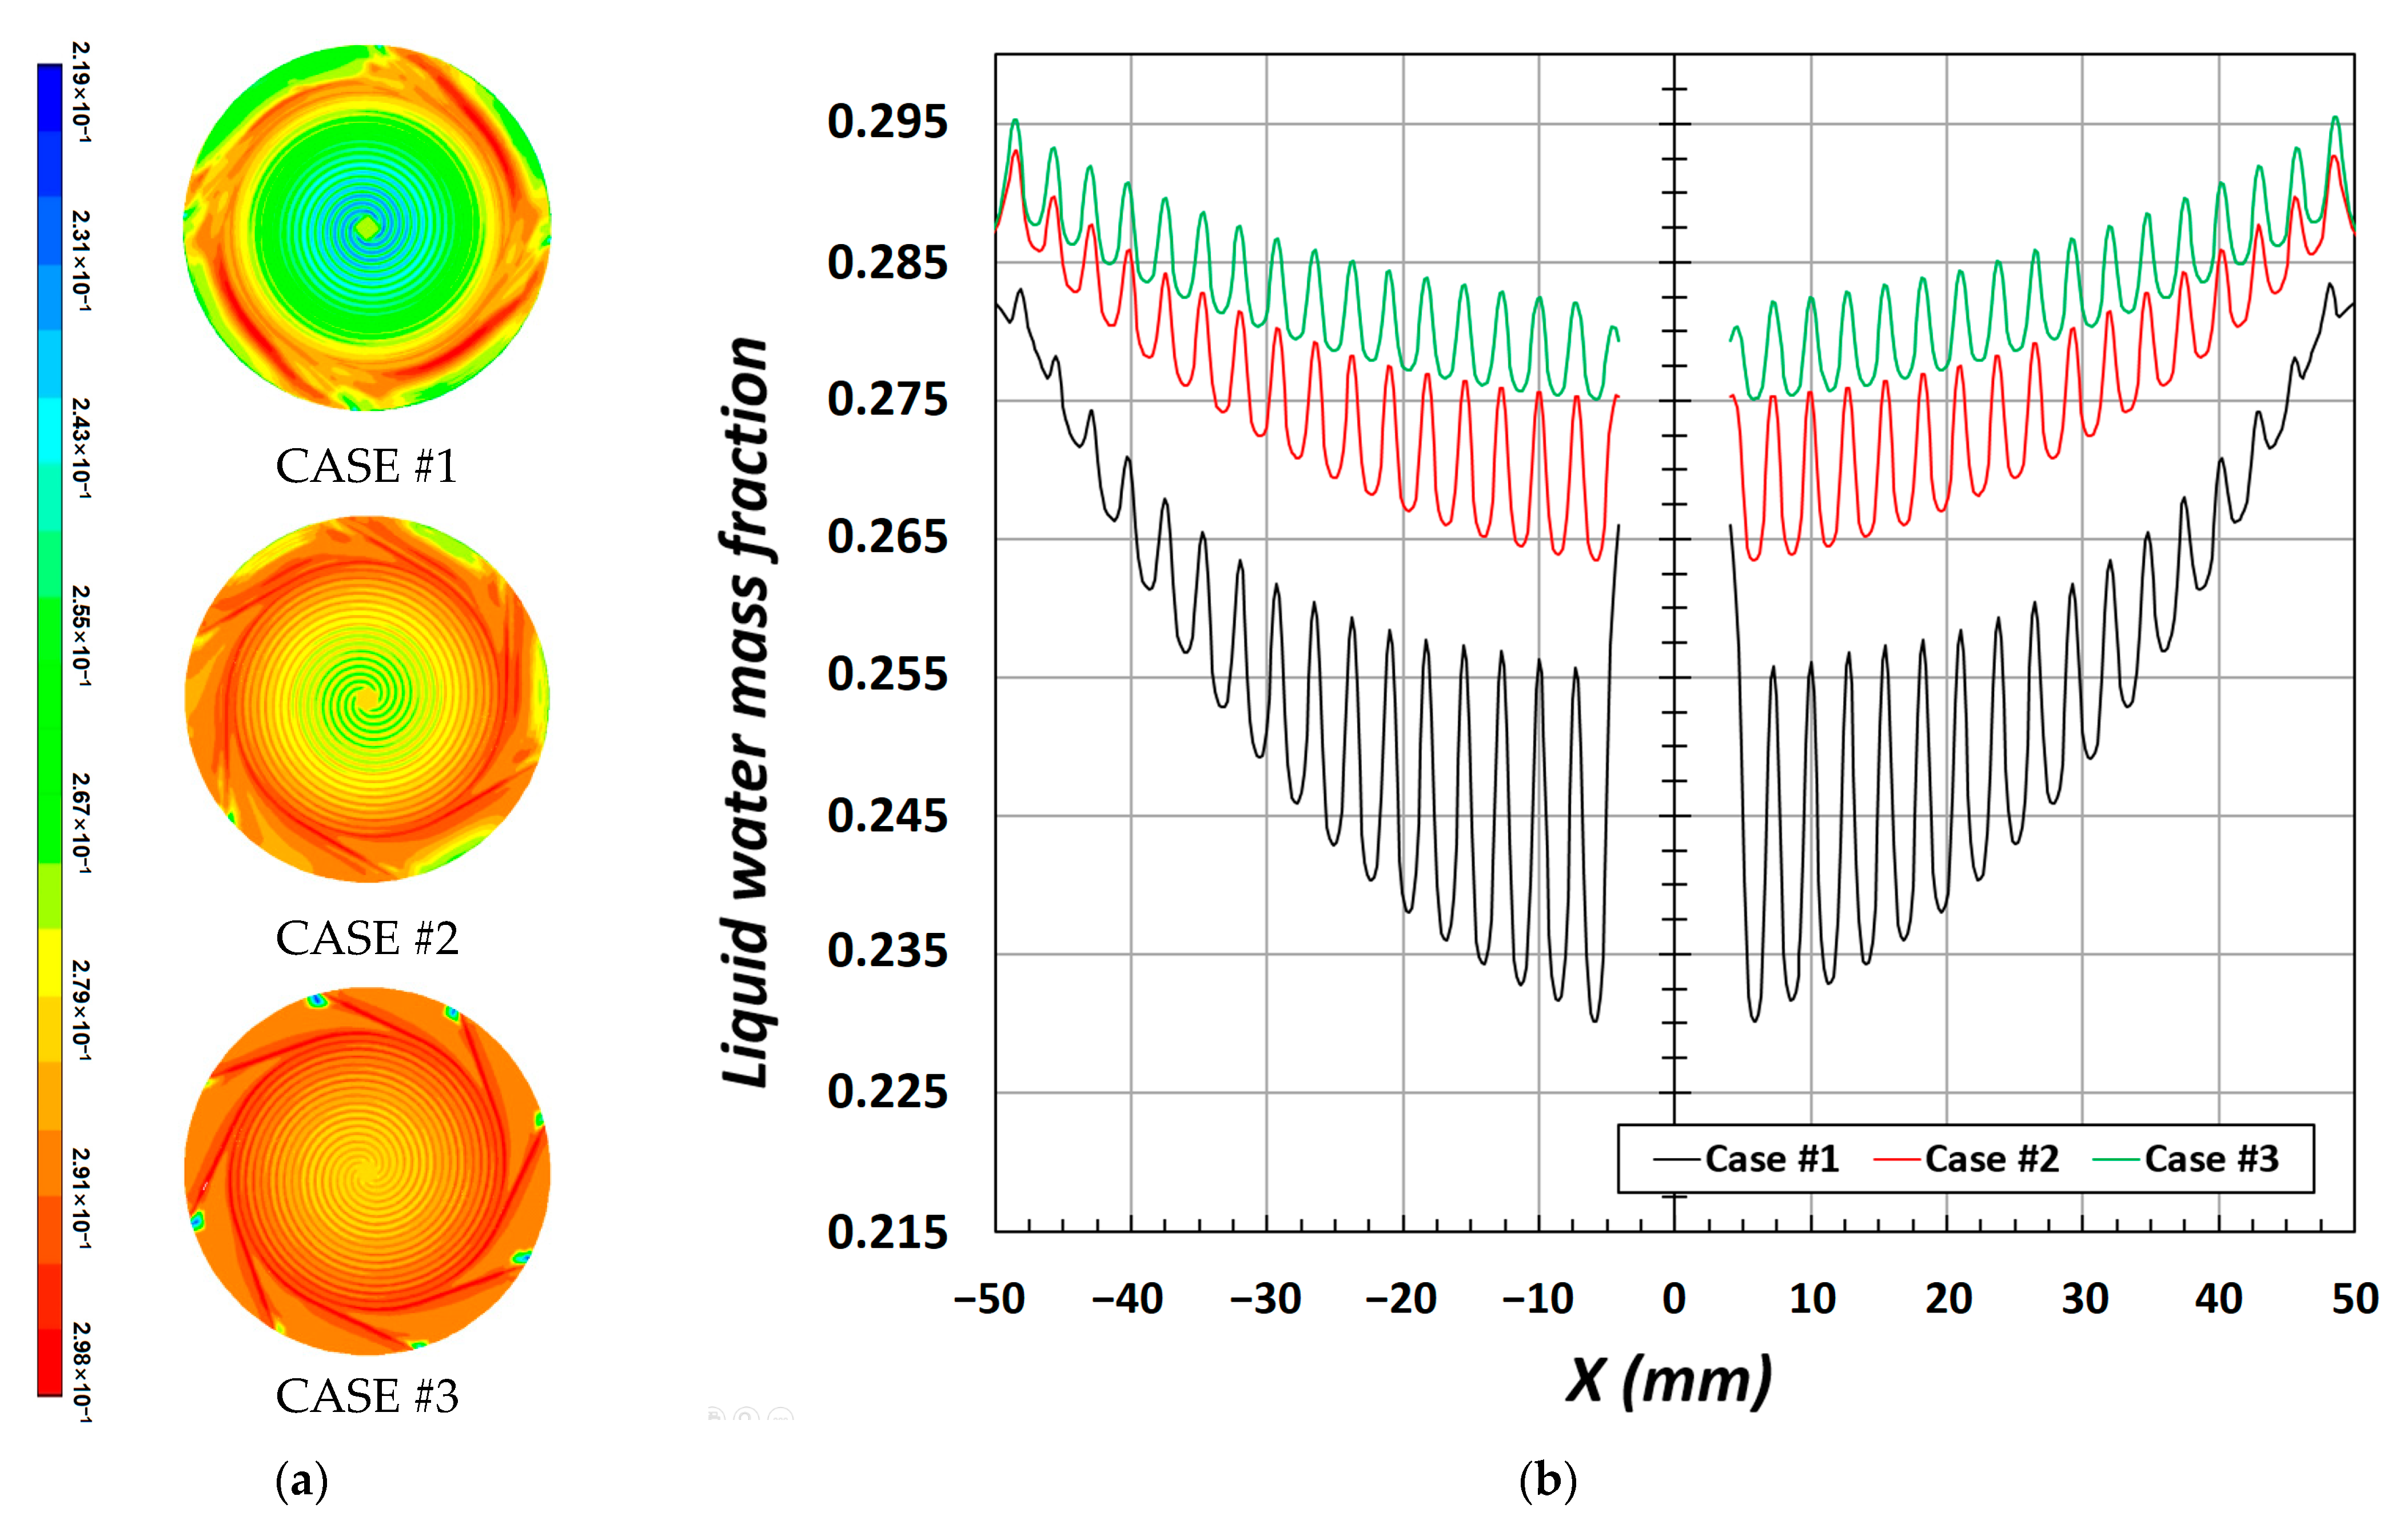
The current density of PEMFCs is affected by the characteristics of the product inside the cell, and when the number of passes in the channel is high, as shown in
Figure 6b, the mass fraction of water increases at the CL/GDL interface when the water is near the outlet. As previously mentioned, this is directly related to the internal pressure developed in the channel. According to the shape of each channel, a low fraction of water was observed at the central part, where the pressure was high, whereas the fraction increased near the outlet as the pressure decreased. Furthermore, the strength of under-rib convection changed depending on the internal pressure, which caused a difference in the water mass fraction; thus, the channel section had a higher value than that of the rib section.
The enhanced performance because of the mass transfer phenomenon in a PEM fuel cell is associated with an optimized water balance in the membrane. The hydration of the membrane affects its water transport through the supplied reactant gas and the operating parameters of the fuel cell. The important water transport mechanisms occurring in the membrane include electro-osmotic drag and back diffusion [
29], which cause a water concentration gradient between the anode and cathode. Generally, the product of the electrochemical reaction and electro-osmotic drag causes water accumulation, which leads to flooding on the cathode side.
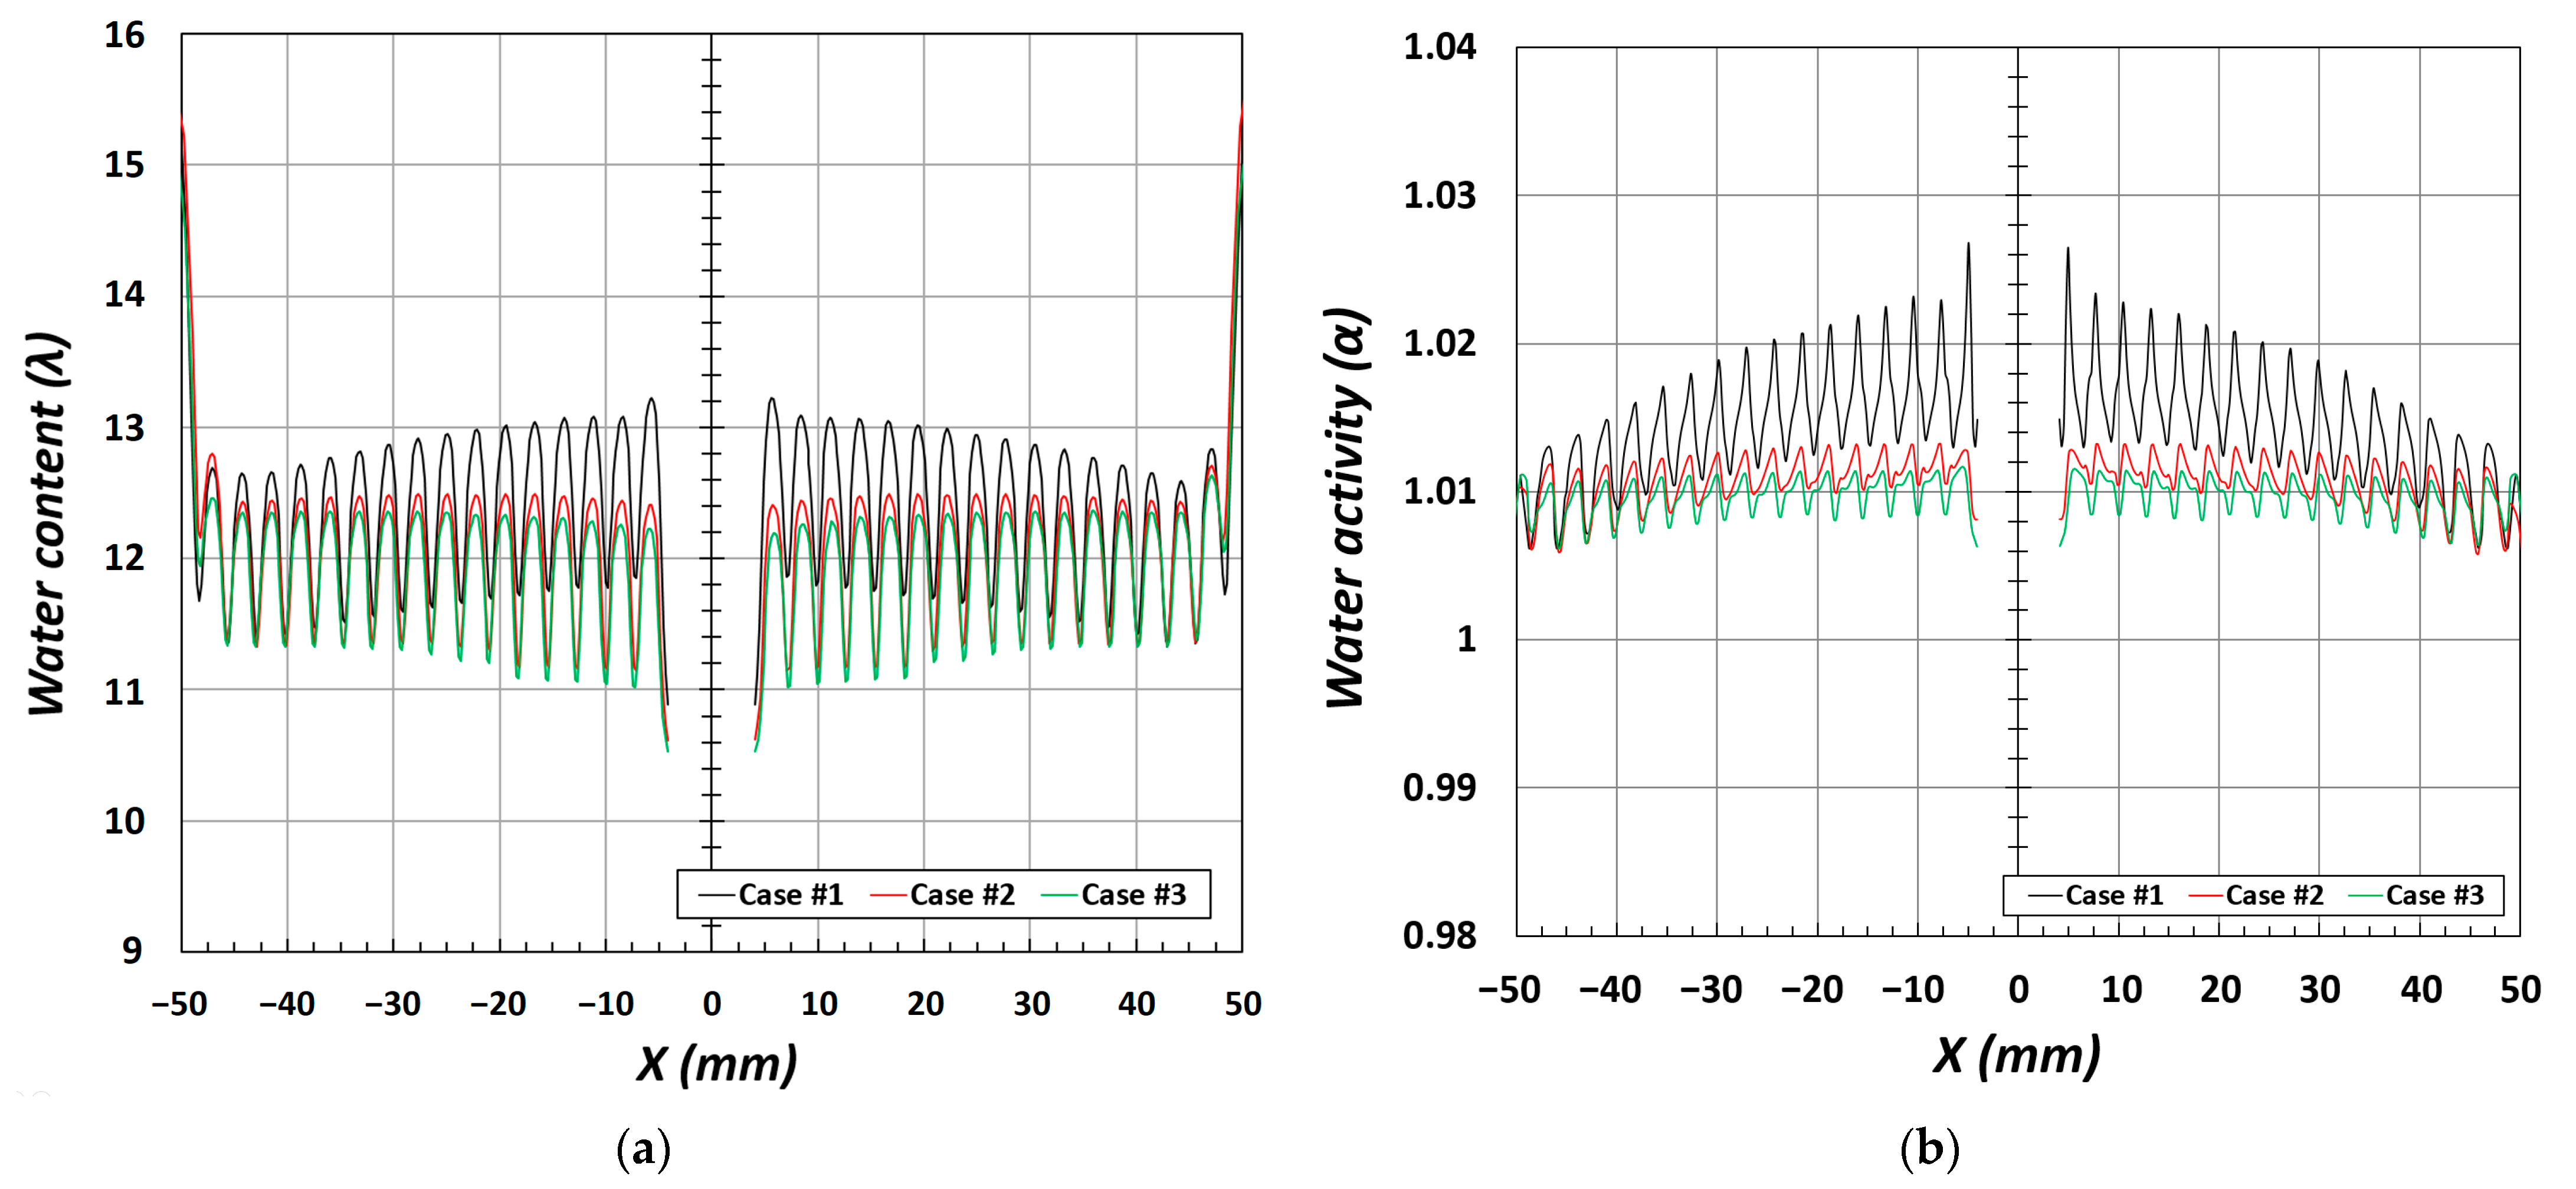
The water content (λ) and water activity (α) describe the behavior of water during mass transfer occurring within the PEM fuel cell. The water generated by the electrochemical reaction is hydrated, and water transport and ionic conductivity are determined by the amount of water generated. In particular, ionic conductivity increases with an increase in water activity, the membrane resistance is minimized at α of approximately 1, and the ionic conductivity reaches its maximum [
30].
The dynamic pressure change within the channel affects the temperature distribution of the electrolyte membrane via λ, α, and under-rib convection generated by the mass transport and electrochemical reactions.
The three-channel design used as the analysis model had a water content of λ = 12, as shown in
Figure 7a. However, in the case of the four-channel design, the water content and water activity of the membrane increased as the flow was irregular owing to the high pressure and complex shapes of the flow channels, leading to a local increase in the electrochemical reaction. In addition, CASE #2 and CASE #3 had similar values because of the flow distribution of the reactant gases and low internal pressure compared with CASE #1. The increase in water activity in
Figure 7b indicates that the local current density is enhanced, and, simultaneously, the temperature increases owing to the exothermic reaction as the ionic conductivity improves.
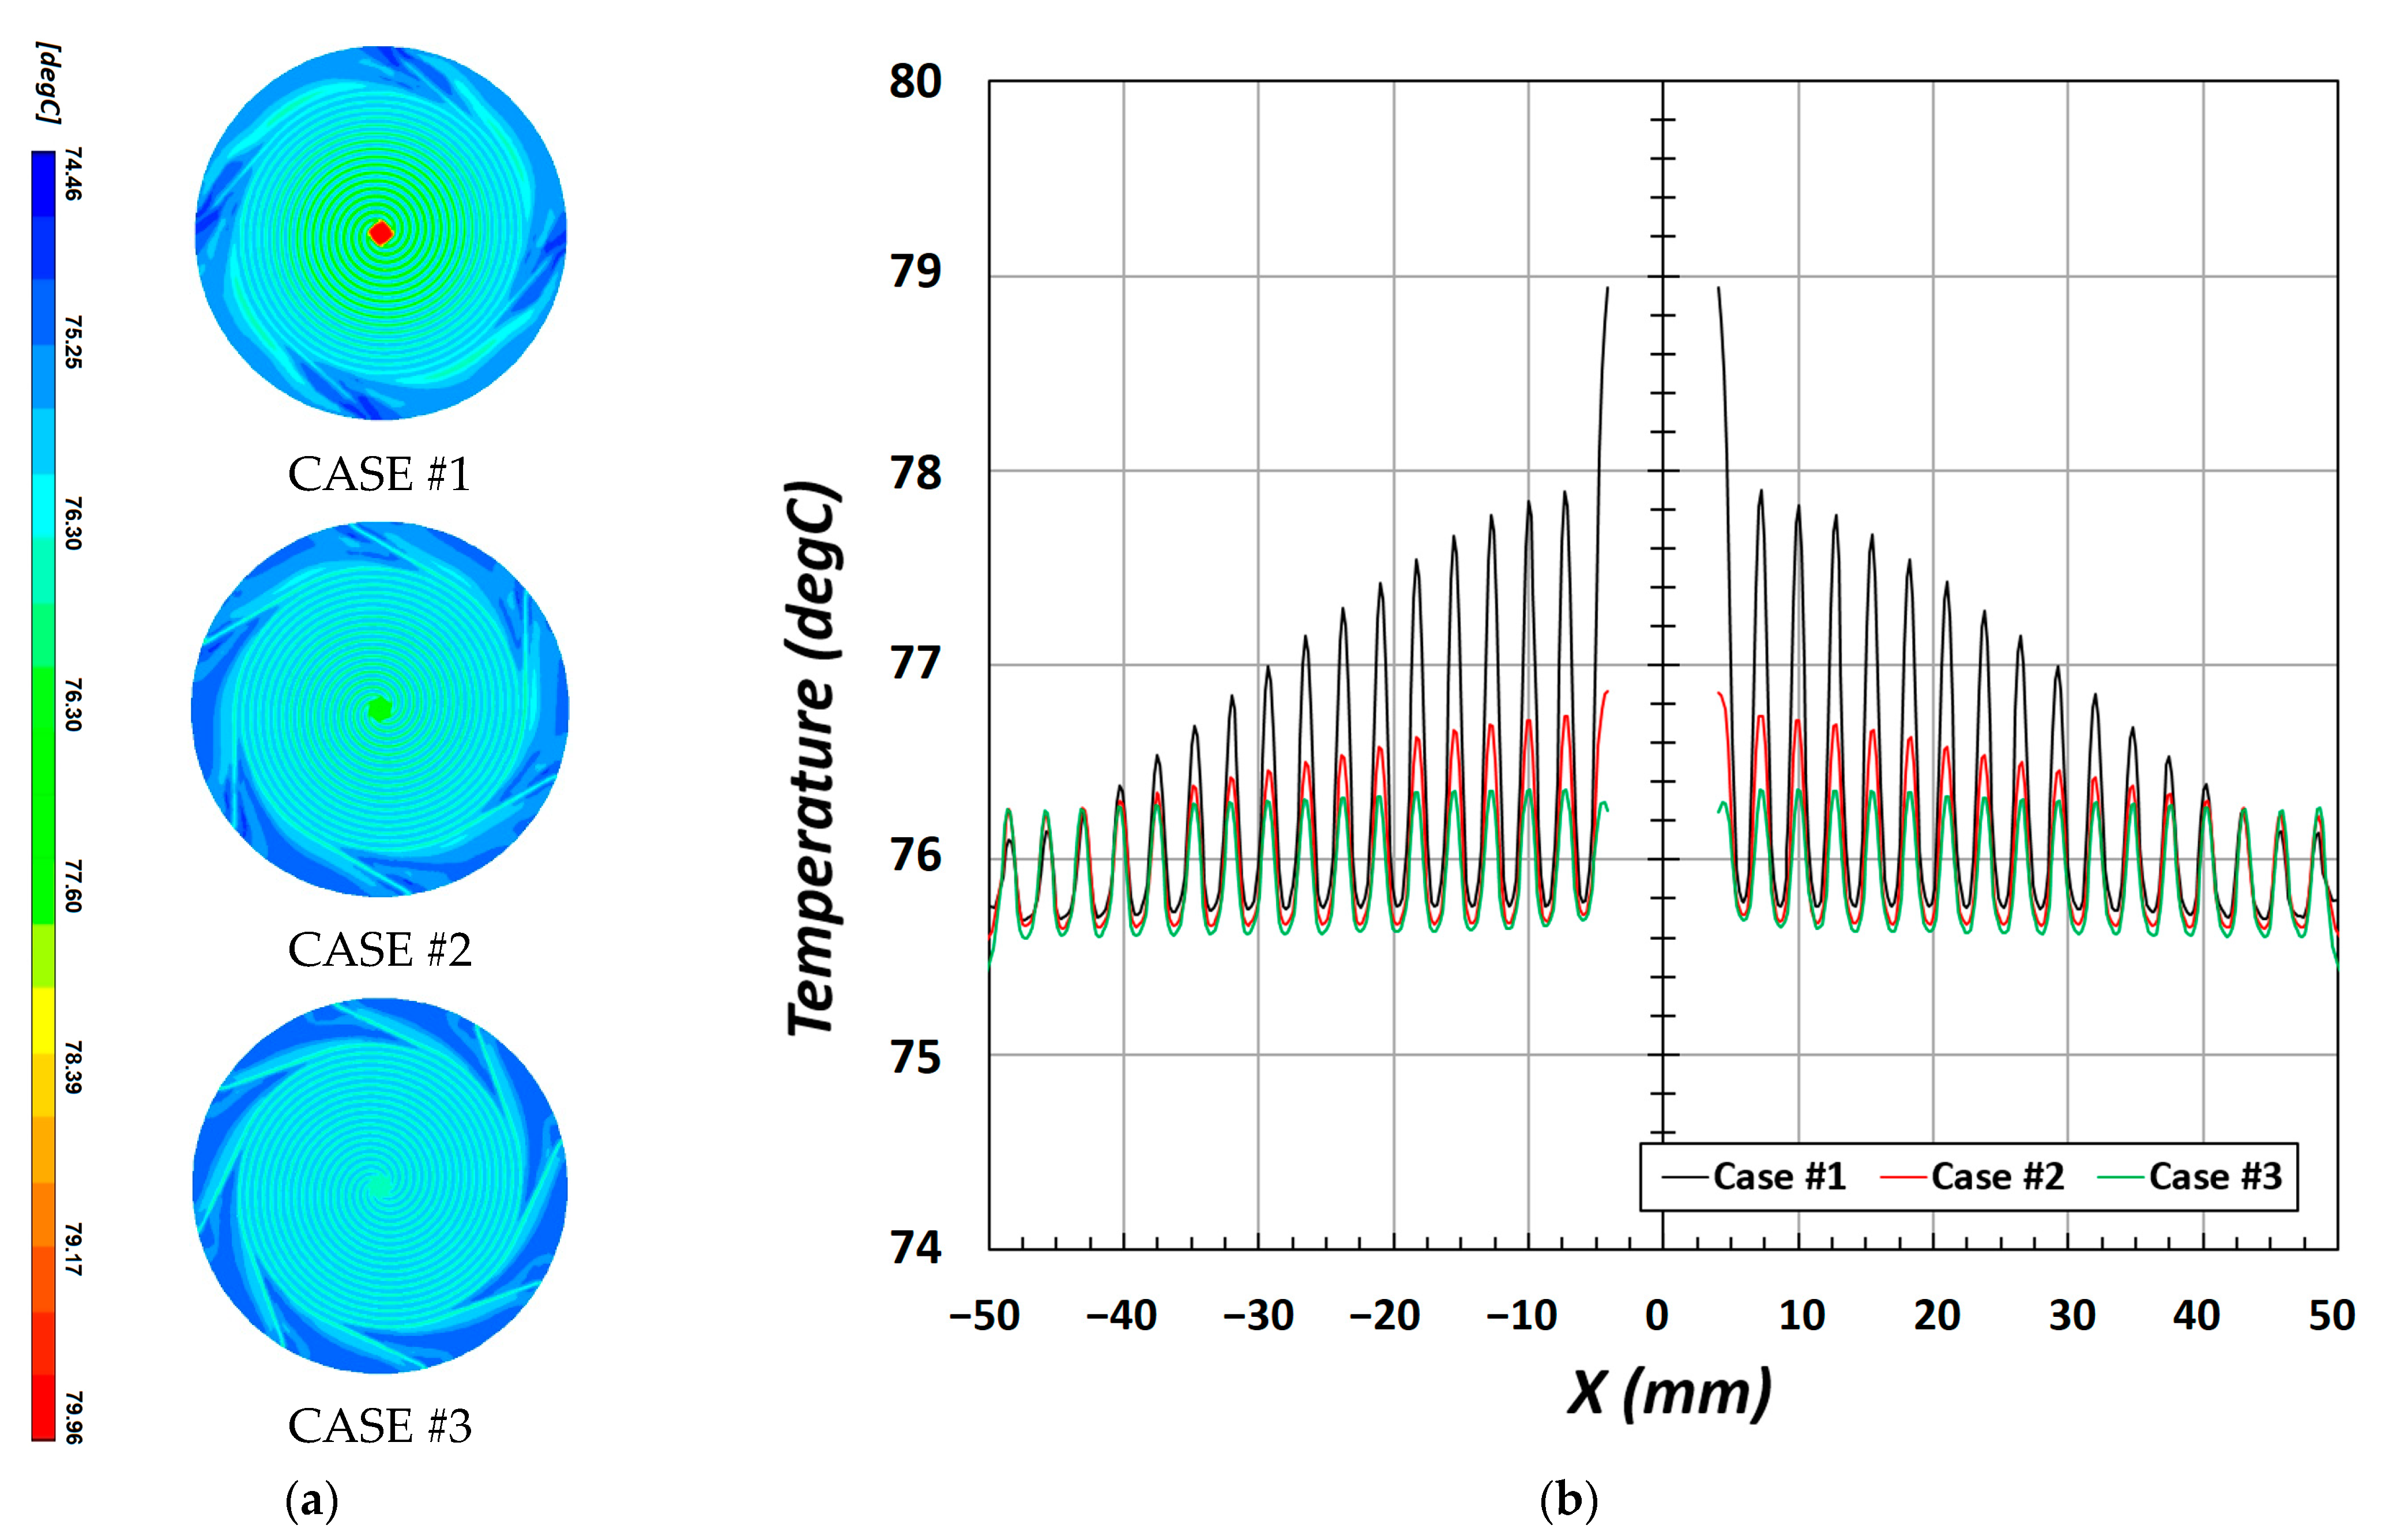
Figure 8 shows the temperature distribution at the CL/MEM interface. The temperature distribution within the PEMFCs is associated with the behavior of the product of the electrochemical reaction. A stable electrochemical reaction enhances the current density, and the produced water directly cools the heat generated by the exothermic reaction and indirectly maintains a uniform temperature via thermal transfer. The reactant gases supplied within the channel diffuse through the under-rib convection between the rib and GDL. As shown in
Figure 8b, the temperature is low at the rib and high at the channel.
Thus, controlling the water produced within the cell is important for fuel cells with a circular flow field, as rotation/movement occurs along the direction of the circumference.
The performance change caused by the accelerated water drainage was experimentally investigated using the flow fields with the highest water content in the membrane in CASE #1.
3.2. Experimental Results
The effect of the product in reducing the performance of the PEMFC was examined using the experimental device with flow fields for CASE #1, and the possibility of performance recovery by accelerating water drainage was assessed. Numerical analysis shows that the production and behavior of water are closely associated with the performance of fuel cells.
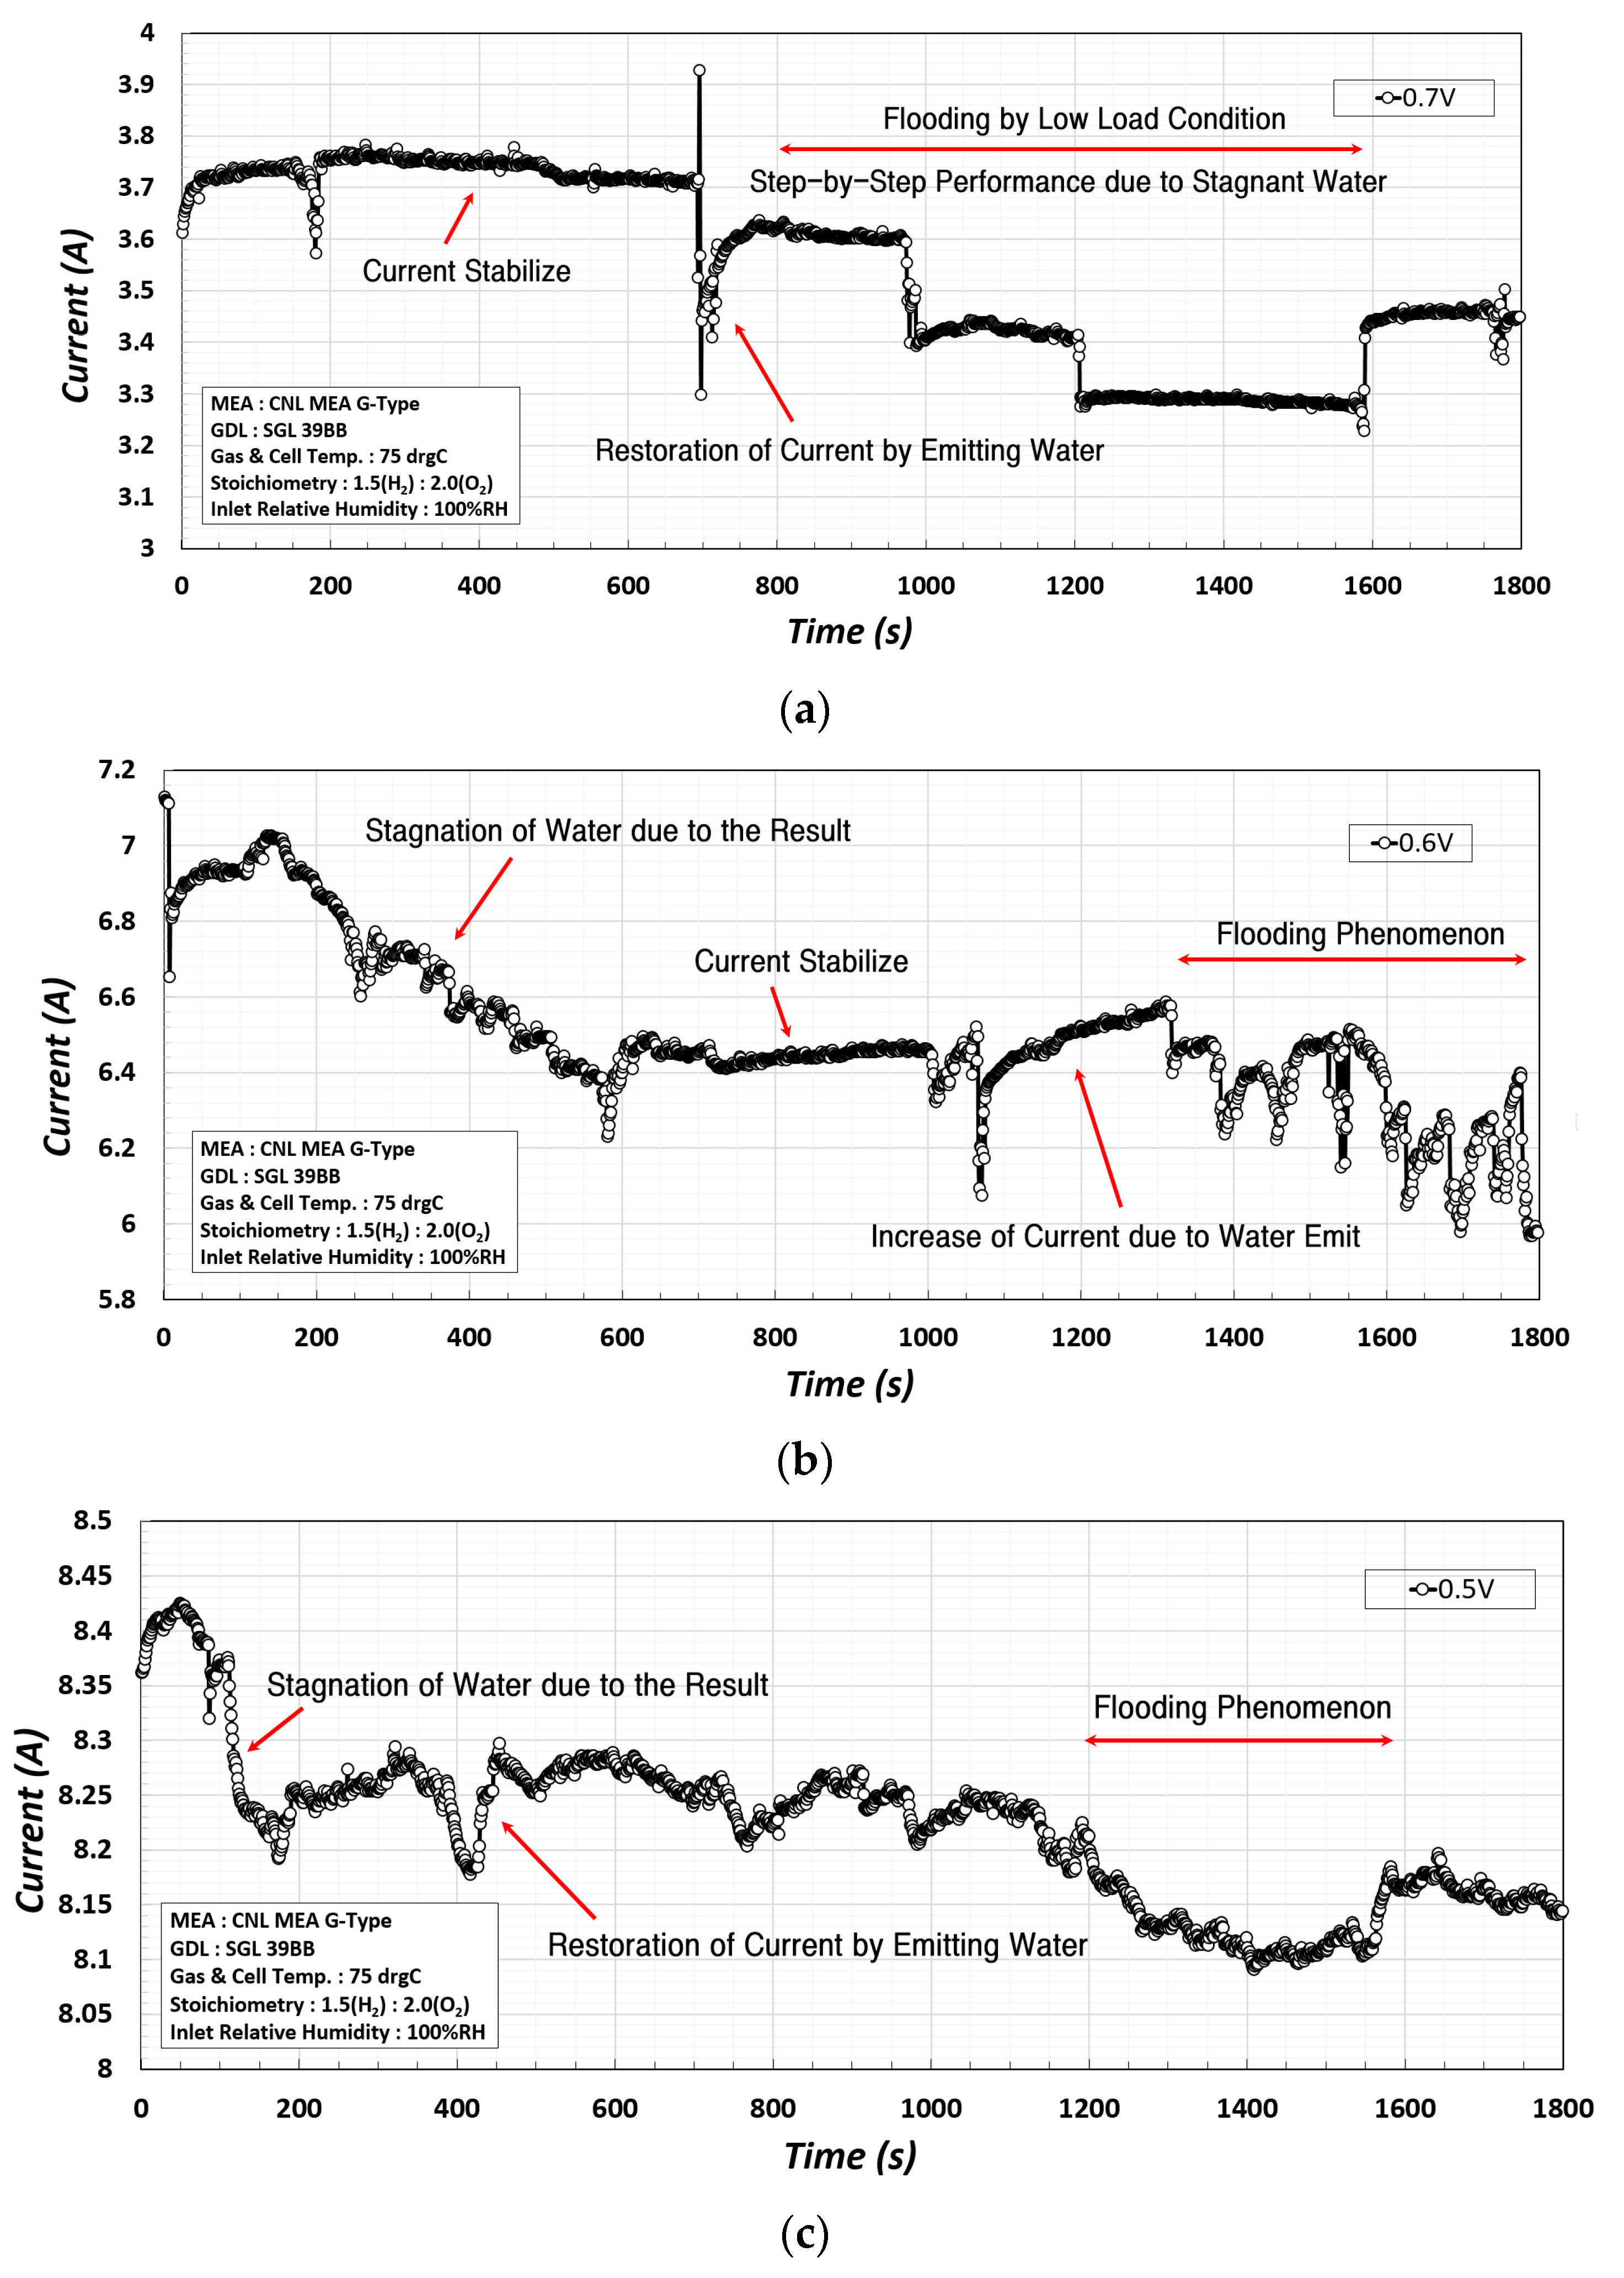
Figure 9 presents the results of measuring the current changes for 1800 s in load operation at 0.7 V, 0.6 V, and 0.5 V in the constant voltage mode to analyze the performance change due to flooding.
At 0.7 V, as shown in
Figure 9a, the water production and drainage were stabilized until 700 s owing to the low loading, but stepwise current changes occurred at 700–1600 s. This was reduced as flooding occurred because the product from the electrochemical reaction accumulated within the channel over a longer experimental time. In addition, at 0.6 V, as shown in
Figure 9b, the current decreased at a constant rate during 200–600 s, and a sudden drop and rise in the current were observed during 1000–1800 s due to flooding. However, at 0.5 V, as shown in
Figure 9c, as the load increased, the product inside substantially increased, which led to a sudden decrease in the current during 100–400 s, and afterwards. Subsequently, the overall current generation was reduced owing to the irregular changes in the current density and stagnation of the product. For flooding due to stagnation of the product, the results from the water drainage acceleration experiment using the rotational PEMFC shown in
Figure 3 are presented in
Figure 10.
The characteristic observation is that at 0.7 V and 0.6 V, a sudden current drop and recovery occurred repeatedly, while at 0.5 V, the sudden current change did not occur but the current decreased slowly due to the irregular changes in the current density.
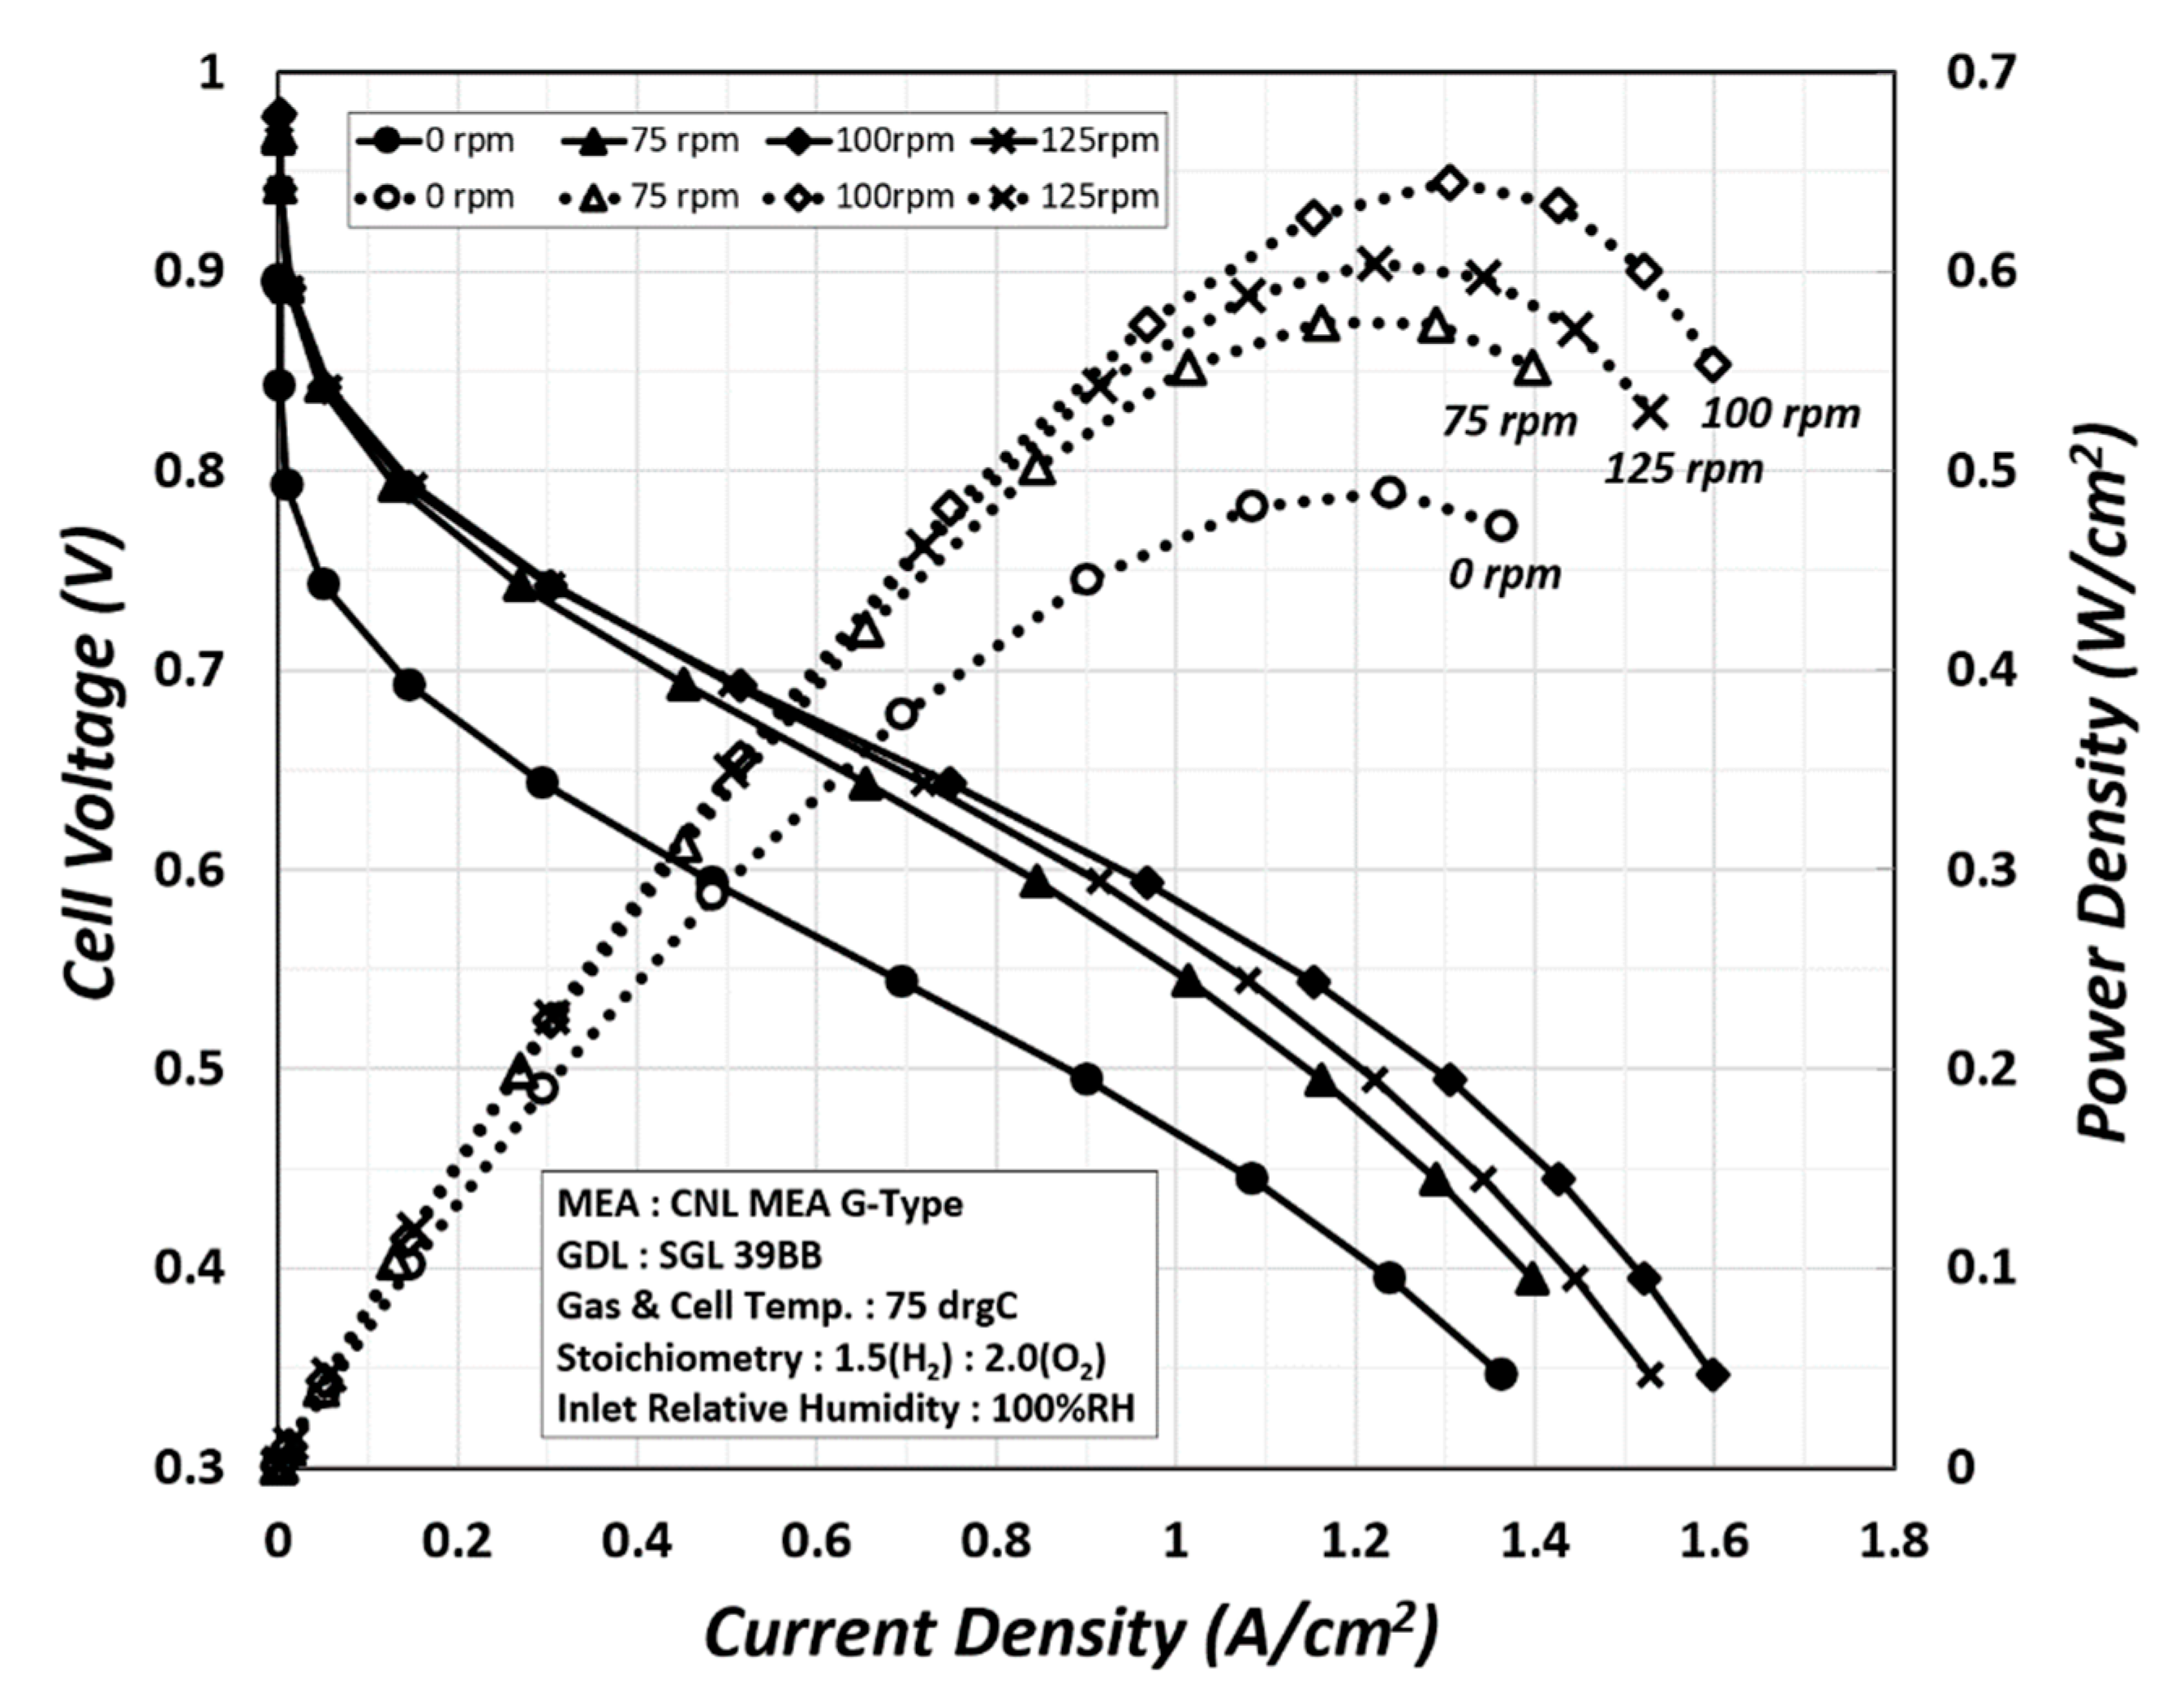
In this experiment, the PEMFC was rotated in the direction opposite to the rotating circular flow field at 0, 75, 100, and 125 rpm, which led to the drainage of water by centrifugal force. As the product inside was forced to drain due to the centrifugal force, the polarization and power curves changed, as shown in
Figure 10. In particular, from 0 rpm to 100 rpm, the performance improved owing to water drainage, but at 125 rpm, the performance was reduced as the entire water produced in the cell was completely drained by the strong centrifugal force.
The liquid water generated by the electrochemical reaction was distributed in the membrane and channel and had the highest mass in the fuel cell. The reactant gas that is humidified and supplied might also have a small mass but is insignificant when compared to liquid water. The generated water improves the performance as it is discharged from the fuel cell by rotation. The difference between the polarization and power curves based on the application of the centrifugal force is evident. This result shows that the dehydration of the hydrated membrane and the emission of the produced water stagnating in the flow channel affect the performance. The acceleration of water drainage in the fuel cells improved the performance of the PEMFC by 75% as confirmed by the changes in the power density.
4. Conclusions
In this study, numerical analyses and experiments were conducted to address various problems associated with water drainage caused by the irregular distribution of mass transport phenomena, which have thus far been reported by many researchers.
Three circular flow field patterns (CASE #1, CASE #2, and CASE #3) with 78.5 cm2 active area were designed by applying Archimedes’ spirals for the acceleration of water drainage and used to assess the performance of the fuel cells. The water behavior within the fuel cells affects the mass fraction, content, and activity of water owing to the change in internal pressure by the flow rates of the supplied reactant gases. This leads to a local increase in ionic conductivity, which in turn increases the current density. However, the water produced during the electrochemical reaction is transported from the rib to the channel by under-rib convection and cools the generated heat, thereby changing the temperature distribution.
In this study, the results of the numerical analysis of three previously proposed circular flow fields were compared in terms of water production and drainage. In a circular flow field, if the number of passes in the channel is high, the water mass fraction increases at the CL/GDL interface as the pressure decreases near the outlet. The increase in the mass fraction of the liquid water mass has a favorable impact on the humidification and cooling of the PEM.
Because the water produced during the electrochemical reaction increases the water content and enhances the ionic conductivity, it has a substantial impact, as a variable associated with water control, on the performance of the PEMFC.
In CASE #1, owing to the high pressure and complex channel shape, the flow is irregular, and, thus, the electrochemical reaction increases locally, considerably increasing the water content and water activity. In addition, CASE #2 and CASE #3 have similar values compared to those in CASE #1. An increase in water activity indicates that the local current density is enhanced as the ionic conductivity increases, and, simultaneously, the temperature increases with the heat of reaction. In particular, the temperature was low at the rib and high in the channel.
The performance change caused by the accelerated water drainage was experimentally examined using the flow fields with the highest water content of the membrane in CASE #1.
To assess the change in performance due to flooding, the current change during the load operation for 1800 s at 0.7 V, 0.6 V, and 0.5 V in the constant voltage mode were also experimentally investigated. At 0.7 V and 0.6 V, while the sudden current drop and recovery due to water stagnation/retention occurred repeatedly, these sudden changes were not observed at 0.5 V, but the current decreased slowly due to the irregular changes in the current density.
The changes in polarization and power curves according to the accelerated water drainage were determined by rotating the circular PEMFC in the direction opposite to that of the flow field at 0–125 rpm and forcing the water (product) formed inside the cell to be drained by centrifugal force. The performance improved from 0 to 100 rpm, but the water was completely drained by a strong centrifugal force at 125 rpm, decreasing the performance. Thus, this study verified that the acceleration of water drainage in the fuel cells improved the performance of the PEMFC by approximately 75% based on the changes in the power density, and flooding had a significant impact on the performance.
Author Contributions
Conceptualization, K.-S.C. and K.-S.K.; investigation, K.-S.K. and M.H.; visualization, K.-S.K. and J.-S.K.; data curation, J.-S.K. and D.-Y.K.; experiment, K.-S.K., J.-S.K. and M.H.; statistical analyses, K.-S.C. and J.-S.K.; project administration, K.-S.C.; supervision, K.-S.C.; writing—original draft preparation, J.-S.K., D.-Y.K. and K.-S.K.; writing—review and editing, K.-S.C.; funding acquisition, K.-S.C. All authors have read and agreed to the published version of the manuscript.
Funding
This research was supported by the National Research Foundation of Korea (NRF) grant funded by the Korean government (MSIT) (No. 2017R1C1B5017904) and BB21plus funded by Busan Metropolitan City and Busan Institute for Talent & Lifelong Education (BIT).
Institutional Review Board Statement
Not applicable.
Informed Consent Statement
Not applicable.
Data Availability Statement
Not applicable.
Conflicts of Interest
The authors declare no conflict of interest.
References
- Limjeerajarus, N.; Charoen-Amornkitt, P. Effect of different flow field designs and number of channels on performance of a small PEFC. Int. J. Hydrogen Energy 2015, 40, 7144–7158. [Google Scholar] [CrossRef]
- Ous, T.; Arcoumanis, C. Degradation aspects of water formation and transport in Proton Exchange Membrane Fuel Cell: A review. J. Power Sources 2013, 240, 558–582. [Google Scholar] [CrossRef]
- Yousfi-Steiner, N.; Moçotéguy, P.; Candusso, D.; Hissel, D.; Hernandez, A.; Aslanides, A. A review on PEM voltage degradation associated with water management: Impacts, influent factors and characterization. J. Power Sources 2008, 183, 260–274. [Google Scholar] [CrossRef]
- Choi, K.S.; Kim, H.M.; Moon, S.M. Numerical studies on the geometrical characterization of serpentine flow-field for efficient PEMFC. Int. J. Hydrogen Energy 2011, 36, 1613–1627. [Google Scholar] [CrossRef]
- Ijaodola, O.S.; El-Hassan, Z.; Ogungbemi, E.; Khatib, F.N.; Wilberforce, T.; Thompson, J.; Olabi, A.G. Energy efficiency improvements by investigating the water flooding management on proton exchange membrane fuel cell (PEMFC). Energy 2019, 179, 246–267. [Google Scholar] [CrossRef]
- Jeon, D.H.; Greenway, S.; Shimpalee, S.; Van Zee, J.W. The effect of serpentine flow-field designs on PEM fuel cell performance. Int. J. Hydrogen Energy 2008, 33, 1052–1066. [Google Scholar] [CrossRef]
- Jang, J.H.; Yan, W.M.; Li, H.Y.; Tsai, W.C. Three-dimensional numerical study on cell performance and transport phenomena of PEM fuel cells with conventional flow fields. Int. J. Hydrogen Energy 2008, 33, 156–164. [Google Scholar] [CrossRef]
- Wang, X.D.; Zhang, X.X.; Yan, W.M.; Lee, D.J.; Su, A. Determination of the optimal active area for proton exchange membrane fuel cells with parallel, interdigitated or serpentine designs. Int. J. Hydrogen Energy 2009, 34, 3823–3832. [Google Scholar] [CrossRef]
- Duy, V.N.; Lee, J.K.; Kim, K.C.; Ahn, J.W.; Park, S.H.; Kim, T.U.; Kim, H.M. Dynamic simulations of under-rib convection-driven flow field configurations and comparison with experiment in polymer electrolyte membrane fuel cells. J. Power Sources 2015, 293, 447–457. [Google Scholar] [CrossRef]
- Chen, D.; Zou, Y.; Shi, W.; Serbin, S.; You, H. Proton exchange membrane fuel cells using new cathode field designs of multi-inlet shunt intake design. Int. J. Energy Res. 2021, 45, 9948–9960. [Google Scholar] [CrossRef]
- Wilberforce, T.; El-Hassan, Z.; Ogungbemi, E.; Ijaodola, O.; Khatib, F.N.; Durrant, A.; Thompsona, J.; Baroutajib, A.; Olabi, A.G. A comprehensive study of the effect of bipolar plate (BP) geometry design on the performance of proton exchange membrane (PEM) fuel cells. Renew. Sustain. Energy Rev. 2019, 111, 236–260. [Google Scholar] [CrossRef]
- Iranzo, A.; Arredondo, C.H.; Kannan, A.M.; Rosa, F. Biomimetic flow fields for proton exchange membrane fuel cells: A review of design trends. Energy 2020, 190, 116435. [Google Scholar] [CrossRef]
- Xiong, K.; Wu, W.; Wang, S.; Zhang, L. Modeling, design, materials and fabrication of bipolar plates for proton exchange membrane fuel cell: A review. Appl. Energy 2021, 301, 117443. [Google Scholar] [CrossRef]
- Solati, A.; Nasiri, B.; Mohammadi-Ahmar, A.; Mohammadi, K.; Safari, A.H. Numerical investigation of the effect of different layers configurations on the performance of radial PEM fuel cells. Renew. Energy 2019, 143, 1877–1889. [Google Scholar] [CrossRef]
- Yutao, L.; Minggang, Z. Performance investigation on the radial flow channel of proton exchange membrane fuel cell. Int. J. Ambient Energy 2021, 1–8. [Google Scholar] [CrossRef]
- Choi, K.S.; Kim, B.G.; Park, K.; Kim, H.M. Flow control of under-rib convection enhancing the performance of proton exchange membrane fuel cell. Comput. Fluids 2012, 69, 81–92. [Google Scholar] [CrossRef]
- ANSYS Inc. ANSYS Fluent® 14.5, Fuel Cells Module Manual; ANSYS Inc.: Canonsburg, PA, USA, 2012. [Google Scholar]
- Juarez-Robles, D.; Hernandez-Guerrero, A.; Ramos-Alvarado, B.; Elizalde-Blancas, F.; Damian-Ascencio, C.E. Multiple concentric spirals for the flow field of a proton exchange membrane fuel cell. J. Power Sources 2011, 196, 8019–8030. [Google Scholar] [CrossRef]
- Shimpalee, S.; Van Zee, J.W. Numerical study on rib and channel dimension of flow-field on PEMFC performance. Int. J. Hydrogen Energy 2007, 32, 842–856. [Google Scholar] [CrossRef]
- Shimpalee, S.; Dutta, S. Numerical prediction of temperature distribution in PEM fuel cells. Numer. Heat Transf. A 2000, 38, 111–128. [Google Scholar]
- Ibrahimoglu, B.; Yilmazoglu, M.Z.; Celenk, S. Investigation of spiral flow-field design on the performance of a PEM fuel cell. Fuel Cells 2012, 17, 908–938. [Google Scholar] [CrossRef]
- Arvay, A.; Ahmed, A.; Peng, X.H.; Kannan, A.M. Convergence criteria establishment for 3D simulation of proton exchange membrane fuel cell. Int. J. Hydrogen Energy 2012, 37, 2482–2489. [Google Scholar] [CrossRef]
- Khandelwal, M.; Mench, M.M. Direct measurement of through-plane thermal conductivity and contact resistance in fuel cell materials. J. Power Sources 2006, 161, 1106–1115. [Google Scholar] [CrossRef]
- Barbir, F. PEM Fuel Cells: Theory and Practice, 2nd ed.; Academic Press: Cambridge, MA, USA, 2012. [Google Scholar]
- Shimpalee, S.; Greenway, S.; Van Zee, J.W. The impact of channel path length on PEMFC flow-field design. J. Power Sources 2006, 160, 398–406. [Google Scholar] [CrossRef]
- Iranzo, A.; Munoz, M.; Rosa, F.; Pino, J. Numerical model for the performance prediction of a PEM fuel cell. Model results and experimental validation. Int. J. Hydrogen Energy 2010, 35, 11533–11550. [Google Scholar] [CrossRef]
- Malkow, T.; De Marco, G.; Pilenga, A.; Bove, R.; Honselaar, M.; Tsotridis, G.; Thalau, O.; Antoni, L.; Rosini, S.; Schätzle, M.; et al. PEFC Power Stack Performance Testing Procedure: Measuring Voltage and Power as Function of Current Density, Polarisation Curve Test Method; European Commission: Petten, The Netherlands, 2010. [Google Scholar]
- Choi, K.S.; Kim, B.G.; Park, K.; Kim, H.M. Current advances in polymer electrolyte fuel cells based on the promotional role of under-rib convection. Fuel Cells 2012, 12, 908–938. [Google Scholar] [CrossRef]
- Saleh, M.M.; Okajima, T.; Hayase, M.; Kitamura, F.; Ohsaka, T. Exploring the effects of symmetrical and asymmetrical relative humidity on the performance of H2/air PEM fuel cell at different temperatures. J. Power Sources 2007, 164, 503–509. [Google Scholar] [CrossRef]
- Bhattacharya, P.K. Water flooding in the proton exchange membrane fuel cell. Directions 2015, 15, 24–33. [Google Scholar]
| Publisher’s Note: MDPI stays neutral with regard to jurisdictional claims in published maps and institutional affiliations. |
© 2022 by the authors. Licensee MDPI, Basel, Switzerland. This article is an open access article distributed under the terms and conditions of the Creative Commons Attribution (CC BY) license (https://creativecommons.org/licenses/by/4.0/).


