You are currently viewing a new version of our website. To view the old version click .
Energies
  • Article
  • Open Access

28 January 2022

BESS Primary Frequency Control Strategies for the West Africa Power Pool

,
,
and
1
Energy Institute, System Engineering Department, Colorado State University, Fort Collins, CO 80523, USA
2
Department of Energy, Politecnico di Milano, 015146 Milan, Italy
*
Authors to whom correspondence should be addressed.

Abstract

In recent years, power systems have been moving from conventional power plants toward the integration of renewable energy sources (RES). This trend is taking shape in many developing economies, including in the West Africa Power Pool (WAPP). The integration of RES, however, stresses grid security and stability due to the variability and intermittency of the underlying renewable sources. Battery Energy Storage Systems (BESS) have been identified as a possible solution to address the frequency control challenges in the WAPP Interconnected Transmission System (WAPPITS) in order to help to accommodate high levels of RES. This paper analyzes the application and effectiveness of BESS in providing primary frequency control reserves in the WAPPITS. The analyses are based on numerical simulations that were performed using an open-loop model based on historic frequency measurements from the WAPPITS. The simplified model provided a first-order analysis of the frequency control and state of charge (SOC) restoration logic for BESS installations. This study indicates that a droop-based control strategy that is able to react only to the symmetrical and fast frequency oscillations in the network could be appropriate for regulating BESS in the system. Moreover, it demonstrates that the deployment of BESS alone does not solve frequency control problems and a deep revision of the frequency control service is required, mainly involving traditional power plants.

1. Introduction

The integration of renewable energy sources (RES) into the West Africa Power Pool (WAPP) Interconnected Transmission System (WAPPITS) has increased significantly; between 2016 and 2021, about 439 MW of solar PV was installed, representing 1.9% of the total installed generation capacity. The total energy generated from solar PV now represents 0.7% of the energy that is generated in the subregion. The installed capacity of solar PV and wind power is expected to grow to about 40% of the total generation capacity between 2030–2033 in order to fulfill the regional goal of increasing electricity access for the citizens of the Economic Community of West Africa States (ECOWAS) [1]. The WAPPITS’ list of regional priority generation projects has RES projects (including hydro) representing 68.9% (10.67 GW) of all expansion projects, of which 29.5% (3.15 GW) involve solar and wind power [1].
The increasing penetration levels of RES will likely create operational challenges for the dynamic behavior of the WAPPITS [1,2]. Notable among the operational challenges is the impact of RES on frequency stability. Since wind and solar RES resources are generally inverter-based, these generators reduce system inertia relative to generation capacity, making the system frequency very susceptible to any loss of generation, transmission line or load [3,4,5,6,7]. The variability and uncertainty of the output of RES generation also results in an increase in the variability and uncertainty of net load in the short term [8]. This requires a greater amount of flexibility and an increase in the need for primary frequency control reserves, which are typically provided by conventional or hydropower generation plants.
The WAPPITS has faced frequency stability challenges due to the lack of the active and reliable participation of conventional power plants in primary frequency control. Currently, the WAPPITS operates as three independent, synchronous blocks and primary frequency control has been identified as one of the main reasons that the WAPPITS cannot synchronize these blocks so as to operate as an interconnected transmission system [9,10,11,12].
Whilst efforts are being made to address these challenges, it has also been recommended that the WAPPITS deploy Battery Energy Storage Systems (BESS) for frequency regulation, especially with the ongoing effort to increase RES penetration [13]. This is based on the ability of BESS to provide grid services, such as primary frequency control due to the fast dynamic response of these systems, offer generation–demand balance alternatives to grid operators, provide other ancillary services able to stabilize the grid and provide high power capability relative to stored energy capacity [14,15,16]. Several studies have also indicated that BESS installations are a credible alternative for frequency regulation in maintaining grid stability with a high penetration of RES generation [17,18,19,20,21,22,23,24,25,26].
One of the most important studies devoted to analyzing the integration of BESS in the WAPP is the assessment of battery storage applications in the WAPP utilities and countries, which was performed by the World Bank in [13]; however, the study has some limitations. Only the technical performance of the WAPP Power System, with and without BESS, was analyzed. The study primarily assumed the existence of reasonably adequate frequency control reserves and assessed the capability of BESS to stabilize the system in a dynamic/transient domain given by its fast response capabilities. The analysis fell short of evaluating the impact of the possible existing frequency control challenges (based on actual frequency data) on the inherent performance of BESS, its effective application for frequency regulation in the WAPPITS and the possible control strategies to be deployed to ensure BESS services are provided without interruption.
An analysis of the impact of existing frequency behavior on BESS effectiveness (inherently and on the grid) is important, since when comparing BESS and conventional power plants, it must be noted that the operational range and duration of BESS installations are limited by their energy storage (EU Network Codes define BESS as Limited Energy Reservoirs) [27]. In addition, round-trip storage losses when the state of charge (SOC) fluctuates create a fundamental power offset when BESS is used in primary frequency regulation. Hence BESS systems require constant input power that is proportional to the round-trip efficiency multiplied by the power produced/consumed in order to prevent service interruption due to BESS SOC saturation [14].
Research and studies on the application of frequency control and SOC restoration logic to effectively utilize BESS installations for primary frequency control have been conducted using empirical battery models, which were developed using either MATLAB/Simulink or DigSilent and actual frequency measurements from the grid as the input [14,28,29,30,31,32].
These studies primarily used numerical simulations that were based on actual frequency measurements from the transmission system operator (TSO) to size and locate BESS for primary frequency control, both in an interconnected and an isolated system [19,33]. The performance and effectiveness of BESS have also been investigated with respect to a range of frequency control and SOC restoration strategies; these analyses have primarily focused on the ability of BESS installations to assure effective frequency control and guarantee service continuity [15,16,19,29,34,35,36,37,38,39,40,41,42,43,44,45,46,47,48,49]. However, the listed studies used frequency measurements from mostly European and Asian countries as the reference data. None of them concentrated on proposing an effective strategy for BESS operation in the WAPPITS, whose critical and unique grid condition could lead to different considerations.
For the purposes of this study, the primary topic of consideration is the application of control strategies for both frequency regulation and SOC restoration. The frequency regulation strategy determines the limits at which the BESS attempts to restore system frequency. The SOC regulation strategy is necessary to avoid BESS saturation at maximum or minimum SOC. Researchers have conducted similar analyses using control strategies such as the frequency and deadband dependent strategy, hybrid SOC and frequency dependent charging strategy, dynamic strategies and the model predictive control (MPC) strategy.
(i)
Frequency and deadband dependent strategy: The charging and discharging of BESS is dependent on the grid frequency and whether it is within a specified frequency deadband around the nominal (desired) frequency [31,42]. For example, BESS is discharged when   f < f m i n = f n o m δ f   and charged when f > f m a x = f n o m + δ f . f is the measured frequency value, f n o m is the nominal frequency, f m i n is the specified minimum frequency value, f m a x the specified maximum frequency value and the deadband is δ f .
(ii)
Hybrid SOC and frequency dependent charging strategy: This control strategy utilizes a frequency control similar to (i) but with BESS charge/discharge limits that depend on the SOC. For example, a simple strategy requires that the battery charges when the SOC is less than a specified SOC and discharges when the SOC reaches a certain maximum SOC, typically with a deadband on SOC limits so as to avoid oscillation [14,29,32,42].
(iii)
Dynamic strategies: In these strategies, the BESS compensates for fast frequency deviations—i.e., discharging or charging in response to high deviations in frequency—while also applying a time-dependent offset to the frequency control signal in order to drive the BESS SOC to within specified thresholds. A similar model uses a frequency setpoint that is based on a moving average of a pre-defined time window to determine the charging and discharging setpoints [15,16,29,32]. All variations of this method build the SOC restoration strategy into the frequency regulation settings.
(iv)
Model predictive control (MPC) strategy: In this strategy, the power system is characterized by uncertainties related to load forecasting, RES forecasting and system dynamics and, therefore, it requires input data that are capable of predicting such uncertainties. The MPC predicts control uncertainties (future events and operational changes) and makes appropriate decisions to minimize their impact on grid stability. MPC strategies are based on internal models and use optimization methods to fit the control variables to historical data over a specified time horizon. MPC has been used to predict near-optimal locations for where BESS should be sited in order to compensate for major disturbances [29,45]. This approach also helps to make timely and optimal decisions on grid operations, such as storing energy before peak times, altering the settings of a slow acting power plant or bringing additional power plants online in advance of dispatch [45].
Dynamic strategies are of particular interest compared to the classical frequency and deadband dependent strategies for the WAPPITS area, which is characterized by large fluctuations that are hardly manageable by BESS alone. The present work investigated alternative dynamic and restoration strategies that are able to optimize BESS behavior for balancing fast frequency fluctuations and compared them not according to economic criteria, as proposed in the majority of works, but in terms of technical feasibility and based on technical performance indicators.
More specifically, the objective of this paper is to contribute to the literature by (i) analyzing and highlighting the application and effectiveness of BESS in providing primary frequency control in the WAPPITS, (ii) analyzing the impact and effectiveness of previously studied BESS frequency control logic when applied to a weak grid system, (iii) analyzing SOC restoration logic that can ensure service continuity and effective frequency regulation and (iv) determining the optimal size of BESS installations in order to accomplish the goal in (i) by means of a combination of MILP optimization and a dynamic grid model. The analysis used the WAPPITS as a case study, represented as a simplified open-loop BESS/grid model that was developed in MATLAB/Simulink and driven by frequency measurements from the WAPPITS.
This paper is organized as follows Section 2 presents an analysis of frequency trends in the WAPPITS; Section 3 introduces the proposed methodology; Section 4, Section 5 and Section 6 describe the development of a Simulink BESS simulation model, frequency and state of charge restoration controls; approach to estimate power imbalance of the grid, the MILP model and Section 7 presents the simulation results and discussion.

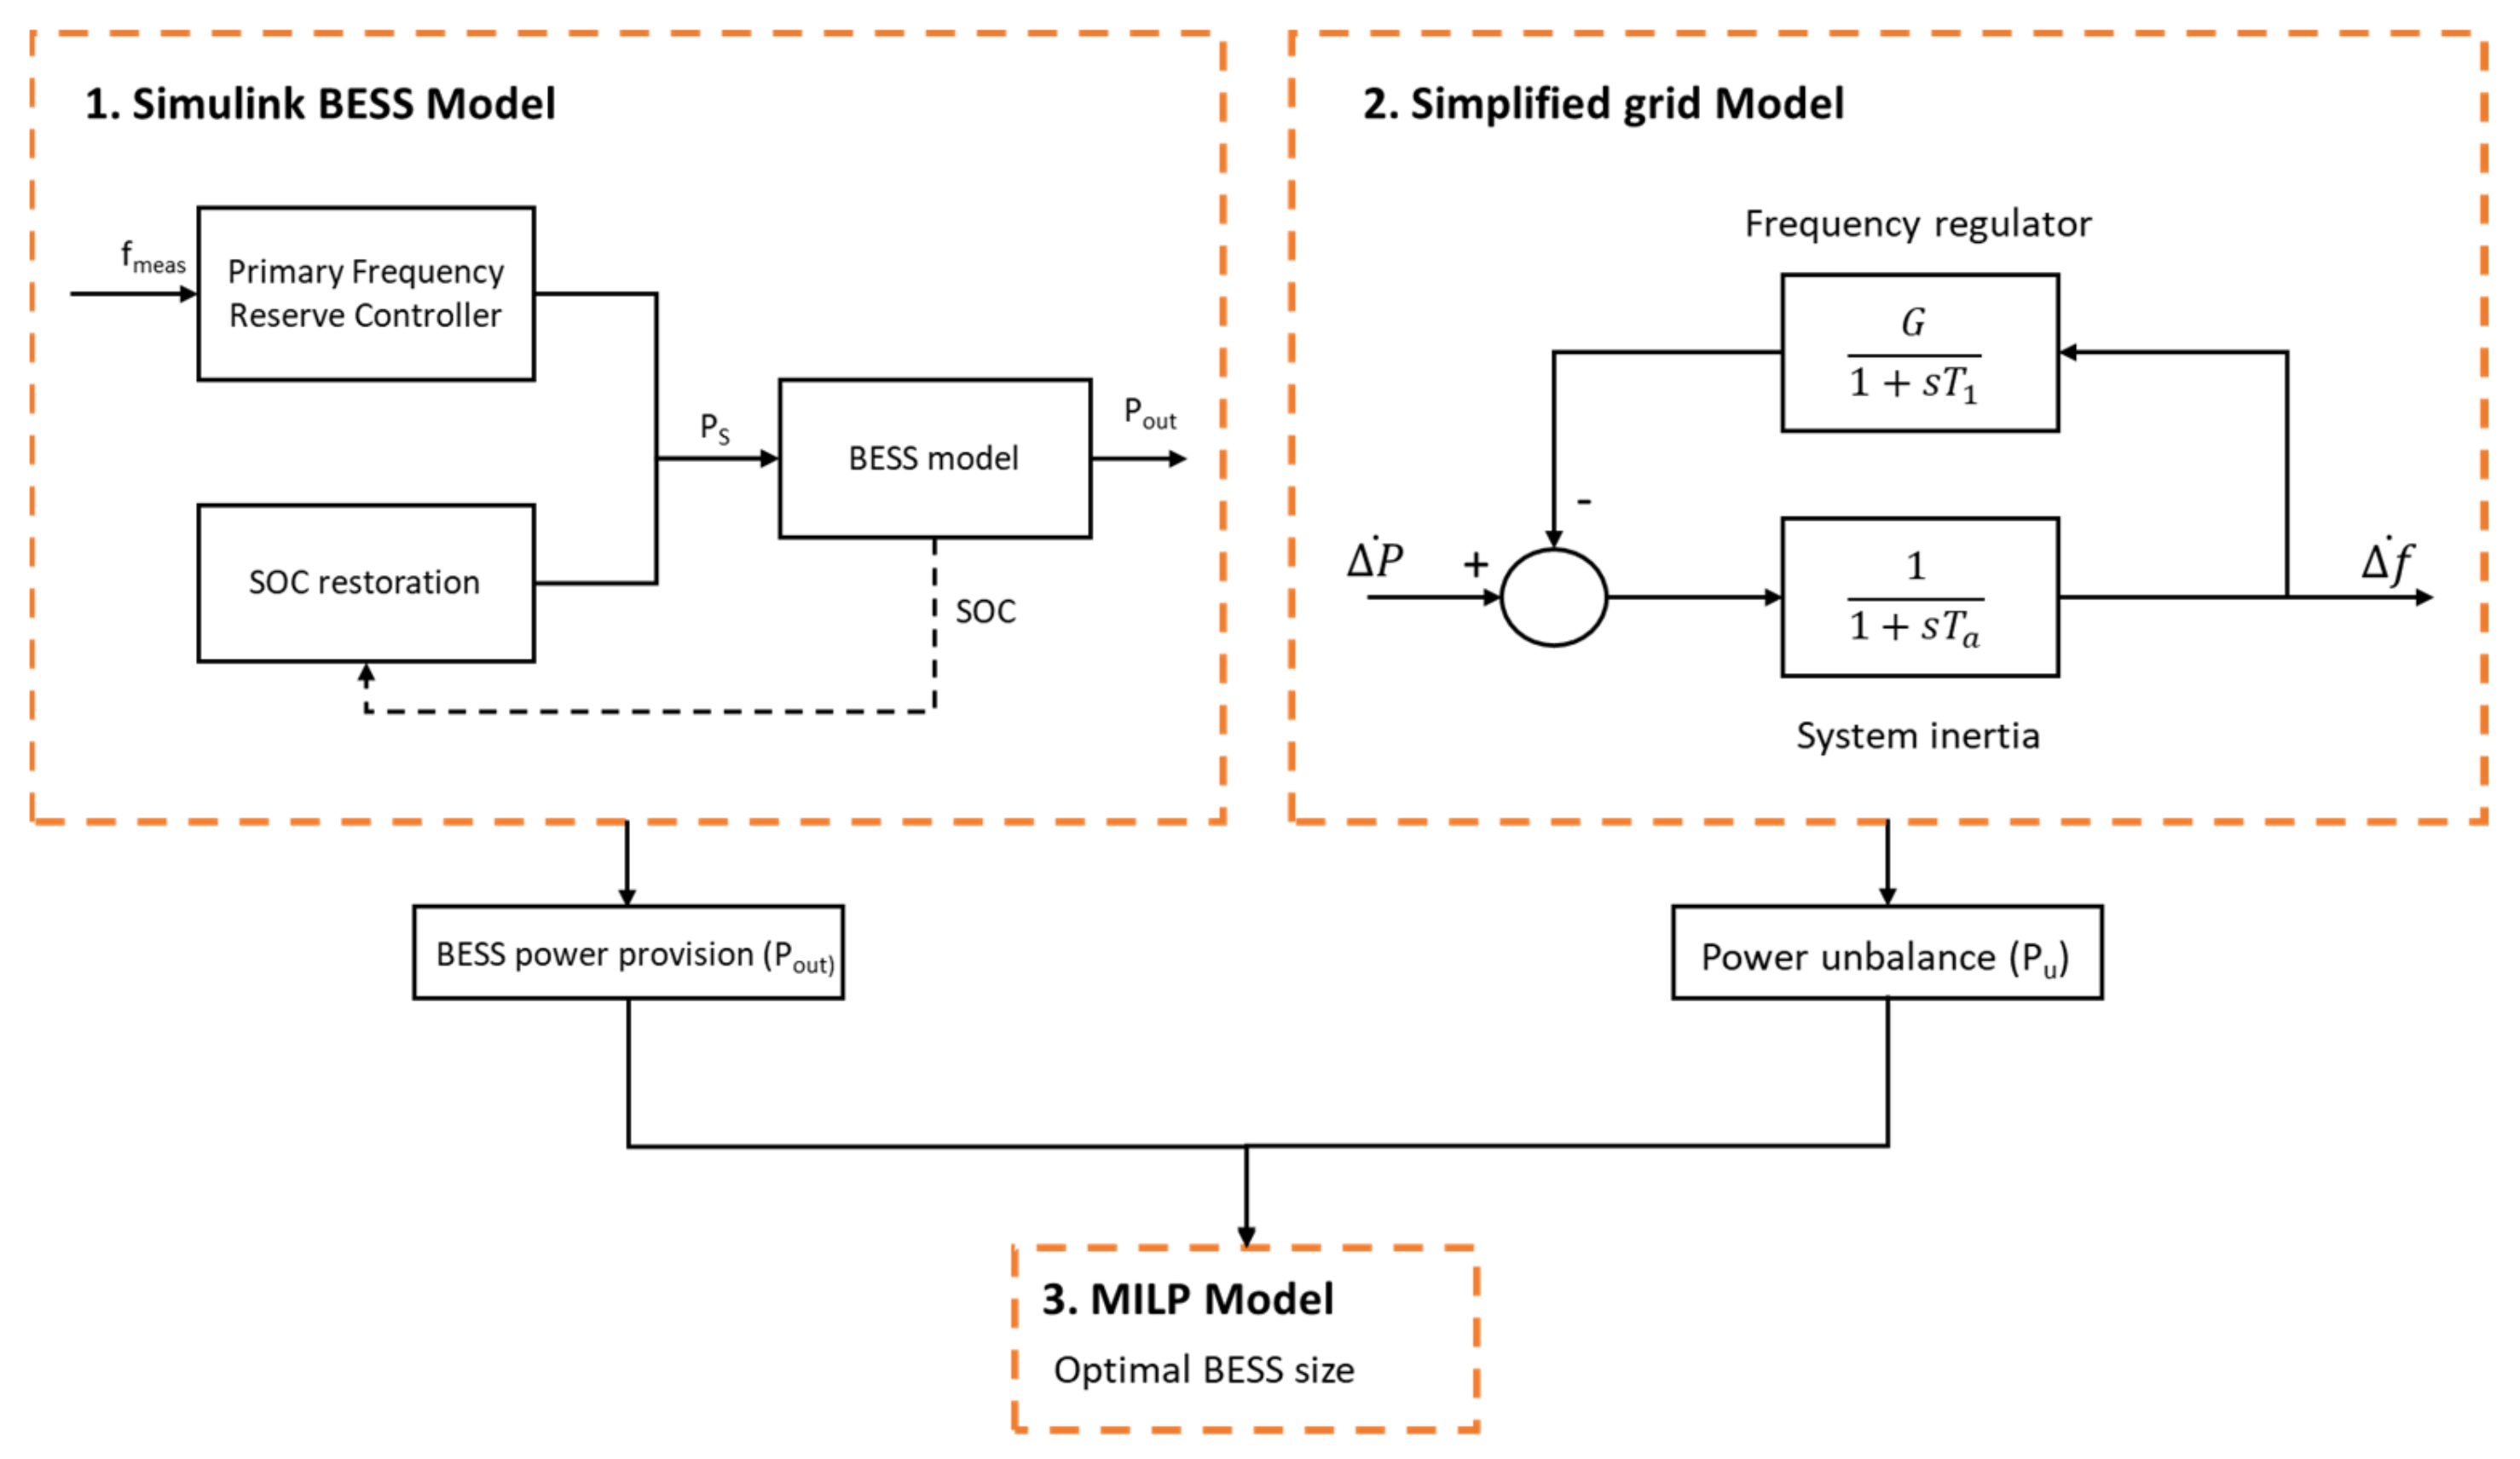
3. Proposed Methodology

The proposed methodology was used to assess BESS suitability for the provision of frequency control in the WAPP area. The model adopted consisted of three main modules as shown in Figure 6:
Figure 6. A schematic representation of the proposed methodology.
  • Simulink BESS model: This module aimed to simulate, with an open-loop MATLAB/Simulink model, BESS behavior for frequency reserve provision in the WAPP area. Different parameters and control logics were tested to evaluate which would be the best BESS regulating strategy;
  • Simplified grid model: By means of a simplified single machine model, the instantaneous power mismatch between generation and demand in the synchronous area was computed, taking the measured frequency deviations as the input;
  • MILP model: This last module takes the BESS power provision with different control strategies, simulated in the first module, and the grid power imbalance as the input. By means of a mixed integer linear programming (MILP) model, the optimal size of batteries that should be installed in the system to compensate the power imbalances was identified.

5. Power Imbalance Estimation

The simplified grid model adopted to estimate the instantaneous power imbalance (Pu) on the national grid was based on a single synchronous machine dynamic model. The relation between the power imbalance and the frequency deviations is a function of the system inertia and the speed governor (i.e., frequency regulator) characteristics [50,51]. The model depended on the total capacity of active generators in the interconnected system (regulating energy G), the equivalent time constant of the system ( T a ), the time constant of the speed governor ( T 1 ) , the transfer function equations for the speed governor and system inertia (Figure 11). In the proposed approach, the frequency sampled in the WAPPITS was taken as the input and the corresponding power imbalance was calculated. The model was implemented and run in the Matlab environment.
Figure 11. The single bus power system model.
The equivalent time constant of the system ( T a ) was computed as the average of the time constant of each of the connected generators ( T i ), taken from the WAPP data, and weighted according to their capacity ( P i ) . P t o t was the total capacity of the generators connected to the system and N g e n was the total number of generators:
T a = i = 1 N g e n P i T i P t o t
The model allowed us to compute the per unit power imbalance ( Δ P ˙ ) starting from the measured per unit frequency deviation ( Δ f ˙ = Δ f / f n o m ). The power imbalance at each time step, expressed in watts, was then computed as follows:
P u = Δ P ˙ P t o t

6. MILP Model for Optimal BESS Sizing

In this section, the simple MILP optimization model that was used to find the optimal size of the batteries to be installed in the system ( P B E S S ) is described. The goal of the model was to identify the quantity and optimize the size of the batteries to provide the maximum possible service to the grid whilst assuring that the power provided by the batteries could be accepted by the grid.
The input parameters were the power imbalance of the system at each time step P u , t , computed as described in the previous paragraph, and the per unit power output of the batteries providing primary frequency control in the system, according to the different control logics described in Section 6: P o u t ˙ = P o u t / P n . The time interval of each timestep t (which was the only independent index) was subsequently set to 1 s.
The objective function (Of), described in Equation (12), was the minimization of the absolute sum of the differences between the power provided by the total installed batteries and the total required by the grid at each time step t. The power provided by the installed batteries was given by the total installed capacity (PBESS), the dependent variable of the problem, multiplied by the power provided by a battery with unitary power P o u t ˙ .
O f = min t = t i t e | P o u t , t P B E S S P u , t |
Given the necessity of linearization, a new positive variable z(t) was defined and the model was expressed as:
P o u t , t ˙ P B E S S P u , t z t
O f = min t = t i t e z t
The model did not directly consider the BESS parameters. The parameters were already taken into account in characterizing battery behavior, as detailed in the previous Simulink model. The MILP model received the BESS power output as its input. This simplified the MILP optimization to achieve an optimal feasible solution.
The model was coded in Python language with the package pyomo and run with the academic license of the solver “gurobi”.

7. Simulation Results and Discussion

This section presents the simulation results for the BESS performance assessment in the WAPPITS. The three modules of the proposed procedure were run for several scenarios considering different BESS PFCR control strategies. The frequency control logics (A and B) and system restoration logics (alpha and beta) were tested using the Simulink model (module 4.1). The results of the simulation helped to characterize battery behavior using one-month actual frequency measurements from the WAPPITS. The details of the simulations’ settings are reported in Table 1 and Table 2. A step function was used to pass from the 0.25 Hz sampling time to the 1 Hz time step of the simulations.
Table 1. A summary of the simulations without SOC restoration.
Table 2. A summary of the simulations with the SOC restoration strategy.
The different control models were tested using the frequency measurements of Block 2, which were sampled at 4 s (the highest rate). The frequency behavior of Block 2 was more representative of the typical power system with some reasonable frequency control compared to the other blocks, which were sampled at 10 s and 60 s (lower rates). Given the similarities between the frequency trends of the blocks, the conclusions can assumably also be extended to Block 1 and Block 3.
The simulations were run for a battery with the same characteristics as that tested in the laboratory (EPR ratio of 2.28 h) but with a unitary nominal power P n of 1 MW to simplify the analysis. The regulating power of the battery Preg was the maximum available that was equal to P n , P n . The SOC limits were set as: SOCmin = 0; SOCmax = 100. The numerical values of the variable efficiency and maximum C-rate were those reported in Figure 9 and Figure 10.
After computing the power imbalance in the grid according to procedure 4.2, the optimal BESS size to be installed in the Block 2 area was estimated using the procedure of module 4.3. Each run of this last procedure corresponded to a different setting of the PFCR, previously simulated in Simulink.

7.1. PFRC Control Logic A

The BESS behavior was assessed by running the Simulink model with control logic A. Table 1 summarizes the scenarios (cases 1–9) that were analyzed based on a range of droop and deadband settings. The typical ranges of droop and DB that were used were selected from the ENTSO-E (European Network of Transmission System Operators for Electricity) area, as well as relaxed values, which were suggested as a reference for the WAPP region.
Figure 12 and Figure 13 show the results of the SOC over time and the SOC distribution, respectively, for each of the analyzed cases. The results using control logic A show that the battery saturated at 100% SOC in less than 3 h (around 10,000 s) in all analyzed cases without being able to discharge and hence, its role of providing services for primary frequency response was almost non-existent. The loss of regulation recorded was around 60% in all nine simulated cases. The observed battery behavior was due to the predominantly high frequency values recorded in the region.
Figure 12. The SOC trend over time (cases 1–9).
Figure 13. The SOC distribution (cases 1–9).
The results also show that neither the width of the deadband nor the droop values had much influence on the battery behavior. This can be seen from a comparison of the root mean square error (RMSE) values of the SOC profiles. The RMSE did not exceed 10% for scenarios with same droop but different deadbands (e.g., 1, 2 and 3) or for scenarios with same deadband but different droops (1, 4 and 7).

7.2. Frequency Control Logic B

The frequency control logic B was based on filtering the measured frequency in order to isolate the higher frequency variations from slower fluctuations, as described previously. Figure 14 shows an example of the fast and slow frequency fluctuations that were filtered from the measured frequency data. The study tested frequency control logic B with three different moving average windows sizes (600, 1800 and 3600 s) and three different droop values (0.075, 0.2 and 0.4). The scenarios (cases 10–18) that were analyzed are shown in Figure 14.
Figure 14. The decomposition of the frequency trend into fast and slow fluctuations.
Figure 15 and Figure 16 show the frequency control logic B simulation results for the SOC over time and the SOC distribution, respectively. Given the symmetrical frequency fluctuations to be compensated by the battery, it tended to discharge and reach SOC values of close to 0%. This was due to batteries’ internal losses when charging and discharging (modeled by charging and discharging efficiencies), which resulted in a higher power output than input (such behavior will be fixed by adopting a proper SOC restoration strategy, i.e., logic α or logic β). The results also show that the droop values influenced the speed at which battery was discharged. For example, with a moving average window of 600 s, the time to reach 0% SOC passed from 15,000 s with a droop of 0.075 to 20,000 s and 30,000 s with droops of 0.2 and 0.4.
Figure 15. The SOC trend over time (cases 10–18).
Figure 16. The SOC distribution (cases 10–18).
This trend was less visible when the moving average window was increased due to the higher amplitude fluctuations and the higher amount of energy that the battery had to provide. For example, the total energy requested by the PFRC from the battery during the test time period in case 18 was 253 MWh with a moving average window of 3600 s compared to 218 with a moving average window of 1800 s in case 15 and 152 MWh with a moving average window of 600 s in case 12. Consequently, while the BESS tended to stay at SOC < 20% (case 12) for 90% of the time with a small moving average window, this reduced to 50% in case 18. Since the purpose of the study was to analyze the ability of BESS to stabilize fast and small amplitude fluctuations, all subsequent analyses in this study utilized a 600 s moving average window. The average absolute value of power requested by the PFRC was 0.2 MW in case 12 compared to 0.3 MW in case 18.

7.3. SOC Restoration Strategies

The two SOC restoration logics previously described (α and β) were tested using a moving average window of 600 s. Logic α was simulated with different droop values and logic β was simulated with different values for the gain. Figure 17 and Figure 18 show results of the SOC over time and the SOC distribution, respectively. The average SOC distribution in both cases was approximately 50%. The BESS did not saturate and thus, continuously provided the required service for the primary frequency response. For logic α, the BESS would need to be recharged to the target 50% SOC about 10 times per month. This is based on the assumption that the BESS is recharged at the nominal value. This results in a BESS unavailability of 23 h per month. For Logic β, the sum of relative differences between the power provided by the battery and power required to regulate the fast frequency oscillations increased as the gain increased. For example, 16% of the total power for case 22 compared to 5% for case 25 and 6% for case 20. The results show that this restoration logic effectively managed the SOC whilst also ensuring there was no interruption in the energy provision from the BESS for the primary frequency response.
Figure 17. The SOC trend over time (cases 19–25).
Figure 18. The SOC distribution (cases 19–25).
The effectiveness of the proposed frequency control logics was also assessed on the basis of the number of cycles provided by batteries, the total loss of regulation and the energy provided to the system (proportional to the number of cycles).
For frequency control logic A, the loss of regulation was approximately 60% of the total energy required. The loss of regulation was not significantly influenced by changing the droop and deadband values. This is because the battery reached saturation. Frequency control logic B was comparatively responsive to a change in droop values. Changing the droop values could double the total number of cycles provided by the battery. For example, the number of cycles increased from 55 cycles in case 10 for a droop of 0.075 to 111 cycles in case 12 for a droop of 0.4. The loss of regulation was almost null in logic B compared to logic A (2% against 60%). A lower loss of regulation enabled the BESS to provide the required service for more than 95% of the time in all cases, with or without SOC restoration. Restoration logic α allowed the battery to work 99% of the time (actually, the remaining 1% was caused by the recharging period and, if this were accurately planned then it could be further reduced, e.g., in moments when the frequency is inside the deadband). This logic allowed an increase in the number of cycles that the battery was able to operate. For example, comparing cases with the same settings, the number of cycles was 89 in case 10 and 97 in case 19. Figure 19 shows the simulation results for the number of cycles, the loss of regulation and the energy provided by the battery to the system.
Figure 19. A comparison of the indicators in the different simulations.

7.4. BESS Sizing

Given the measured frequency deviation on the grid, the active power imbalance was estimated by means of the model shown in Figure 9., with the parameters reported in Table 3. The values of T1 and G were taken from the literature and corresponded to the typical values of hydro generators. Ta and Ptot were instead evaluated from the WAPP data. The results are shown in Figure 20.
Table 3. The parameters for the power imbalance estimation.
Figure 20. Delta P vs. Delta f.
The estimated power imbalance oscillated between a minimum of −50 MW and a maximum of 100 MW. The optimal size of the BESS in terms of power (PBESS) and energy (EBESS) that could supply such an imbalance, found by means of the minimization of power fluxes (as described earlier), is reported in Table 4 with each line corresponding to a different case. For the sake of simplicity, only the results for the moving average window of 600 s are reported. The non-supplied energy (NSE) indicator was computed as the difference between the installed batteries’ energy output and the total energy requested by the system. This differs from the LOR since it depends not only on battery saturation, but also on the chosen battery size (when the installed BESS are too small, this indicator increases). The column called “NSE service” represents the NSE considering the total energy required by the specific control logic (A or B). Logic B had a lower required energy because it only required the regulation of faster fluctuations. “NSE tot” is the NSE with respect to the total power imbalance in the system (in the case of logic A, it was equal to “NSE service”). The last two columns show the percentage of NSE with respect to total energy required.
Table 4. The MILP optimization results.
For scenarios 1–9, where the actual frequency measurement was used as the input for the BESS model (control logic A), a relatively large battery size was required. This was due to the higher amplitude of oscillations that needed to be balanced. The total energy not supplied with respect to that required by the system was above 60% in all scenarios. When control logic B was applied (scenarios 10–25), the required battery size did not always change significantly from that of scenarios 1–9. Comparing the simulations with the same DB and droop settings: from scenario 1 to 10, the size of the battery was more than halved; for scenarios 4 to 11, the battery size reduced by 20%; and for scenarios 7 to 12, battery size remained almost the same. On the contrary, the energy not supplied relative to that required by the system to balance the fast oscillation reduced significantly. In case 1, the NSE was 68%, while it was 43% in case 10, 67% in case 4, 29% in case 11, 63% in case 7 and 23% in case 12. When a SOC restoration logic was applied, the battery size was further optimized and was able to reduce the NSE to a minimum of 19% in case 21, corresponding to restoration logic α and a droop of 0.4. The simulation results show that in order to have an optimally sized battery at a reduced cost with a lower NSE, the BESS should be designed with control logic B and a SOC restoration logic to ensure the effective provision of a regulation service.
Figure 21 provides details of the behavior of the installed BESS with different control models when the droop = 0.2 and DB = 0.02 Hz. The installed battery was of a similar size (37, 36 and 38 MW) and it was able to provide regulation for the fast fluctuations in all cases, until time = 2.667 × 10⁵ (4 s). At that moment, in case 11, i.e., the scenario without SOC restoration, the BESS had a SOC of 3% and the C-rate was limited at 0.034 1/h. For this reason, there was a higher amount of NSE with respect to cases 20 and 24, where the SOC was still at 44% and the C-rate could reach 0.45 1/h. However, since power imbalances were higher than the installed BESS capacity in the three cases, the picture shows plateaus in the power output from time 2.667 × 10⁵ (4 s) to 2.669 × 10⁵ (4 s), which indicates that energy was not supplied. Instead of using the MILP model, BESS could have been sized to be able to respond to all power peaks, but this would have caused an oversizing of the system that would have resulted in a large capacity of the BESS not being fully utilized for the majority of time.
Figure 21. The power provided by the BESS vs. the power imbalance fluctuations.

8. Conclusions

In this paper, the application and effectiveness of a Battery Energy Storage System (BESS) in providing primary frequency control reserves in the WAPPITS was analyzed. Based on numerical simulations that were performed using simple open-loop BESS modeled in MATLAB/Simulink, the paper analyzed two frequency controls and state of charge restoration logics for the better utilization, performance and effectiveness of BESS using actual frequency measurements from the WAPPITS.
For the BESS frequency control logic analysis, the simulation results show that the use of the moving average frequency control logic decomposed the frequency trend into fast, smaller oscillations and slow, wider oscillations with only the faster oscillations being regulated. This frequency control logic would be an effective way of using the BESS to provide regulation service in the WAPPITS, considering the existing frequency trend.
For the BESS SOC restoration strategy control logic analysis, the BESS charged and discharged quickly due to the chaotic nature of the frequency in the WAPPITS. The SOC restoration strategy, which was based on the change in frequency being proportional to the SOC, was effective in ensuring a guaranteed availability and a higher BESS regulating service continuity.
The simulation results also show that, with the existing frequency trend in the WAPPITS, a BESS may not be the solution to the current frequency control challenges and, therefore, call for the need to put in place the necessary regulatory and technical frameworks that would require conventional power plants to provide some significant amount of primary frequency control. The deployment of BESS without solving the fundamental frequency control issues would be expensive, since huge BESS sizes would be required to provide the balancing services. This is shown by the results of the optimal BESS sizes established in the paper. A possible overreliance on BESS for frequency regulation in the WAPPITS would lead to an increase in battery average C-rate and BESS life cycles and the need to frequently replace the BESS.
A limitation of the present analysis is the use of discrete values for the parameters in the input to the Simulink model (e.g., the droop and deadband settings). A sensitivity analysis with a continuous variation of their values or a Monte Carlo sampling could be useful to further investigate the different control strategies. Moreover, this paper adopted an open-loop BESS model that is already present in the literature, without modeling the entire WAPPITS. Further analysis on the application and effectiveness of BESS will be carried out using a comprehensive power flow and a dynamic model of the WAPPITS.

Author Contributions

Conceptualization, J.A., S.C., M.M., and D.Z.; methodology, J.A., S.C., M.M., and D.Z.; software, J.A., S.C.; validation, J.A., S.C.; formal analysis, J.A., S.C., M.M., and D.Z.; investigation, J.A., S.C.; resources, J.A.; data curation, J.A.; writing—original draft preparation, J.A., S.C., M.M., D.Z.; writing—review and editing, M.M.; D.Z.; visualization J.A., S.C., M.M., and D.Z.; supervision, M.M., D.Z.; project administration, D.Z.; funding acquisition, D.Z. All authors have read and agreed to the published version of the manuscript.

Funding

Silvia Corigliano is partially funded by the Enel Foundation for her research activities.

Institutional Review Board Statement

Not applicable.

Data Availability Statement

Not applicable.

Conflicts of Interest

The authors declare no competing financial interests.

Abbreviations

BESSBattery Energy Storage System
LORLoss of regulation
MILPMixed integer linear programming
MPCModel predictive control
NSENon-supplied energy
PFCRPrimary frequency reserve controller
RESRenewable energy system
SOCState of charge
WAPPWest African Power Pool
WAPPITSWAPP Interconnected Transmission System
EnNominal energy
PnNominal power
EPrEnergy to power ratio
E P F R C Regulating energy
t s Start time
t e End time
P s Power setpoint
S O C m i n Minimum state of charge
S O C m a x Maximum state of charge
G Regulating energy
Ta Equivalent time constant of the system
T 1 Time constant of the speed governor
P u Power imbalance in the system
C B E S S Total installed capacity of battery
P o u t Battery output power
P t o t Total installed generator capacity in the system
η c Battery charging efficiency
η d Battery discharging efficiency
Δ ˙ P B Real power required from the battery
f a v e r Average frequency
f m e a s Measured frequency

References

  1. ECOWAS Master Plan for the Development of Regional Generation and Transmission Infrastructure, 2019–2033. Available online: https://www.ecowapp.org/sites/default/files/volume_0.pdf (accessed on 15 December 2021).
  2. Peter, M.; Ron, D.; Ben, W.; Brian, H.; Randall, H.; Jeff, E. Dynamic Simulation Studies of the Frequency Response of the Three U.S. Interconnections with Increased Wind Generation; Lawrence Berkeley National Laboratory: San Francisco, CA, USA, 2010.
  3. National Grid Frequency Response Working Group. Frequency Response Report; National Grid Frequency Response Working Group: London, UK, 2013; Available online: https://www.nationalgrid.com/sites/default/files/documents/16927-Workgroup%20Report.pdf (accessed on 15 December 2021).
  4. O’Sullivan, J.; Rogers, A.; Flynn, D.; Smith, P.; O’Malley, M. Studying the Maximum Instantaneous Non-Synchronous Generation in an Island System—Frequency Stability Challenges in Ireland. IEEE Trans. Power Syst. 2014, 29, 2943–2951. [Google Scholar] [CrossRef] [Green Version]
  5. Duval, J.; Meyer, B. Frequency Behavior of Grid with High Penetration Rate of Generator under the Increasing Penetration of Wind/PV Connections Wind Generation. In Proceedings of the 2009 IEEE PowerTech, Bucharest, Romania, 28 June–2 July 2009; pp. 1–6. [Google Scholar]
  6. Miller, N.W.; Clark, K.; Shao, M. Frequency Responsive Wind Plant Controls: Support is Provided through Three Types: Inertial Response, Pri- Impacts on Grid Performance. In Proceedings of the 2011 IEEE Power and Mary Frequency Control and Automatic Generation Control (AGC) Energy Society General Meeting, Detroit, MI, USA, 24–28 July 2011; pp. 1–8. [Google Scholar]
  7. Yan, R.; Saha, T.K.; Modi, N.; Masood, N.-A.; Mosadeghy, M. The combined effects of high penetration of wind and PV on power system frequency response. Appl. Energy 2015, 145, 320–330. [Google Scholar] [CrossRef]
  8. Paul, D.; Maureen, H. Grid flexibility and storage required to achieve very high penetration of variable renewable electricity. Energy Policy 2011, 39, 1817–1830. [Google Scholar]
  9. Pasquini, S.; Rizzo, F.; Stori, M.; Abayateye, J.; Sanou, H.; Adeyemo, B. Operational Study for the Synchronization of WAPP Interconnected Power System for the target years 2016 and 2020. In Proceedings of the CIGRE 8th Southern Africa Regional Conference, Cape Town, South Africa, 14–17 November 2017; Available online: https://www.cigresa-events.co.za/symposium_2017/2017_post_documents/presentations/Session%205%20Transmission%20system%20integration/5.01_Operational%20Studies%20SynchronizationWAPP%20Interconnected%20Power%20System.pdf (accessed on 15 December 2021).
  10. Abayateye, J.; Pasquini, S.; Sanou, H.; Adeyemo, B.; Stori, M.; Soda, E.; Lamquet, O. Analysis and Estimation of Generator Settings for Frequency Response in the WAPP Interconnected Transmission System. In Proceedings of the IEEE Power Africa Conference 2017, Accra, Ghana, 27–30 June 2017. [Google Scholar]
  11. West African Power Pool, 2020-2023 WAPP Business Plan. Available online: https://www.ecowapp.org/sites/default/files/wapp_2020-2023_business_plan_0.pdf (accessed on 15 December 2021).
  12. Annual Report 2020 West Africa Power Pool. 2020. Available online: https://www.ecowapp.org/sites/default/files/wapp_2020_annual_report_fin1.pdf (accessed on 15 December 2021).
  13. The World Bank Group. Assessment of Battery Storage Applications in the West African Power Pool (WAPP) Utilities and Countries; The World Bank Group: Washington, DC, USA, 2017; Available online: https://nl4worldbank.files.wordpress.com/2017/03/assessment-of-battery-energy-storage-applications-in-the-west-african-power-pool-wapp-utilities-and-countries.docx (accessed on 15 December 2021).
  14. Pietro, I.; Claudio, B.; Marco, M. SOC management strategies in Battery Energy Storage System Providing Primary Control Reserve. Sustain. Energy Grids Netw. 2019, 19, 100230. [Google Scholar]
  15. Mégel, O.; Mathieu, J.L.; Andersson, G. Maximizing the potential of energy storage to provide fast frequency control. In Proceedings of the IEEE PES ISGT Europe 2013, Lyngby, Denmark, 6–9 October 2013; pp. 1–5. [Google Scholar] [CrossRef]
  16. Borsche, T.; Ulbig, A.; Koller, M.; Andersson, G. Power and energy capacity requirements of storages providing frequency control reserves. In Proceedings of the 2013 IEEE Power & Energy Society General Meeting, Vancouver, BC, Canada, 21–25 July 2013; pp. 1–5. [Google Scholar] [CrossRef]
  17. Miguel, R.; Rafael, C.; Guillermo, C.; Om, M. Placement and sizing of battery energy storage for primary frequency control in an isolated section of the Mexican power system. Electr. Power Syst. Res. 2018, 160, 142–150. [Google Scholar]
  18. Divya, K.C.; Ostergaard, J. Battery energy storage technology for power systems—An overview. Electr. Power Syst. Res. 2009, 79, 511–520. [Google Scholar] [CrossRef]
  19. Hesse, H.; Schimpe, M.; Kucevic, D.; Jossen, A. Lithium-ion battery storage for the grid—A review of stationary battery storage system design tailored for applications in modern power grids. Energies 2017, 10, 2107. [Google Scholar] [CrossRef] [Green Version]
  20. Zhao, H.; Wu, Q.; Huang, S.; Guo, Q.; Sun, H.; Xue, Y. Optimal siting and sizing of energy storage system for power systems with large scale wind power integration. In Proceedings of the 2015 IEEE Eindhoven PowerTech, Eindhoven, The Netherlands, 29 June–2 July 2015; pp. 1–6. [Google Scholar]
  21. Adrees, A.; Milanovi´c, J.V. Study of frequency response in power system with renewable generation and energy storage. In Proceedings of the PSCC, Genoa, Italy, 20–24 June 2016; pp. 1–7. [Google Scholar]
  22. Knap, V.; Chaudhary, S.K.; Stroe, D.-I.; Swierczynski, M.; Craciun, B.-I.; Teodorescu, R. Sizing of an energy storage system for grid inertial response and primary frequency reserve. IEEE Trans. Power Syst. 2016, 31, 3447–3456. [Google Scholar] [CrossRef] [Green Version]
  23. Moon, H.J.; Yun, A.-Y.; Kim, E.-S.; Moon, S.-I. An analysis of energy storage systems for primary frequency control of power systems in South Korea. Energy Procedia 2017, 107, 116–121. [Google Scholar] [CrossRef]
  24. Alhejaj, S.M.; Gonzalez-Longatt, F.M. Investigation on grid-scale BESS providing inertial response support. In Proceedings of the IEEE POWERCON, Wollongong, NSW, Australia, 28 September–1 October 2016; pp. 1–6. [Google Scholar]
  25. Xu, X.; Bishop, M.; Oikarinen, D.G.; Hao, C. Application and modeling of battery energy storage in power systems. CSEE J. Power Energy Syst. 2016, 2, 82–90. [Google Scholar] [CrossRef]
  26. Greenwood, D.M.; Lim, K.Y.; Patsios, C.; Lyons, P.F.; Lim, Y.S.; Taylor, P.C. Frequency response services designed for energy storage. Appl. Energy 2017, 203, 115–127. [Google Scholar] [CrossRef]
  27. Rancilio, G.; Pasquadibisceglie, M.S.; Merlo, M.; Bovera, F.; Falabretti, D.; Delfanti, M. Limited Energy Reservoirs: Analysis of the proposed methodology for opening Frequency Containment Reserve to energy storage in EU. In Proceedings of the 2019 IEEE International Conference on Environment and Electrical Engineering and 2019 IEEE Industrial and Commercial Power Systems Europe (EEEIC/I & CPS Europe), Genova, Italy, 11–14 June 2019; pp. 1–7. [Google Scholar] [CrossRef]
  28. Rancilio, G.; Lucas, A.; Kotsakis, E.; Fulli, G.; Marco, M.; Delfanti, M.; Masera, M. Modeling a large-scale battery energy storage system for power grid application analysis. Energies Open Access 2019, 12, 3392. [Google Scholar] [CrossRef] [Green Version]
  29. Claudio, B.; Stefano, M.; Marco, M. Battery energy storage system for primary control reserve and energy arbitrage. Sustain. Energy Grids Netw. 2016, 6, 152–165. [Google Scholar]
  30. Graditi, G.; Ciavarella, R.; Di Somma, M.; Guidi, G.; Valenti, M. SOC-based BESS control logic for dynamic frequency regulation in microgrids with renewables. In Proceedings of the 1st International Conference on Energy Transition in the Mediterranean Area, SyNERGY Med, Cagliari, Italy, 28–30 May 2019. [Google Scholar]
  31. Arrigo, F.; Bompard, E.; Merlo, M.; Milano, F. Assessment of primary frequency control through battery energy storage systems. Electr. Power Energy Syst. 2020, 115, 105428. [Google Scholar] [CrossRef] [Green Version]
  32. Oudalov, A.; Chartouni, D.; Ohler, C. Optimizing a Battery Energy Storage System for Primary Frequency Control. IEEE Trans. Power Syst. 2007, 22, 1259–1266. [Google Scholar] [CrossRef]
  33. Hart, D.; Sarkissian, A. Deployment of Grid-Scale Batteries in the United States; Office of Energy Policy and Systems Analysis U.S. Department of Energy: Washington, DC, USA, 2016.
  34. Tang, Z.X.; Lim, Y.S.; Morris, S.; Yi, J.L.; Lyons, P.F.; Taylor, P.C. A comprehensive work package for energy storage systems as a means of frequency regulation with increased penetration of photovoltaic systems. Int. J. Electr. Power Energy Syst. 2019, 110, 197–207. [Google Scholar] [CrossRef]
  35. Frequency Stability Evaluation Criteria for the Synchronous Zone of Continental Europe. ENTSO-E. 2016. Available online: https://eepublicdownloads.entsoe.eu/clean-documents/SOC%20documents/RGCE_SPD_frequency_stability_criteria_v10.pdf (accessed on 15 December 2021).
  36. Ortega, Á.; Milano, F. Modeling, simulation, and comparison of control techniques for energy storage systems. IEEE Trans. Power Syst. 2017, 32, 2445–2454. [Google Scholar] [CrossRef]
  37. Ortega, Á.; Milano, F. Stochastic transient stability analysis of transmission systems with inclusion of energy storage devices. IEEE Trans. Power Syst. 2018, 33, 1077–1079. [Google Scholar] [CrossRef] [Green Version]
  38. Toma, L.; Sanduleac, M.; Baltac, S.A.; Arrigo, F.; Mazza, A.; Bompard, E.; Musa, A.; Monti, A. On the virtual on the virtual inertia provision by BESS in low inertia power systems. In Proceedings of the IEEE International Energy Conference (ENERGYCON), Limassol, Cyprus, 3–7 June 2018; pp. 1–6. [Google Scholar]
  39. Zhao, H.; Hong, M.; Lin, W.; Loparo, K.A. Voltage and frequency regulation of microgrid with battery energy storage systems. IEEE Trans. Smart Grid. 2019, 10, 414–424. [Google Scholar] [CrossRef]
  40. Aghamohammadi, M.R.; Abdolahinia, H. A new approach for optimal sizing of battery energy storage system for primary frequency control of islanded microgrid. Int. J. Elec. Power 2014, 54, 325–333. [Google Scholar] [CrossRef]
  41. Thien, T.; Schweer, D.; vom Stein, D.; Moser, A.; Sauer, D.U. Real-world operating strategy and sensitivity analysis of frequency containment reserve provision with battery energy storage systems in the German market. J. Energy Storage 2017, 13, 143–163. [Google Scholar] [CrossRef]
  42. Borsche, T.S.; Ulbig, A.; Andersson, G. Impact of frequency control reserve provision by storage systems on power system operation. IFAC World Congr. 2014, 47, 4038–4043. [Google Scholar] [CrossRef] [Green Version]
  43. Košický, T.; Kolcun, M.; Beňa, L. Influence of state of charge level on frequency control reserve provision by energy storage systems. Trans. Electr. Eng. 2015, 4, 36–41. [Google Scholar]
  44. Mercier, P.; Cherkaoui, R.; Oudalov, A. Optimizing a battery energy storage system for frequency control application in an isolated power system. IEEE Trans. Power Syst. 2009, 24, 1469–1477. [Google Scholar] [CrossRef]
  45. Arnold, M.; Andersson, G. Model predictive control of energy storage including uncertain forecasts. In Proceedings of the 17th Power Systems Computation Conference, Stockholm, Sweden, 22–26 August 2011; pp. 1–7. Available online: http://citeseerx.ist.psu.edu/viewdoc/download?doi=10.1.1.722.6663&rep=rep1&type=pdf (accessed on 15 December 2021).
  46. Khalid, M.; Savkin, A.V. An optimal operation of wind energy storage system for frequency control based on model predictive control. Renew. Energy 2012, 48, 127–132. [Google Scholar]
  47. Koller, M.; Borsche, T.; Ulbig, A.; Andersson, G. Review of grid applications with the Zurich 1MW battery energy storage system. Electr. Power Syst. Res. 2015, 120, 128–135. [Google Scholar] [CrossRef]
  48. Pandey, S.K.; Mohanty, S.R.; Kishor, N. A literature survey on load–frequency control for conventional and distribution generation power systems. Renew. Sustain. Energy Rev. 2013, 25, 318–334. [Google Scholar] [CrossRef]
  49. Kunisch, K.H.; Kramer, G.; Dominik, H. Battery Energy Storage another Option for Load-Frequency-Control and Instantaneous Reserve. IEEE Trans. Energy Convers. 1986, EC-1, 41–46. [Google Scholar] [CrossRef]
  50. Hansen, A.D.; Sørensen, P.E.; Zeni, L.; Altin, M. Frequency control modelling-basics. DTU Wind Energy E 2016, 49, 0103. Available online: https://orbit.dtu.dk/en/publications/frequency-control-modelling-basics (accessed on 15 December 2021).
  51. Kundur, P. Power System Stability. In Power System Stability and Control; CRC Press: Boka Raton, FL, USA, 2007; pp. 1–7. [Google Scholar]
Publisher’s Note: MDPI stays neutral with regard to jurisdictional claims in published maps and institutional affiliations.

Article Metrics

Citations

Article Access Statistics

Multiple requests from the same IP address are counted as one view.