Article

A Study of the Pyrolysis Products of Kraft Lignin

1
Department of Civil, Chemical and Environmental Engineering, University of Genoa, Via Opera Pia 15, 16145 Genoa, Italy
2
Department of Chemistry and Industrial Chemistry, University of Genoa, Via Dodecaneso 31, 16146 Genoa, Italy
*
Author to whom correspondence should be addressed.
Energies 2022, 15(3), 991; https://doi.org/10.3390/en15030991
Submission received: 25 December 2021 / Revised: 17 January 2022 / Accepted: 25 January 2022 / Published: 28 January 2022
(This article belongs to the Special Issue Environmental Biotechnology for Green Energy)

Abstract

:
In order to valorize lignin wastes to produce useful aromatic compounds, the thermal degradation pyrolysis of Kraft lignin in the absence of catalysts has been investigated at 350, 450, and 550 °C. The high content of sulfur in the fresh sample led to the formation of S-containing compounds in products whose evolution in the gas phase was monitored through GC-MS analysis. Pyrolytic gas is rich in CH4, CO, CO2, and H2S with the presence of other sulfur compounds in smaller amounts (i.e., CH3SH, CH3-S-CH3, SO2, COS, and CS2). Biochar morphology and elemental composition have been investigated by means of SEM and EDX. The carbon content reaches ~90% after pyrolysis at 550 °C, while the oxygen content showed a decreasing trend with increasing temperature. From GC-MS analysis, bio-oil resulted rich in alkyl-alkoxy phenols, together with (alkyl)dihydroxy benzenes and minor amounts of hydrocarbons and sulfur compounds. NaOH/H2O and EtOH/H2O extraction were performed with the aim of extracting phenolic-like compounds. Sodium hydroxide solution allowed a better but still incomplete extraction of phenolic compounds, leaving a bio-oil richer in sulfur.

1. Introduction

Over the last century, the world’s population and energy demands have increased, highlighting the need to find valid renewable alternatives for energy and chemical intermediate production. The use of non-renewable materials is no longer sustainable due to their limited availability and their impact on the environment. Gaseous products deriving from the combustion of these materials have been one of the major components responsible for the enhancement of the global warming effect [1]. In recent years, biomasses have been deeply studied as one of the most promising sources of hydrocarbons. However, despite biomasses having already been adopted in many application fields, their actual contribution is not sufficient to satisfy the global energy demand. Many issues concerning large-scale applications of biomasses must be considered from the life cycle point of view. The low availability of global landmass and water supply coupled with the necessity to increase food production for an ever-growing population will be one most challenging issues [2]. For this reason, lignocellulosic leftovers produced in paper or food production as by-products must be valorized, because they are generally used in furnaces for heat generation [3]. Moreover, the possible production of value-added products would be even more desirable, allowing the development of green industrial chemistry processes for the production of chemical intermediates or even fine chemicals.
Lignin is one of the three main components of wood, together with cellulose and hemicellulose [4]. These compounds are the constituent of the plant cell wall, where lignin plays a significant role in increasing the rigidity and the resistance of the cell. This is mainly due to the complex lignin structure, i.e., a polymer of p-coumaryl alcohol, sinapyl alcohol, and coniferyl alcohol. The more complex structure of lignin and its chemical recalcitrance compared to cellulose and hemicellulose has always represented an obstacle in its utilization, even if it has a great potential from an industrial point of view [5].
Different processes can be performed to separate lignin from the other components of wood. However, depending on both the employed chemicals and process conditions, the obtained lignin has quite a different chemical structure and composition. Kraft lignin is one of the most produced types of lignin, deriving from paper and pulping processes that use a soda–sodium sulfide solution for lignin isolation (Kraft Process) [2,6,7]. For this reason, Kraft lignin contains a sulfur amount (i.e., 2–4%) higher than that obtained with other techniques.
Several thermochemical methods have been developed and used in the conversion of biomasses into chemicals [8,9,10,11,12,13,14]. For sure, pyrolysis is the most commonly used, where thermal conversion in an oxygen-free environment is carried out, allowing the production of a bio-oil, together with a biochar and pyrolysis gas in different ratios as a function of the process conditions and the feedstock’s properties [15]. However, the low selectivity of employable biofuels in lignin pyrolysis led scientists to focus on possible chemical reaction pathways that occur during the process in order to highlight promising chemical intermediates to be obtained through this process [16,17]. Liquid products can contain a great number of chemical species and, for this reason, the characterization of pyrolysis bio-oil is not trivial [18]. The presence of oxygenated compounds in pyrolytic bio-oil decreases the quality of the oil itself, which has to be upgraded with further treatments, but are interesting platform molecules for fine chemicals production.
According to the literature, several zeolites and carbon-based catalysts have been used in the pyrolysis processes of lignin with the aim to maximize the production of phenols and guaiacols [19,20,21]. Other studies report the effects of formates in the alkyl phenol production from the thermal degradation of lignin [22]. In particular, Wang et al. used sodium, calcium, and nickel formates impregnated in Kraft lignin [23].
In this paper, commercial Kraft lignin has been pyrolyzed at different process conditions in the absence of a catalyst. The resulting products have been separated and quantified in order to give a better understanding of the chemical distribution of the cracked compounds. In addition, the chemical composition of the liquid fraction has been studied. Liquid–liquid extractions have been performed with the aim to extract aromatic compounds in order to evaluate the feasibility of separation processes and the identification of valuable molecules.

2. Materials and Methods

2.1. Materials

The commercial Kraft lignin (denoted as KL in the following) used in this work was purchased from StoraEnso® (LineoTM Classic Lignin, Kotka, Finland), and its chemical characteristics are available at the supplier website (https://www.storaenso.com/en/products/lignin/lineo, accessed on 17 January 2022). Lignin was characterized in terms of moisture and ash content. For liquid extractions, ethanol (assay 99.8%, Sigma Aldrich, St. Louis, MO, USA) and NaOH (assay 99.7%, Sigma Aldrich, St. Louis, MO, USA) were used to obtain the desired EtOH/H2O (1:1 v/v) and NaOH/H2O (0.1 M) mixtures. Chloroform (assay 99.9%, Carlo Erba reagents, Milan, Italy) was used to dilute reaction liquids. KBr (Carlo Erba reagents, Milan, Italy) was adopted to perform FT-IR analysis of the samples. Sample morphology and elemental compositions were investigated by means of a Zeiss Evo 40 equipped with a Pentafet Link Energy Dispersive X-ray Spectroscopy system managed by the INCA Energy software (Oxford Instruments, Analytical Ltd., Bucks, UK).

2.2. Fresh Lignin Characterization Procedures

Fresh Kraft Lignin (KL) was characterized by focusing on ash and moisture content, elemental composition, and morphology. Moisture and ash content were measured in agreement with AOAC methods [24]. Morphology was investigated by scanning electron microscopy (SEM), while the elemental composition of KL was determined through energy-dispersive X-ray spectroscopy (EDX). These analyses were performed on fresh KL and on pyrolytic residues in order to evidence the influence of the reaction temperature on morphological properties. In particular, EDX focused on the composition in terms of C, Na, S, and O content, describing how their distribution varies with the reaction conditions.

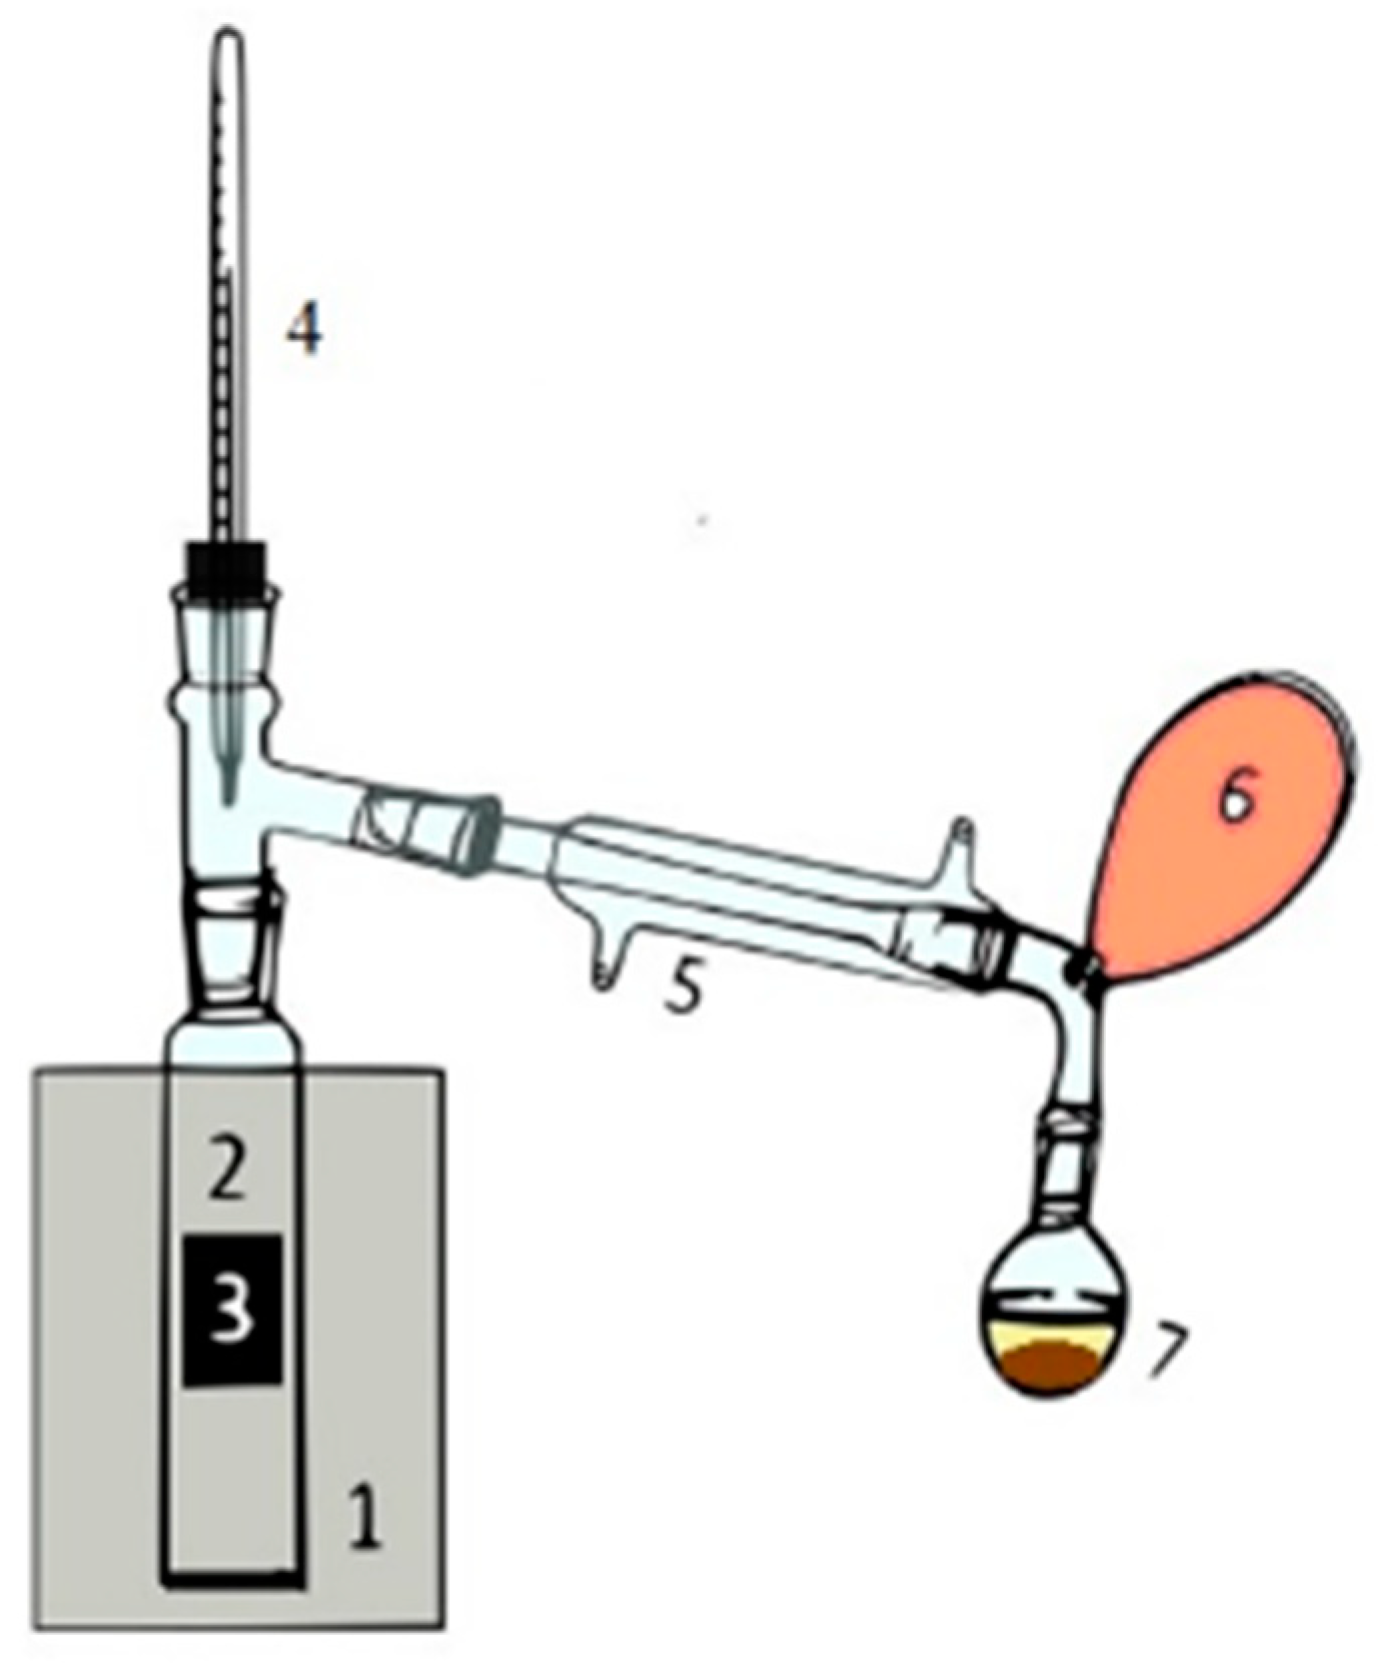
2.3. Pyrolysis Setup

The reactions were carried out following the scheme reported in Figure 1. The reaction system consists of a quartz tubular reactor (2 in Figure 1) charged with 5 g of KL (3) and collocated in an oven (1, Carbolite, MTF 10/25/130, Pocklington, UK). A nitrogen purge was needed to guarantee oxygen removal and to avoid a combustion reaction. Three temperatures, 350, 450, and 550 °C were investigated and kept for a reaction time of 3 h. The reactor was connected to a Liebig condenser (5) that allows the condensation of low boiling compounds. The liquid condensate (L) was recovered in a flask (7) while non-condensable gases (G) were collected in a latex balloon (6). The condensed liquid fraction shows two phases: an aqueous light phase observed on top and an organic heavy phase in the bottom part of the flask. At the reaction end, a solid was still present in the reactor as biochar, and it is referred to as a solid residue (SR). Data reproducibility was evaluated by running each experiment three times, allowing us to assess good data consistency.

2.4. Extraction Procedures

As stated above, the qualitative analysis of liquid fraction L was performed by means of L–L extractions. An amount of 1.0 mL of chloroform (CHCl3) was used to dissolve the L fraction and characterize it with GC-MS. Even though L is constituted by two separated phases, the aqueous fraction represents a negligible part of the total liquid. Moreover, the GC-MS analysis was performed only on the chloroform soluble fraction which was separated from the water phase by means of a centrifuge step. Two different liquid extractions were then performed on the chloroform-diluted L products: one with EtOH/H2O (1:1 v/v) and a second with alkaline H2O 0.1 M. Then, the extraction solution was agitated and centrifuged using a centrifuge set to 7500 rpm for 10 min. In both cases, the resulting solution separated into two phases: a heavy phase (HL) consisting of bio-oil diluted in chloroform and a lighter phase (LL) with the compounds extracted from the solutions. LL was then analyzed using FT-IR spectroscopy while HL was analyzed by means of GC-MS. In order to individuate all the species in the HL, all the relevant peaks of the resulting chromatogram were integrated manually.

2.5. Equipment and Characterization Procedures

Both KL and pyrolysis products (L, SR, G) were analyzed using Fourier transform infrared spectroscopy (FT-IR) by means of a Nicolet 380 instrument (Thermo Scientific, Madison, WA, USA). Reaction liquids were characterized by spreading a drop of sample on a KBr disk (disk weight 1000 g) of powdered KBr. The solid residue was analyzed using a pressed disk of KBr mixed with samples (1:100, w/w) while gaseous products were imposed to pass in an IR glass cell with KBr windows. For both liquid and gaseous products, additional analyses were performed in a gas chromatography–mass spectrometer (GC–MS) Focus-ISQ equipped with a single quadrupole detector (Thermo Scientific, Milan, Italy) using a TG-SQC column (15 m × 0.25 mm × 0.25 μm). Helium (>99.99) was used as a gas carrier (1 mL/min) and the injection temperature was set at 230 °C. The oven temperature changed according to the following conditions: 70 °C for 5 min, then the temperature was increased from 70 to 270 °C at 5 °C/min, from 270 °C to 320 °C at 25 °C/min, and finally left at 320 °C for 25 min. A quantitative analysis was carried out by injecting 100 μL of reaction gas into the GC-MS. For each test, four injections were performed in total, one every 45 min of reaction time, to monitor the changes in gas composition over the reaction time. The areas of the resulting peaks related to the individual species detected were normalized with the area of the total injection in order to quantify the relative amount of the different species in the sampled gas.
Reaction liquids and extraction bio-oils were analyzed with an analogous procedure, diluting the liquid sample with 1 mL of CHCl3 up to a ratio of 1:10 (v/v). A Scanning Electron Microscope (SEM) was used to investigate the commercial Kraft lignin and biochar residues morphology.

3. Results and Discussions

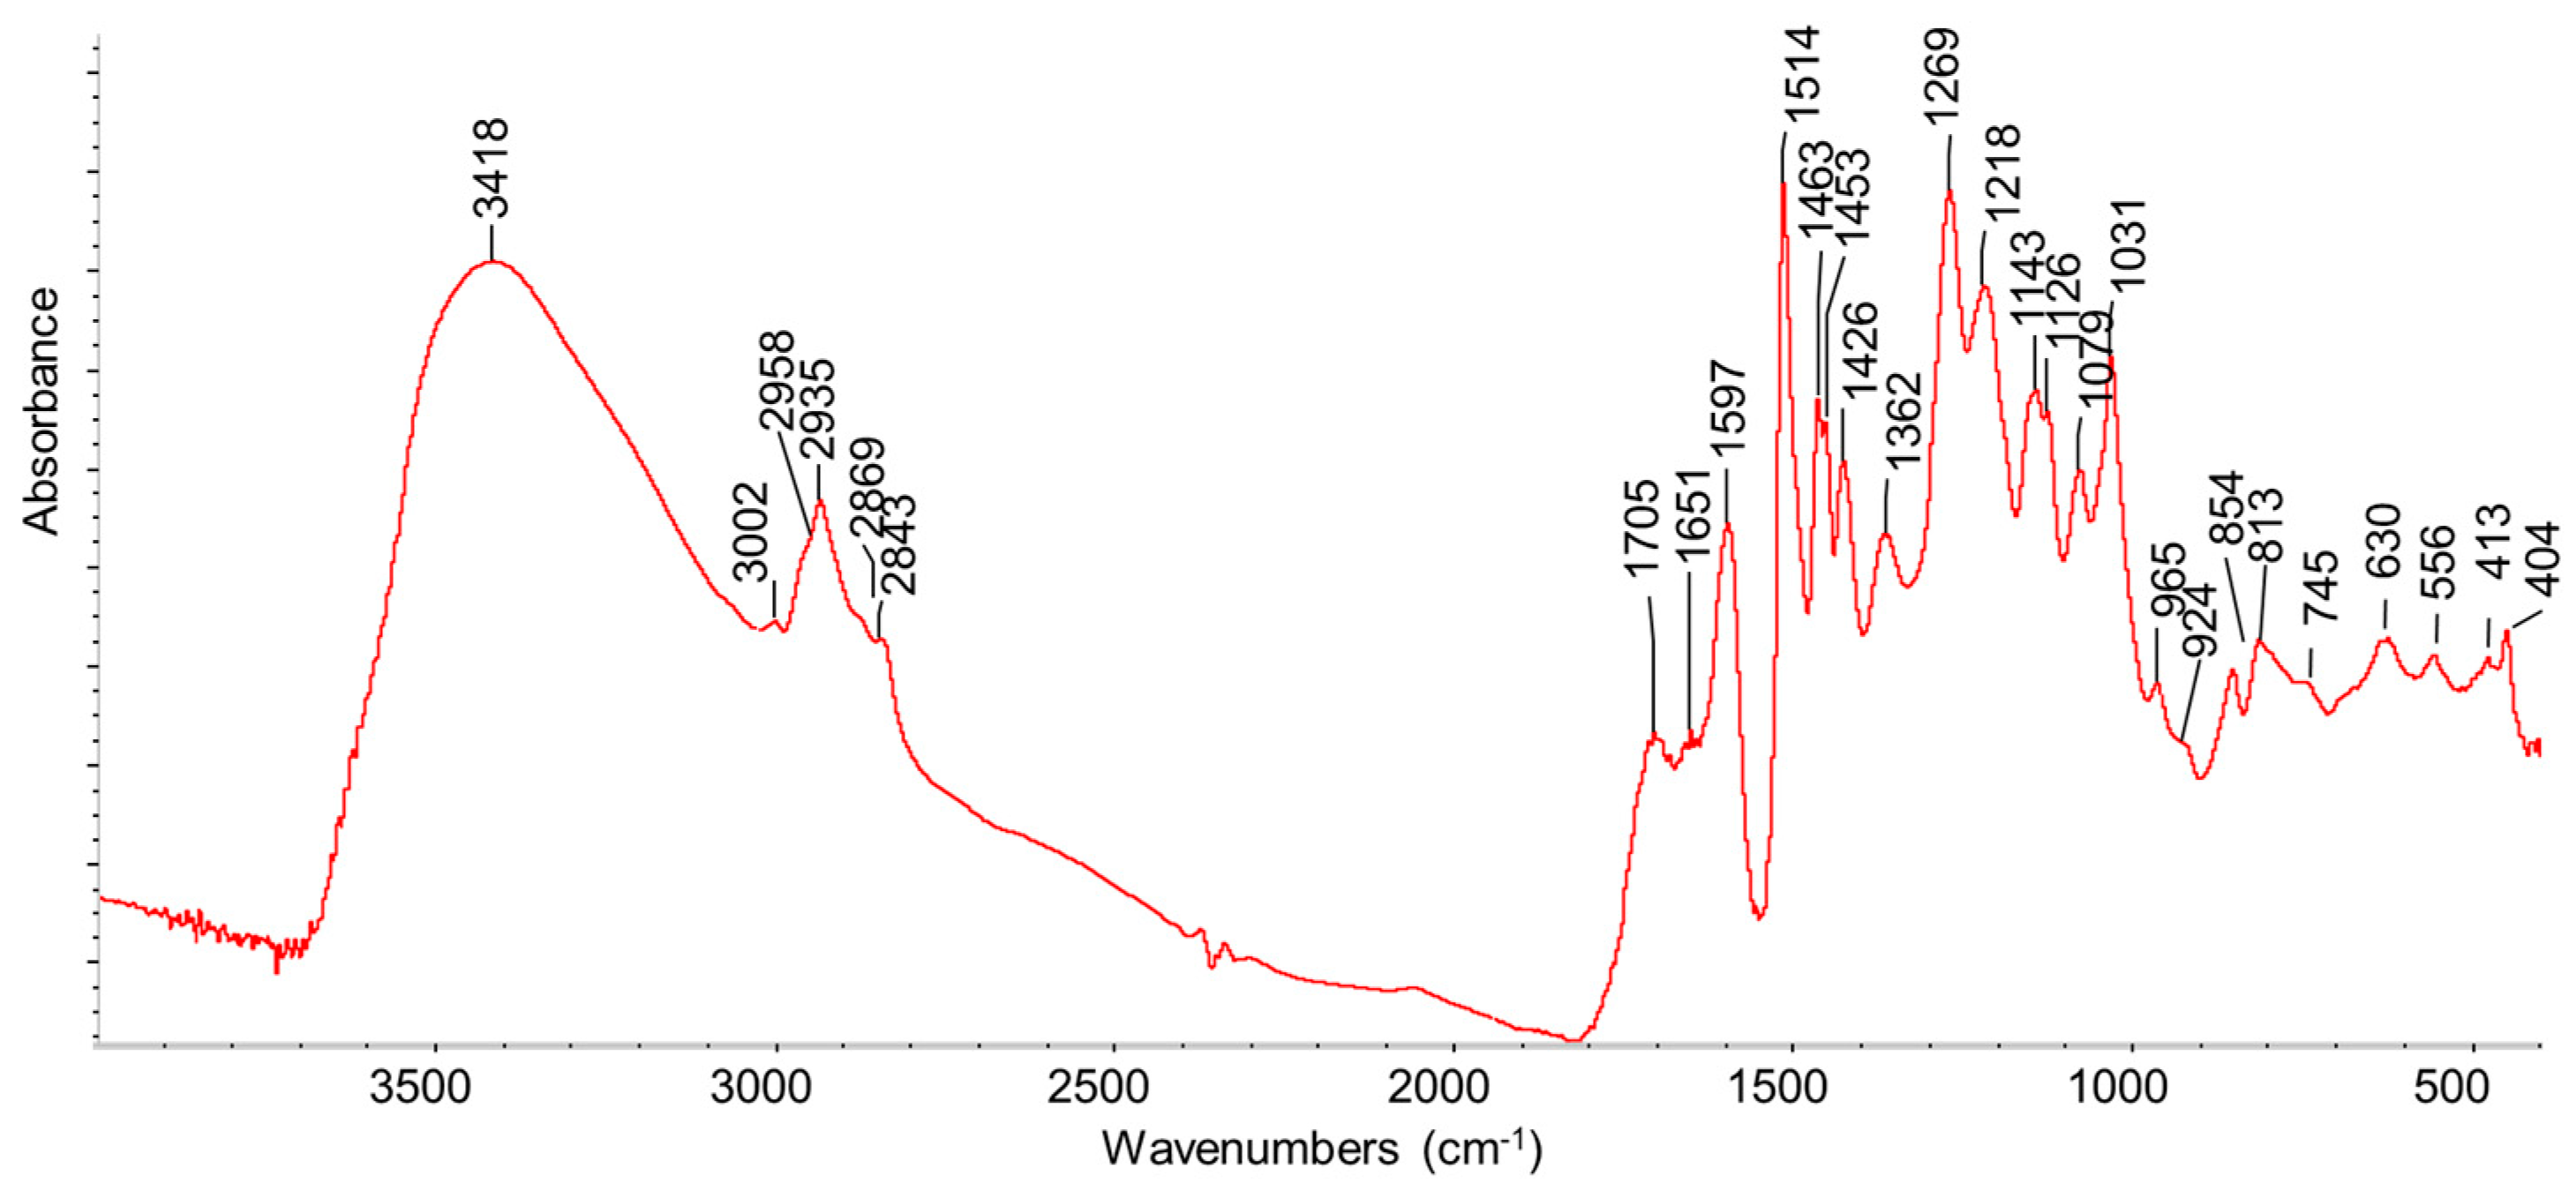
3.1. Characterization of Fresh Lignin

The fresh lignin was characterized by measuring its ash content (~1 wt.%) and humidity content (~3 wt.%). An SEM analysis at low magnification (Figure 2) shows the presence of particles/aggregates whose maximum size is around 20 μm or less. Simultaneously realized EDX analysis is reported in Table 1. It must be remembered that this analysis does not detect hydrogen. The measured O/C ratio is 0.47. The EDX analyses are in rough agreement with the elemental analyses reported for Kraft lignin samples [25,26]. In particular, the EDX elemental analysis revealed the presence of sulfur and of sodium, in accordance with Latham et al. [27], which is related to lignin pretreatment with white liquor, a solution of NaOH and Na2S, performed to isolate lignin from the other components of wood in the Kraft process [27].
The FT-IR spectrum of KL is shown in Figure 3. The strong band centered at 3418 cm−1 is due to the OH stretchings of phenolic and alcoholic (polysaccharidic) groups together with water. Aromatic and aliphatic CHx stretching bands are evident in the region of 3100–2800 cm−1. The band at 1705 cm−1, with a shoulder around 1740 cm−1, is due to the C=O stretchings of carbonyl and carboxyl (ester) groups. The stretchings of C-C bonds in aromatic rings can be related to the peaks at 1597, 1513, 1453, and 1426 cm−1, while the peak at 1463 cm−1 is likely mainly due to CH2 deformation (scissoring) modes. In this region, OH deformation modes of cellulosic units are also present. The peak at 1362 cm−1 is usually assigned to phenolic OH in-plane deformation modes, while the many peaks in the range of 1300–1000 cm−1 are due to C-C and C-O coupled stretchings in different structural units. The region below 1000 cm−1 is mainly associated with out-of-plane CH and OH bonds. The spectrum is fully consistent with those reported for Kraft lignin by different authors [28,29,30].

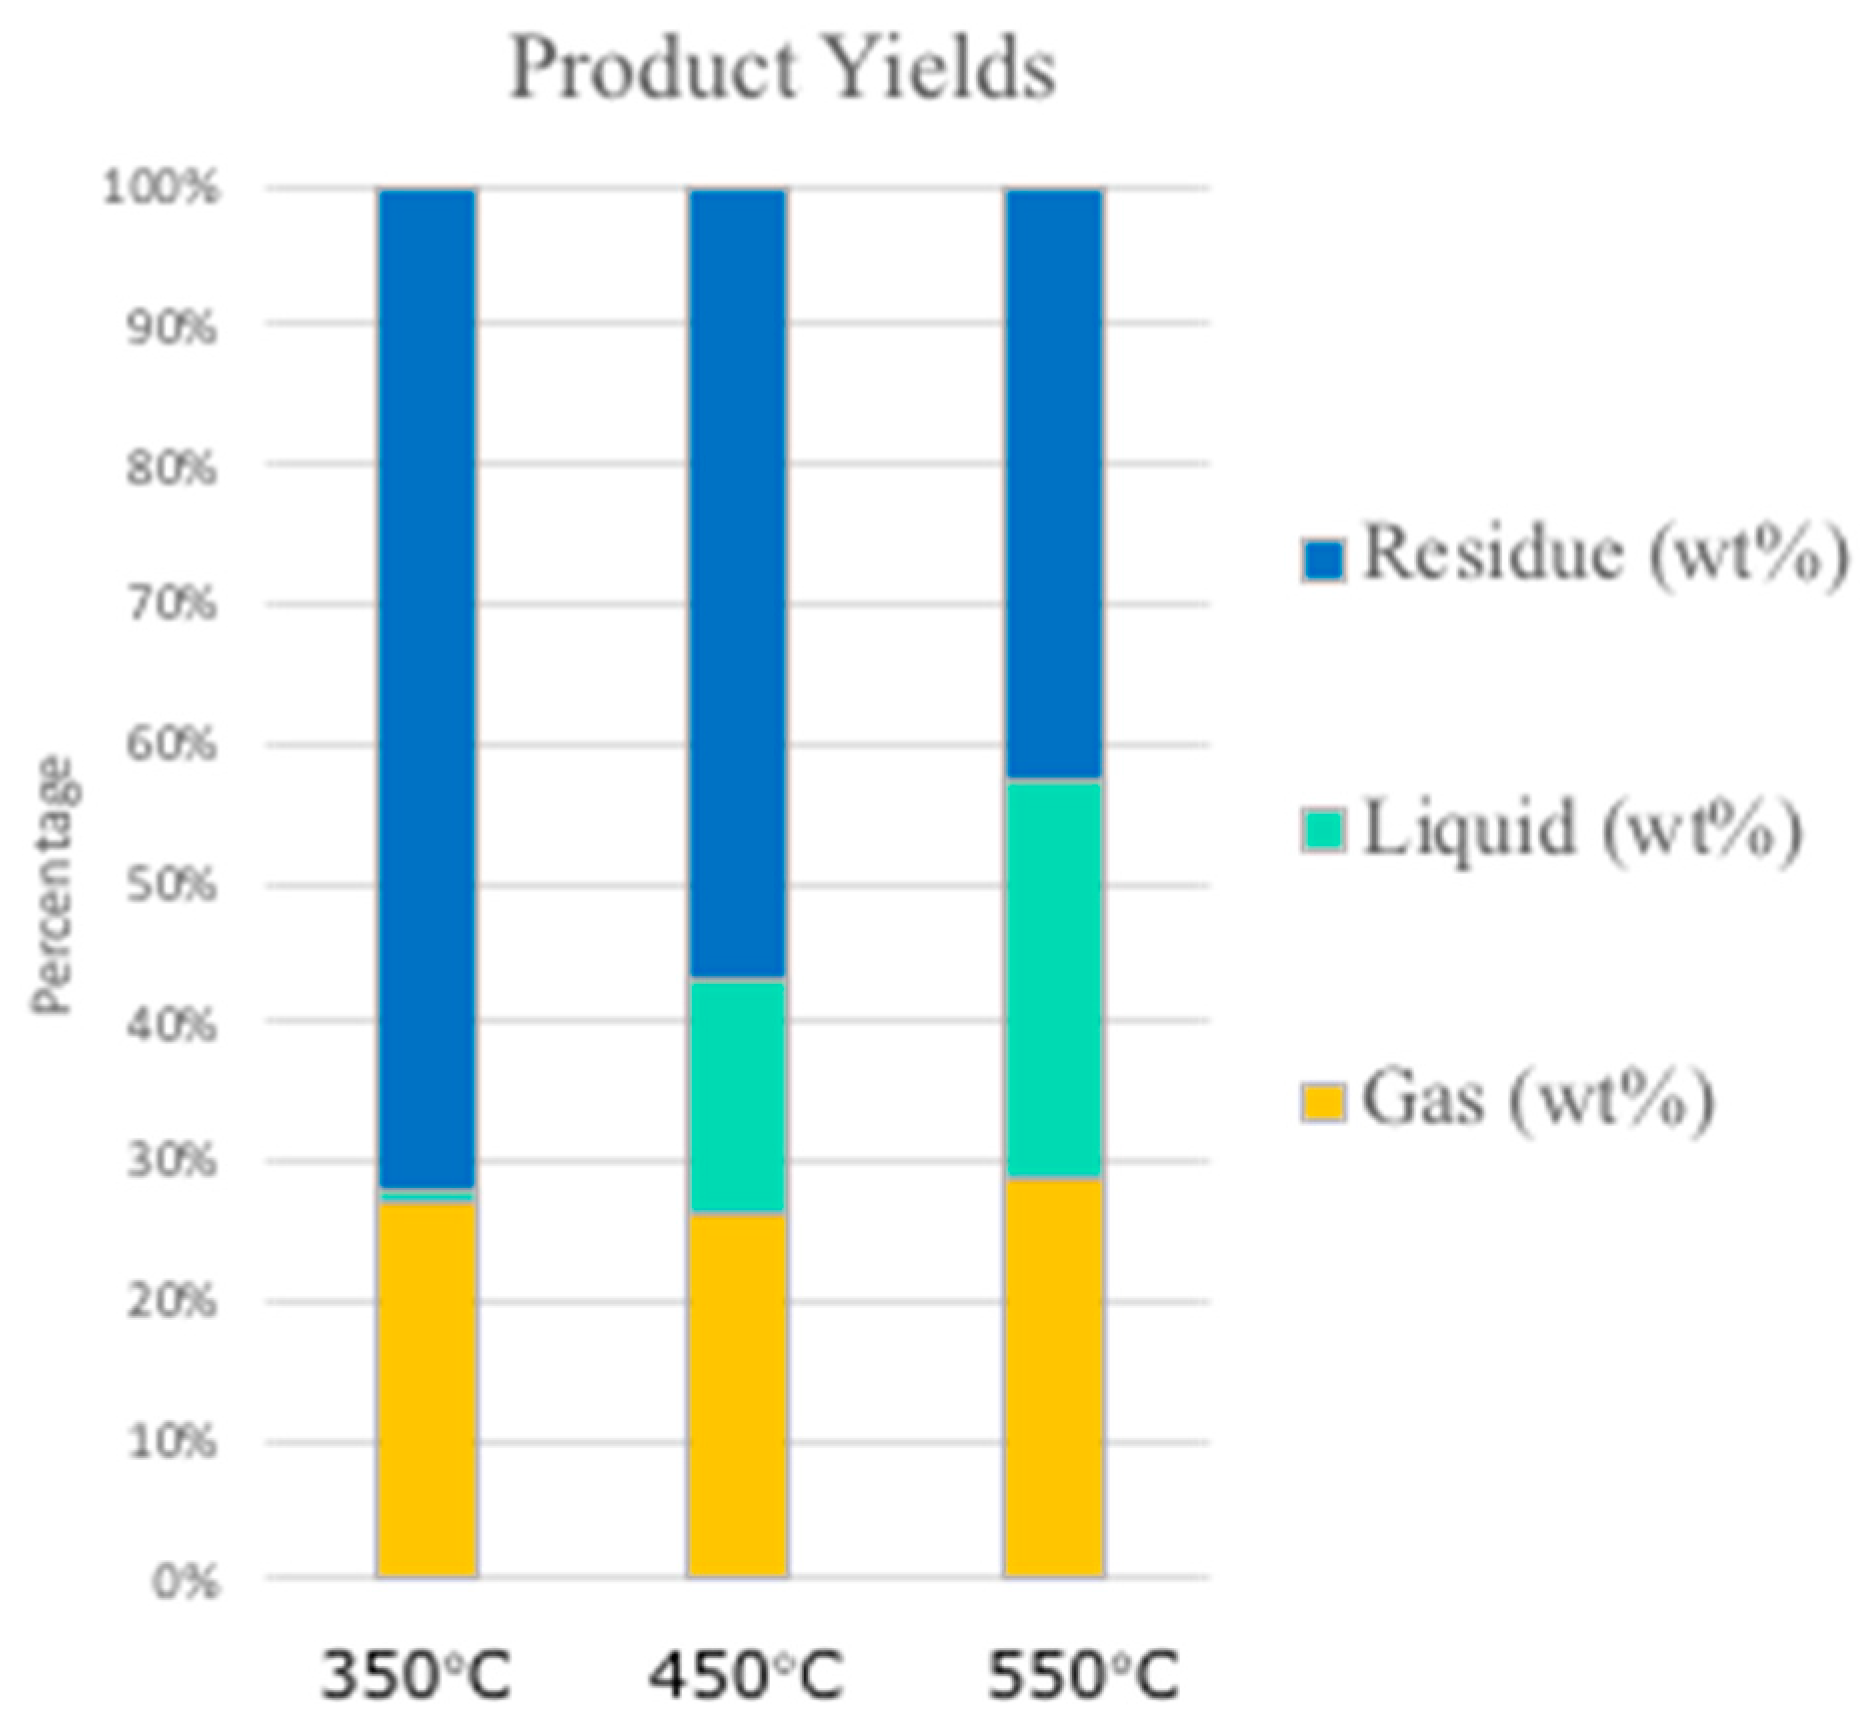
3.2. Effect of Reaction Temperature on Product Distribution

The effect of reaction temperature on product distribution is shown in Figure 4. The yields were evaluated via gravimetric measurements on liquid and biochar after the reaction. The amount of gas has instead been calculated from mass balance. The amount of solid residue (SR) tends to decrease with increasing reaction temperature. Indeed, the SR at 350 °C is 72 wt.% while at 550 °C it is lowered to 42.7 wt.%. The gas production (G) remains almost constant during all the tests with a slight increase at high temperatures. Interestingly, the amount of liquid (L) is strongly affected by the reaction temperature. At 350 °C the L production is negligible while the highest yield is obtained at 550 °C, where it reaches 28.7 wt.%. Indeed, product yields in biomass pyrolysis are strongly affected by both feedstock characteristics and reaction conditions, and, for this reason, different values can be found in the literature. Setter et al. [31], for example, studied the influence of different percentages of Kraft lignin on the bio-oil obtained from sugarcane bagasse pyrolysis, resulting in a maximum yield of bio-oil between 400 and 550 °C and a decreasing trend in biochar production with an increase in the temperature, in agreement with our data.

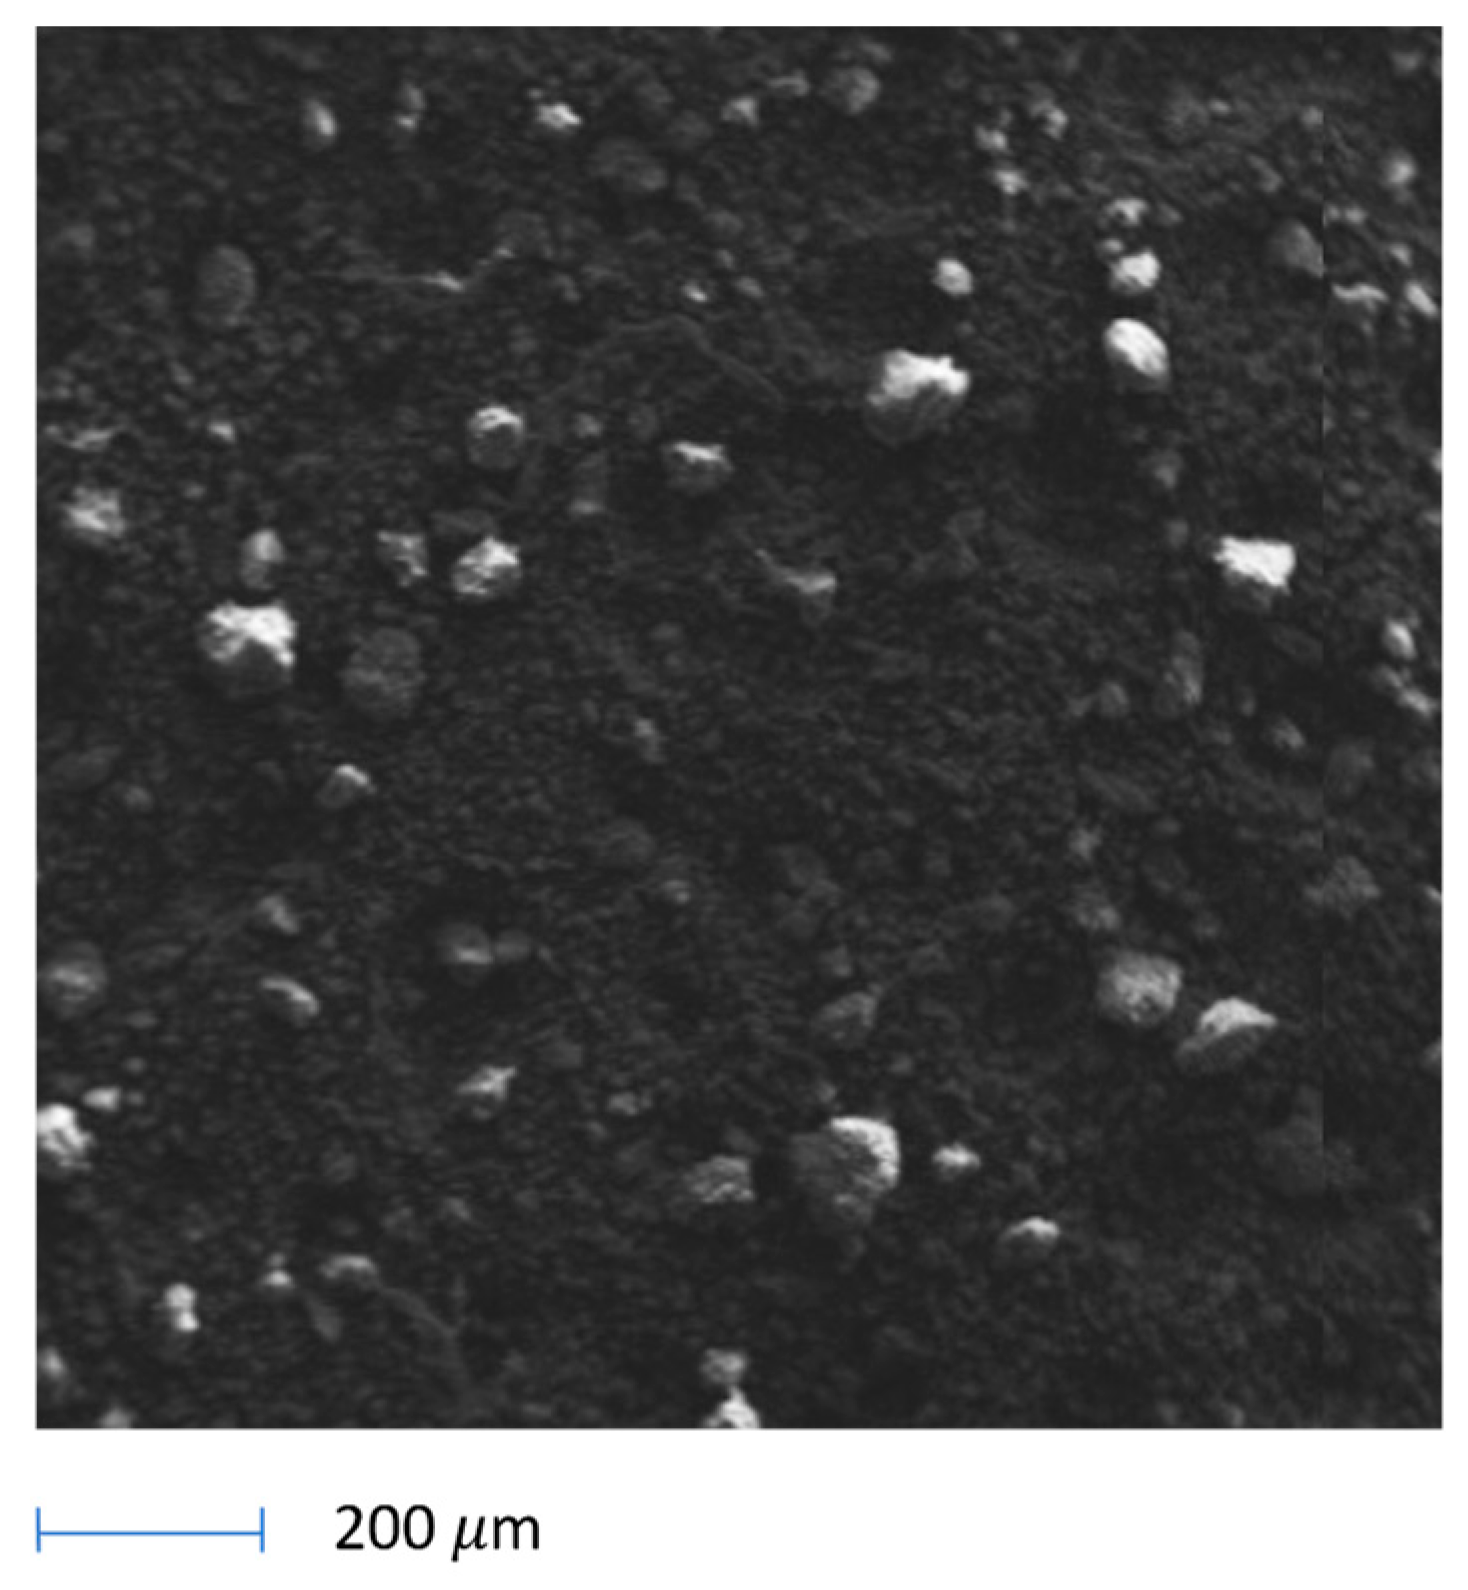
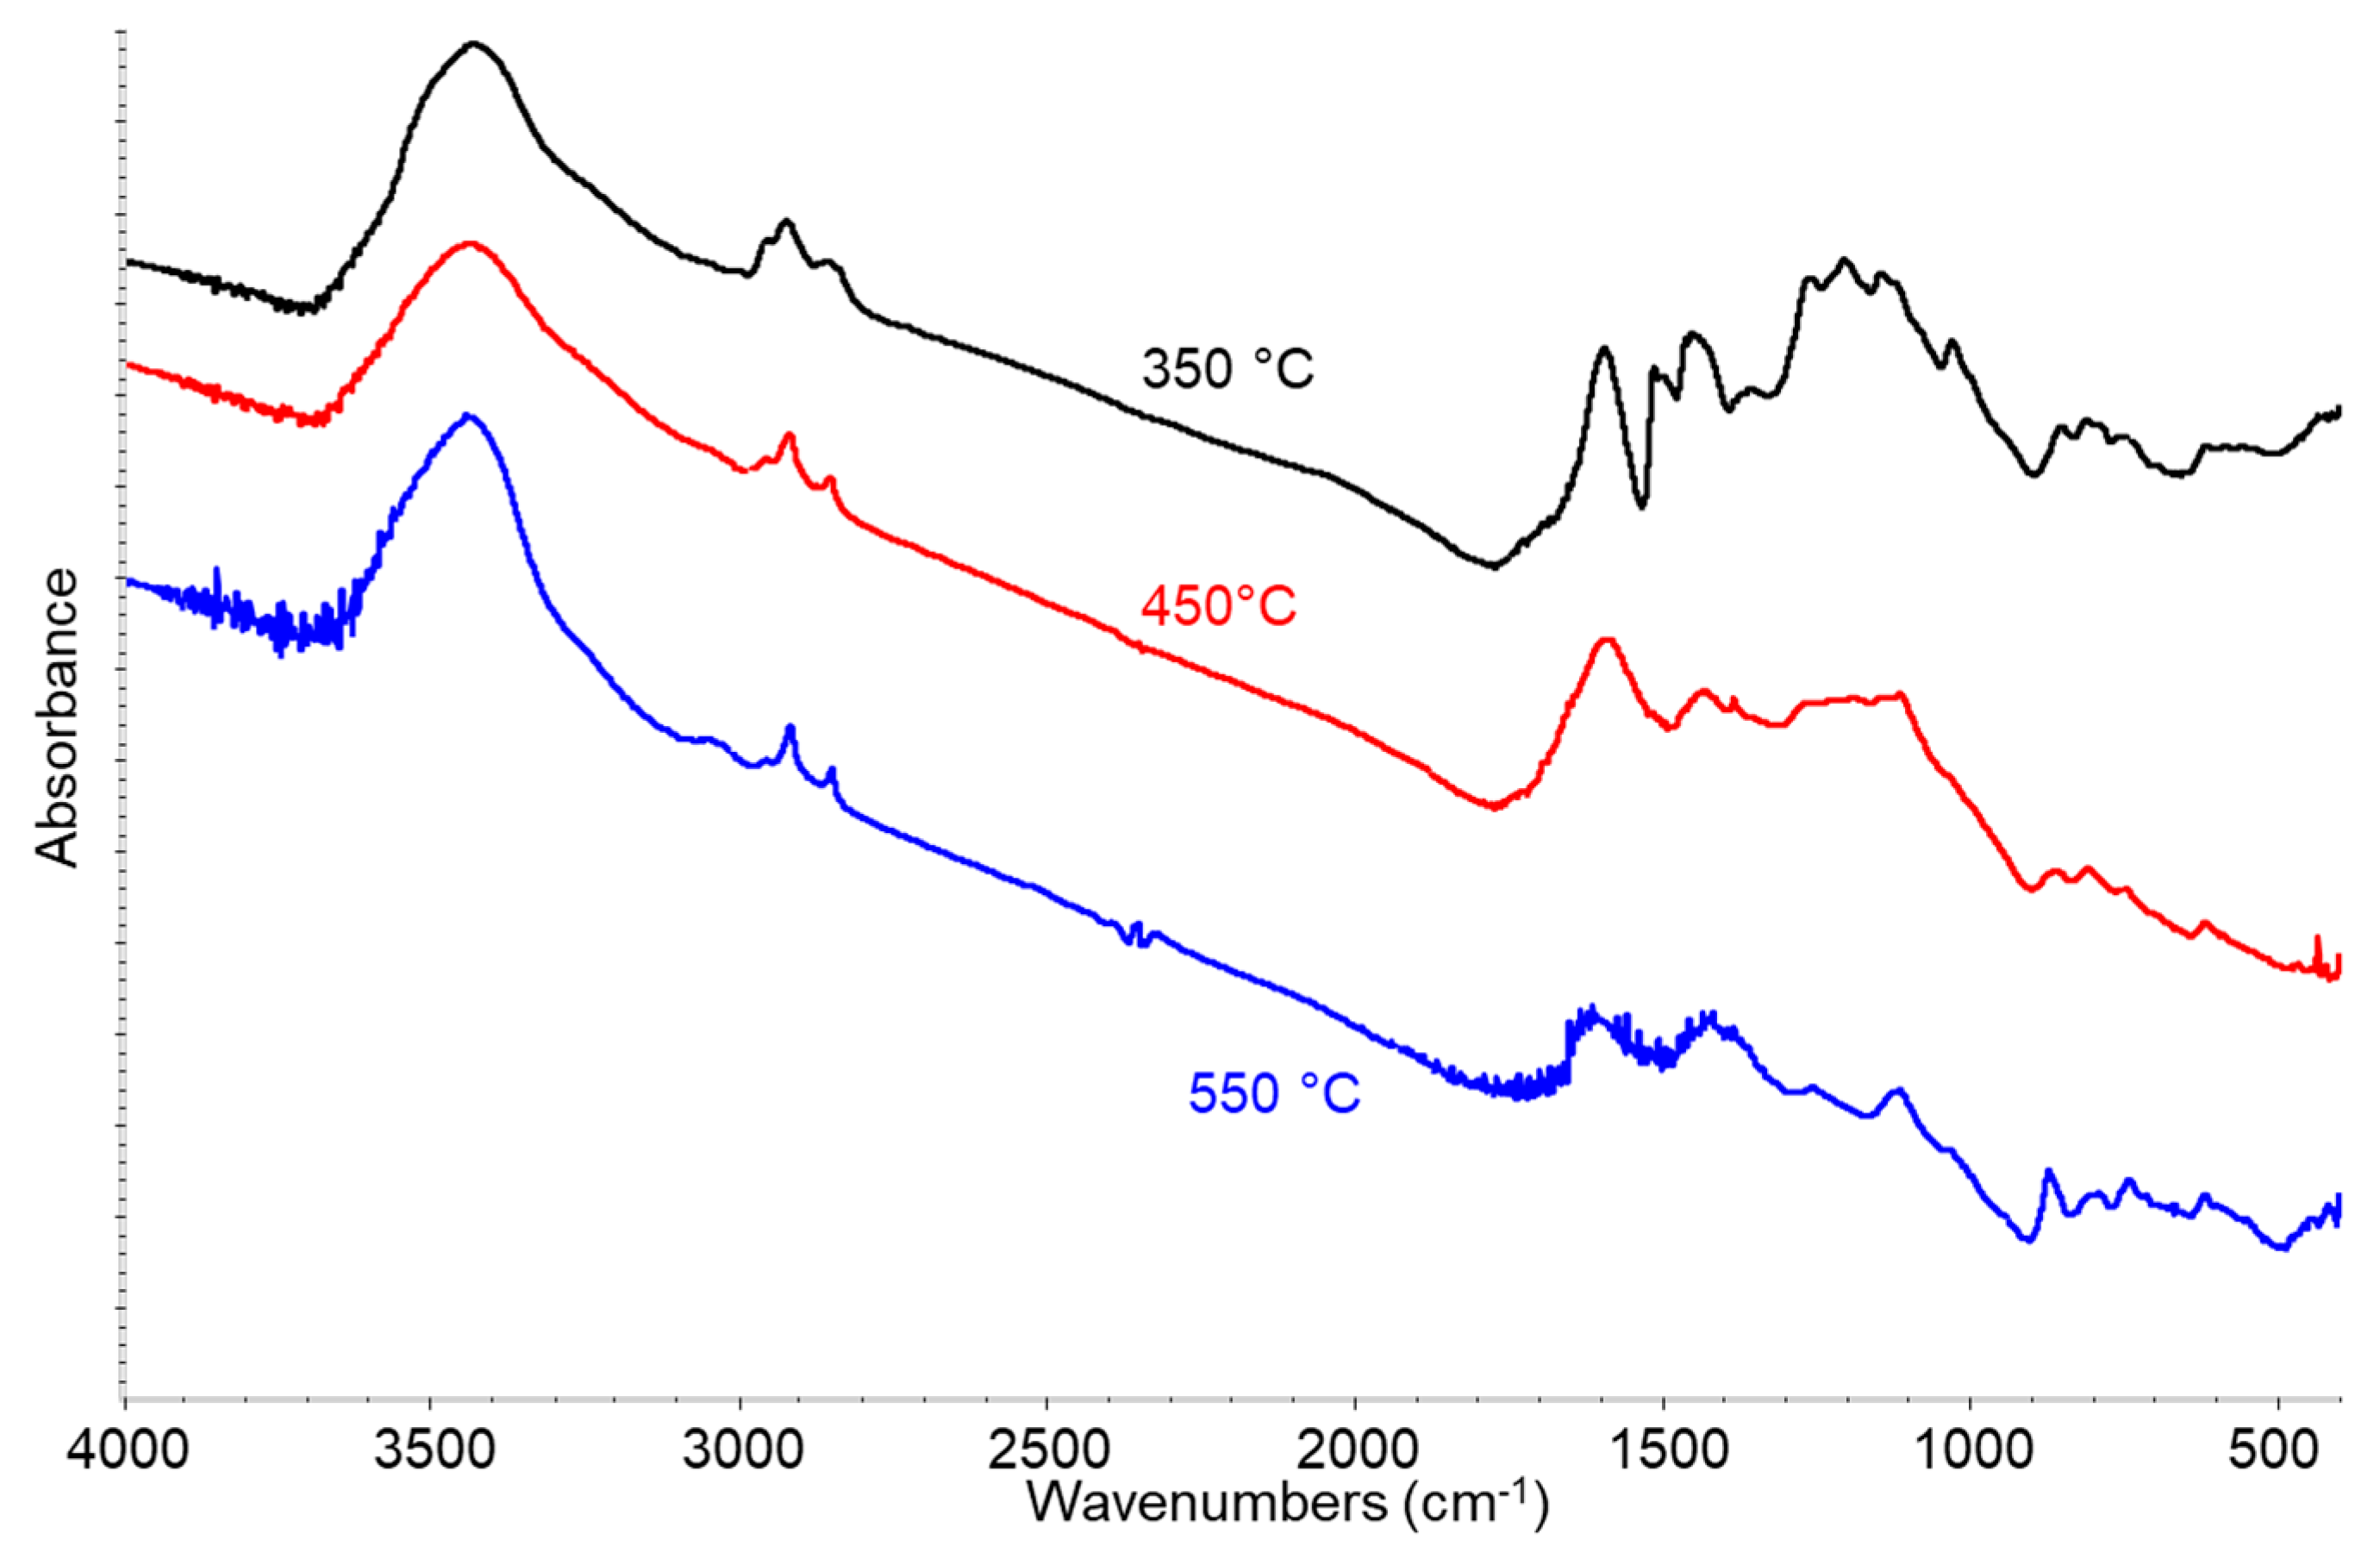
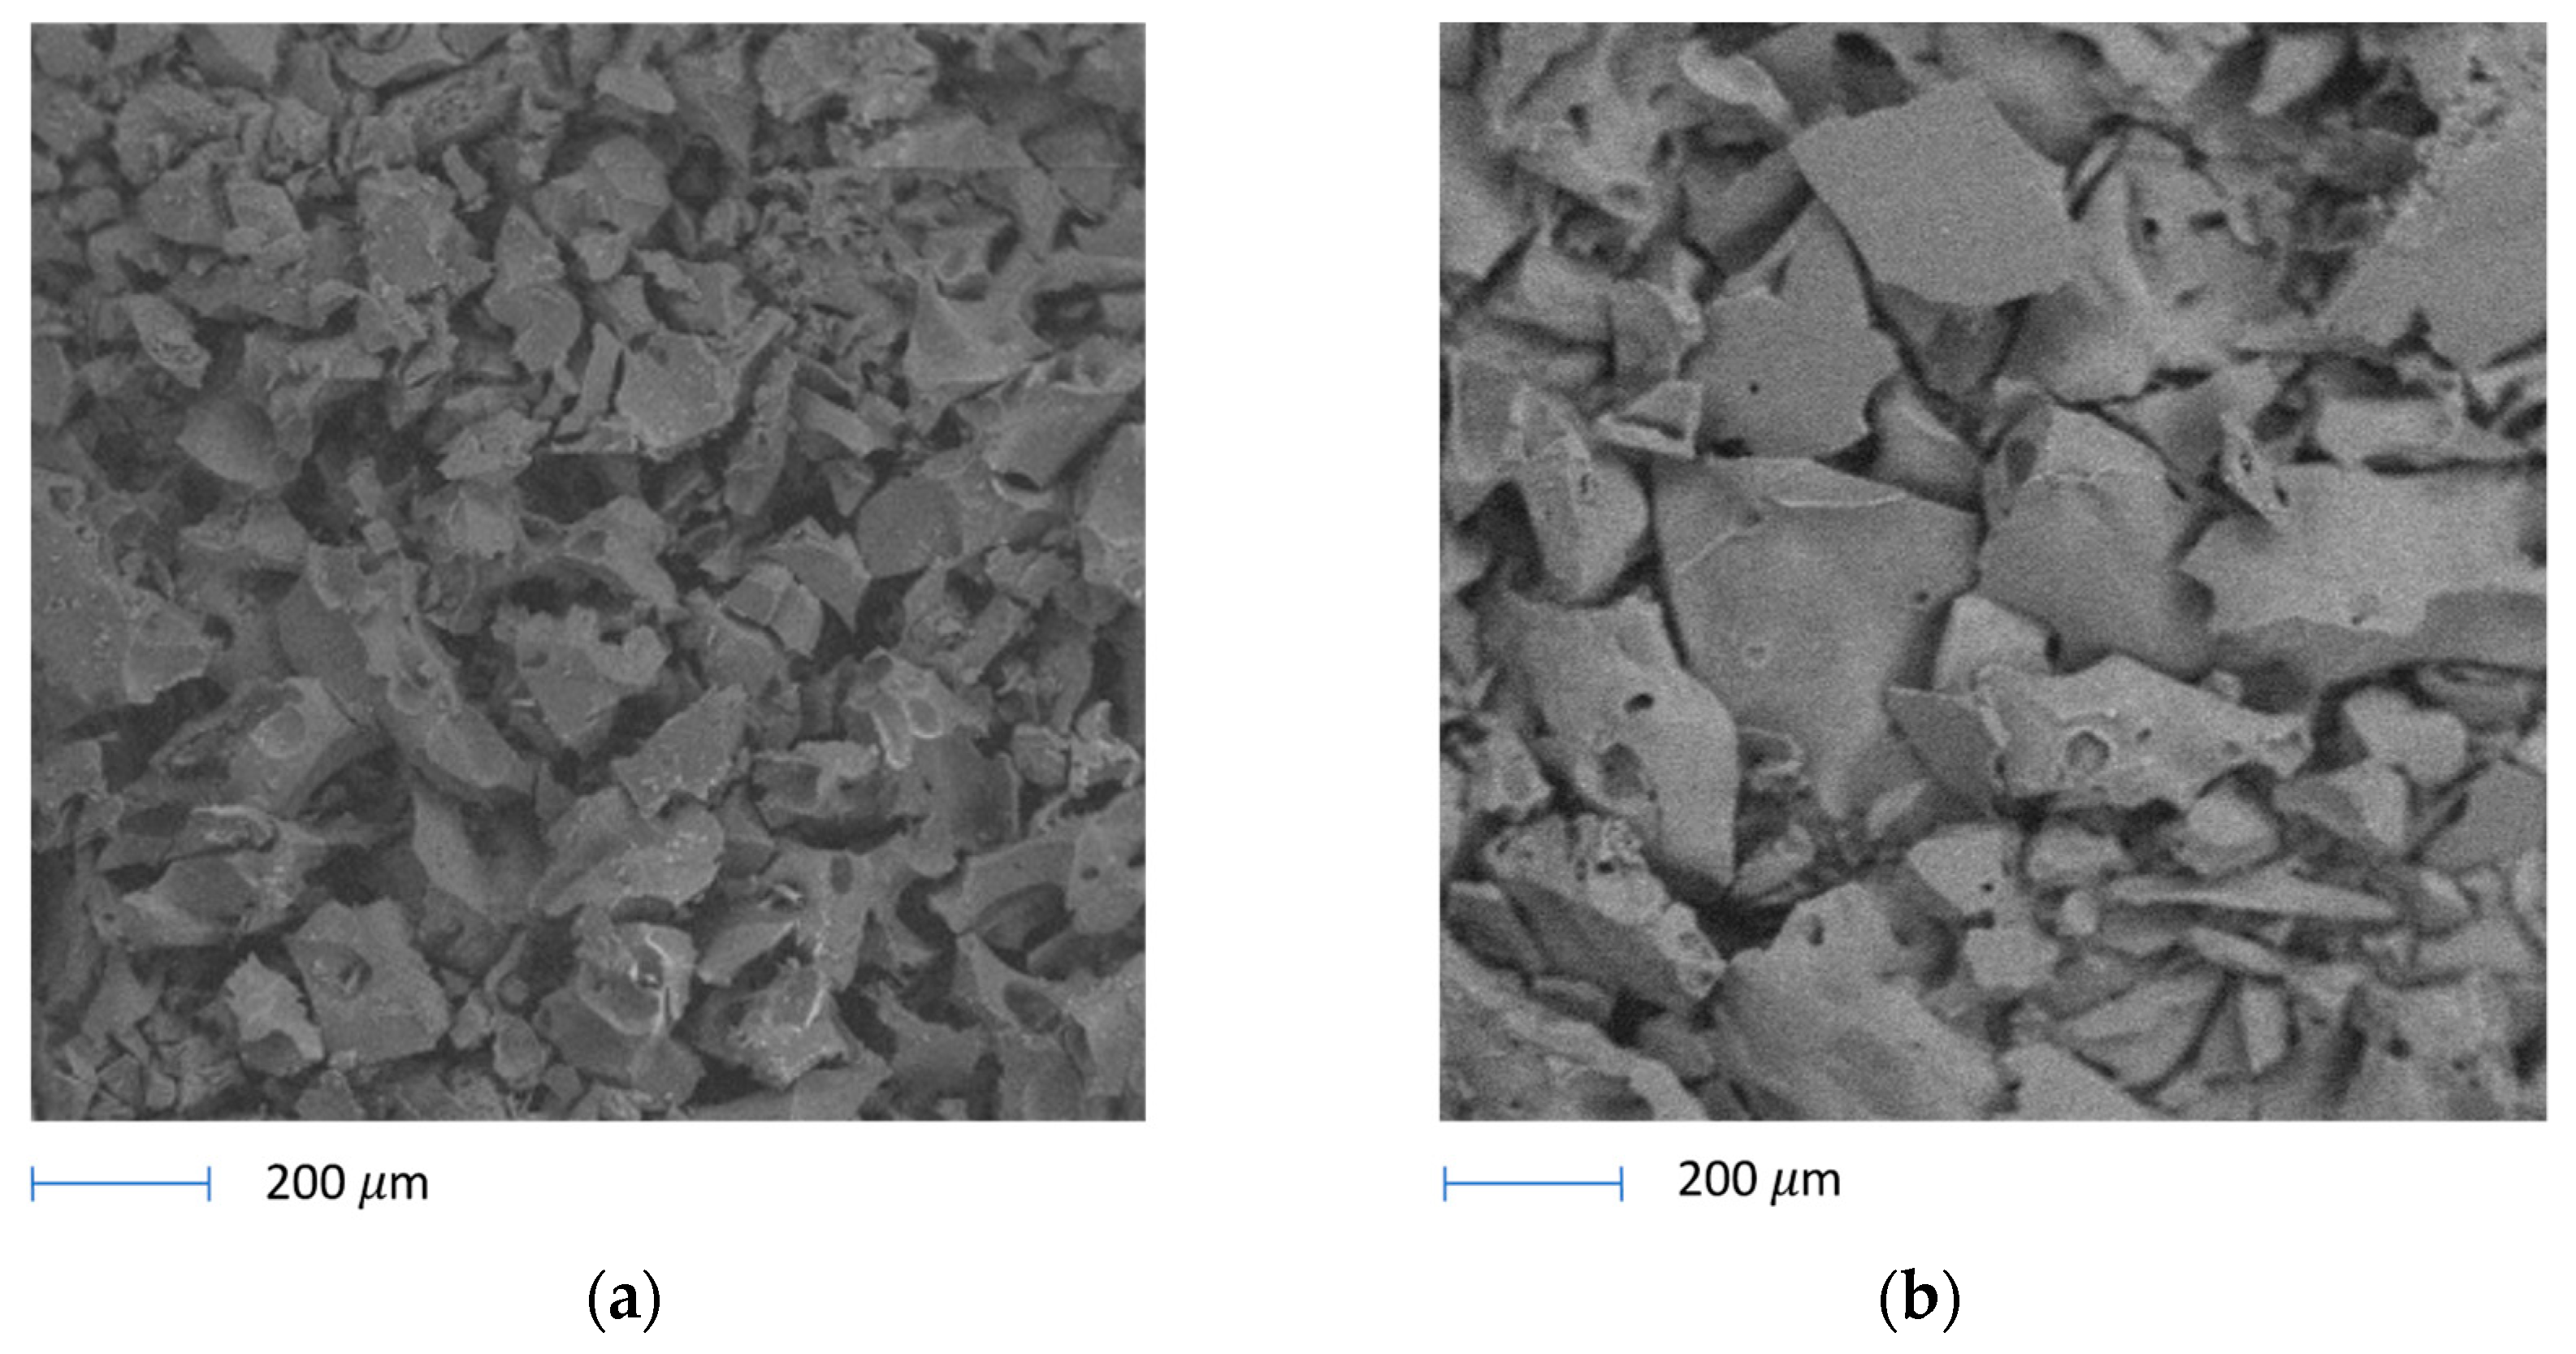
3.3. Solid Residue (Biochar) Characterization

The solid residue (SR) that remains at the bottom of the reactor after the pyrolysis reaction is usually denoted as biochar. In general, it is essentially a carbon residue, and when it has high porosity, it may have interesting applications as an activated carbon [32,33]. In our case, SEM images (Figure 5) show that in the case of the sample treated at 300 °C the observed particles or aggregates had already grown significantly in size with respect to the original lignin particles, up to a predominant size of around 0.2 mm. Further heat treatments gave rise to further increases, at least of part of particles/aggregates, up to >0.5 mm. The elemental analysis data (EDX) of SRs are reported in Table 1 and compared with data for fresh lignin. The carbon content increases with increasing pyrolysis temperature, starting from 67 wt.% in fresh lignin up to 89.76 wt.% in the sample obtained at 550 °C. Na wt% content in the solid grows with pyrolysis temperature, showing that it does not participate in volatile or liquid products. The behavior of sulfur is more complex, showing that it decreases significantly at low pyrolysis temperatures, while its wt% increases at the highest temperatures. This indicates that sulfur is in part released in the form of volatile or liquid compounds at low temperatures, while it in part forms non-volatile compounds still strongly bonded to biochar at higher temperatures. The amount of oxygen exhibits a percentage drop which can be attributed to the formation of highly oxygenated gases and vapors which are in part collected as bio-oil after their cooling in the condenser.
The FT-IR spectra of the samples produced at the different pyrolysis temperatures (Figure 6) show a relatively high absorption baseline and, together with absorptions of some water (3445 and 1614 cm1), a few weak bands in the C-H stretching region (3100–2800 cm1) as well as in the region below 1700 cm1, where CH deformations and the stretching of double and single CC and CO bonds fall. Interestingly, the absorption in the region of C=O double bond stretchings appears to be fully disappeared. This spectrum is typical of highly carbonaceous solids, with few residual functional groups. The comparison of this spectrum with that of the starting lignin sample shows that lignin is largely decomposed and carbonized, in agreement with the EDX data. However, it is possible that carbonized matter, which strongly absorbs the IR radiation, masks the permanence of the features of still incompletely converted lignin.

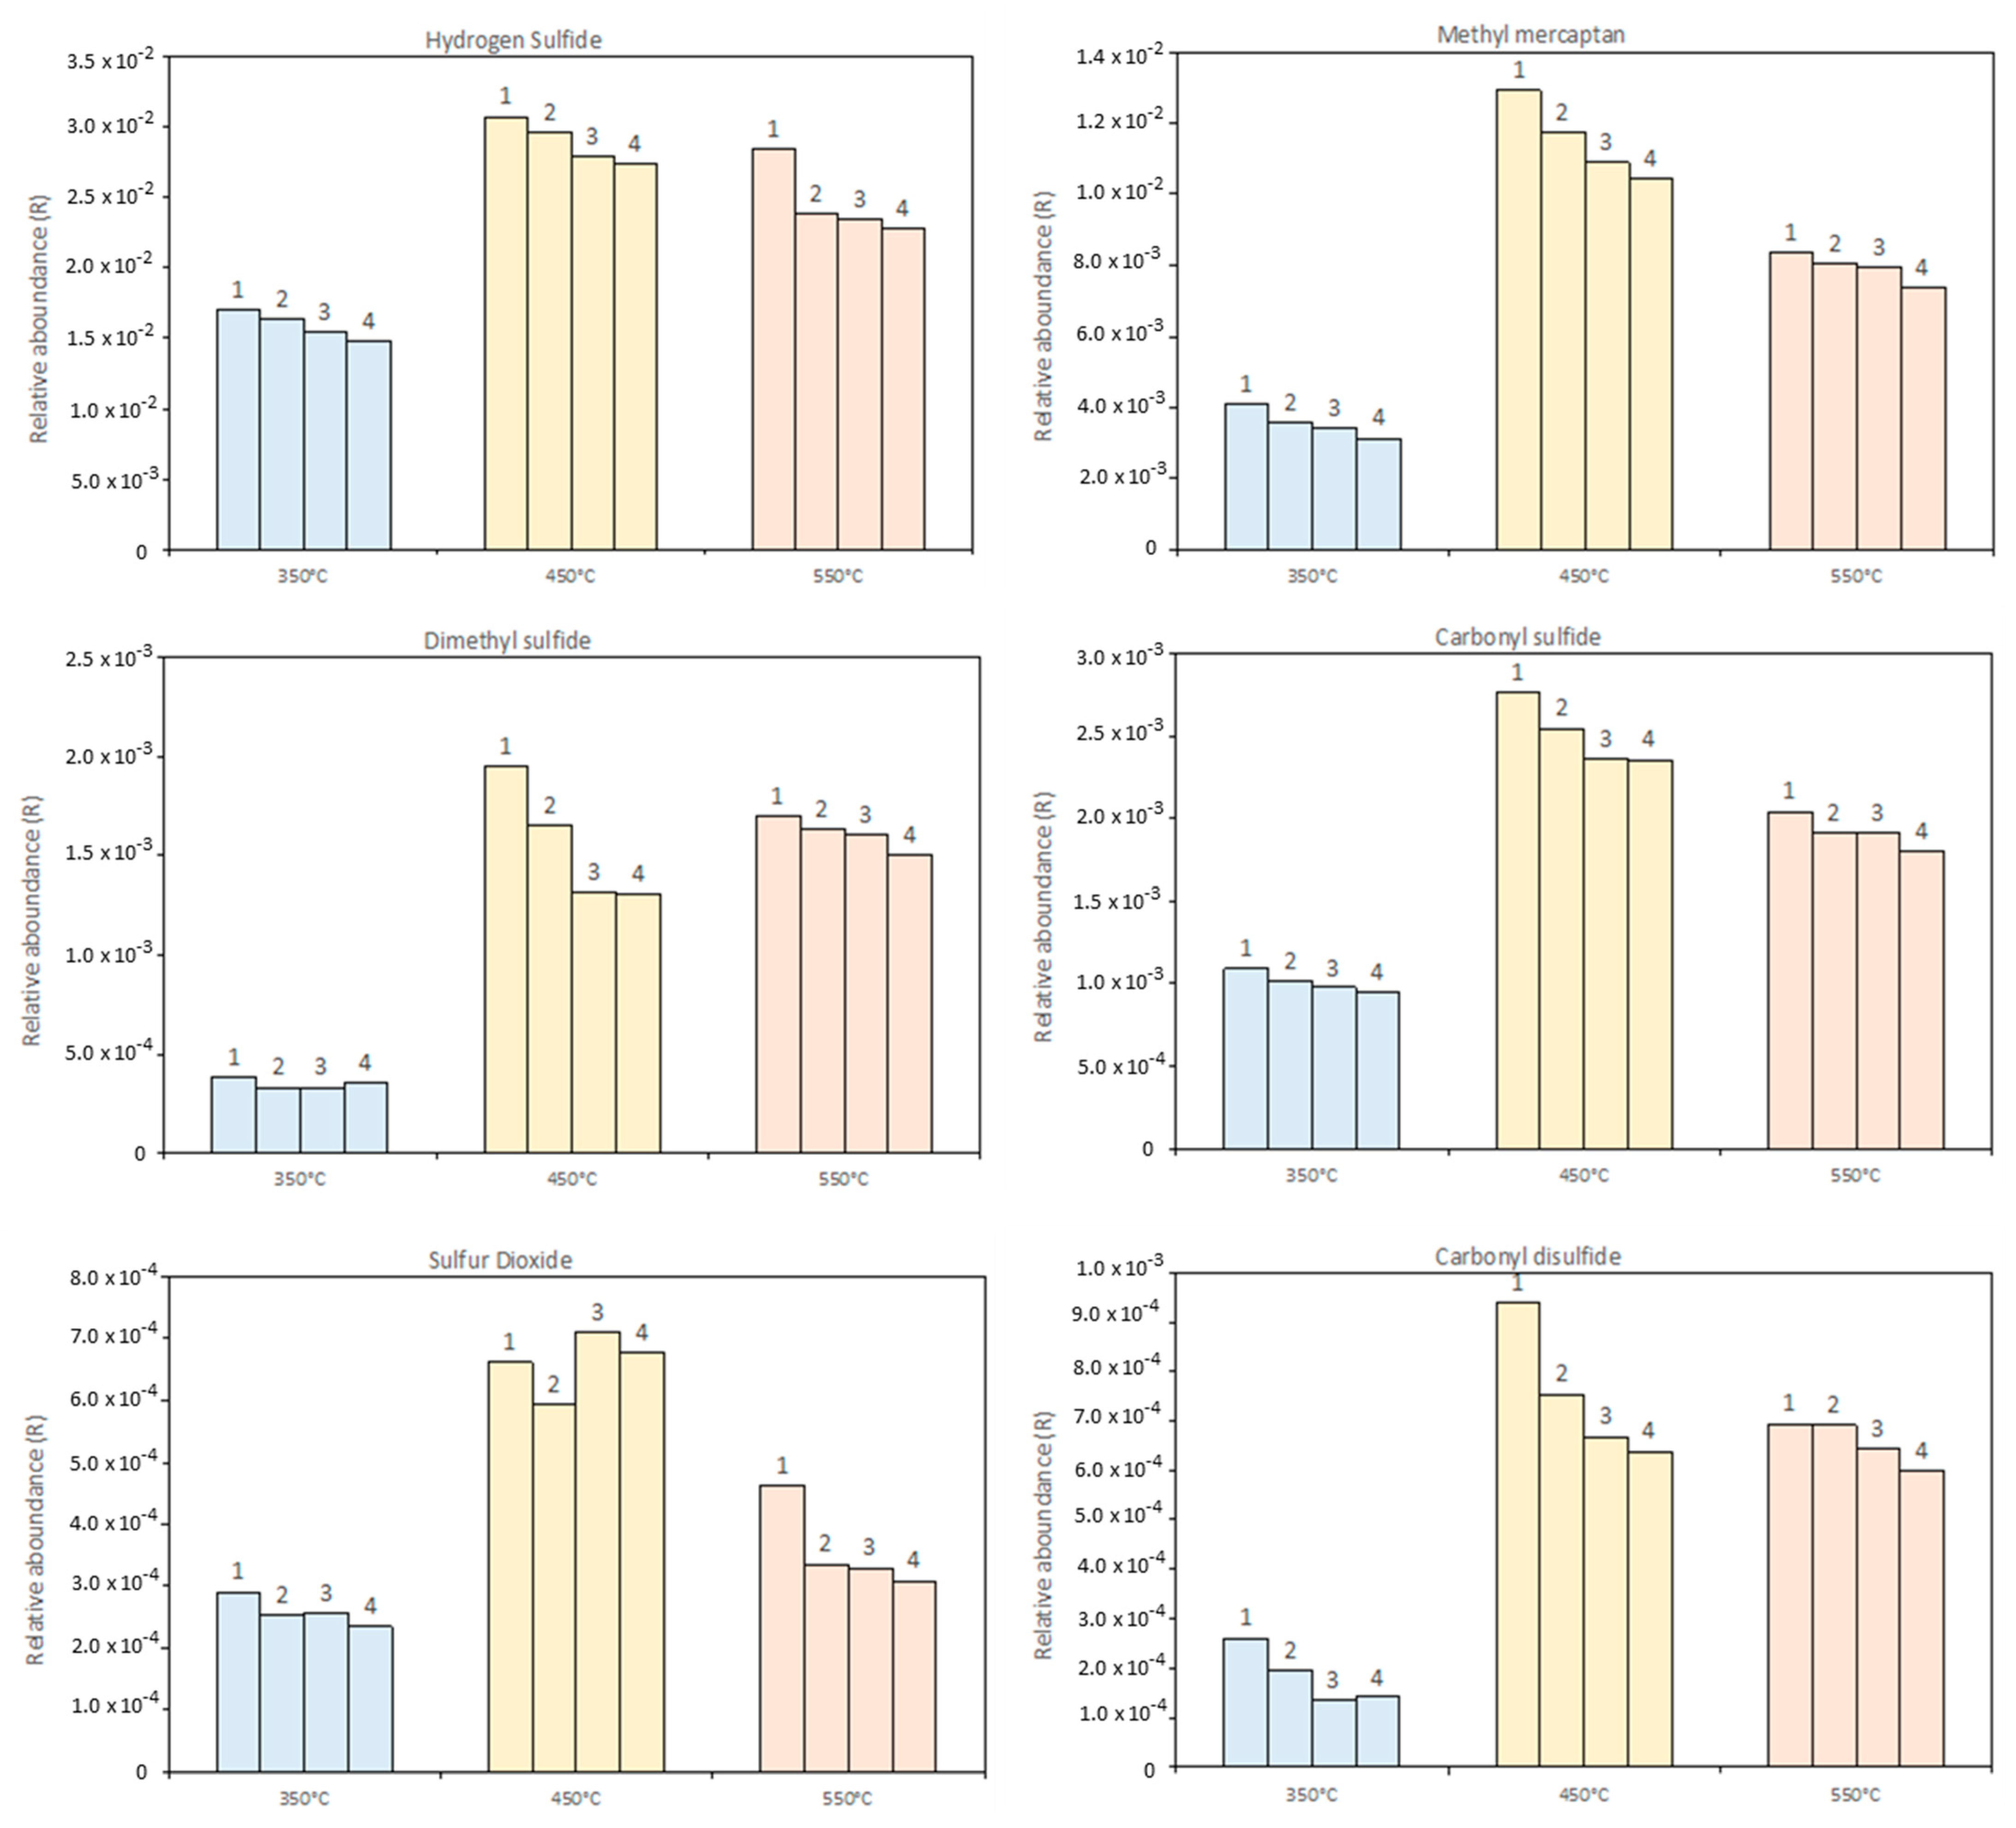
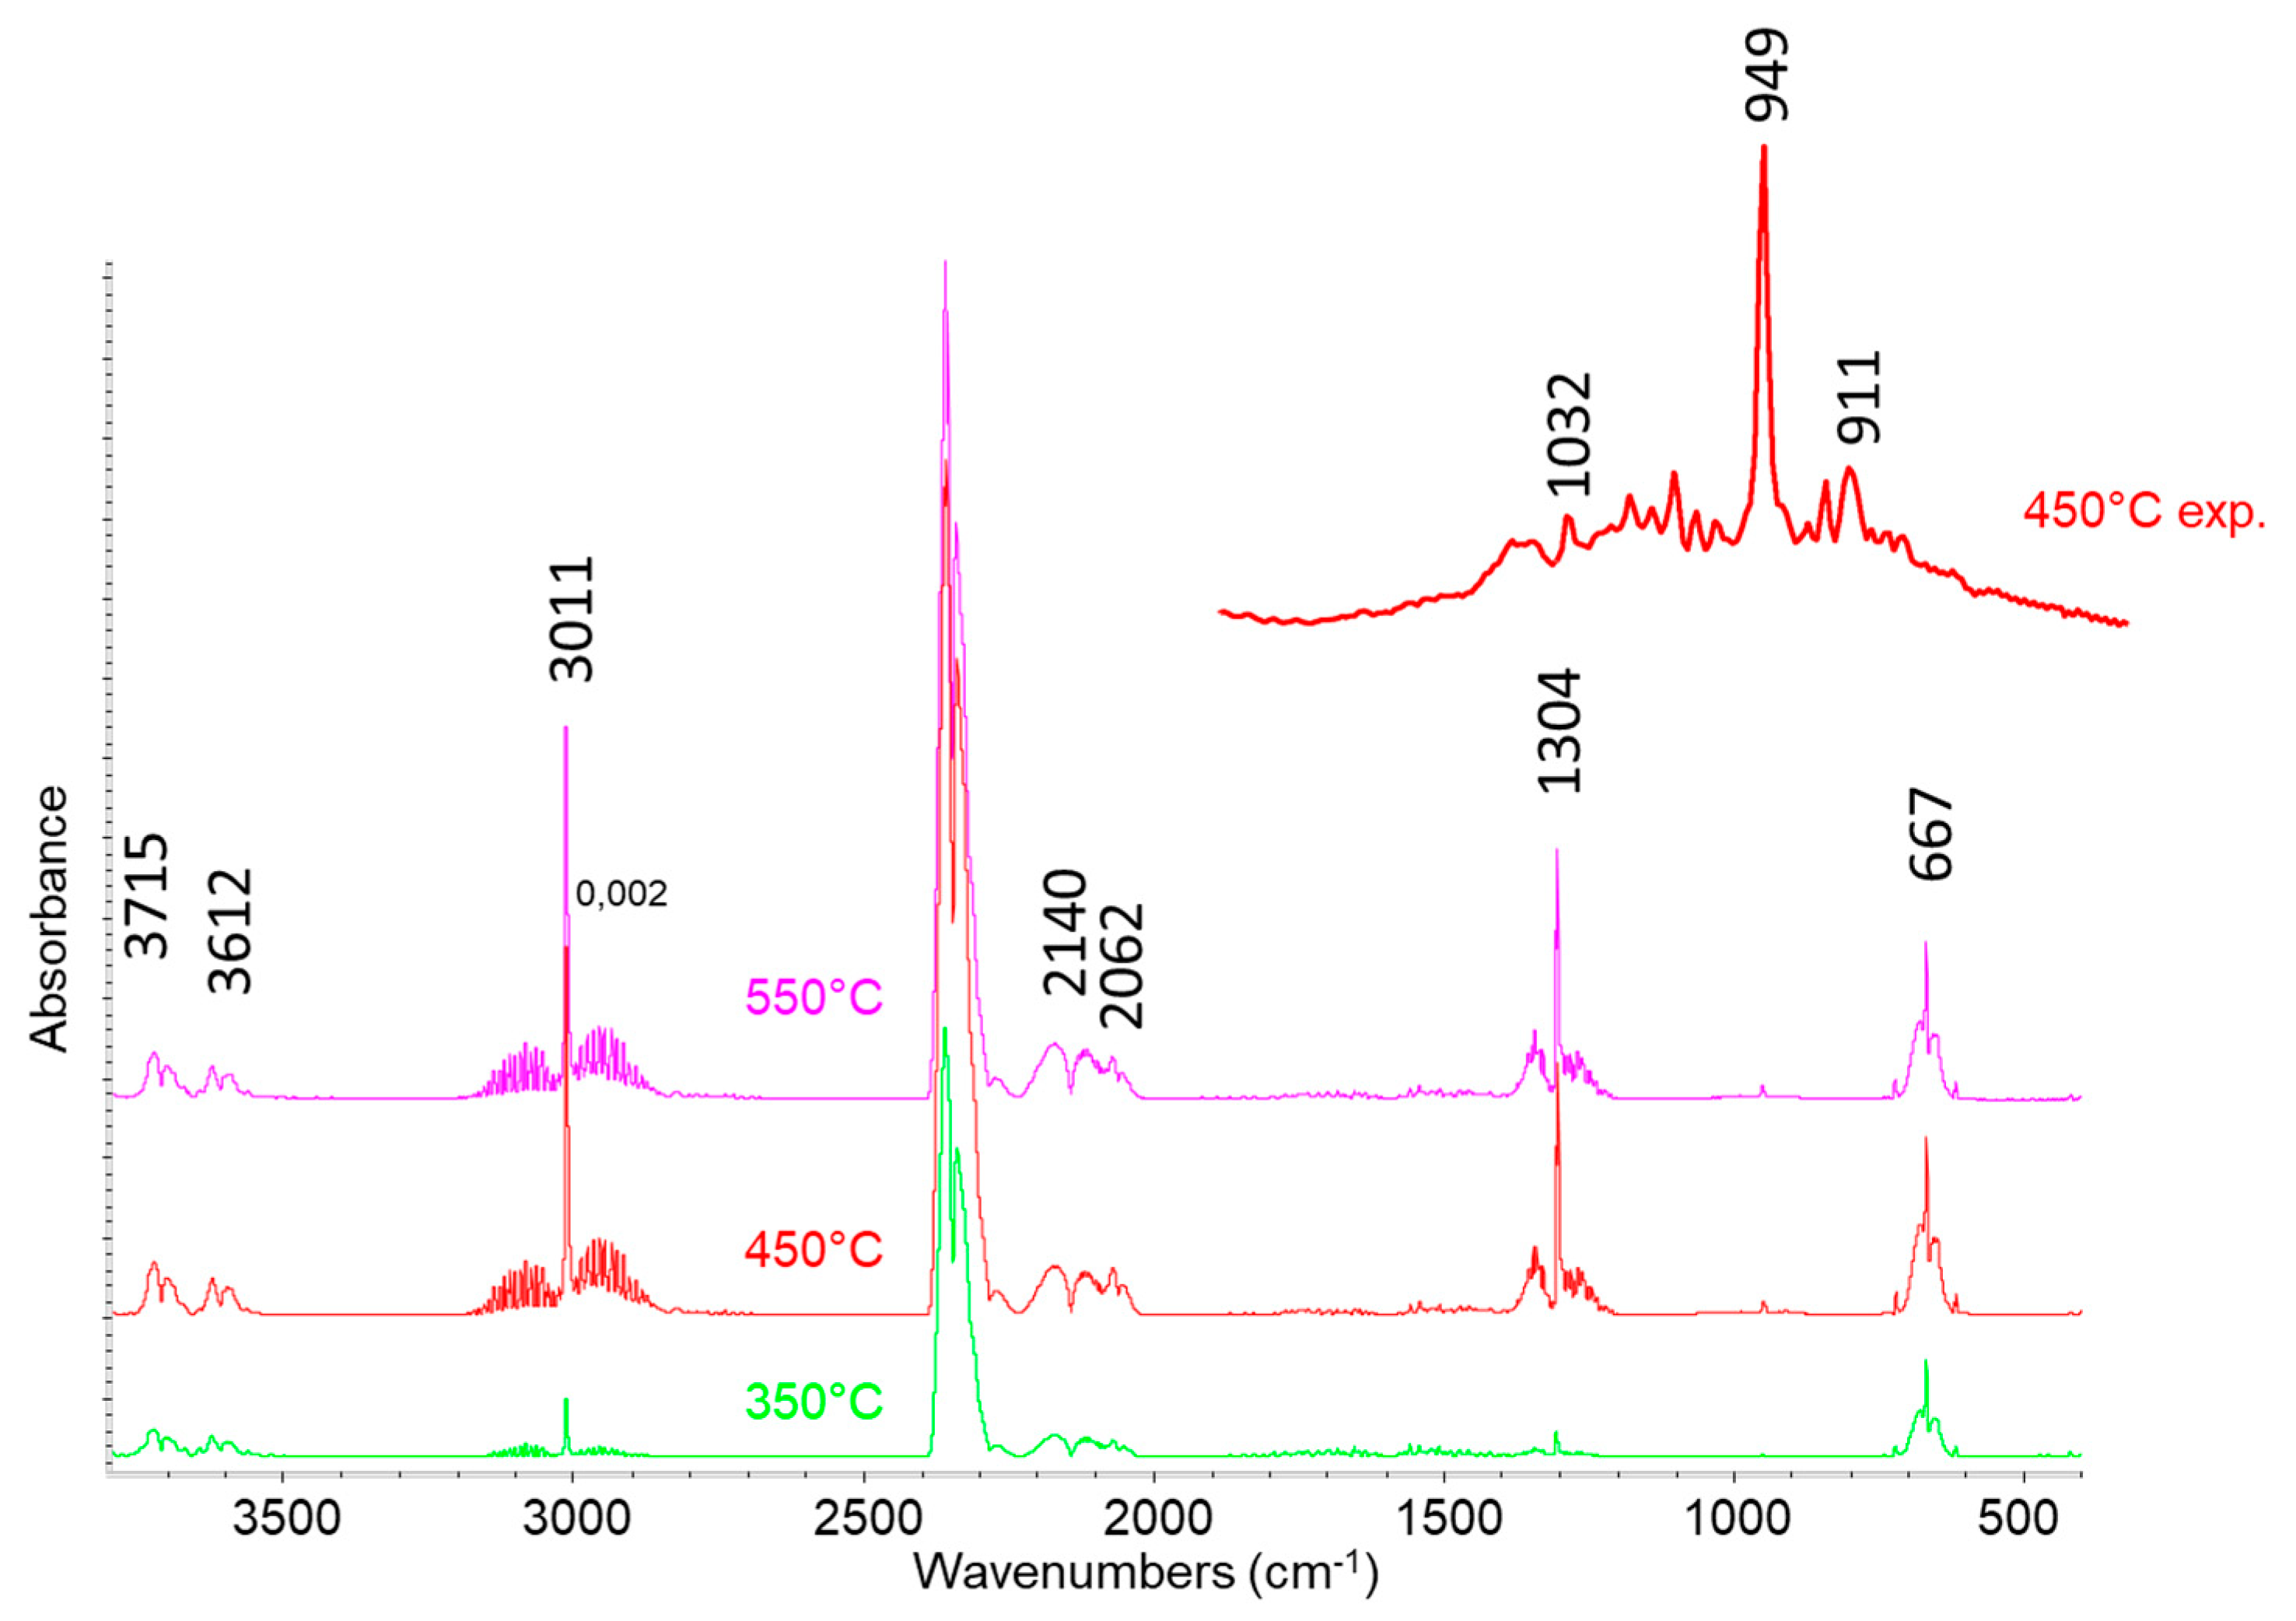
3.4. Gas Products Characterization

In Figure 7, the IR spectra of gases obtained by lignin pyrolysis are reported. All the spectra show the presence of rotovibrational bands centered at 3715, 3612, 2345, and 667 cm−1 due to carbon dioxide (combination modes, asymmetric stretching, and deformation modes, respectively), at 3011 and 1304 cm−1 due to CH4 (stretching and deformation modes), at 2140 cm−1 due to the stretching mode of carbon monoxide, and at 2062 cm−1 due to carbonyl sulfide (COS asymmetric stretching). Moreover, the expansion of the spectra after treatments at higher temperatures show the presence of ethylene associated with the peak at 949 cm−1 (c) and of propylene (band at 911 cm−1), while the rotovibrational C-O stretching band of gaseous methanol centered at 1032 cm−1 is evident in particular in the spectrum of the gas obtained by pyrolysis at 450 °C. Casazza et al. [34] investigated, at the same temperatures used in this study, the pyrolysis of grape marc, where lignin is present in significant amounts. They did not observe the formation of COS and other sulfur compounds in the resulting gas, where instead nitrogen-containing molecules were found due to the decomposition of protein compounds.
GC-MS analysis of gases detects all the products observed by IR with additional components, which are not detected or detectable in the IR spectrum or have a low concentration in the composition of the pyrolysis gas. Together with small amounts of some light hydrocarbon and oxygenated compounds (i.e., ethanol), in particular, the GC-MS results revealed the presence of other sulfur compounds in G such as CH3SH, CH3-S-CH3, SO2, H2S, and CS2. The evolution of the sulfur-containing species during the reaction time was monitored using a relative abundancy parameter, R, calculated as the ratio between the areas underlying the peak of the considered sulfur species in the chromatogram and the areas of the total compounds in the injection in GC-MS. Figure 8 represents the time–temperature evolution of these compounds, where each histogram represents every GC-MS injection performed during each test. The pyrolysis temperature influences the quantity of sulfur-containing compounds produced, but it does not affect their time evolution. Since gas is mainly produced in the first part of the reaction experiment at each temperature, the R parameter tends to remain constant during the 3 h of the reaction time. However, there are some exceptions: dimethyl sulfide (CH3-S-CH3) and methyl mercaptan (CH3SH) have a drop in the concentration through the reaction time, while the concentration of hydrogen sulfide (H2S) slightly increases. The changes in the H2S content are barely detectable since it is by far the most relevant compound in the gas mixture and its relative abundance parameter is one order of magnitude greater than that of the other compounds. Our data are different from those of Yan et al., who performed a thermogravimetric analysis on Kraft lignin showing hydrogen sulfide as the only relevant sulfur compound detectable, whose production is restricted to a temperature range between 300 and 450 °C [35].

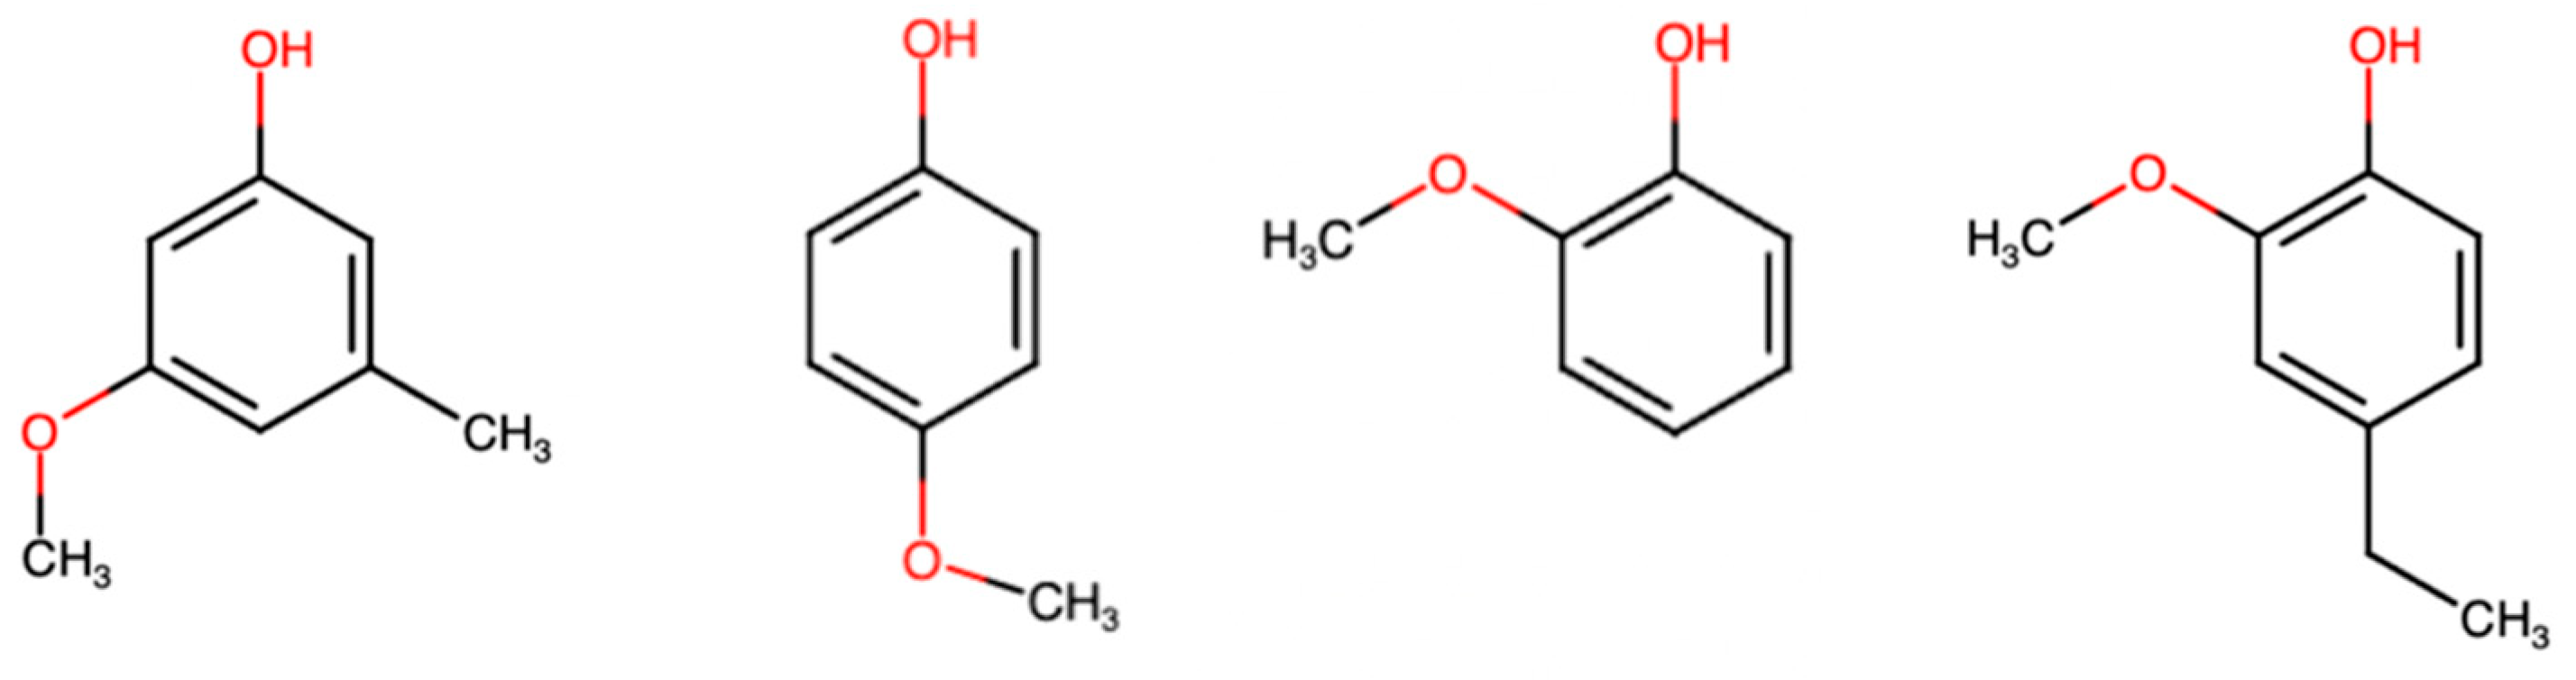
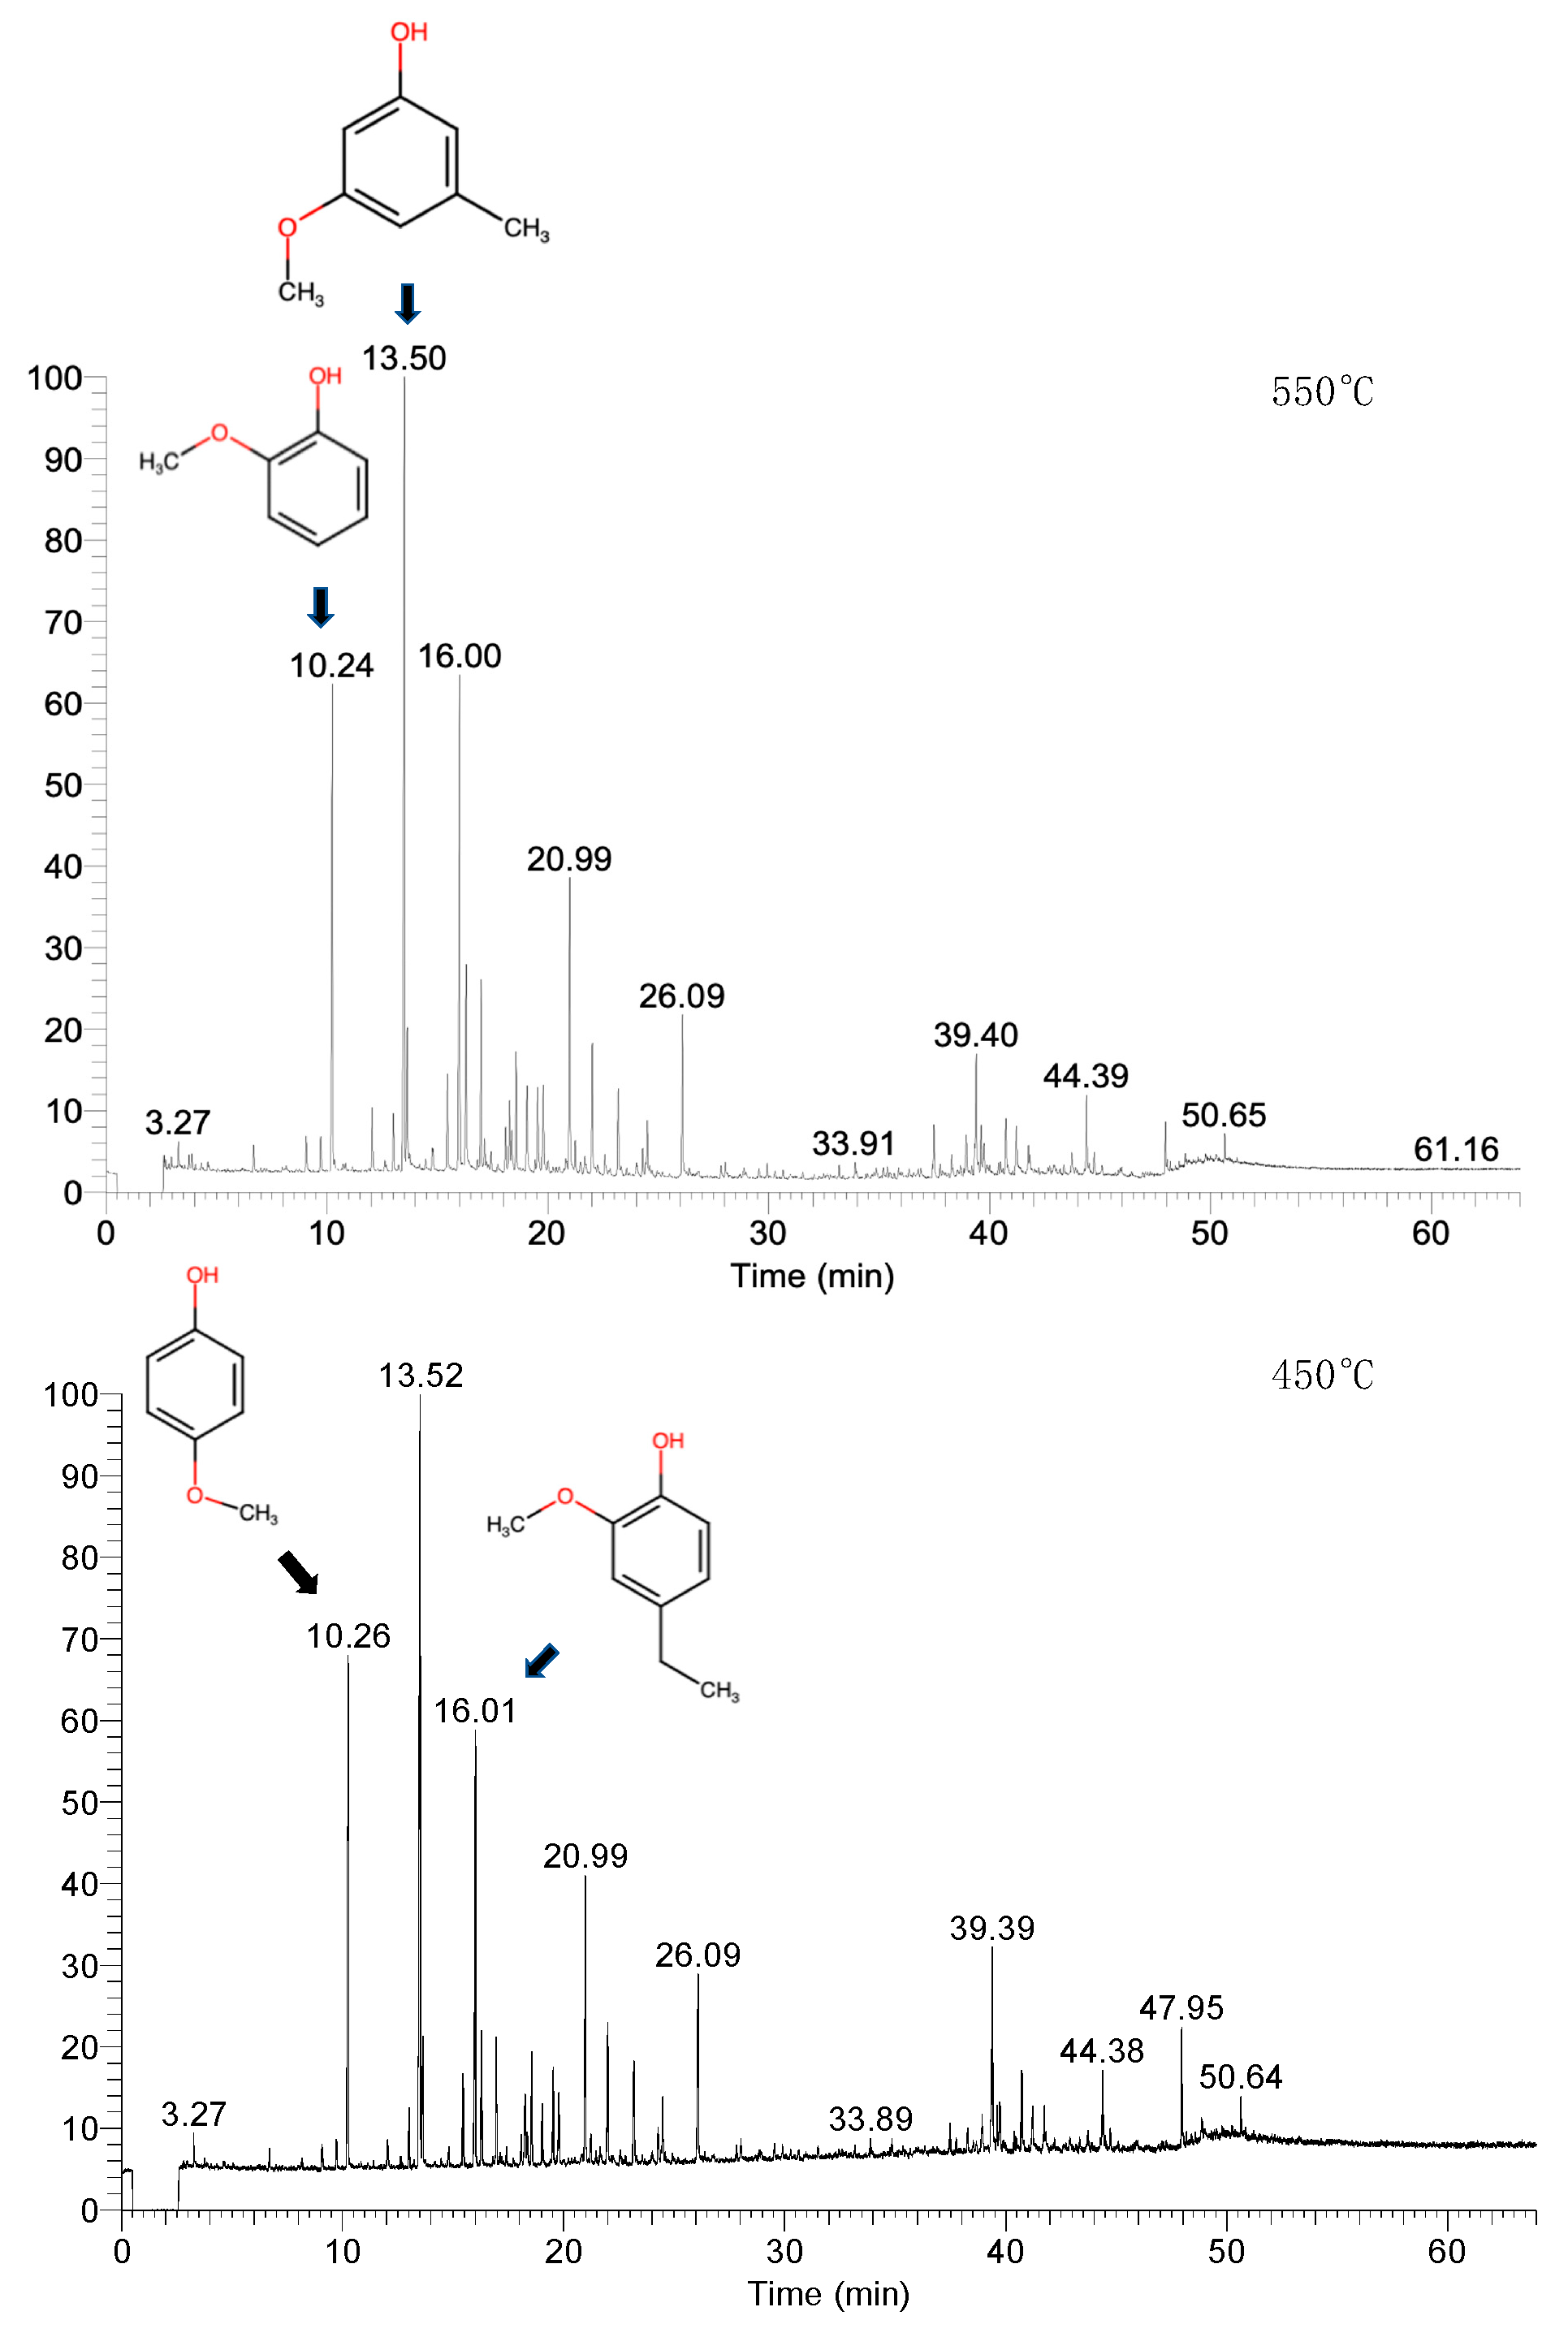
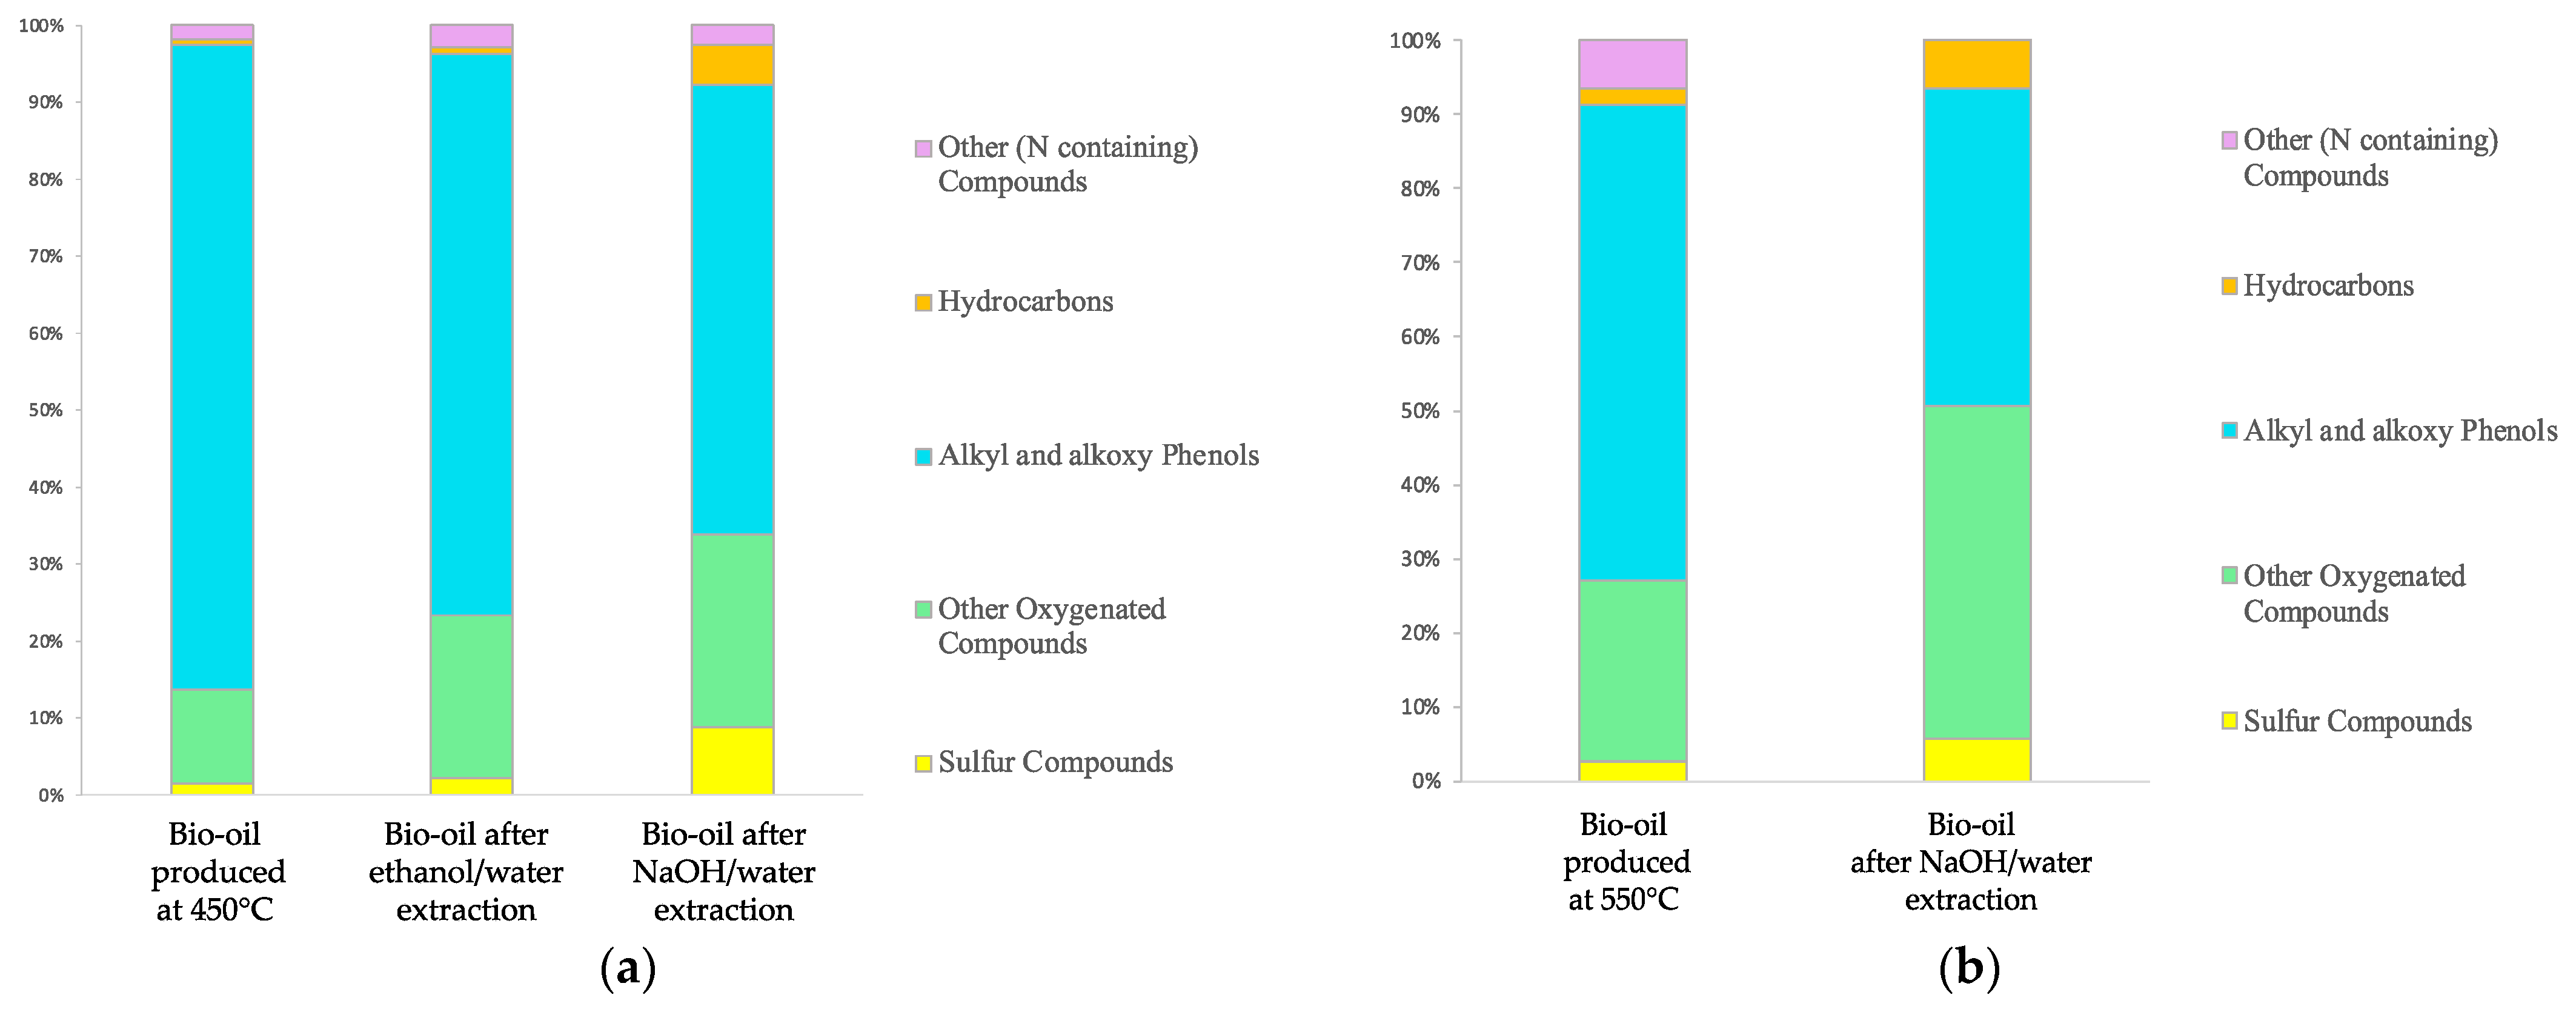
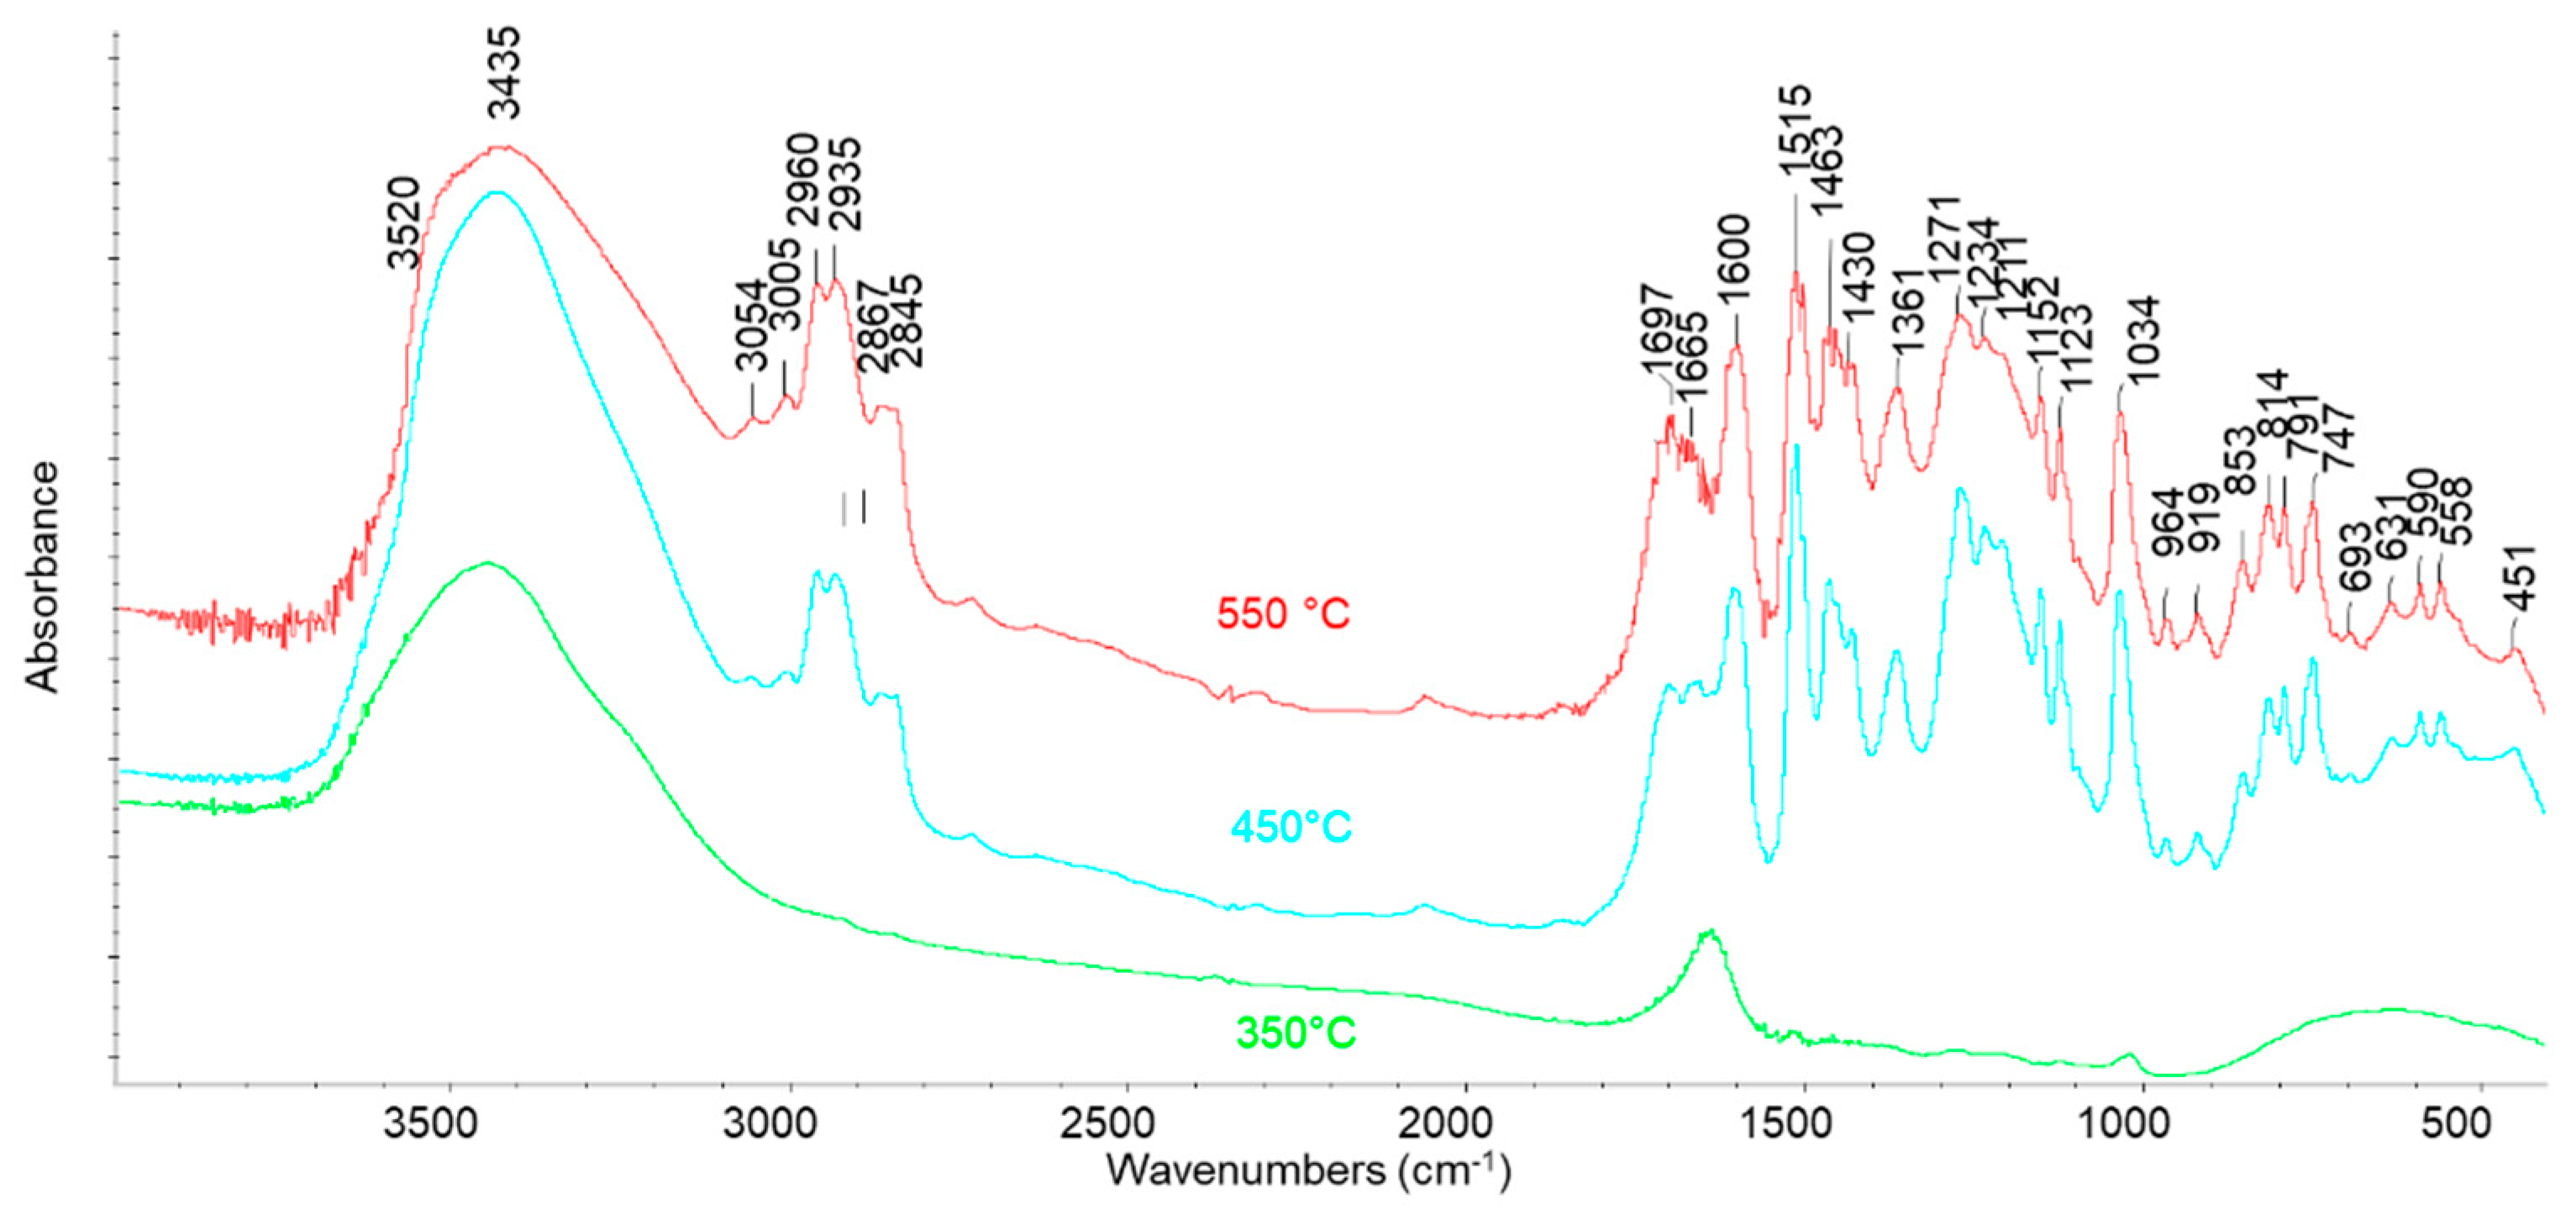
3.5. Liquid Products Characterization

FT-IR analysis was performed on the L fractions, usually denoted as “bio-oils”, as shown in Figure 9. After pyrolysis at 350 °C the spectrum of the liquid is dominated by the features of water (OH stretchings at around 3400 cm1, the scissoring mode at around 1620 cm1, broad “vibrational” modes around 600 cm1), although some weak features indicate that organic molecules are also present, dissolved in it. An expansion of the spectrum reveals its similarity with that of water glucose or mixed sugars solution (in particular, the doublet at 1049, 1032 cm1) [36]. This suggests that in these conditions some dehydration process occurs together with the hydrolysis/dissolution of polysaccharide residuals. After higher temperature pyrolysis, the spectrum of the resulting bio-oil, much more abundant, shows the presence of a wide range of compounds. Indeed, the spectra of the bio-oils produced at 450 and 550 °C are essentially the same and are closely similar to that of the starting solid lignin. This suggests that the liquid produced is constituted by “monomeric” or less polymerized species, retaining the same functional groups of lignin. The most evident differences between the spectra of lignin and bio-oils are that the band at 1079 cm1, well evident in the lignin spectrum, is not evident in the spectrum of bio-oils, while in the CH stretching region, peaks at 3054 and 2959 cm1 are relatively stronger. Moreover, the bands at 791 and 747 cm1 are much stronger, relatively, in the spectrum of bio-oils than in that of lignin. These spectral modifications could be associated with the reduced number of methoxy groups associated with methanol evolution in the gas phase.
L characterization with GC-MS was realized after an extraction/dilution step with CHCl3. The liquid produced during the pyrolysis process consists of two separated phases: a bottom-heavy oily phase and an aqueous top phase. Despite the aqueous phase being clearly visible, it represents a negligible percentage of the total liquid mass. Thus, the extraction with CHCl3 previous to the GC-MS analysis was performed on the total L produced. The CHCl3-soluble fraction was separated from the aqueous phase by means of a centrifuge step, and then it was analyzed in the GC-MS (Table 2). The characterization was only performed on liquids produced in the tests at 450 °C and 550 °C, due to the low liquid yield at 350 °C (~1 wt.%).
The GC-MS analysis of the liquid extracted after pyrolysis at 450 °C, in agreement with the IR analysis, shows the presence of many oxygenated aromatic compounds, with a large predominance of alkyl- and alkoxy-phenols (Figure 10). Alkyl phenols have been considered as a separated class of compounds since their importance as high-value intermediates can influence the economic feasibility of the process. In the other oxygenated compound fractions, alcohols, ketones, ethers, carboxylic acids, methoxy alkanes, aromatics, aldehydes, and esters have been included. Among them, benzenediols, i.e., catechol, resorcinol, hydroquinone, and some alkyl-derivatives are present. However, sulfur is also present in a few non-aromatic compounds. A small amount of hydrocarbons is also observed. In this fraction, alkyl benzenes, xylenes, and styrene are present. In particular, the main peak corresponds to 3 methoxy-5-methyl-phenol, while strong peaks are also those corresponding to the two isomeric compounds 2-methoxy-phenol (guaiacol) and 4-methoxy-phenol and to 4-ethyl-2-methoxy-phenol. The peaks of these four compounds correspond to more than 65% of all GC spectra in the liquid obtained by pyrolysis at 450 °C, as shown in Figure 11, where the chromatograms obtained from the GC-MS analysis of the CHCl3-diluted bio-oil are reported. The same compounds are also the most abundant after pyrolysis at 550 °C but their amount decreases significantly at this temperature. The reaction liquid composition is completely different from that obtained from the pyrolysis of vegetable oils. Phung et al. [37] studied the conversion of palm oil at 450 °C, and the produced liquid was mainly composed of C8-C16 hydrocarbons. Furthermore, the thermal treatment of plastics (PET, PU, PVC, etc.) led to liquids with different compositions in the function of the used polymer [38].
Once the composition of the L fraction was determined, two different extractions were made with the main objective of extracting phenolic-like compounds from the liquid. The solvents that were used in this process are ethanol/water and NaOH/water solutions, as described in the methods section. Figure 12a shows the changes in the composition of the bio-oil obtained. The phenolic fraction decreased by 13 and 30% in the raffinate bio-oils obtained by extracting with ethanol/water and NaOH/water solutions, on the L produced at 450 °C, respectively. The higher extraction power of the alkaline solution is due to the acid behavior of phenols in solution, and for this reason, only the NaOH/water solution was added to the L produced at 550 °C. In this case, a 31% reduction was also obtained, as shown in Figure 12b. After extraction with the ethanol/water solution, the resulting refined bio-oil also had a lower amount of sulfur compared to the one obtained with NaOH/water, even if the extracted fraction of phenols was smaller. This suggests that sulfur compounds were also extracted. In contrast, alkaline water solution allows the better extraction of alkyl phenols but the percentage of sulfur in the bio-oil increases together with hydrocarbon and oxygenated compound fractions. Similar behavior can be noticed for the extractions performed at 550 °C.
Interestingly, sulfur compounds can be found in liquid as dimethyl sulfide, thiols, and thiophenes. Even though these compounds represent a small percentage of L, their presence is still remarkable due to the implication of sulfur in the eventual bio-oil application as a fuel. In fact, sulfur in liquid can be corrosive, can lead to the formation of gaseous sulfur compounds such as SO2 and H2S (which are toxic), and can also poison the catalysts [39,40,41,42,43].

4. Conclusions

In this study, the behavior of a commercial Kraft lignin in different isothermal conditions was investigated. The distribution of the products of the pyrolysis reaction was studied and characterized.
Biochar is mainly a carbonaceous material, with the presence of a low quantity of sodium and sulfur. Pyrolysis temperature affects the elemental composition of biochar. The carbon content increases as the temperature increases, up to almost 90 wt.% in samples produced at 550 °C. In contrast, the amount of oxygen in the pyrolytic residues follows an opposite trend, showing a drop from 31 wt.% in fresh lignin to 7 wt.% for samples treated at 550 °C.
The produced reaction gas contains carbon oxides, light hydrocarbons (methane, ethylene, propene), and oxygenated compounds (methanol, ethanol). However, it also presents a relevant amount of S-containing compounds, which affect the gas quality. Their evolution and production depend on the reaction temperature. Hydrogen sulfide is by far the most-produced S-compound in the gas product.
The composition of bio-oil produced in the test performed at 450 and 550 °C changes with the temperature, even if the most remarkable class of compounds in the L fraction is always represented by alkyl and alkoxy-phenols, present together with alkyl-di-hydroxy-benzenes, oxygenated compounds, a few hydrocarbons, and also sulfur compounds. From extractions performed on the pyrolysis liquid, it can be evinced that the phenol extraction power of the NaOH/water solution is higher than the ethanol/water solution. However, in the conditions adopted, the extraction of alkyl-alkoxy phenols is still far from complete. On the other hand, most of the sulfur compounds are not extracted under these conditions.

Author Contributions

Conceptualization, M.B.; A.A.C.; G.G.; P.R.; methodology, M.B.; A.A.C.; G.G.; P.R.; validation, M.B.; A.A.C.; G.G.; P.R.; formal analysis, M.B.; A.A.C.; G.G.; P.R.; investigation, M.B.; A.A.C.; G.G.; P.R.; data curation, M.B.; A.A.C.; G.G.; P.R.; writing—original draft preparation, M.B., A.A.C.; writing—review and editing, M.B., A.A.C., G.B.; supervision, G.B. All authors have read and agreed to the published version of the manuscript.

Funding

There is no external funding.

Institutional Review Board Statement

Not applicable.

Informed Consent Statement

Not applicable.

Data Availability Statement

Not applicable.

Conflicts of Interest

The authors declare no conflict of interest.

References

  1. Spennati, E.; Casazza, A.A.; Converti, A.; Busca, G. Thermocatalytic Pyrolysis of Exhausted Arthrospira Platensis Biomass after Protein or Lipid Recovery. Energies 2020, 13, 5246. [Google Scholar] [CrossRef]
  2. Azadi, P.; Inderwildi, O.R.; Farnood, R.; King, D.A. Liquid Fuels, Hydrogen and Chemicals from Lignin: A Critical Review. Renew. Sustain. Energy Rev. 2013, 21, 506–523. [Google Scholar] [CrossRef]
  3. Kang, S.; Li, X.; Fan, J.; Chang, J. Hydrothermal Conversion of Lignin: A Review. Renew. Sustain. Energy Rev. 2013, 27, 546–558. [Google Scholar] [CrossRef]
  4. Kawamoto, H. Lignin Pyrolysis Reactions. J. Wood Sci. 2017, 63, 117–132. [Google Scholar] [CrossRef] [Green Version]
  5. Vavilala, S.L.; Ghag, S.B.; D’Souza, J.S. Lignin: Understanding and Exploring Its Potential for Biofuel Production; Elsevier Inc.: Amsterdam, The Netherlands, 2019; ISBN 9780128179413. [Google Scholar]
  6. Zevallos Torres, L.A.; Lorenci Woiciechowski, A.; de Andrade Tanobe, V.O.; Karp, S.G.; Guimarães Lorenci, L.C.; Faulds, C.; Soccol, C.R. Lignin as a Potential Source of High-Added Value Compounds: A Review. J. Clean. Prod. 2020, 263, 121499. [Google Scholar] [CrossRef]
  7. Gellerstedt, G. Softwood Kraft Lignin: Raw Material for the Future. Ind. Crop. Prod. 2015, 77, 845–854. [Google Scholar] [CrossRef]
  8. Qiao, Y.; Wang, B.; Ji, Y.; Xu, F.; Zong, P.; Zhang, J.; Tian, Y. Thermal Decomposition of Castor Oil, Corn Starch, Soy Protein, Lignin, Xylan, and Cellulose during Fast Pyrolysis. Bioresour. Technol. 2019, 278, 287–295. [Google Scholar] [CrossRef]
  9. Liu, X.; Wang, T.; Chu, J.; He, M.; Li, Q.; Zhang, Y. Understanding Lignin Gasification in Supercritical Water Using Reactive Molecular Dynamics Simulations. Renew. Energy 2020, 161, 858–866. [Google Scholar] [CrossRef]
  10. Dou, X.; Li, W.; Zhu, C. Catalytic Hydrotreatment of Kraft Lignin into Liquid Fuels over Porous ZnCoOx Nanoplates. Fuel 2021, 283, 118801. [Google Scholar] [CrossRef]
  11. Güvenatam, B.; Kurşun, O.; Heeres, E.H.J.; Pidko, E.A.; Hensen, E.J.M. Hydrodeoxygenation of Mono- and Dimeric Lignin Model Compounds on Noble Metal Catalysts. Catal. Today 2014, 233, 83–91. [Google Scholar] [CrossRef]
  12. Xu, A.; Guo, X.; Zhang, Y.; Li, Z.; Wang, J. Efficient and Sustainable Solvents for Lignin Dissolution: Aqueous Choline Carboxylate Solutions. Green Chem. 2017, 19, 4067–4073. [Google Scholar] [CrossRef]
  13. Xu, A.; Chen, L.; Xu, X.; Xiao, Z.; Liu, R.; Gao, R.; Yuan, M.; Zhang, L. Recyclable Choline Nicotinate and Ferulate Aqueous Solutions as Efficient Lignin Solvents. Polymers 2018, 10, 840. [Google Scholar] [CrossRef] [PubMed] [Green Version]
  14. Hart, W.E.S.; Harper, J.B.; Aldous, L. The Effect of Changing the Components of an Ionic Liquid upon the Solubility of Lignin. Green Chem. 2015, 17, 214–218. [Google Scholar] [CrossRef] [Green Version]
  15. Pandey, M.P.; Kim, C.S. Lignin Depolymerization and Conversion: A Review of Thermochemical Methods. Chem. Eng. Technol. 2011, 34, 29–41. [Google Scholar] [CrossRef]
  16. Nanda, S.; Mohammad, J.; Reddy, S.N.; Kozinski, J.A.; Dalai, A.K. Pathways of Lignocellulosic Biomass Conversion to Renewable Fuels. Biomass Convers. Biorefin. 2014, 4, 157–191. [Google Scholar] [CrossRef]
  17. Jegers, H.E.; Klein, M.T. Primary and Secondary Lignin Pyrolysis Reaction Pathways. Ind. Eng. Chem. Process Des. Dev. 1985, 24, 173–183. [Google Scholar] [CrossRef]
  18. Busca, G. Production of Gasolines and Monocyclic Aromatic Hydrocarbons: From Fossil Raw Materials to Green Processes. Energies 2021, 14, 4061. [Google Scholar] [CrossRef]
  19. Wang, X.; Du, B.; Pu, L.; Guo, Y.; Li, H.; Zhou, J. Effect of Particle Size of HZSM-5 Zeolite on the Catalytic Depolymerization of Organosolv Lignin to Phenols. J. Anal. Appl. Pyrolysis 2018, 129, 13–20. [Google Scholar] [CrossRef]
  20. Shu, R.; Xu, Y.; Ma, L.; Zhang, Q.; Wang, C.; Chen, Y. Controllable Production of Guaiacols and Phenols from Lignin Depolymerization Using Pd/C Catalyst Cooperated with Metal Chloride. Chem. Eng. J. 2018, 338, 457–464. [Google Scholar] [CrossRef]
  21. Lago, A.; Hernando, H.; Moreno, J.M.; Serrano, D.P.; Fermoso, J. Valorisation of a Lignin-Rich Residue via Catalytic Pyrolysis over ZrO2/ZSM-5 Technical Catalyst. Fuel Process. Technol. 2021, 215, 106746. [Google Scholar] [CrossRef]
  22. Feng, Y.; Li, G.; Li, X.; Zhu, N.; Xiao, B.; Li, J.; Wang, Y. Enhancement of Biomass Conversion in Catalytic Fast Pyrolysis by Microwave-Assisted Formic Acid Pretreatment. Bioresour. Technol. 2016, 214, 520–527. [Google Scholar] [CrossRef]
  23. Wang, W.; Wang, M.; Huang, J.; Zhao, X.; Su, Y.; Wang, Y.; Li, X. Formate-Assisted Analytical Pyrolysis of Kraft Lignin to Phenols. Bioresour. Technol. 2019, 278, 464–467. [Google Scholar] [CrossRef]
  24. Joshi, P.; Mishra, R.; Narayan, R.J. Biosensing Applications of Carbon-Based Materials. Curr. Opin. Biomed. Eng. 2021, 18, 100274. [Google Scholar] [CrossRef]
  25. Ház, A.; Jablonský, M.; Šurina, I.; Kačík, F.; Bubeníková, T.; Ďurkovič, J. Chemical Composition and Thermal Behavior of Kraft Lignins. Forests 2019, 10, 483. [Google Scholar] [CrossRef] [Green Version]
  26. Farzin, S.; Johnson, T.J.; Chatterjee, S.; Zamani, E.; Dishari, S.K. Ionomers from Kraft Lignin for Renewable Energy Applications. Front. Chem. 2020, 8, 690. [Google Scholar] [CrossRef]
  27. Latham, K.G.; Matsakas, L.; Figueira, J.; Rova, U.; Christakopoulos, P.; Jansson, S. Examination of How Variations in Lignin Properties from Kraft and Organosolv Extraction Influence the Physicochemical Characteristics of Hydrothermal Carbon. J. Anal. Appl. Pyrolysis 2021, 155, 105095. [Google Scholar] [CrossRef]
  28. Rashid, T.; Kait, C.F.; Murugesan, T. A “Fourier Transformed Infrared” Compound Study of Lignin Recovered from a Formic Acid Process. Procedia Eng. 2016, 148, 1312–1319. [Google Scholar] [CrossRef] [Green Version]
  29. Boeriu, C.G.; Bravo, D.; Gosselink, R.J.A.; van Dam, J.E.G. Characterisation of Structure-Dependent Functional Properties of Lignin with Infrared Spectroscopy. Ind. Crop. Prod. 2004, 20, 205–218. [Google Scholar] [CrossRef]
  30. AOAC. Official Methods of Analysis of the AOAC International, 17th ed.; AOAC: Gaithersburg, MD, USA, 2000. [Google Scholar]
  31. Setter, C.; Sanchez Costa, K.L.; Pires de Oliveira, T.J.; Farinassi Mendes, R. The Effects of Kraft Lignin on the Physicomechanical Quality of Briquettes Produced with Sugarcane Bagasse and on the Characteristics of the Bio-Oil Obtained via Slow Pyrolysis. Fuel Process. Technol. 2020, 210, 106561. [Google Scholar] [CrossRef]
  32. Cuong, D.V.; Matsagar, B.M.; Lee, M.; Hossain, M.S.A.; Yamauchi, Y.; Vithanage, M.; Sarkar, B.; Ok, Y.S.; Wu, K.C.W.; Hou, C.H. A Critical Review on Biochar-Based Engineered Hierarchical Porous Carbon for Capacitive Charge Storage. Renew. Sustain. Energy Rev. 2021, 145, 111029. [Google Scholar] [CrossRef]
  33. Chen, L.; Yuan, J.; Li, T.; Jiang, X.; Ma, S.; Cen, W.; Jiang, W. A Regenerable N-Rich Hierarchical Porous Carbon Synthesized from Waste Biomass for H2S Removal at Room Temperature. Sci. Total Environ. 2021, 768, 144452. [Google Scholar] [CrossRef] [PubMed]
  34. Casazza, A.A.; Aliakbarian, B.; Lagazzo, A.; Garbarino, G.; Carnasciali, M.M.; Perego, P.; Busca, G. Pyrolysis of Grape Marc before and after the Recovery of Polyphenol Fraction. Fuel Process. Technol. 2016, 153, 121–128. [Google Scholar] [CrossRef]
  35. Yan, Q.; Arango, R.; Li, J.; Cai, Z. Fabrication and Characterization of Carbon Foams Using 100% Kraft Lignin. Mater. Des. 2021, 201, 109460. [Google Scholar] [CrossRef]
  36. Cadet, F.; Robert, C.; Offmann, B. Simultaneous Determination of Sugars by Multivariate Analysis Applied to Mid-Infrared Spectra of Biological Samples. Appl. Spectrosc. 1997, 51, 369–375. [Google Scholar] [CrossRef]
  37. Phung, T.K.; Casazza, A.A.; Perego, P.; Capranica, P.; Busca, G. Catalytic Pyrolysis of Vegetable Oils to Biofuels: Catalyst Functionalities and the Role of Ketonization on the Oxygenate Paths. Fuel Process. Technol. 2015, 140, 119–124. [Google Scholar] [CrossRef]
  38. Casazza, A.A.; Spennati, E.; Converti, A.; Busca, G. Study on the Thermal Decomposition of Plastic Residues. Chem. Eng. Trans. 2019, 74, 1141–1146. [Google Scholar] [CrossRef]
  39. Liu, C.; Zhang, R.; Wei, S.; Wang, J.; Liu, Y.; Li, M.; Liu, R. Selective Removal of H2S from Biogas Using a Regenerable Hybrid TiO2/Zeolite Composite. Fuel 2015, 157, 183–190. [Google Scholar] [CrossRef]
  40. Cheah, S.; Carpenter, D.L.; Magrini-Bair, K.A. Review of Mid- to High-Temperature Sulfur Sorbents for Desulfurization of Biomass- and Coal-Derived Syngas. Energy Fuels 2009, 23, 5291–5307. [Google Scholar] [CrossRef]
  41. Ma, H.; Zhou, L.; Lv, S.; Chew, J.W.; Wang, Z. Review on Reaction Mechanisms of Sulfur Species during Coal Combustion. J. Energy Resour. Technol. Trans. ASME 2019, 141, 1–7. [Google Scholar] [CrossRef]
  42. Sokolova, T.A.; Alekseeva, S.A. Adsorption of Sulfate Ions by Soils (a Review). Eurasian Soil Sci. 2008, 41, 140–148. [Google Scholar] [CrossRef]
  43. Zeelani, G.G.; Pal, S.L. A Review on Desulfurization Techniques of Liquid Fuels. Int. J. Sci. Res. IJSR 2016, 5, 2413–2419. [Google Scholar] [CrossRef]
Figure 1. The experiment setup used for the pyrolysis reaction.
Energies 15 00991 g001
Figure 2. SEM analysis of fresh Kraft lignin.
Energies 15 00991 g002
Figure 3. FT-IR spectrum of fresh Kraft lignin.
Energies 15 00991 g003
Figure 4. Pyrolysis product yields distribution at 350, 450, and 550 °C.
Energies 15 00991 g004
Figure 5. SEM pictures of biochar materials after pyrolysis reactions at (a) 300 °C and (b) 550 °C, respectively.
Energies 15 00991 g005
Figure 6. FT-IR analysis of SR at 350, 450, and 550 °C.
Energies 15 00991 g006
Figure 7. FT-IR analysis of pyrolysis gas at 350, 450, and 550 °C.
Energies 15 00991 g007
Figure 8. Evolution of sulfur-containing compounds during the reaction. GC-MS analysis after (1) 45 min, (2) 90 min, (3) 135 min, and (4) 180 min of reaction time.
Energies 15 00991 g008
Figure 9. FT-IR spectra of L pyrolysis fraction at 350, 450, and 550 °C.
Energies 15 00991 g009
Figure 10. Structures of the most abundant compounds in liquid pyrolysis products.
Energies 15 00991 g010
Figure 11. GC-MS chromatograms of the CHCl3-diluted bio-oil produced at 450 and 550 °C.
Energies 15 00991 g011
Figure 12. (a) Extractions on the L produced at 450 °C. (b) Extraction on L produced at 550 °C.
Energies 15 00991 g012
Table 1. SEM-EDX analysis of fresh lignin and reaction residues at different temperatures.
Pyrolysis TemperatureC (%)O (%)Na (%)S (%)
As received67.131.60.21.1
300 °C70.228.60.50.7
350 °C73.724.60.51.3
450 °C82.016.20.51.3
550 °C89.87.70.71.9
Table 2. List of most relevant compounds detected from the GC-MS analysis of bio-oil.
450 °C550 °C
Compound NameChloroformEthanol/WaterNaOH/WaterChloroformNaOH/Water
Furfural0.570.363.110.323.35
EthylBenzene0.180.161.330.161.81
o-Xylene, Benzene, p-Xylene0.100.111.150.162.25
styrene0.091.320.091.23
propanal 3 methyl thiol0.111.400.101.06
Phenol 2-methoxy or 4-methoxy19.3511.432.088.661.50
disulfide, methyl (methyl thio) methyl0.390.274.730.012.88
2 methoxy-6-methyl Phenol1.211.112.180.941.57
3 methoxy-5-methyl Phenol34.0523.7013.4316.578.72
1-2 Benzenediol2.111.722.650.67
3,4 dimethoxy Toluene0.240.314.050.523.31
2 ethoxy methyl phenol1.021.591.550.94
Phenol 4 ethyl 2-methoxy14.4110.5923.108.8417.92
1-2 Benzendiol 4-methyl1.301.943.58
2-methoxy-4-vinilphenol0.851.812.51
benzene 4 ethyl 1-2 di methoxy0.170.361.340.280.88
Eugenol0.991.623.811.131.76
Benzene, 4-ethyl-1,2-dimethoxy-0.410.775.570.7833.87
phenol 2-methoxy-4-propyl1.152.389.741.887.19
4-ethyl cathecol0.560.971.66
vanillin1.181.851.40
phenol 2 methoxy-4-propenyl0.591.471.511.451.05
1,4-benzenediol, 2,3,5, trimethyl1.490.29
phenol 2 methoxy-4-propenyl4.056.515.195.043.71
Ethanone (1-3 hydroxy-4-methoxyphenyl)1.292.603.22
1-2 dimethoxy 4 n propyl benzene0.110.271.070.58
2-propanone (1-3 hydroxy-4-methoxyphenyl)0.291.991.88
3 ethoxy 4 methoxy benzaldehyde0.581.181.27
4-(3-methoxy phenyl) propylcyanide2.45
methyl 2-hydroxy-3-ethoxyBenzylEther1.503.253.65
L-4-Hydroxy-3-methoxyphenylalanine0.110.221.300.24
2-isopropyl-10-methyphenantrene0.240.491.381.711.36
1,1′-Biphenyl, 2,2′-dimethyl-6,6′-dinitro-0.430.682.34
Phenol, 2-methoxy-4-propyl-1.384.564.31
Phenantrene carboxylic acid0.330.723.071.010.94
Phenol, 2-methoxy-4-propyl-0.371.220.98
4 diethyl aminophenyl isothiocyanate0.581.701.81
Phenantrene carboxylic acid0.370.822.12
Phenol, 2-methoxy-4-Propyl-0.270.831.01
Publisher’s Note: MDPI stays neutral with regard to jurisdictional claims in published maps and institutional affiliations.

