Article

Sharing Model in Circular Economy towards Rational Use in Sustainable Production

1
Legal Department, Faculty of Law, Rīga Stradiņš University, 16 Dzirciema Street, LV-1007 Riga, Latvia
2
Department of Management, BA School of Business and Finance, 161 K. Valdemara Street, LV-1013 Riga, Latvia
3
Institute of Market and Economic-Ecological Researches, National Academy of Sciences of Ukraine, 54 Volodymyrska Street, 01030 Kyiv, Ukraine
4
Interregional Academy of Personnel Management, 2 Frometivska Street, 03039 Kyiv, Ukraine
5
Department of Tourism and Educational Management, International European University, 42V, Akademika Hlushkova Ave., 03187 Kyiv, Ukraine
*
Author to whom correspondence should be addressed.
Energies 2022, 15(3), 939; https://doi.org/10.3390/en15030939
Submission received: 23 November 2021 / Revised: 17 January 2022 / Accepted: 21 January 2022 / Published: 27 January 2022
(This article belongs to the Special Issue New Insights into Circular Economy and Sustainable Development)

Abstract

:
Changing business models is a topical issue in a pandemic. Recent research has shown that the search for environmentally friendly and sustainable solutions in various sectors has become relevant. The article aims to promote cooperation and adaptation of good practices between countries. Comparing the country’s history and economic situation and economic development and traditions can be seen as a precondition for success. The article examines the introduction of sharing economy and the creation of environment-friendly trends establishing a circular economy by minimizing the population’s expenses, online business growth, and accessibility of Internet technologies. The article explores the difference between the linear economic model and the circular model by adopting sharing and the efficient joint use of materials to enhance and assess sustainable development. Based on a combination of theoretical and practical research, the article explores the dynamic system and development model of sharing a circular economy. The new concept of circular economy does not promote the overproduction of new goods but the rational use of already produced ones, which significantly reduces the amount of waste generated at all stages of the product life cycle. Population groups by different income groups for sharing services are analysed. An analysis of the price characteristics of popular sharing products was used from data from Internet portals. One concludes that due to the increase in Internet users, especially mobile apps, and social networks, C2C sharing has become quite popular over the past years. Other areas also show positive development indicators but have less demand, affecting supply. Based on an in-depth study of the economic situation in Ukraine, the authors have critically chosen an industry to set as an example with the actual business situation. Therefore, three packages were created: pessimistic, standard and optimistic ones with different characteristics of implementing circular economic projects. The chosen method allows rational management decisions for attracting financing and sustainable solutions. The company’s business scenarios analysed in the article will allow to choose a system based on circular economy principles successfully.

1. Introduction

In recent years, we can see digital transformation, increasing globalization processes, more accessible access to resources and services globally. Social changes caused by digitalization also transform the lifestyle of each individual, affect preferences, demand, supply on the goods and services market, enhance the rate of capital turnover and generally accelerate all flows. The increasing speed of life processes and better access to necessary goods on the Internet results in the growing share of rental services. Individuals prefer to use goods temporarily when needed rather than possess them. Besides a reduced price when buying goods, the lessee declines the responsibility for further exploitation, storage and consumer properties of the object for a specified fee.
Along with the process of digitalization and the expansion of borders in developed countries, the ideas of the green economy are becoming popular. The development of green technologies will contribute to introducing the concept of a circular economy, the main distinguishing feature of which is to increase the life of the product and minimize waste, reducing the negative environmental impact. Therefore, sharing, which increases the social usefulness of the product, will contribute to the introduction of a circular economy. In addition to the positive effects associated with an increase in the possibilities of secondary production or reuse of products because of the development of a circular economy, there is a rebound, which is associated with cheaper products and an increase in the efficiency of its production, which leads to an increase in the level of production and consumption [1]. In this regard, changes in the consumer behaviour of users of the collaborative platform cause a circular economy to rebound that considers the environmental impact of product substitution and demand for recycled products. Using savings from co-sharing may increase personal income and lead to additional purchasing power. Still, the environmental benefits of the circular economy can be achieved if primary production is significantly reduced or more efficient [2].
Access to rental goods is accessible, efficient and affordable to most consumers, which has led to the emergence of the market of lease relations called ‘sharing’ and set a new trend in economic development in Ukraine and worldwide. Sharing allows inhabitants, businesses and public institutions to exchange services and goods, share consumer properties of goods, and efficiently use financial resources and time to achieve their goals. The most common sharing services include accommodation, car rental, taxi, equipment rental, hotel business, financial and credit transactions, etc. The establishment of the sharing economy is closely related to the development of Internet services and the ability to move freely over long distances.
The development of the sharing economy increases the responsibility of everyone towards society, reduces the environmental load and waste products, promotes inclusiveness and accessibility of goods [3]. The launch of online platforms, urbanization and increasing mobility of the younger generation have resulted in the everyday use of different means of transport. It is much more profitable than driving your car. Thus, online taxi, car-sharing and carpooling services are highly in-demand recently [4]. Sharing as a business has rapidly expanded by launching online platforms placing unspent assets and ensuring the quick connection between a customer and a seller.
The mechanism of providing sharing services is based on the lease of a particular product, the cost of which includes depreciation and additional funds that generate entrepreneur’s profit in the long run, for a certain period with the obligatory return of goods to the owner and the further use of goods by other lessees. Lehto et al. [5] define the sharing economy as an innovative economic model based on the collective benefit of goods and services and considered financial interaction between economic agents (producers and consumers of services) without third parties.
As a new economic market, sharing has a number of problems and shortcomings that slow down the rapid adoption of technologies and methods of sharing goods, and contemporary insurance companies are not always an efficient mechanism for reducing business risks [6]. One of the promising areas of the sharing economy is HR management based on meeting manpower needs. Despite the manufacturing automation and inevitable mass dismissal of employees, the introduction of sharing services reveals a new problem: an acute shortage of highly skilled professionals with brand-new competencies [7]. Currently, the development of the sharing economy is unpredictable, but according to Eckhardt et al. [8] it is the impetus for new behavior patterns among both customers and third parties, which have five key characteristics: temporary access, transfer of economic value, mediation on the platform, the expanded role of the consumer and crowdsourcing supply.
Sharing as a resource-saving concept will encourage the adoption of the circular economy based on the repeated use of goods and the increase in their life span by repairing, maintaining and enhancing their usefulness [9]. The maximum use of goods increases the degree of meeting user needs, reduces the negative ecological impact by decreasing the volume of commodity production [10], creates resource-saving conditions. In contrast, shared goods are always circulated, which illustrates the introduction of principles of the circular economy [11].
The value of adopting sharing has long-term indicators where it is impossible to immediately assess the effect via the accumulative positive impact and the long payback period. Besides, sharing will allow decreasing the amount of waste, which is the framework for the circular economy and the prerogative of developing of the development of eco-friendly society based on ecological education, high moral and spiritual values that all governments of developed countries strive for. Sharing encourages the prevalence of long-term economic values over short-term economic advantages, encourages the decrease in waste flows and burial, as well as promotes resource-saving and the growth of macroeconomic indicators.
This paper aims to determine the attainability of the planned goals and to identify the factors that contribute to and hinder the development of sharing economy and creation of environment-friendly trends establishing a circular economy. The structure of the article includes an assessment of the economic situation of sharing in the former countries of the Soviet Union, which after its collapse are members of the European Union (Latvia) and an associate member (Ukraine), especially in its electric power industry associated with sharing, including electric vehicles. Different parts of the article are a statistical analysis that allows you to determine the directions for implementing the sharing economy and the circular economy, considering the application of European experience. In the final part of the article, conclusions and recommendations are presented to accelerate the implementation of the circular economy in terms of its efficiency increase through information technology and common use, which will significantly increase the usefulness of the product and extend its service life.

2. Methodology

The article analyses the main forms of human interaction using Internet technologies, creating a separate economic development area. One has used open data on the Web and conducted a public survey on specific selection criteria. Sharing is a new, dynamic and ambiguous concept that makes research more thorough and broader. Sharing implies the joint use of goods and rent and the increase in the life expectancy of goods by their upgrading and reusing. The article uses methods of abstraction, generalization, deduction and induction, methods of situational analysis, modelling and forecasting. The results are assessed according to the quality of strategy development and analysis with further implementation. One defines and presents graphically the research findings dedicated to the positive effects of resource sharing and preservation. The offered research methods allow using the obtained data for further experiments and other scientific areas. The investigation covers Ukraine and Latvia and reflects the local population’s preferences and existing trends. The survey was conducted voluntarily.
Based on the theoretical analysis of the article, to construct a system of indicators for the development of a collaborative economy, the article uses data from Latvia and Ukraine for the annual time series for 2015 to 2020. The availability of sharing speeds up the overall production rate, increases the range of goods, allows start-ups to set up their own business without considerable investment, and such platforms as Kickstarter [12] help start-ups to implement their ideas.
The absence of ownership makes entrepreneurs more mobile, positively affecting the range and quality of goods, increasing business efficiency. The main tendencies and trends in the field of rank are analysed, and it is found out that flexible business systems can adapt to the constant economic changes. However, during the COVID-19 pandemic, some areas of the sharing economy suffered significant losses (hotel, restaurant business, machinery and equipment rental) because of the declining consumer demand for goods being in use and able to become the object exposed to the virus. Meanwhile, online platforms and such goods as music and games became increasingly popular globally. Partner consumption worldwide is growing, accompanied by new business structures, huge investments, governmental support and increasing market share. However, it often contradicts global goals and should be regulated while the legal framework is still established, and the sharing economy is an area of high risk. According to the survey of 100 respondents via the Internet, the risk of providing shared services in Ukraine has decreased over the past ten years, but 27% of respondents mentioned the hostile experience of providing sharing services, resulting in the loss of financial resources. Respondents were selected from regular Internet users in three age groups: the first—14–25 years, the second—25–40 years and the third—40–60 years. The survey was conducted anonymously in Google Forms.
The article also uses simulation modelling methods to analyse the company’s behaviour strategy and select the optimal next steps.
One of the fundamental methods of scientific knowledge is the analytical method of comparison, which allows identifying the leaders of sharing in the countries under analysis. Latvia is like Ukraine in terms of its historical heritage, which belonged to the Soviet Union in the twentieth century. It is economically identical to Ukraine in terms of economic and analytical indicators, and we are analysing the sharing in these countries. Research modelling methods should set an example for other entrepreneurs. However, despite the short-term results, the authors propose to focus on the long-term perspective and environmental and economic efficiency, which will be an effective indicator.

3. Results

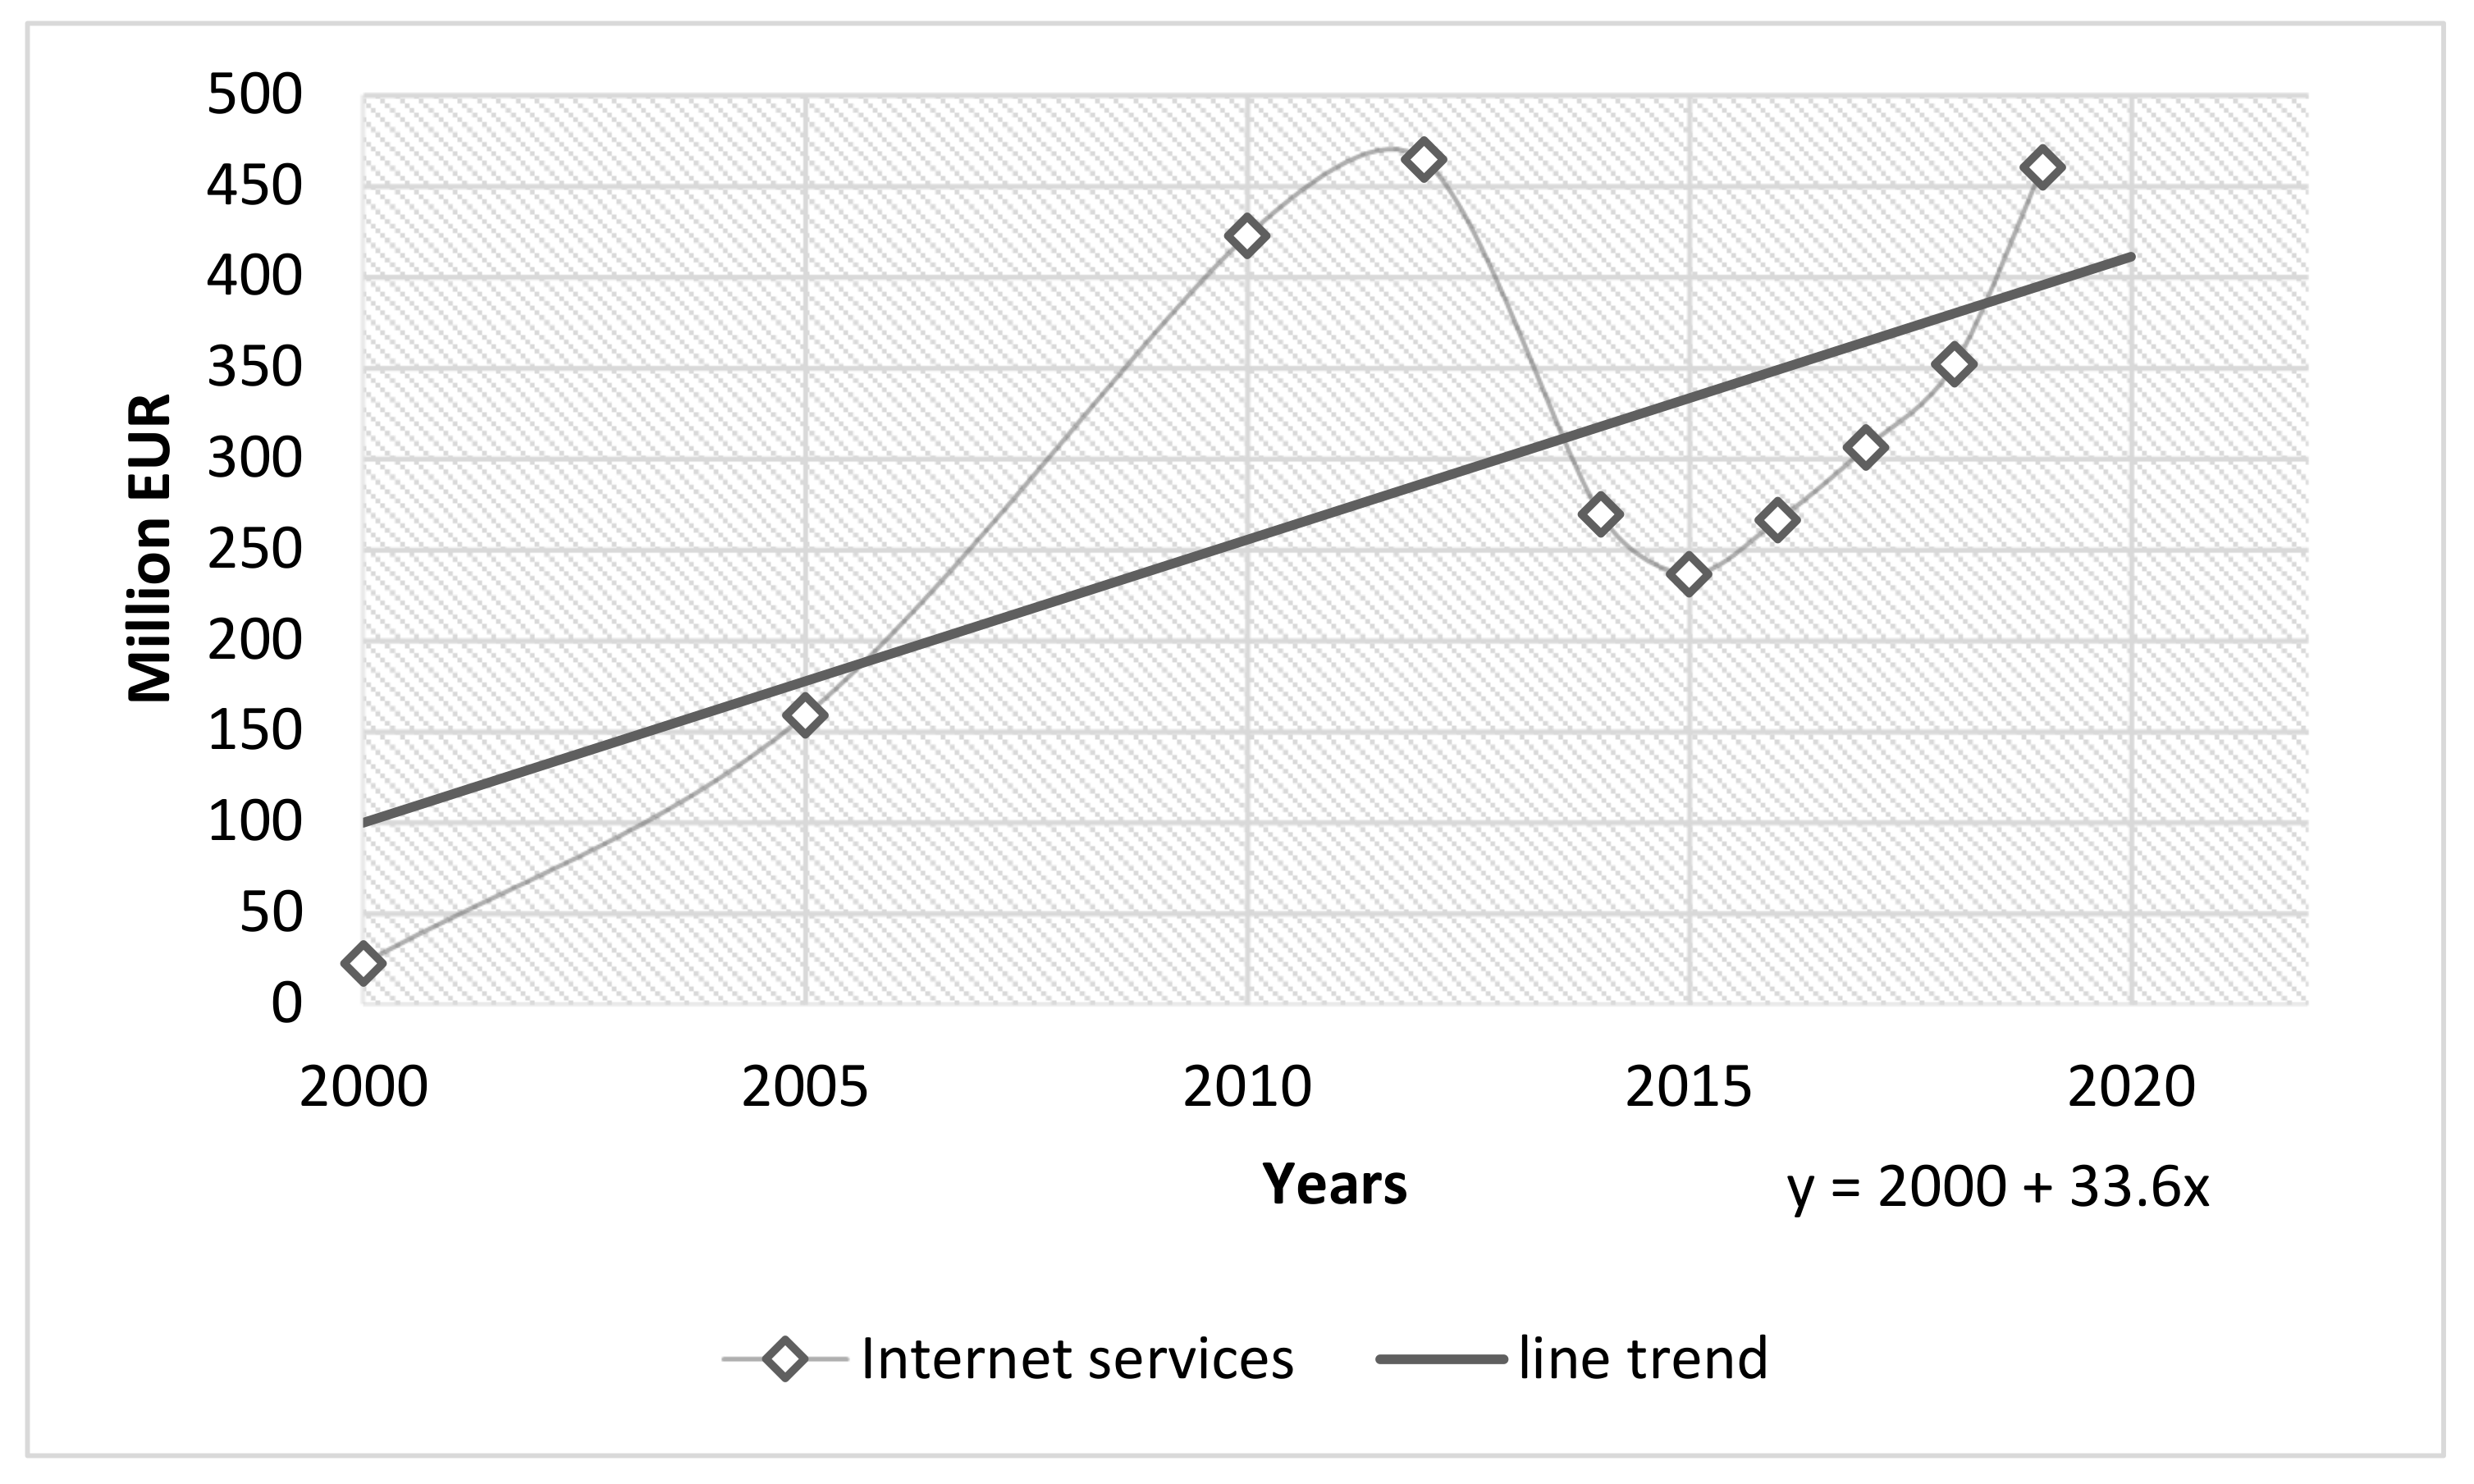
The introduction of the quarantine caused by the COVID-19 pandemic resulted in the increasing amount of Internet users who spent more time on the Web, increasing the share of online businesses, increased the share of online demolition, as evidenced by analytical data on purchases and activity in social networks. At the same time, many sectors suffered losses, which affected the population’s revenues and encouraged the development of lease relations in society. Due to everyone’s desire to minimize expenses and contacts with other people because of COVID-19, the development of the sharing economy has become not just ecologically grounded but also economically viable in many countries, particularly in countries with a low income per capita.
One international sharing example is Uber, which has set the fare and service fee and is available in more than 70 countries. The company has launched its application and developed a rating system to protect users’ data to avoid fraudulent schemes. Ioanna Constantinou and others investigated the largest sharing platforms (Airbnb, Uber, Handy, Couchsurfing, Lyft, TaskRabbit, etc.) and distinguished four main areas of sharing: Franchiser, Principal, Chaperone and Gardener, which have several competitive advantages over traditional businesses [13]. The development of own digital systems, apps and services based on the everyday use of goods and the enhancement of the user function has become the foundation for the establishment of the circular economy that applies resources being in turnover and creating their market and business models of social cohesion where the Internet is the core method of information exchange [14].
The sharing services market in Ukraine has started growing rapidly over the past ten years due to free access to the Internet not only on PCs but also on mobile gadgets. It gave the impetus to the rapid exchange and sharing of goods and services. (Figure 1).
According to the State Statistics Service of Ukraine [15], mobile services (about 54%) and Internet services (17%) are leaders in terms of funds in the structure of telecommunications and postal services. The greatest amount of sold products in the communications sector due to regions can be seen in actual prices including VAT in Kyiv (898 million EUR), Donetsk (146 million EUR), Odesa (129 million EUR) and Kharkiv (1170 million EUR) regions, which are the most economically developed regions of Ukraine. These numbers are growing year-by-year (by 9% in 2018 compared to 2017), indicating an increase in the area of Internet coverage and increasing funding in this sector. It provides favorable conditions for the development of the sharing economy [13,14].
Data of the leader leading one shows an increase in the trend of sold services confirmed by data expressed in UAH, although we can see a decrease in sales (up to 257 million EUR) when calculated in EUR due to the exchange rate growth in 2014–2015 and its subsequent fluctuations. However, Internet users have been growing steadily since 2000, including during the pandemic. Car sharing, bicycle, scooter, household equipment and equipment rental were analysed. Over the past five years, we have seen an increasing number of mobile users and cash receipts in mobile services providing access to the Internet. The role of mobile gadgets plays a significant role in the lives of Ukrainians. This increases the number of online purchases and transactions, mostly in cities (76.3%–7.66 million households as of 2019, which is 10.5% more than in 2018) and settlements with more than 5000 inhabitants, which is explained by the predominance of the population under 50 in the age structure of the inhabitants who have modern mobile devices with free access to the Internet and can use online services. According to the State Statistics Committee of Ukraine, men aged 25–35 (22.4%) and women aged 18–24 (35%) accounted for the most significant percentage of the population buying or renting goods online in 2017. In 2019, men aged 25–35 accounted for 19.8%, increasing the age distribution of users, and women aged 25–35 (29%) became more active. This fact indicates an increase in the age interval between users in terms of both age reduction and raising [15]. Depending on the average equivalent monetary income of households per capita, one can conclude that more active users of sharing services are households with more than 4,800 UAH (148 EUR) in 2017 and families with an income of more than 12,000 UAH (372 EUR) in 2019. Sharing services are slowly developing in regions with the lowest number of Internet users at the regional level.
In 2017: Volyn, Zhytomyr, Odesa, Vinnytsia and Kherson regions. In 2019: Volyn, Ternopil, Khmelnytsk, Kirovohrad, Poltava and Kyiv regions.
Megalopolises and Kharkiv, Dnipropetrovsk, Zaporizhzhia, Mykolaiv, Zakarpattia, Ivano-Frankivsk Ternopil and Chernivtsi regions, were most active in 2017. In 2019, this list was supplemented with Donetsk, Lviv, Odesa and Sumy regions. The number of users increased by more than 10% of the total number of households. One of the leaders in providing sharing services is the Donetsk economic region (22.4% in 2019) characterised by the industrial economy, constant migration and increasing demand for temporary goods [15].
The share of the population aged 16–74 who have reportedly used the Internet over the past 12 months worldwide depends on the state’s economic development, as shown in the tables [16,17]. Leaders in terms of access to Internet services in 2018 included Luxembourg (97.4%), Denmark (97.3%), Norway (96.4%), the United Kingdom (94.9%), the Netherlands (94.7%) [17]. The correlation coefficient between Internet users and gross domestic product per capita is 89%, indicating a direct close relationship.
According to the EVO group of companies, the total amount of physical goods and services purchased by Ukrainians on the Internet in 2020 reached 3.4 billion EUR [18], and the number of online payments increased by 50% compared to 2019. The pandemic has accelerated the development of e-commerce and increased confidence in the use of innovative services. The largest sharing services websites in Ukraine include Blablacar, Rozetka.com.ua, Olx.ua, Ria.com, Jarmarok.com.ua, Rentaua.com, Ogolosha.ua, Obyava.ua, Besplatka.ua, Prom.ua. They provide information about different types and categories of sharing goods and services based on the rating system of users, which warn lessees about potential fraud and poor work. Online crediting, one of the forms of sharing, is also growing rapidly in Ukraine. However, it is still considered as an unfavourable service because of high-interest rates and poor performance of financial institutions, the involvement of banned collection companies and the abuse of fines.
Due to the reduction of Ukraine’s GDP in 2020 by 4%, amounting to 1 trillion 36 billion EUR and 3.25 thousand EUR per capita [15], one expects the increasing use of sharing services in order to reduce the cost of living of each individual and find the ways to increase business profits. The growing number of Internet users and the promotion of online purchases caused by the pandemic and the depreciation of contacts with people are also reasons for finding new options for obtaining necessary services, which will boost product sharing. One predicts the increase in sharing services among goods whose prime cost is more than 870 EUR by 30% in 2021 compared to 2020 and the increase in the number of users by 40% primarily in urban areas, while most rural residents with worse living standards will find sharing services non-demanded. According to search queries, Ukraine has about 29,200 companies providing sharing services, and their number will increase along with the number of sharing services provided to individuals without registration.
Price formation of sharing services depends partially on the cost of production of goods and mainly on depreciation expenses. There is a fundamental difference between lessors who consider sharing as a business and lessors who lease out goods that are not in use and have no consumer value for the owner at present. The supply of sharing services will be determined by lessors’ interest to receive funds for the benefit of goods and not lose their ownership, caused by the need for additional financial income and the availability of free time to sell goods. Depending on the period of use, the residual value of the product decreases, determining the cost of its supply, analysing 100 products in five categories subject to selling and the loss of ownership and 100 products in similar categories leased out on the Olx.ua, the use-value of goods declines unevenly (Figure 2).
Figure 2 shows that in the case of the production of goods, their sale price is 100% and includes all the expenses for display and sale. In the case of zero use of the product, most sellers sell it at the total sale price on the market. In the case of leasing out the same effect, its rental price is on average 12% of the sale price and changes only when the product is worn by 80%. Unlike a rental yield, the sale price changes with the wear and tear of the product and even at maximum wear and mostly in invalid condition, it can be sold at a price of about 5% of the initial sale price in the absence of use. In contrast, the product losing consumer properties can no longer be leased out. It proves that the leased goods are stable in the rental price, which primarily includes depreciation expenses and the owner’s profit and is less dependent on the product condition.
In contrast, the product’s sale price is more flexible and depends on the product condition and external factors. The given conclusions can be used to predict the sale and rental price of the product, research its life cycle and analyse the market. Figure 2 shows that sharing goods and services is less flexible concerning goods sold on the market, equating them with essential commodities.
Prices for sharing goods determine their demand, which is reflected in the supply of goods. As 2020 and 2021 featured the increasing number of Internet users and declining incomes of most of the Ukrainian population, the demand for sharing services increased according to most online stores and customers leaving feedback about products on social networks. According to Olx.ua [19], the Rozetka online store and the survey of 50 respondents on social networks, one conducted a study on the demand for shared goods depending on the individual’s income (Figure 3).
One has found out that the middle-income population is the most common user of shared services. In contrast, the people with insufficient budget (up to 172 EUR per month per person) (up to 10% of users) or with an income of more than 4312 EUR thousand per month (in Kyiv) uses shared services in small volumes, which can be the framework for the development of a strategy for promoting shared services and designing advertising campaigns [20].
Figure 3 shows that the share of the population using shared services increases with the growing income to 1300 EUR per month per person (about 60% of the demand) by some users. In contrast, the population with higher aggregate incomes tends to buy goods rather than share.
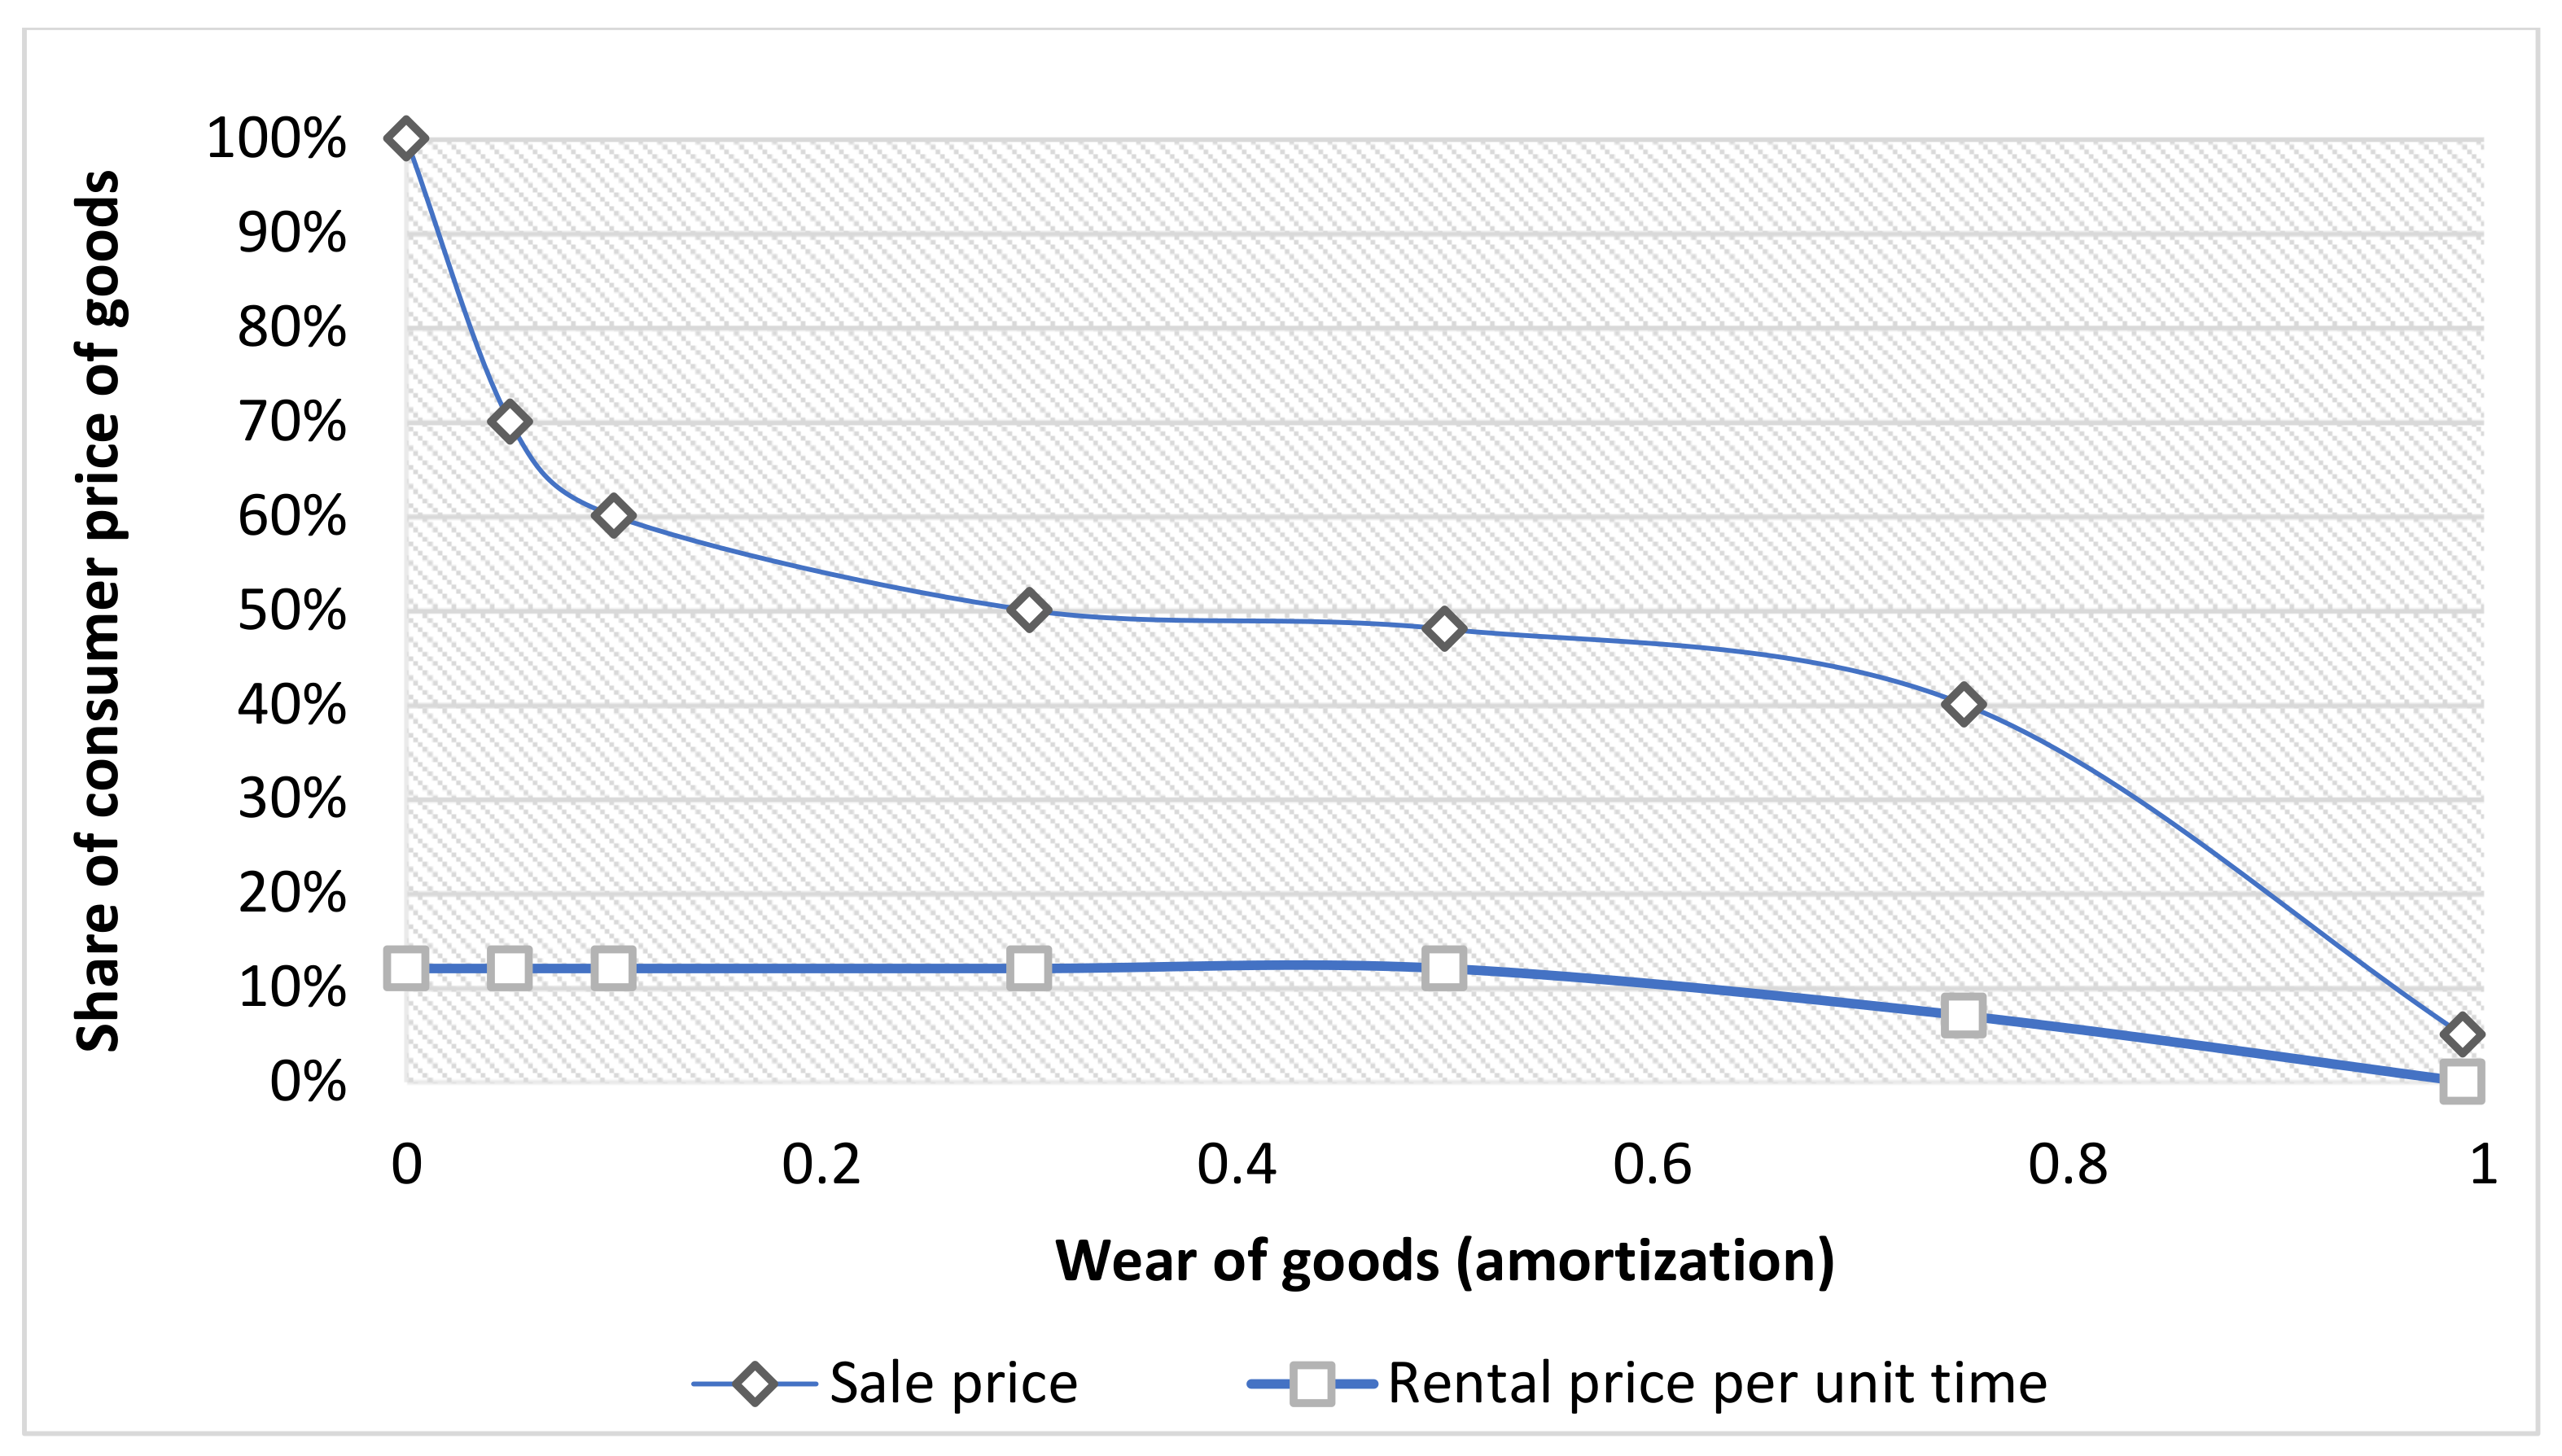
The use of shared products can be considered a source of alternative income by reducing the price of using the product. In contrast, when buying the same product and meeting the exact needs, using the required resource decreases significantly (in the case of the constant total utility function, the price is lower).
The sharing of goods and services on the Internet (for example, websites sharing software, music, apps, games) has been growing recently. Most companies develop advertising strategies based on the snob effect (Veblen goods) due to their limited number and exclusivity, leading to non-market mechanisms and increased sharing [21].
Marketers widely use the promotion of Veblen goods because of the existence of many bloggers, celebrities who advertise the product on the Internet, increasing its importance and thus increasing the demand. The establishment of the individual’s worldview as a potential customer increases the psychological dependence of people on the availability of a particular product that can shape its image and improve its status, which in turn also enhances the demand for sharing [22]. The increasing number of online transactions and the demand for remote goods create conditions for the emergence of the so-called digital market of goods and services, a part of which is sharing, allowing reducing costs and bearing no responsibility for storing goods, their proper condition and depreciation, as these obligations apply only to the owner of the goods, not the lessee.
As a country with poor environmental responsibility and education, Ukraine uses sharing to save costs and comfortably utilize goods without maintenance expenditures. At the same time, developed countries adopt the sharing economy from an eco-friendly perspective [23].
Considering sharing as a part of the concept of product rational use, we can see, at first glance, a significant increase in the life cycle of goods, which positively affects the global environment by reducing the production of goods and anthropogenic burden. The shared use of goods encourages the overproduction of goods and resource-saving and creates a more complimentary and more accessible system of user relationships. A striking example is the transport system based on sharing (public transport) and the recreational sector (resorts, hotels, entertainment, leisure areas, etc.) [24,25]. C2C is the critical trend in 2020–2021 characterised by the transfer of goods for public use from consumers to consumers using online services and social networks. People can spend the saved time on product maintenance to sort out garbage, which requires on average 15 min daily [26], equivalent to 0.34 EUR for Ukraine given the minimum wage as of 2021 [27]. Sharing helps reduce waste, improve the region’s ecological state, and establish a circular economy that creates new mechanisms of economic activity in symbiosis with sharing.
When calculating the negative impact on the ecosystem in mechanical engineering, we can see the change in all ecosystem elements around the production plant (points of influence). Atmospheric emissions during the manufacturing of vehicles are dangerous because of the release of sulphur dioxide, carbon monoxide, hexavalent chromium and other heavy metals. Operations also produce waste that gets into the water, making it poisonous and unfit for drinking and dangerous to human health and life. Soils are polluted and natural landscapes and ecosystems are changing. The industry is characterised by significant waste generated, most of which is not reused. In addition to emissions during car operation, a modern car consumes about 50 kg of oxygen per hour.
The cost of car recycling as of 2020 is 260 EUR for passenger cars belonging to individuals; 1725 EUR for commercial vehicles, which is high enough for Ukraine and this leads to illegal disposal of vehicles that negatively affects the ecosystem.
The cost of changing the ecosystem in car manufacturing is about 2587 EUR (calculated based on the negative environmental impact that should be neutralised to bring the ecosystem to its original state at Skoda Auto). Speaking from the perspective of environmental conservation, the establishment of the sharing economy has a positive effect by meeting the public demand for goods and services via joint use without buying goods, which affects the production of goods, reducing the negative impact on the ecosystem. As to the transport sector, taxi services are the main lever for establishing the sharing economy.
The population of Kyiv as of 1 December 2020, was 2,963,199 people, i.e., seven taxi workers registered in taxi services per 1000 people, and the number of private cars per 1000 inhabitants of Kyiv is about 400 [15]. Thus, the reduction of the ecosystem burden due to sharing costs about 673 EUR per day in Ukraine, six thousand EUR (63 cars per 1000 people) in Moscow, and about 1121 EUR per day in Odesa [15].
The sharing economy is closely related to the circular economy based on the increase in the life expectancy of goods through its secondary use. With the introduction of the circular economy, companies plan their development differently, so it is reasonable to develop several scenarios for further activities.
The goal of the European Environment Agency is to reduce harmful emissions into the ecosystem by 2030 and implement decarbonization by 2050, which will also lead to the introduction of the sharing and circular economy [28].
Recently, car purchasing prevails over sharing in Ukraine and the EU countries, although later one will prefer car rental in order to reduce the negative environmental impact.
In the case of the linear economy (Figure 4), we can see a situation when resources are used to produce goods designed for one owner or user, which reduces the consumer properties of goods. The market and movements of financial resources around interests are limited, which is lesser than during sharing adoption. The resource–product–consumption–waste scheme has a negative ecological effect because of the increasing anthropogenic impact caused by a large amount of waste and production, resulting from the higher demand for new goods among consumers.
One should apply European experience to adopt the sharing and circular economy (Figure 5). Let us consider, for example, an enterprise adopting the sharing economy in Latvia as in a former-Soviet country that has developed according to European standards. However, it has a range of problems and similar situations occurring in the period of the breakup of the Soviet Union and Ukraine. Latvia features a symbiosis of critical principles and laws of Europe and particularities of numerous post-Soviet countries. Ukraine can use Latvia’s positive experience in adopting European values, improving living standards and creating favourable conditions for business growth. Therefore, the research is focused on Ukraine and Latvia.
Based on the company’s activities, the authors have created three packages: pessimistic, standard and optimistic ones with different characteristics (Table 1) of implementing circular economic projects based on the company’s data as case study.

3.1. Pessimistic Package

This package assumes that the company does not change its current situation, namely does not introduce circular economy business models, does not participate in any programs to obtain a certificate ensuring and certifying eco-friendly farming of the company, does not move to other office spaces. The authors wanted to include the shift from three cars to one car and one electric vehicle in the pessimistic model. Project managers and designers mostly use the corporate vehicle. This model is intended to leave one car for other journeys, while the electric vehicle will move within the city [29]. The priority of this package is to reduce costs, and enterprises do not prioritize the integration of circular economy business models.

3.2. Standard Package

The standard package is based on introducing some circular economic projects, namely the company’s more advanced industrial symbiosis. As mentioned above, the company should return by-products generated by the production process to local farmers. Still, the company is expected to accumulate more shavings and sell them to particle collectors to produce other goods. Implementing such a project requires additional expenses related to the accumulation of saws, but the proceeds from their sale are expected to cover the maintenance costs. The authors contacted several shavings purchasing companies such as Reinpaul OU, Tikala ID, Ltd. Vegranti and Ltd. SK Green Energies. They concluded that the average purchase price of shavings is 6 EUR/m3. The minimum number of shavings acquired by these companies is 500 m3. Thus, the company will require additional premises for storing 100 m2 of shavings (Formula (1)), given that the ceiling of the production building is 5 m [30].
S = V h = 500 5 = 100   m 2
where: S—required area of the room (m2); V—the volume of shavings/the volume of required storage premises (m3); h—building ceiling height (m).
The company owns the production building. During the interview, the authors has found out that the company pays approximately 1.20 EUR/m2 for heating the production building within the season (which does not include overhead expenses such as management, repair, etc.). Therefore, the cost of maintaining this building will be around 120 EUR per month. However, it should be noted that this building requires heating throughout the year in order to ensure the appropriate maintenance conditions (humidity, air temperature, etc.).
According to this package, the company is not expected to move to another building because it owns the current office building. As mentioned above, the company carried out marketing campaigns: Replace old things with new ones. However, this standard package provides that Furniture Factory customers return the worn-out chair to the company rather than throw it away. Like the suspicious package, the standard package implies that the company will shift from three cars to one car and one electric vehicle.

3.3. Optimistic Package

This package significantly differs from the above-mentioned packages. It is focused on the improvement of the environment. Therefore, unlike the previous two models, the initial expenses in this package will be higher and will be eventually paid off.
According to the optimistic package, the company adopts a partial circular economic business model, from a product to a service, as the full shift to this business model can face a number of risks [31]. In the optimistic package, the company is expected to lease out 200 office chairs for five years, amounting to 300,000 EUR, while the lease for five years will cost 183,153 EUR, assuming an investment return of 10% per year (Formula (2)) [32].
FVn = P0 * (1 + i) n = 300,000 * (1 + 0.10) * 5 = 483,153 EUR
where: n—period; i—interest rate; P0—opening amount; FV—future value.
One can conclude that the enterprise will receive 36,630.60 EUR annually from the lessee or 3052.55 EUR per month for 200 leased chairs.
On the other hand, assuming that the company produces 200 office chairs for 300,000 EUR, we can conclude that the lessee will pay 15.26 EUR per month for 1 office chair. As part of the study, one calculates the introduction of the circular economic model provided the following:
  • within the first 3 years, one produces 600 chairs and leases them out to three companies (A, B and C), 200 chairs to each one;
  • the company produces 200 chairs for company A in 2019;
  • chairs are leased out for 5 years and then returned to the company;
  • the cost of producing 200 chairs is 300,000 EUR (information was defined during the interview);
  • the returned chairs are renewed and become available for further leasing;
  • along with chair leasing, the company also sells its products.
Based on these conditions, the authors summarizes revenues and losses from the enterprise’s partial shift from manufacturing to providing services in Table 2.
Following Table 2, one can conclude that the enterprise will earn 163,532 EUR within seven years in case of shifting from products to services. The overall benefit over the seven years will be 399,459 EUR. Still, the project will start paying off on the sixth year, i.e., from 2025, when the overall benefit of the project will be 107,828 EUR, while on the fifth year the project won’t pay off with a total loss of 210,433 EUR (Figure 6) [33].
The authors have calculated the overall benefits obtained if these chairs are renovated and leased to companies A, B and C, for the next five years. Given that these chairs are refurbished rather than re-made, the initial expenses are significantly reduced, resulting in the expected benefit of 287.75% higher compared to the first 5-year cycle of 1,548,918 EUR. Leasing out over 200 chairs to three companies for 10 years, NPV will be 940,315 EUR, so it means that the company is also worth leasing out along with product selling.
Besides the introduction of the circular economy business model ‘from a product to a service, the company is expected to acquire the ISO 14001 certificate showing that the company cares about the environment and reduces the amount of waste generated by the production process through reuse, recycling, sharing and reducing the number of environmentally unsafe products through targeted research [34]. Similarly, the company moves to building A, corresponding to the LEED certification to reduce the consumption of resources.
Such a building is located near a centre of a North European capital city and surrounded by bank branches, cafes, shops and features easy and fast public transport. This building has 12 offices, and the authors believe that Furniture Factory should move to office 3A with an area of 415 m2, which is 85 m2 less than the current area. The rental fee for this office is 13 EUR/m2, the service charge is 3.80 EUR/m2, while the average water and energy consumption in this office ranges from 450 to 500 EUR, which is not included in the rental cost.
The total rental cost for the company will be 6972 EUR per month (Formula (3)) [35].
Cr = S * (R + SC),
where: Cr—Rental costs; R—Lease; SC—Service charge.
During the interview, the authors has found out that the company currently owns the 500 m2 building while the cost of maintaining the office is 2 EUR/m2. So, the company currently pays 1000 EUR per month for office maintenance on 177 Freedom Street.
As environmental improvement is a priority for the optimistic model, this package implies the purchase of two electric vehicles to be used by the project manager and designer.
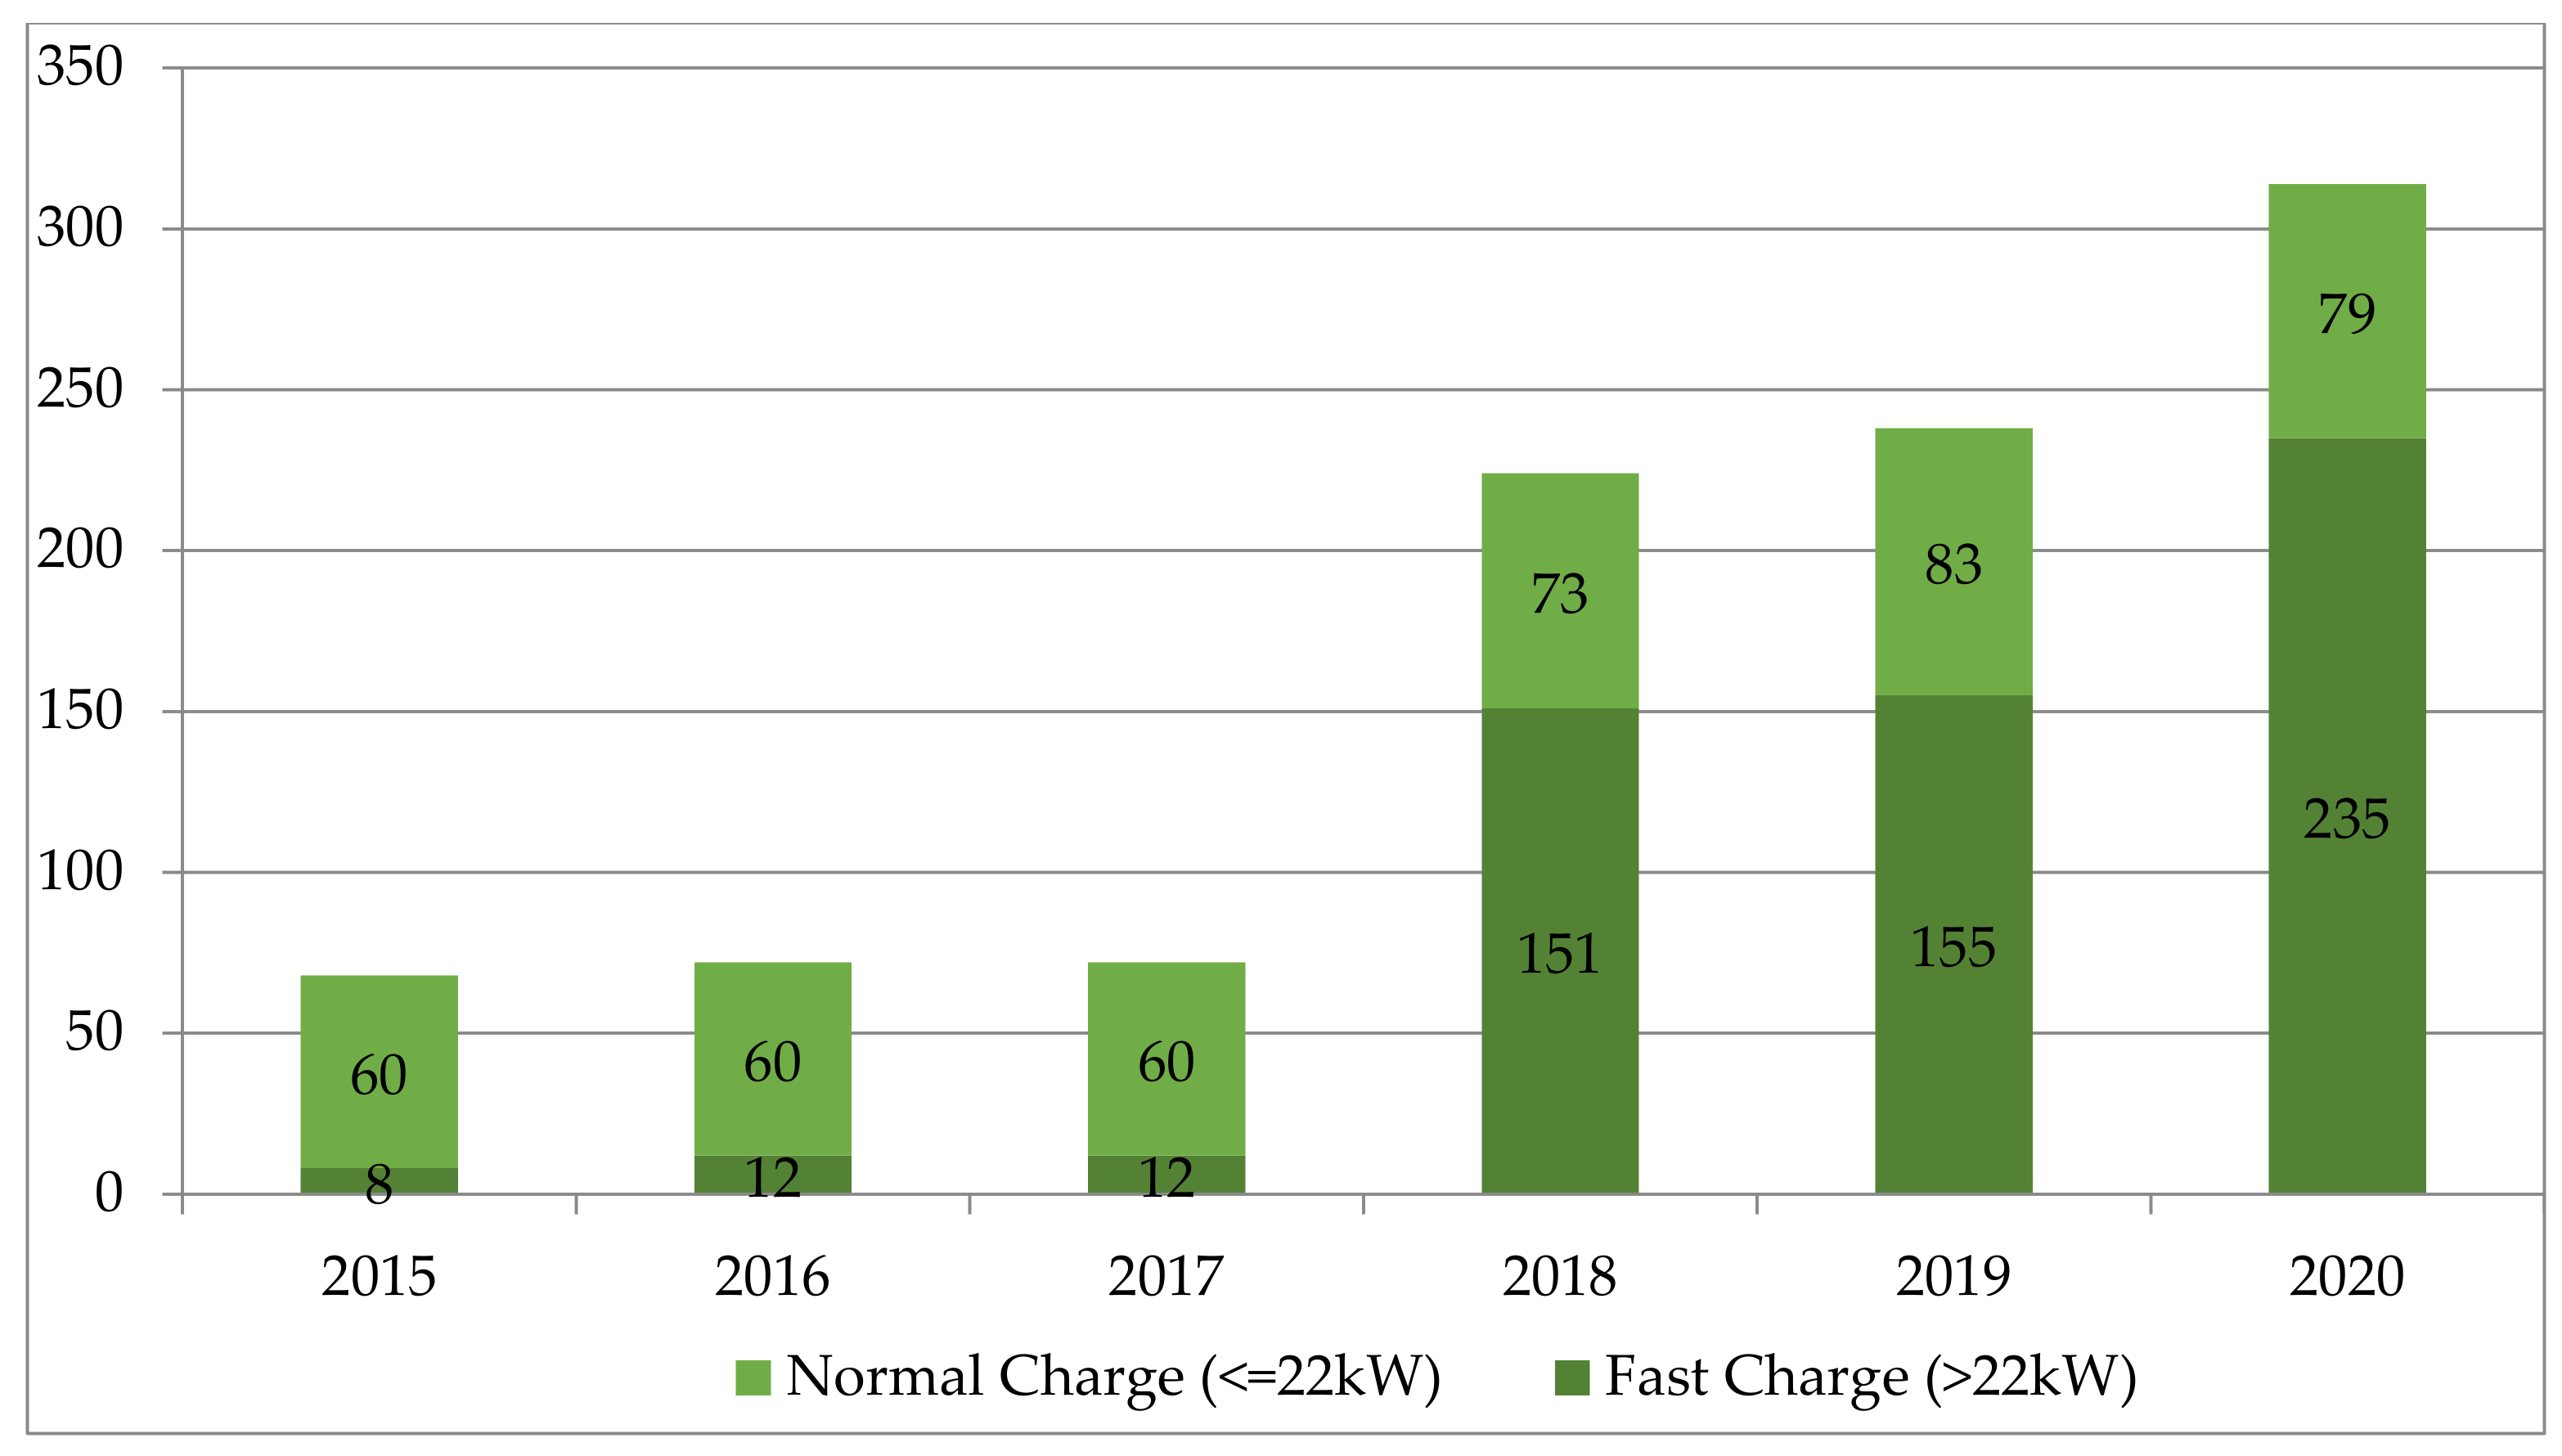
The authors believe that the purchase of electric vehicles contributes to the future of the company as well as to the environmental friendliness. For example, Latvia has 72 charging stations, eight of which are located in Riga (CSDD, 2019). Electricity fees in Latvia also include the total number of electric cars. Total number of normal and fast public charging points in Latvia are shown in Figure 7.
The purchase of electric vehicles in Latvia remains quite popular: in December 2018, the number of electric vehicles was the highest since July—2079; the amount of electricity transferred increased to 29,485 kWh while in February 2019, it decreased to 22,312 kWh, which was caused by the bad weather on roads.
Therefore, drivers prefer public vehicles. Besides, the electric car battery should always be fully charged in the winter. Otherwise, a half-empty battery freezes and cannot be used seamlessly after charging. In Table 3, the authors summarize the range of electric vehicles offered in Latvia in 2019 that could meet the needs of enterprises.
According to Table 3, it would be more profitable for Furniture Factory to acquire Hyundai Kona Electric because, first of all, the model of this brand offers a maximum distance of 449 km, so the company would be able to travel further outside the city and would not depend on charging stations.
Secondly, electricity consumption is 154 Wh/km, 12 Wh/km more than in KIA Soul EV. Still, we should note here the maximum distance to be travelled: Hyundai’s length exceeds twice KIA’s space. At the same time, both models have the same price: 39,990 EUR.
Thirdly, it is possible to change this model at home using the standard household outlet, but the full charge of the 64-kWh battery is considered to take 31 h. The battery can be charged quicker using a particular home charging station: in 9 h and 35 min.
Fourthly, this model has received the 2019′s Latvian car innovation prize and the 2019′s Latvian eco-car, which shows its popularity and recognition on the Latvian market [36]. Assuming Furniture Factory buys two above-mentioned cars for 79,800 EUR.
Loading of electric vehicles would cost 73.92 EUR per month, taking into account 1200 km per month and 154 Wh/km (Table 4); the loading charge would be 0.40 EUR/kWh [37]. On the other hand, car refunding would cost 100 EUR per month (see Annex 4). In order to ensure the comparable prime cost of electric cars and common cars, it is assumed that the two vehicles travel the same distance of 1200 km per month.
Note that the authors have made a number of additional assumptions during the study (for each package, see Table 4):
  • The discount rate is set at 4% based on Chapter 1.4 of the aggregated scientific literature and best practices in similar projects;
  • Prices rise due to the inflation rate of 2.5% in 2020;
  • The project would be implemented on 1 January 2020, and chairs produced in 2019 would used at a total amount of 300,000 EUR;
  • Annual sales of shavings: 1000 m3 (information obtained in the interview)
  • As part of the study, the authors calculate the following:
  • The cost of Furniture Factory without the introduction and adoption of the circular economy for each package (pessimistic, standard and optimistic);
  • Total benefits or losses from the implementation of circular economic projects;
  • The net present value (NPV).
As shown in Table 4, the cost of the suspicious package amounts to 83,164 EUR. In comparison, the cost of implementing circular economic projects in the standard package amounts to 87,284 EUR, which is 4120 EUR, or 4.9%, more than in the suspicious package [38]. It is primarily related to the expenses for the company’s marketing campaign.
In the optimistic model focused on sustainable environmental development rather than cost reduction, the expenses for implementing circular economic projects in the first year are 390,670 EUR, which is 303,386 EUR more than in the standard model. The increase in costs is related to the circular economy business model, from the product to the partial shift to services. As part of this project, the company will produce additional 200 chairs cost 300,000 EUR and move to the LEED certification building [33]. The suspicious package of enterprise financial results between 2020 and 2024 is presented in Table 5.
Following Table 5, one can conclude that the circular economy projects mentioned in the pessimistic package should be implemented, as they provide the company with additional benefits: NPV over 5 years at a discount rate of 4% is 49,579 EUR, which is quite positive.
The standard package of enterprise financial results between 2020 and 2024 is presented in Table 6.
Following Table 6, one can conclude that the circular economy projects mentioned in the standard package should be implemented, as they provide the company with additional benefits: NPV over five years at a discount rate of 4% is 66,033 EUR, which is quite positive.
Comparing the standard model with the pessimistic one, we can see that NPV of the company in the standard model at a 4% discount rate over 5 years is 16,454 EUR, or 33.2%, higher than in the pessimistic model. This is mainly due to the circular economy industrial symbiosis model included in the standard model, namely the sale of by-products (particles).
One can conclude that when choosing between these two packages, the company should prefer a standard package because the overall benefits over 5 years are higher than in the pessimistic model.
The optimistic package of enterprise financial results between 2020 and 2024 is presented in Table 7.
Following Table 7, one can conclude that the implementation of the circular economy projects mentioned in the optimistic package causes losses to the company, as NPV over 5 years at a discount rate of 4% is 142,969 EUR, which is quite negative.
However, this is only if all projects mentioned in the optimistic package are implemented. If one adopts only the product-to-service business model, it brings overall benefits to the company (Table 2). Apart from losses to the company in the optimistic package, one assumes that the company moves to another building, resulting in additional expenses for the company compared to the current office costs. The overall benefits of the company’s optimistic package are obtained if the company does not move to a new office building (Table 8). Following Table 8, we can see that without the company’s moving to the building corresponding to the LEED certificate, the overall benefits of the 5-year optimistic package would be 259,026 EUR. On the other hand, NPV would be 191,773 EUR, which should be considered positively. This is mainly due to the company’s partial shift to the product-to-service business model. However, this result is possible only if the company receives used chairs back in 2024 and does not immediately conduct their repair leading to increased expenses.
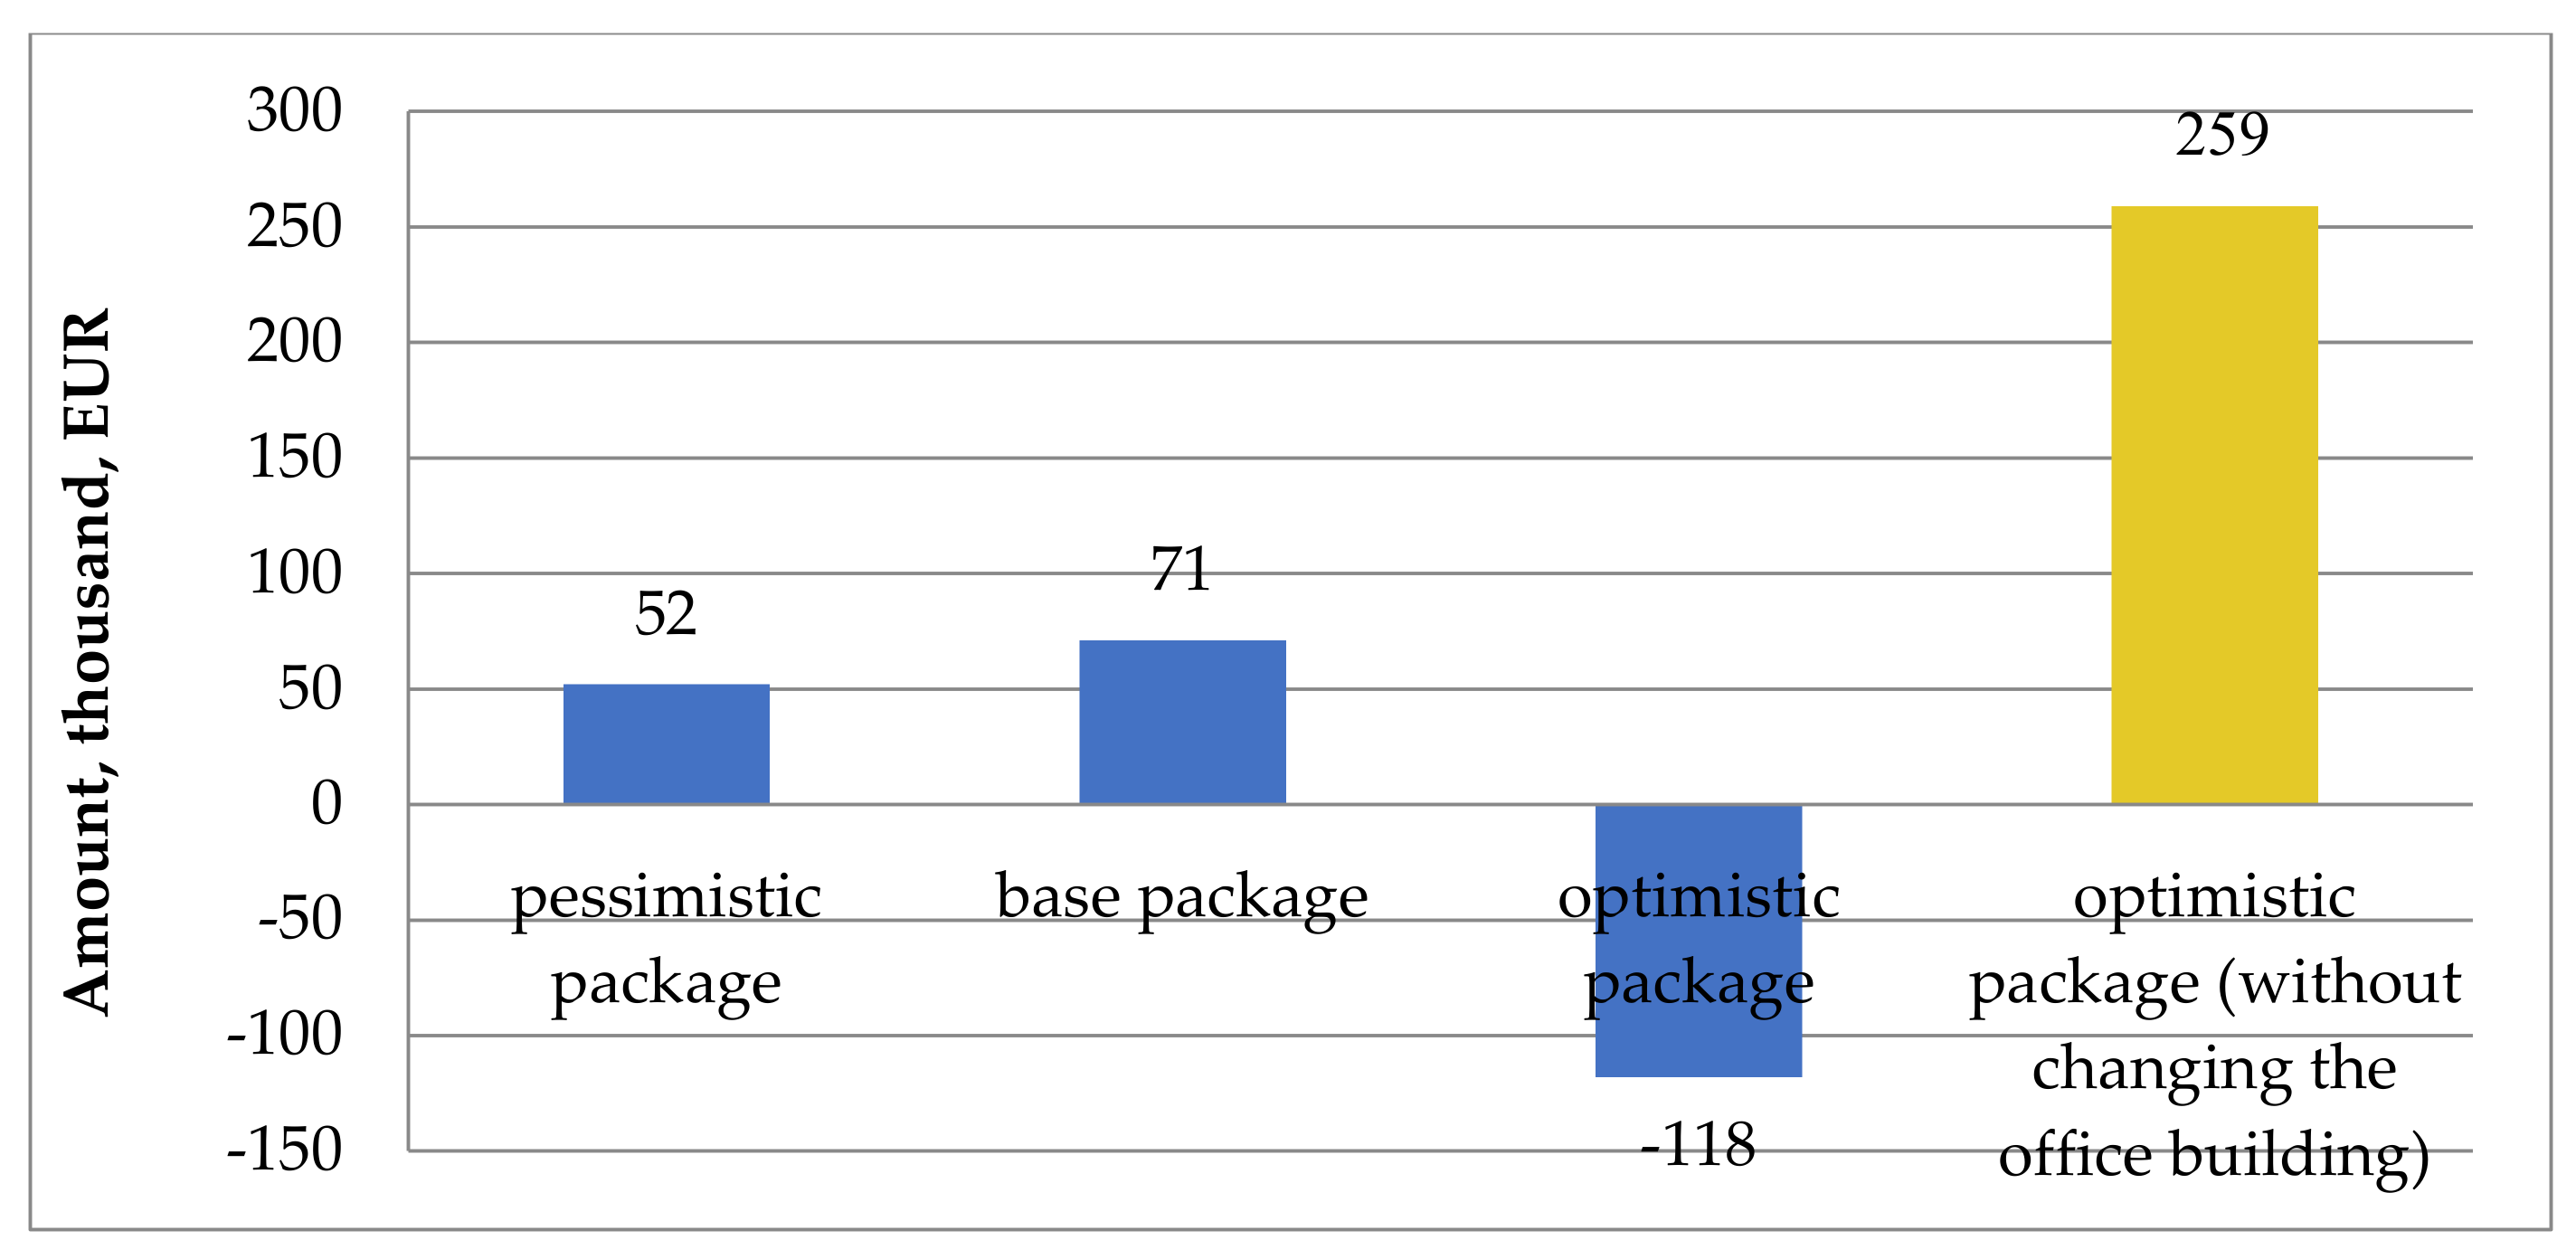
In Figure 8, the authors summarize the total benefits or losses over 5 years for each package.
Following Figure 8, it is more beneficial for the enterprise to adopt the standard package between the standard and suspicious packages. The total benefits over five years are 18,800 EUR, or 36%, higher than in the suspicious package.
On the other hand, the authors point out that the optimistic package results in a total loss of 117,664 EUR over five years, as the number of projects is expected to be implemented in this package. The main reason for the losses is company’s moving to the new office building. If the structure remains the same, the total benefits for the company would be 259,026 EUR.
The authors conclude that the company should implement projects in the optimistic package and stay in the existing office building. The critical circular economy project that the company should implement is the partial shift to the product-to-service business model, which creates additional benefits.
In Formulas (4)–(7), the authors compile and calculate the financial ratios of Furniture Factory for 2017 affected by the adoption of circular economy business models. They use the company’s 2017 annual report for the calculation, as well as the company’s 2016 and 2015 annual reports to compare the results obtained in previous years.
ROE   2017 = 267,366 504,700 + 237,333 / 2 = 72.1 %  
One concluded that Furniture Factory had a high return on equity of 72.1% in 2017. The introduction of circular economy business models is expected to result in increasing revenues, so ROE will grow. However, if this does not happen, the company should find the cause.
The period of 2015–2017 is shown in Figure 9.
The ROE indicator is essential for owners as it shows the return on invested funds. According to Figure 9, the company’s ROE is volatile: 35% in 2015, but 55% in 2016 because of the company’s losses this year (211,370 EUR). However, in 2017, it increased to 72%, which should be considered positively, as it means returning of 0.72 cents from each EUR invested and receiving of 0.39 cents in 2015 from the owners of each 1 EUR invested, while in 2016, the owners did not obtain any profit on their investments, as the figure was negative.
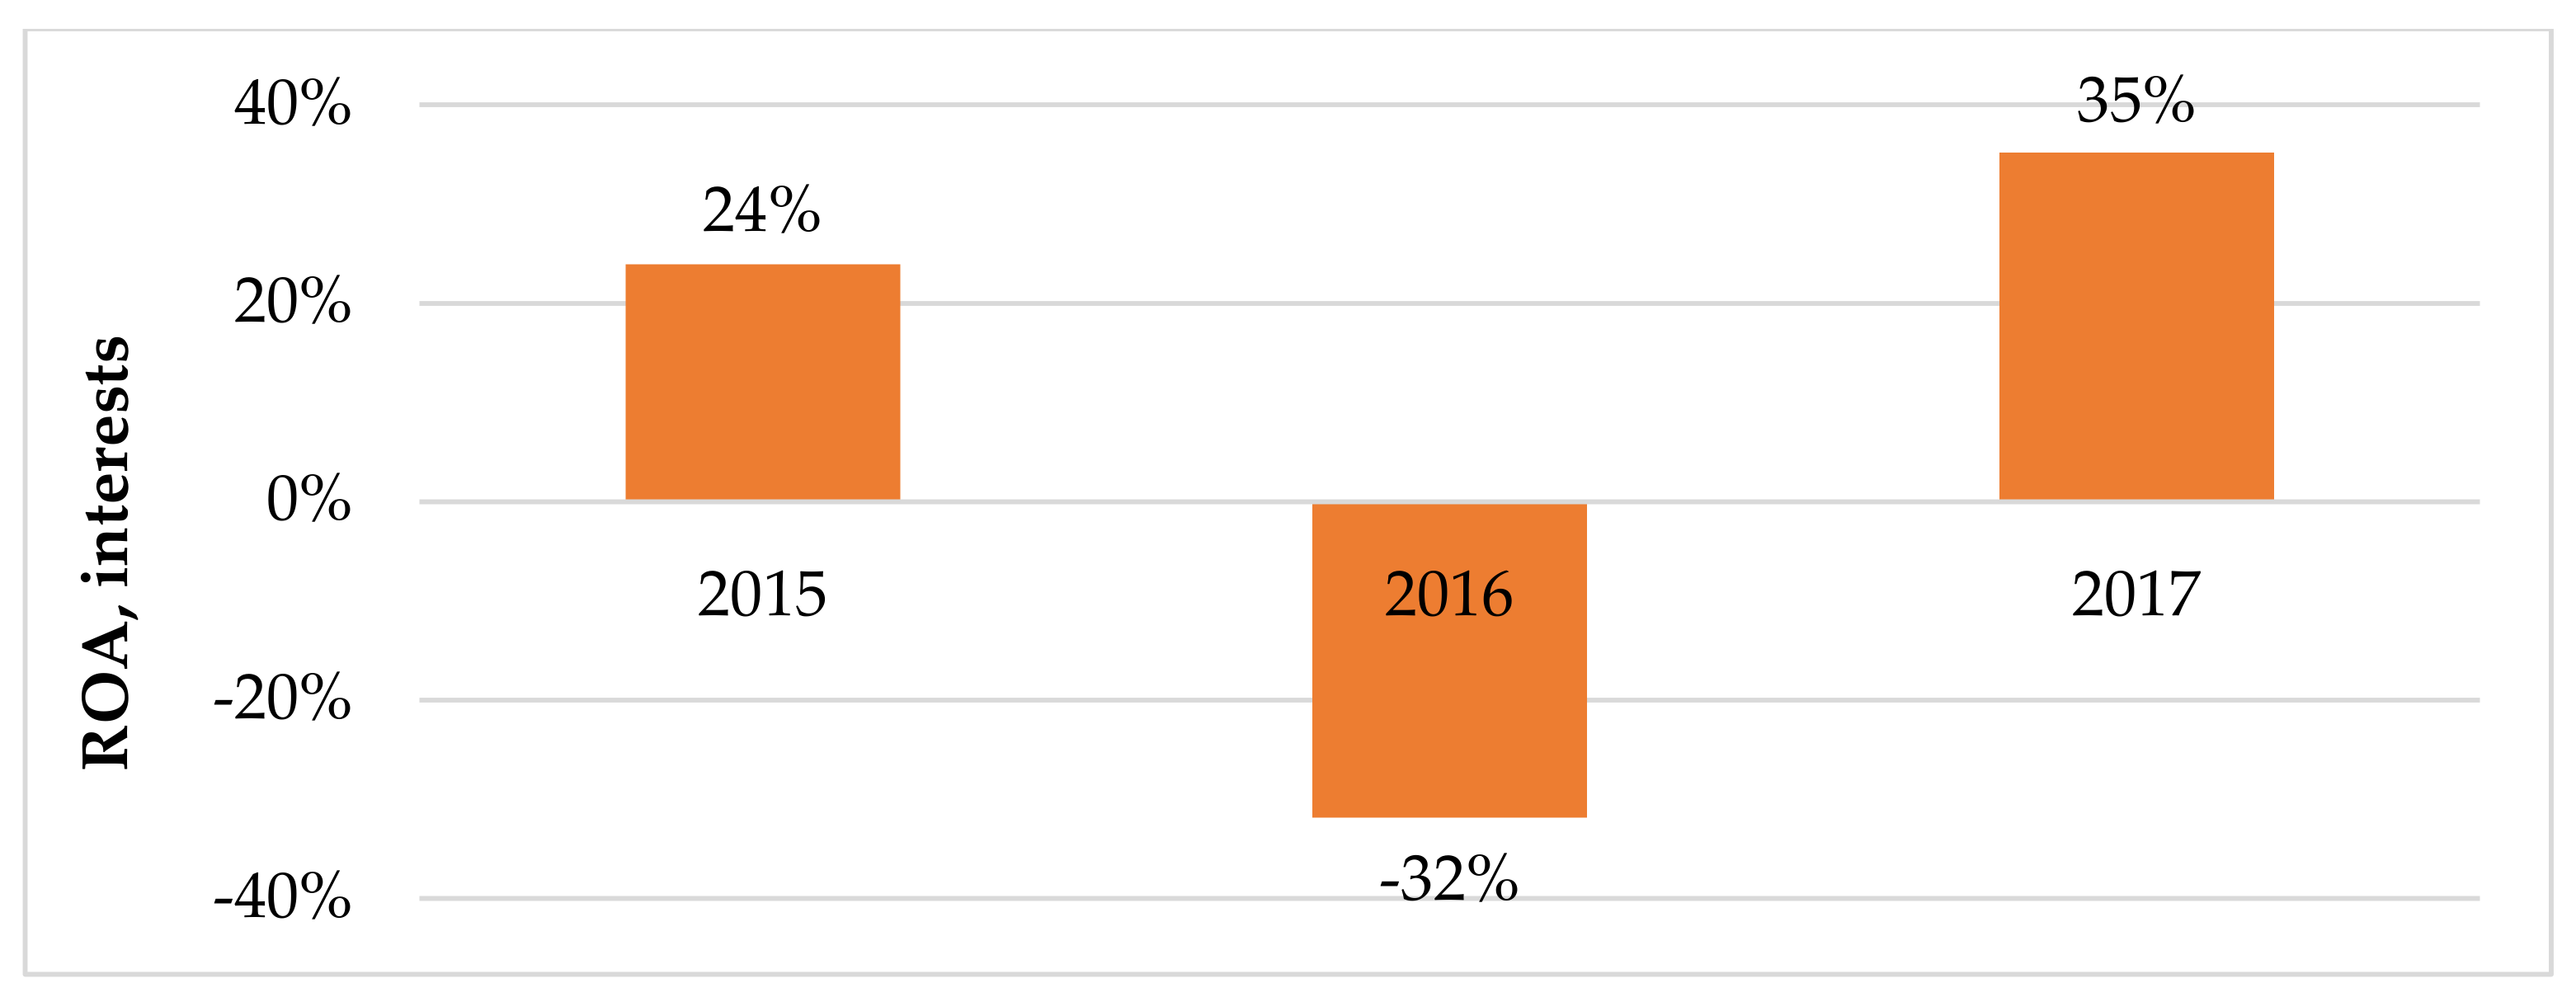
At the return on assets of 35.2% (see Formula (5)), we can see that the company efficiently uses funds in its operations. The adoption of circular economy business models is expected to increase the company’s revenues so that ROA will also increase in reducing expenses.
However, suppose ROA decreases after adopting the circular economy. In that case, one should conclude that the introduction of the circular economy does not benefit the company and that expenses are not reduced.
ROA   2017 = 267,366 956,056 + 574,382 / 2 = 35.2 %  
The period of 2015–2017 is shown in Figure 10.
ROA shows how efficiently the company uses funds in its operations. We can see that ROA shows a similar trend as ROE, which is harmful in 2016 because the company suffered losses. The return on assets in 2015 was 24%, while it increased to 35% in 2017, which should be considered positively.
The debt-to-equity ratio (D/E) of 87.4% (see Formula (6)) indicates that the company depends on borrowed capital. The company should closely monitor its share of liabilities. It could be difficult for a company to obtain a loan at that rate. However, note that it is 2017′s data. The situation could be better in 2018.
Analyzing the annual reports, the authors found that the most significant proportion of short-term liabilities accounts for other loans, primarily from Carpa Ltd. and financial leases. In our case study, the owner of Carpa Ltd. and Furniture Factory is the same person. In 2017, Furniture Factory received 90,000 EUR of interest-free loans from Carpa Ltd. for an indefinite period, amounting to 86.25% of the total amount of other loans, or 20.39% of the total amount of liabilities in 2017.
D / E   2017 = 441,356 504,700 = 87.4 %
The debt-to-equity ratio in the examined years (2015–2017) was the highest in 2016: 136%. This is primarily caused by the company’s losses this year (202,094 EUR), consequently reducing equity.
Besides, the debt-to-equity ratio grew in 2016: total liabilities raised by 49% in 2016 compared to 2015. The increase in liabilities was related to the rise in the other loans item, like 2017. The company received an interest-free loan of 90,000 EUR from Carpa Ltd., resulting in increasing liabilities.
On the other hand, in 2015, the debt-to-equity ratio was the lowest in the examined years, namely 43%, as the company did not receive any loans from related parties (like 2016 and 2017). Thus, the total liabilities were the lowest this year: 225,355 EUR.
The total liquidity shows whether a business entity has sufficient working capital to cover its short-term liabilities. The furniture Factory indicator is within typical limits in 2017 (Formula (7)).
Note that the calculation of the total liquidity considers short-term liabilities where the company’s key share accounts for the other loans section, namely financial leasing and primary loans from related parties in the examined years from Carpa Ltd.
Total   liquidity   2017 = 621,120 424,662 = 1.5
Following Formula (7), one can conclude that the company is a part of all examined years within the optimal limits of total liquidity (1–3). However, note that in 2016, the company’s total liquidity was close to the lowest optimal threshold, i.e., 1.1, which cannot be assessed too positively, as when this figure falls below 1, the company could fail to settle short-term liabilities. In 2015, however, this indicator reached the optimal upper limit of 3, which cannot be judged too positively. If this indicator is above 3, it means the use of inefficient working means. On the other hand, in 2017, the company’s total liquidity was 1.5, which should be assessed positively based on information from Lursoft (2019), and 0.70 on average in the sector in 2017 [33].
The authors believe that the calculated financial ratios and indicators contained therein provide valuable information to the company on adopting of circular economic business models.
The practical part of the study allows us to conclude that the company can successfully integrate circular economy business models in order to ensure positive NPV.
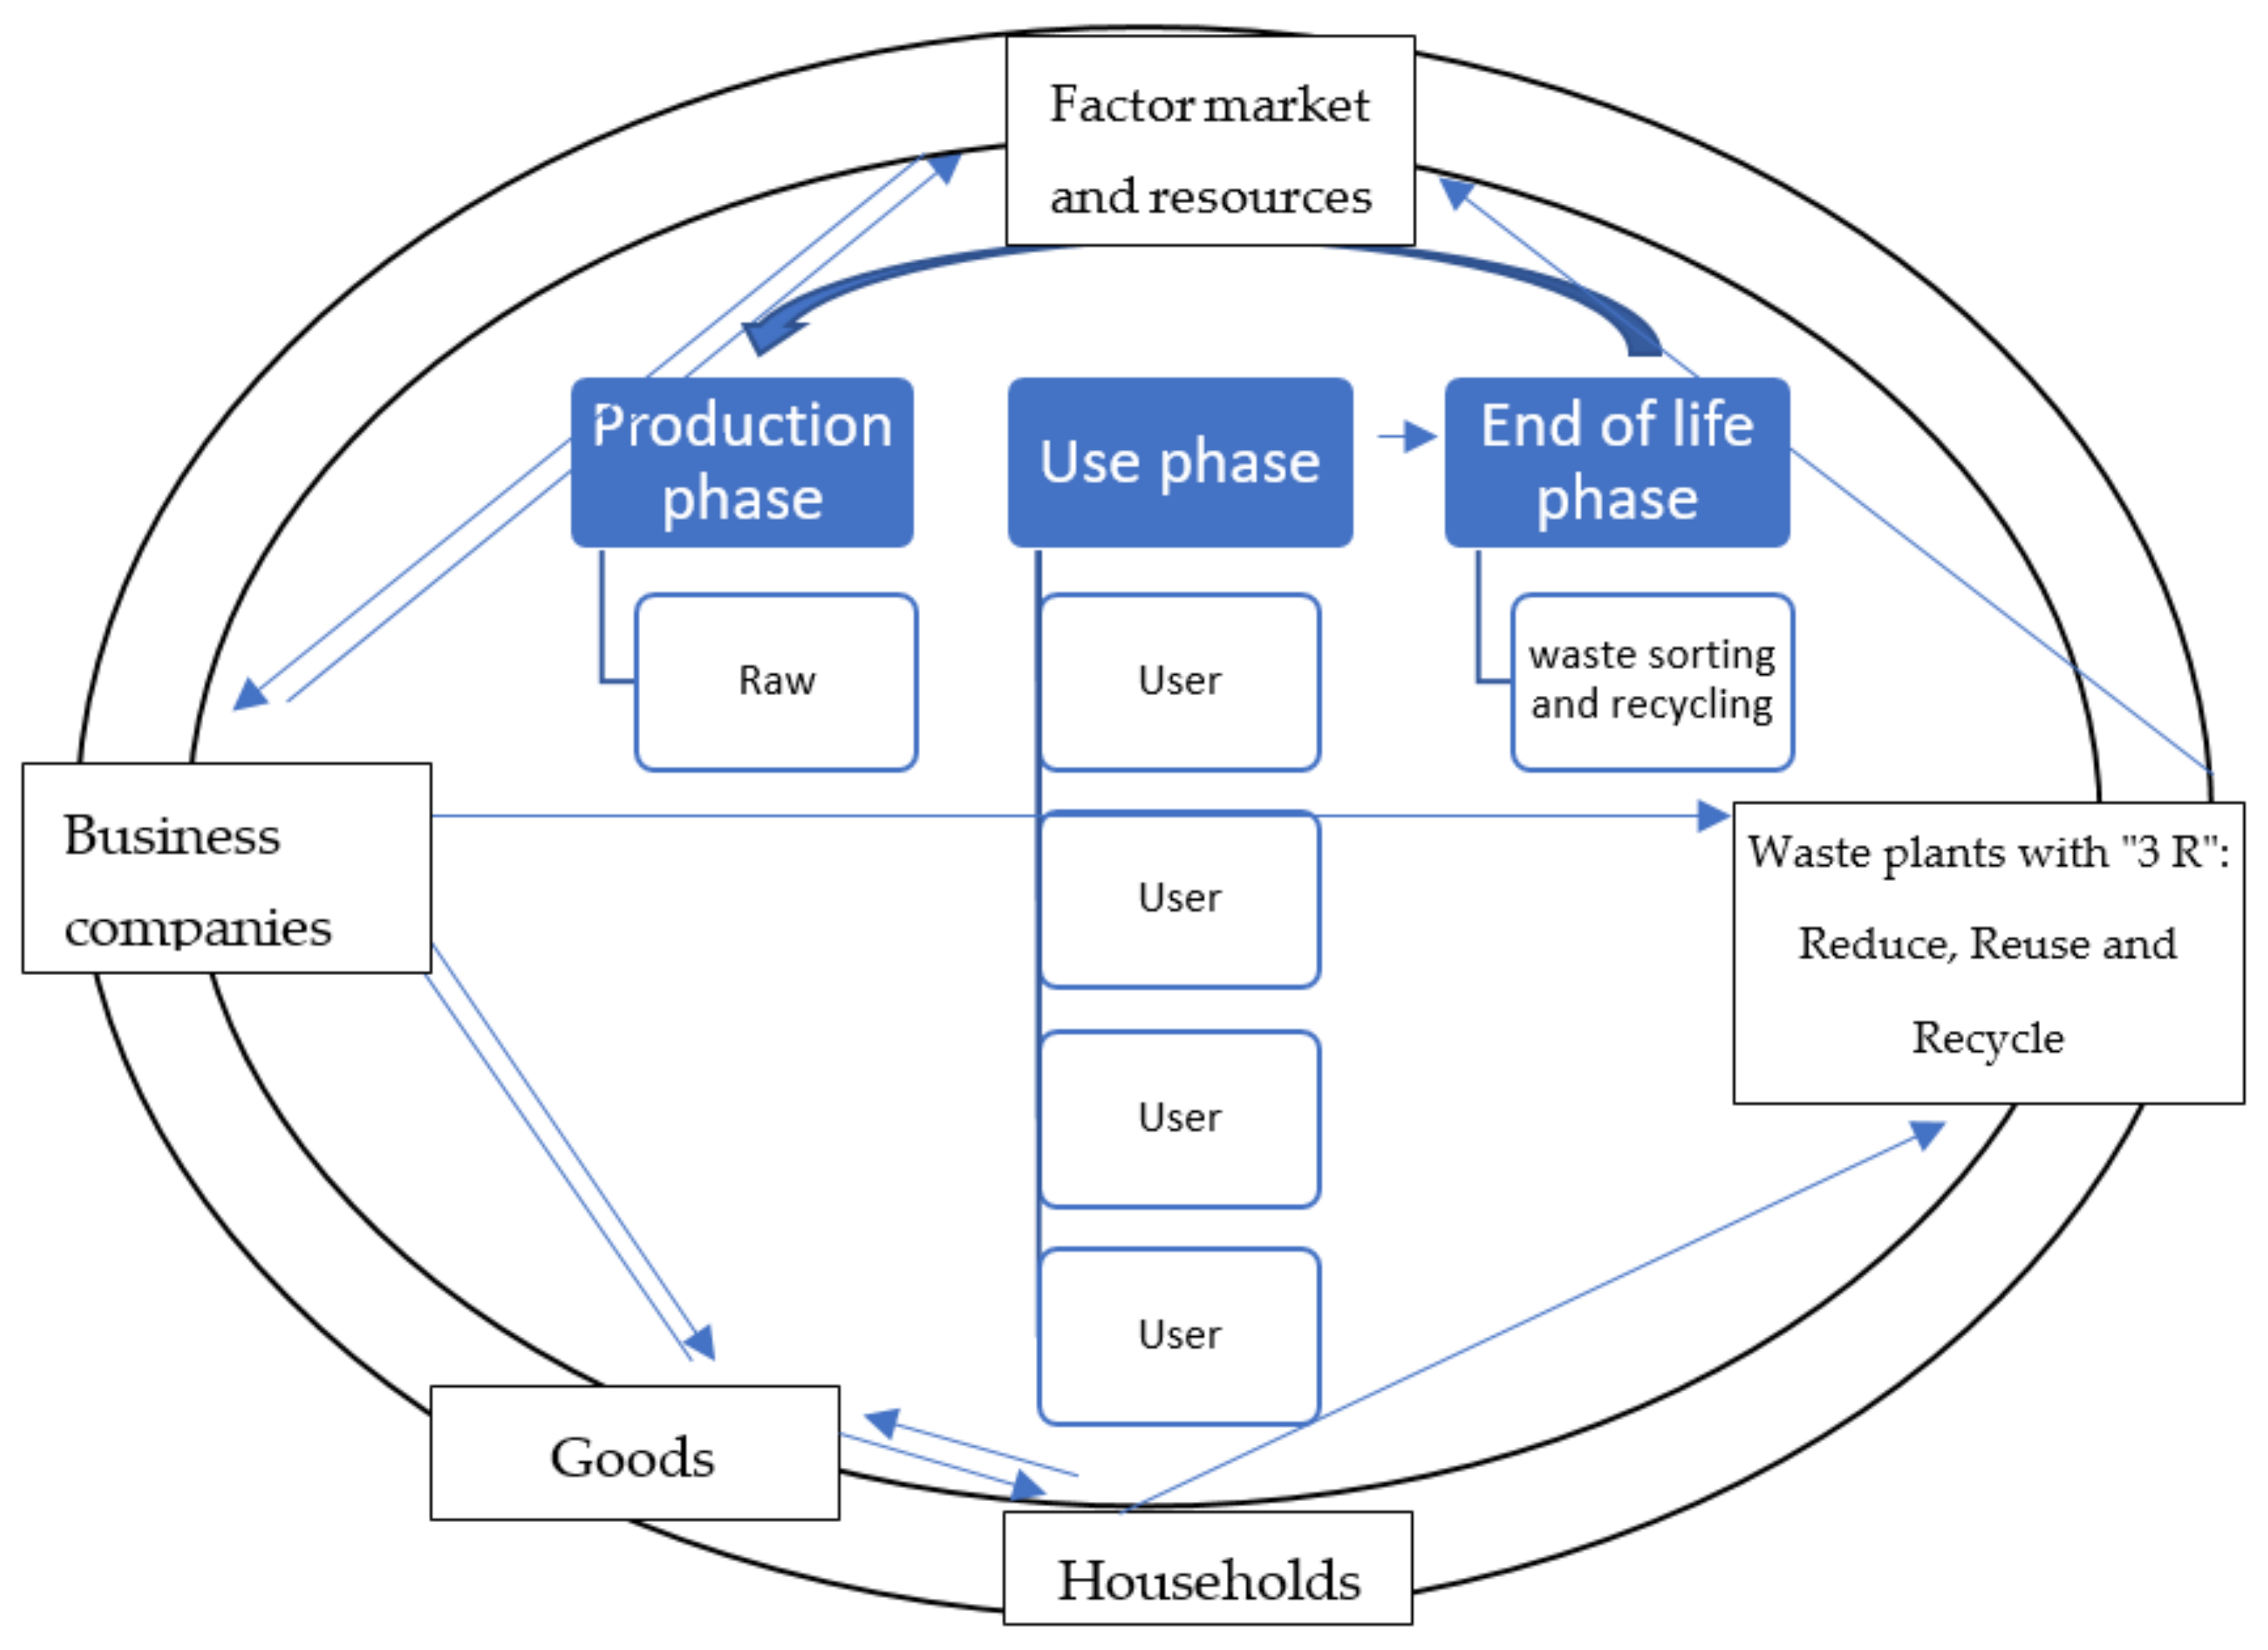
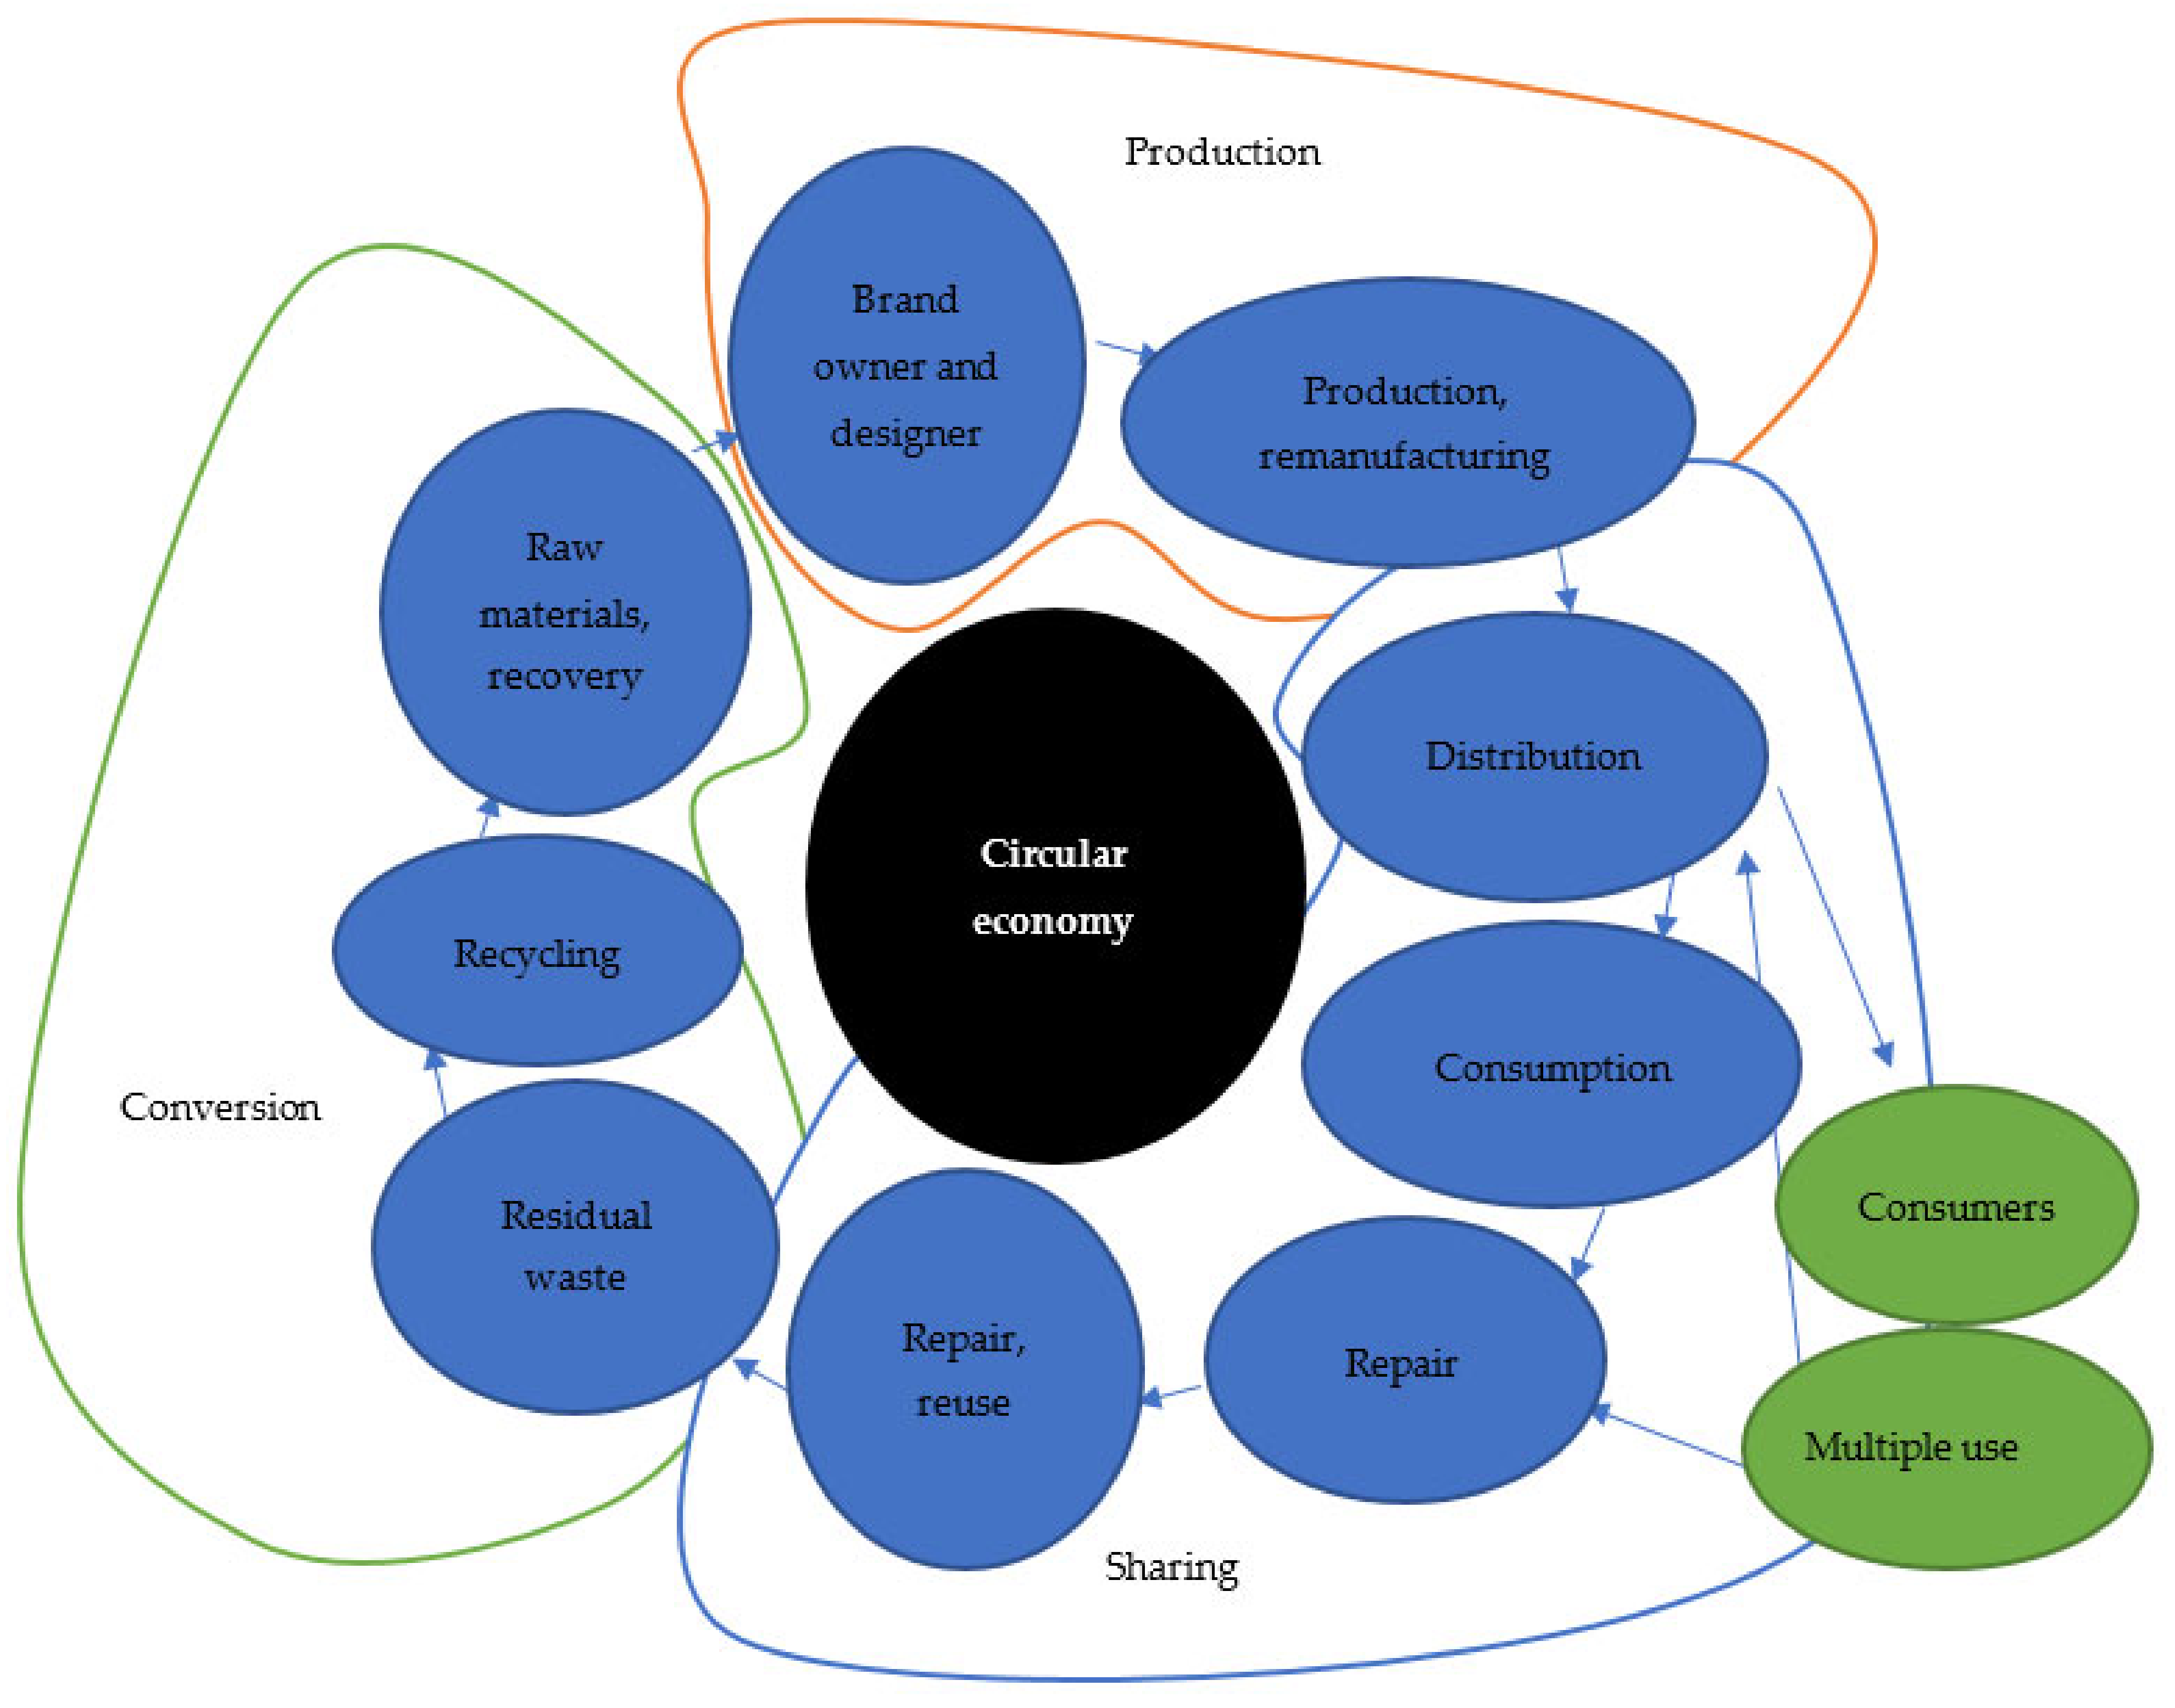
Considering environmental damages caused by the anthropogenic impact on the ecosystem, it is reasonable to adopt the principles of sharing economy at enterprises (Figure 11), which will positively affect company’s economic performance in the long run [39].
Considering the circular economy theory from the perspective of its increasing efficiency, it is reasonable to adopt sharing, as its part that functions at the stage of selling and using, which will substantially enhance product usefulness and prolong the life span of goods. The principles of sharing economy supplement the principles of circular economy, making it more flexible and comprehensive due to alternative options and information technologies [40]. Additional advertising of shared goods can boost sales of new similar products, increase the money turnover and the number of transactions, positively affecting macroeconomic indicators [41]. The functioning of the circular economy system will encourage resource-saving and energy-saving, manufacturing rationalization and reduction in negative remnants, which is a part of the zero-waste concept popular in numerous developed countries. The production stage also faces changes while adopting the circular economy, which have positive economic and ecological effects [42]. The introduction of the circular product movement system can also lead to changes in social life. We could see a sharp increase in employees in information, digital, innovative and services sectors. At the same time, one could reduce the share of inhabitants engaged in the manufacturing and extraction of primary resources. The foundation for the shift to the fully efficient circular economy is the recycling of goods and automation of manufacturing processes, giving an impetus for developing cutting-edge systems, software, innovative technologies, and their integration into life. Sharing is a model for establishing a robust system of small and medium businesses that are critical taxpayers in such developing countries as Ukraine and an efficient tool for improving the economic state. The authors can conclude that sharing is a part of the circular economy that should be implemented in society to achieve strategic national goals and improve the quality of social life and the ecosystem.

4. Discussion

Global experience has shown that companies in the sharing economy are achieving international success at an unprecedented rate. In developing countries, with the introduction of Internet technologies, the problem of limited resources and the production of substandard goods contribute to the introduction of sharing and the circular economy. However, the overproduction and insecurity of local producers pose a problem for entrepreneurs. The transformation of the economic system is slow in the post-Soviet countries, while Internet services are developing rapidly, but this is leading to Internet fraud and poor-quality services [43,44].
Urbanization processes also contribute to the development of sharing by reducing the distance and increasing access to rental goods, which should be studied in the time interval to analyze other trends.
The choice of a specific strategy for different activities primarily depends on the company’s management and the government, although global trends have an increasing impact on the results. The rapid development of technology makes it necessary to evaluate the financial situation and choose the most convenient ways of developing the company. In this case, it is more convenient to adapt the experience of other companies and adapt to their interests. As sharing has a resource-saving effect, except the economic one, it should be adopted in all countries where it is possible to increase the product life span. In Ukraine, the widespread use of sharing can be prevented by insufficient financial resources of the population, the absence of the Internet and the out-of-date way of thinking among residents above 60 years of age. The concept of doing business in Ukraine and most post-Soviet countries is still based on maximizing profits in any way. At the same time, European trends focus on other areas, including the environment, used to improve the welfare of the population. All of this affects projects implemented in developing countries where short-term business models prevail and the anthropogenic impact increases, which will lead to the point of no return and the rapid shift to the sharing economy and reuse of goods and resources in the future [45].
As the problem of nature conservation and reduction of non-environmental production capacity with a simultaneous increase in products sold on the market is relevant and has a cumulative effect, this research has prospects for further improvement. The adoption of the sharing economy is dynamic due to the development of innovations that affect all processes of human life. The imbalance between human beings and the environment increases, and the risks grow. Therefore, the discussion of this topic is promising in further research.

5. Conclusions

Increased digitalization has led to increased provision of shared services, which is especially noticeable in developing countries due to the relatively low level of income and the tendency to save financial resources without additional expenses for their maintenance.
According to Ukrainian websites engaged in selling shared goods and services, the rental price of goods is less flexible than the sale price of similar interests on the market within the country. As a component of the circular economy, the sharing model promotes not the overproduction of new things but the rational use of those already produced, which can significantly reduce the amount of waste generated at all stages of the product’s life cycle. Sharing is one of the factors in establishing a circular economy. The increase in the life span of goods and the enhancement of their social utility can positively affect economic indicators and ecological parameters. They can encourage resource-saving and adoption of the Zero waste concept.
Analysing the range of shared goods, we can see the greatest demand for goods and services with a purchase price of less than 1000 EUR for Ukraine, which indicates the unsatisfactory economic situation of citizens and the use of sharing primarily to save household finances while the environmental effect is not of high priority for the population of Ukraine. When developing scenarios for further development through the example of the furniture company, one has found out that the optimistic system based on the principles of the circular economy has a higher prime cost and a more extended payback period primarily because of marketing losses.
The calculations shown can help develop methodologies to help companies justify raising financial resources for circular economy measures.
The research reveals that the company’s lease and subsequent repair and sale or restoration of sharing is more environmentally friendly. It is based on the circular economy principles, waste reduction, resource-saving for production and increase in product life. Due to the adoption of an optimistic model, which is preferred, more environmentally friendly and establishes the principle from simple production of goods to services for maintenance and repair of goods and their further operation, faces higher expenses. Still, it will be more profitable in the long run than in the standard and pessimistic scenarios by creating additional projects, saving resources and ensuring environmental friendliness, which will positively impact public health.

Author Contributions

Conceptualization, V.K. and D.A.; methodology, case study selection V.K.; software, I.M.; validation, I.M. and J.G.; formal analysis, H.K.; investigation, I.K.; resources, J.G.; data curation, J.G.; writing—original draft preparation, V.K.; writing—review and editing, D.A; visualization, I.M.; supervision, D.A.; project administration, V.K. and D.A.; funding acquisition, D.A. All authors have read and agreed to the published version of the manuscript.

Funding

This research has been published with the support of Latvian Council of Science (Latvia), a research project “Quadruple Helix Concept (QHC) as base of the next generation PPP model” (no. lzp-2020/1-0062).

Institutional Review Board Statement

Not applicable.

Informed Consent Statement

Informed consent was obtained from all subjects involved in the study.

Data Availability Statement

Data available upon request.

Conflicts of Interest

The authors declare no conflict of interest.

References

  1. Zink, T.; Geyer, R. Circular economy rebound. J. Ind. Ecol. 2017, 21, 593–602. [Google Scholar] [CrossRef]
  2. Warmington-Lundström, J.; Laurenti, R. Reviewing circular economy rebound effects: The case of online peer-to-peer boat sharing. Resour. Conserv. Recycl. X 2020, 5, 100028. [Google Scholar] [CrossRef]
  3. Shaikh, A.A.; Sharma, R.; Karjaluoto, H. Digital innovation & enterprise in the sharing economy: An action research agenda. Digit. Bus. 2020, 1, 100002. [Google Scholar] [CrossRef]
  4. Bouncken, R.; Ratzmann, M.; Barwinski, R.; Kraus, S. Coworking spaces: Empowerment for entrepreneurship and innovation in the digital and sharing economy. J. Bus. Res. 2020, 114, 102–110. [Google Scholar] [CrossRef]
  5. Lehto, X.; Luo, W.; Miao, L.; Ghiselli, R.F. Shared tourism experience of individuals with disabilities and their caregivers. J. Destin. Mark. Manag. 2018, 8, 185–193. [Google Scholar] [CrossRef]
  6. Trachenko, L.; Lazorenko, L.; Maslennikov, Y.; Hrinchenko, Y.; Arsawan, W.; Koval, V. Optimization modeling of business processes of engineering service enterprises in the national economy. Naukovyi Visnyk Natsionalnoho Hirnychoho Universytetu 2021, 4, 165–171. [Google Scholar] [CrossRef]
  7. Swanson, E.; Kim, S.; Lee, S.M.; Yang, J.J.; Lee, Y.K. The effect of leader competencies on knowledge sharing and job performance: Social capital theory. J. Hosp. Tour. Manag. 2020, 42, 88–96. [Google Scholar] [CrossRef]
  8. Eckhardt, G.M.; Houston, M.B.; Jiang, B.; Lamberton, C.; Rindfleisch, A.; Zervas, G. Marketing in the sharing economy. J. Mark. 2019, 83, 5–27. [Google Scholar] [CrossRef]
  9. Koval, V.; Mikhno, I.; Udovychenko, I.; Gordiichuk, Y.; Kalina, I. Sustainable natural resource management to ensure strategic environmental development. TEM J. 2021, 10, 1022–1030. [Google Scholar] [CrossRef]
  10. Ostapenko, R.; Herasymenko, Y.; Nitsenko, V.; Koliadenko, S.; Balezentis, T.; Streimikiene, D. Analysis of production and sales of organic products in Ukrainian agricultural enterprises. Sustainability 2020, 12, 3416. [Google Scholar] [CrossRef] [Green Version]
  11. Puschmann, T.; Alt, R. Sharing economy. Bus. Inf. Syst. Eng. 2016, 58, 93–99. [Google Scholar] [CrossRef]
  12. Kickstarter Campaigns. 100,000 Creators. Available online: https://www.kickstarter.com/ (accessed on 23 May 2021).
  13. Constantiou, I.; Attila Marton, V.K.T. Four models of sharing economy platforms. MIS Q. Exec. 2017, 16, 231–251. [Google Scholar]
  14. Martiienko, A.; Khumarova, N. Improvement of the administration system in the field of natural resources use. Econ. Ecol. Socium 2017, 1, 71–81. [Google Scholar]
  15. Information Society. Available online: https://ukrstat.org/en/operativ/menu (accessed on 23 May 2021).
  16. Tambovceva, T.; Titko, J.; Svirina, A.; Atstaja, D.; Tereshina, M. Evaluation of the consumer perception of sharing economy: Cases of Latvia, Russia, Ukraine and Belarus. Sustainability 2021, 13, 3911. [Google Scholar] [CrossRef]
  17. International Telecommunication Union Statistics. Available online: https://www.itu.int/en/ITU-D/Statistics/pages/stat/default.aspx (accessed on 23 May 2021).
  18. Evobusiness Ecommerce. Available online: https://evo.business/107-mlrd-grn-vitratili-ukraїnci-na-pokupki-v-interneti-yakim-buv-ecommerce-u-2020-roci (accessed on 23 May 2021).
  19. Olx Ads Service. Available online: https://www.olx.ua (accessed on 23 May 2021).
  20. Morea, D.; Fortunati, S.; Martiniello, L. Circular economy and corporate social responsibility: Towards an integrated strategic approach in the multinational cosmetics industry. J. Clean. Prod. 2021, 315, 128232. [Google Scholar] [CrossRef]
  21. Leibenstein, H. The effect of joining the majority, the snob effect and the Veblen effect in the theory of consumer demand. Q. J. Econ. 1950, 64, 183–207. [Google Scholar] [CrossRef]
  22. Hobson, K.; Holmes, H.; Welch, D.; Wheeler, K.; Wieser, H. Consumption work in the circular economy: A research agenda. J. Clean. Prod. 2021, 321, 128969. [Google Scholar] [CrossRef]
  23. Rios, F.C.; Panic, S.; Grau, D.; Khanna, V.; Zapitelli, J.; Bilec, M. Exploring circular economies in the built environment from a complex systems perspective: A systematic review and conceptual model at the city scale. Sustain. Cities Soc. 2021, 103411. [Google Scholar] [CrossRef]
  24. Olczak, P.; Jaśko, P.; Kryzia, D.; Matuszewska, D.; Fyk, M.I.; Dyczko, A. Analyses of duck curve phenomena potential in polish PV prosumer households’ installations. Energy Rep. 2021, 7, 4609–4622. [Google Scholar] [CrossRef]
  25. Kostetska, K.; Smol, M.; Gaska, K. Rational nature use of recreational management subjects on the basis of inclusive. Econ. Ecol. Soc. 2018, 2, 31–40. [Google Scholar] [CrossRef]
  26. Papagiannis, F.; Gazzola, P.; Burak, O.; Pokutsa, I. A European household waste management approach: Intelligently clean Ukraine. J. Environ. Manag. 2021, 294, 113015. [Google Scholar] [CrossRef] [PubMed]
  27. Minfin Portal. Available online: https://minfin.com.ua (accessed on 23 May 2021).
  28. European Commission. European Green Deal: Commission Proposes Transformation of EU Economy and Society to Meet Climate Ambitions. Available online: https://ec.europa.eu/commission/presscorner/detail/en/IP_21_3541 (accessed on 23 May 2021).
  29. Mavlutova, I.; Kuzmina, J.; Uvarova, I.; Atstaja, D.; Lesinskis, K.; Mikelsone, E.; Brizga, J. Does car sharing contribute to urban sustainability from user-motivation perspectives? Sustainability 2021, 13, 588. [Google Scholar] [CrossRef]
  30. Jackson, C.; Preston, N.; Thompson, P.J. Intake and discharge nutrient loads at three intensive shrimp farms. Aquac. Res. 2004, 35, 1053–1061. [Google Scholar] [CrossRef]
  31. Hutsaliuk, O.; Koval, V.; Tsimoshynska, O.; Koval, M.; Skyba, H. Risk management of forming enterprises integration corporate strategy. TEM J. 2020, 9, 1514–1523. [Google Scholar] [CrossRef]
  32. Irena, M.; Mariana, B. The time value of money in financial management. Ovidius Univ. Ann. Econ. Sci. Ser. 2017, XVII, 593–597. [Google Scholar]
  33. Lursoft IT Lursoft. Available online: https://www.lursoft.lv/?l= (accessed on 23 May 2021).
  34. Fortunati, S.; Morea, D.; Mosconi, E.M. Circular economy and corporate social responsibility in the agricultural system: Cases study of the Italian agri-food industry. Agric. Econ. Ekon. 2020, 66, 489–498. [Google Scholar] [CrossRef]
  35. Gabrevics, L.; Atstaja, D. Evaluation of financial benefits from implementing eco-friendly solutions in a company. Coimbra Bus. Rev. 2017, 3, 59–67. [Google Scholar]
  36. CSDD. Available online: https://e.csdd.lv (accessed on 23 May 2021).
  37. E-Motion. Available online: https://www.bank.lv/en/ (accessed on 23 May 2021).
  38. T.L.E.I. Fund. The Climate Change Financial Instrument (KPFI) is a Government Budget Program of Republic of Latvia. Available online: http://kpfi.lv/index.php?page=about-kpfi (accessed on 23 May 2021).
  39. Koval, V.; Olczak, P.; Vdovenko, N.; Boiko, O.; Matuszewska, D.; Mikhno, I. Ecosystem of environmentally sustainable municipal infrastructure in Ukraine. Sustainability 2021, 13, 223. [Google Scholar] [CrossRef]
  40. Arsawan, W.; Sanjaya, I.; Putra, I.; Sukarta, I. The effect of expatriate knowledge transfer on subsidiaries’ performance: A moderating role of absorptive capacity. J. Phys. Conf. Ser. 2018, 953, 12082. [Google Scholar] [CrossRef]
  41. Urbinati, A.; Chiaroni, D.; Chiesa, V. Towards a new taxonomy of circular economy business models. J. Clean. Prod. 2017, 168, 487–498. [Google Scholar] [CrossRef]
  42. Shvets, V.Y.; Rozdobudko, E.V.; Solomina, G.V. Aggregated methodology of multicriterion economic and ecological examination of the ecologically oriented investment projects. Naukovyi Visnyk Natsionalnoho Hirnychoho Universytetu 2013, 3, 139–144. [Google Scholar]
  43. Parente, R.C.; Geleilate, J.-M.G.; Rong, K. The sharing economy globalization phenomenon: A research agenda. J. Int. Manag. 2018, 24, 52–64. [Google Scholar] [CrossRef]
  44. Knox, C.; Janenova, S. The e-government paradox in post-Soviet countries. Int. J. Public Sect. Manag. 2019, 32, 600–615. [Google Scholar] [CrossRef]
  45. Bilan, Y.; Zos-Kior, M.; Nitsenko, V.; Sinelnikau, U.; Ilin, V. Social component in sustainable management of land resources. J. Sec. Sust. 2017, 7, 107–120. [Google Scholar] [CrossRef]
Figure 1. The volume of sold online services in Ukraine on a time interval, million EUR [15].
Energies 15 00939 g001
Figure 2. Changes in goods’ sale (rental) price of goods depending on their physical wear in Ukraine, 2020 [19].
Energies 15 00939 g002
Figure 3. Diagram of population’s differentiated income and the dependence of the demand for Scheme 2020.
Energies 15 00939 g003
Figure 4. Linear economy model.
Energies 15 00939 g004
Figure 5. Circular economy model.
Energies 15 00939 g005
Figure 6. Total benefits from project implementation, thousand EUR [33].
Energies 15 00939 g006
Figure 7. Total number of normal and fast public charging points in Latvia [20].
Energies 15 00939 g007
Figure 8. Benefits or losses from the introduction of a circular economy (thousand EUR).
Energies 15 00939 g008
Figure 9. Return on equity, 2015–2017 (interests).
Energies 15 00939 g009
Figure 10. Return on equity in Furniture Factory, 2015-2017 (interests).
Energies 15 00939 g010
Figure 11. Relation between sharing and circular economy.
Energies 15 00939 g011
Table 1. Different characteristics of business model packages.
Pessimistic PackageStandard PackageOptimistic Package
The company remains in the existing building Developing industrial symbiosis (sales of shavings)The office building should be transferred to building A corresponding to the LEED certification
1 purchase of electric vehiclesThe company remains in the existing building Switch to a partial circular economic business model from product to service
1 purchase of a carMarketing campaignObtaining the ISO 14001 certificate
-1 purchase of electric vehiclesDeveloping industrial symbiosis
-1 purchase of a carPurchase of 2 electric vehicles
Table 2. The financial result of Furniture Factory in the shift from products to services, 2019–2026, EUR [33].
Revenue, EUR20192020202120222023202420252026Total
Company A Lease036,63136,63136,63136,63136,63100183,153
Company B Lease0036,63136,63136,63136,63136,6310183,153
Company C Lease00036,63136,63136,63136,63136,631183,153
200 chairs received back00000300,000300,000300,000900,000
Total revenue036,63173,261109,892109,892409,892373,261336,631144,9459
Expenditure, EUR
Production of 200 office chairs300,000300,000300,00000000900,000
Repair of returned chairs0000050,00055,00045,000150,000
Total expenditure300,000300,000300,0000050,00055,00045,0001,050,000
Benefits or losses from project implementation−300,000−263,369−226,739109,892109,89235,989231,8261291,631399,459
Table 3. Range of electric cars in Latvia in 2019 [36].
BrandModelElectricity Consumption, Wh/kmDistance to Be Travelled, kmPrice, EUR
Nissane-NV20025920036,252
Leaf Acenta20627035,900
HyundaiKona Electric15444939,990
VolkswagenE-golf PA15730042,495
KIASoul EV14223039,990
Table 4. Summary of the expenses for implementing circular economic projects according to a package type, in EUR [38].
Type of ExpensesPessimistic PackageStandard PackageOptimistic Package
Rental fee of the office, per month006972
Cost of office maintenance, per month10001000450
ISO 14001 certificate003000
Cost of storing shavings in the production building, per month0120120
Marketing campaign expenses040000
Partial shift to the business model: from a product to a service00300,000
Purchase of electric vehicles39,99039,99079,980
Electricity (electric vehicles), per month7474148
Purchase of a car42,00042,0000
Fuel, per month1001000
Total expenses83,16487,284390,670
Table 5. Financial results of Furniture Factory in implementing the suspicious package, 2020–2024, EUR [33].
Type of Expenses20202021202220232024Total
Furniture Factory without circular economy
Office cost12,00012,30012,60812,92313,24663,076
Cost of production building90,00092,25094,55696,92099,343473,070
Fuel, 3 cars3600369037823877397418,923
Purchase of 3 cars126,0000000126,000
Total expenses231,600108,240110,946113,720116,563681,068
Furniture Factory with circular economy
Office cost12,00012,30012,60812,92313,24663,076
Cost of production building90,00092,25094,55696,92099,343473,070
Fuel, 1 car120012301261129213256308
Purchase of 1 car42,000000042,000
Purchase of 1 electric vehicle39,990000039,990
Electric vehicles8878878878878874435
Total expenses186,077106,667109,312112,022114,800628,878
Benefits or losses from the introduction of the circular economy45,523157316351698176252,190
Table 6. Financial results of Furniture Factory in case of implementing the standard package, 2020–2024, EUR [33].
Type of Expenses20202021202220232024Total
Without circular economy
Office cost12,00012,30012,60812,92313,24663,076
Cost of production building90,00092,25094,55696,92099,343473,070
Fuel, 3 cars3600369037823877397418,923
Purchase of 3 cars126,0000000126,000
Total expenses231,600108,240110,946113,720116,563681,068
Furniture Factory with circular economy
Office cost12,00012,30012,60812,92313,24663,076
Cost of production building90,00092,25094,55696,92099,343473,070
Fuel, 1 car120012301261129213256308
Purchase of 1car42,000000042,000
Electricity (1 electric vehicle)8878878878878874435
Purchase of 1 extra car 39,990000039,990
Marketing campaign400000004000
Cost of storing shavings in the production building144014401440144014407200
Total expenses191,517108,107110,752113,462116,240640,078
Revenue from the sale of shavings6000600060006000600030,000
Benefits or losses from the circular economy46,083613361956258632270,990
Table 7. Financial results of Furniture Factory in case of the implementation of the optimistic package, 2020–2024, EUR [33].
Type of Expenses20202021202220232024Total
Without circular economy
Office cost12,00012,30012,60812,92313,24663,076
Cost of production building90,00092,25094,55696,92099,343473,070
Fuel, 3 cars3600369037823877397418,923
Purchase of 3 cars126,0000000126,000
Total expenses231,600108,240110,946113,720116,563681,068
Furniture Factory with circular economy
Office cost83,66485,75687,89990,09792,349439,765
Cost of production building90,00092,25094,55696,92099,343473,070
Electricity (2 electric vehicles)177417741774177417748870
Purchase of 2 eco-vehicles79,980000079,980
Partial shift to the business model: from a product to a service300,0000000300,000
ISO 14001 certificate300000003000
Cost of storing shavings in the production building144014401440144014407200
Total expenses559,858181,220185,670190,231194,9071,311,885
Revenue from partial shift to the business model: from a product to a service36,63136,63136,63136,631336,631483,153
Revenue from the sale of shavings6000600060006000600030,000
Total benefits42,63142,63142,63142,631342,631513,153
Benefits or losses from the circular economy−285,627−30,349−32,093−33,881264,287−117,664
Table 8. Financial results of Furniture Factory in case of the implementation of the optimistic package without moving to a new office building, 2020–2024, EUR [33].
Type of Expenses20202021202220232024Total
Without circular economy
Office cost12,00012,30012,60812,92313,24663,076
Cost of production building90,00092,25094,55696,92099,343473,070
Fuel, 3 cars3600369037823877397418,923
Purchase of 3 cars126,0000000126,000
Total expenses231,600108,240110,946113,720116,563681,068
FURNITURE FACTORY with circular economy
Office cost12,00012,30012,60812,92313,24663,076
Cost of production building90,00092,25094,55696,92099,343473,070
Electricity (2 electric vehicles)177417741774177417748870
Purchase of 2 eco-vehicles79,980000079,980
Partial shift to the business model: from a product to a service300,0000000300,000
ISO 14001 certificate300000003000
Cost of storing shavings in the production building144014401440144014407200
Total expenses488,194107,764110,378113,057115,803935,196
Revenue from partial shift to the business model: from a product to a service36,63136,63136,63136,631336,631483,153
Income from the sale of shavings6000600060006000600030,000
Total benefits42,63142,63142,63142,631342,631513,153
Benefits or losses from the circular economy−213,96343,10743,19943,293343,390259,026
Publisher’s Note: MDPI stays neutral with regard to jurisdictional claims in published maps and institutional affiliations.

