Abstract
Asal rift is an aerial rift segment resulting from the westward propagation of the Aden ridge into the Afar Depression. Geothermal manifestations such as hot springs and fumaroles, fault creep, conductivity anomaly, and high geothermal gradient were observed both at the surface and in the subsurface. Despite many scientific works conducted in Asal to understand the rifting mechanisms, the hydrothermal fluid circulation still needs to be evaluated since it is based on simplified conceptual models. To further contribute and progress toward a quantitative evaluation of fluid circulation, a 2D numerical model perpendicular to the rift axis was developed with the objective of better understanding the role of subsurface anisotropy in fluid flow and heat transfer in the Asal rift. Numerical modeling of multiphase flow and heat transfer was carried out with an equivalent porous medium intersected by fault zones having greater permeability. Horizontal anisotropic permeability and magmatic fluid release were taken into account with different simulation scenarios. The results indicate that fault zones act as recharge/discharge areas depending on their location, permeability, and number. Simulations considering horizontal anisotropic permeability allowed the reproduction of the thermal state observed in geothermal wells with the expected general pattern of fluid circulation in the Asal rift. Comparing our result with a recent study made with a 2D numerical modeling parallel to the rift axis, we suggest the presence of a saddle point where fluid flow is both to the northeast and to the southwest direction of the rift. Moreover, magmatic fluid release assumed in two simulation scenarios showed to have an impact on the hydrological behavior of fault zones and facilitate the development of super-critical flow at the center of the rift.
1. Introduction
Tectonic activity in a volcanic context can create dense normal faulting allowing high geothermal heat releases where crustal permeability is affected by such faulting mechanisms [1]. In a worldwide extensional environment, the role of faults and related fault structures have been widely studied [2,3]. The preferred path for fluid to recharge a hydrothermal system with cold downflow and to allow the hot fluid to rise into the shallow levels was shown to be controlled by a fault system in such an extensional setting. Active permeable normal faults may act as fluid conduits for both upward and downward flow for some geothermal areas with high enthalpy, like Laderello in Italy [4]. Layered permeability anisotropy characterized by structural analysis was also suggested to be a feature controlling flow in rift zones [1]. However, previous studies conducted in hydrothermal systems of extensional environments still lack quantitative assessment to evaluate the role of fault dip angle, abundance, and permeability on hydrothermal circulation. This is considered in this study of the Asal rift in Djibouti, which also looks at the importance of subsurface anisotropy through numerical simulation of multiphase flow. Previous numerical modeling of hydrothermal systems did not take into account anisotropic permeability, which is believed to be important to reproduce the thermal state of the Asal rift.
Previous scientific research highlights the importance of understanding the general pattern of fluid flow for geothermal exploration in hydrothermal systems where fluid circulation interacts with magmatic intrusions [5,6,7]. This still needs to be evaluated in several hydrothermal systems such as in the Asal rift of Djibouti. In the Asal rift the role of faults and their impact on fluid flow affecting recharge and discharge, the pattern of the regional hydrothermal flow, the anisotropic permeability of rocks, and magmatic heat flow for the fluid circulation have not been quantitively assessed. The Asal rift is a segment of the Afar depression that is an extensional zone between three plates: Somalia, Arabia, and Nubia. The Asal rift is an eroded and aerial rift where numerous northwest–southeast normal faults intersect the surface of the rift. Both the Asal rift and Ghoubbet Bay have main northwest-southeast normal faults, which may act as a preferred path for hydrothermal fluid circulation [8,9,10,11,12,13]. Volcanic and tectonic activity affecting the region since the late quaternary controls the topography and current structural features of the rift. Our scientific hypothesis is that both fault systems and the presence of anisotropic permeability can facilitate fluid circulation in the Asal rift. Thus, the objective of this work is to better understand fluid circulation by evaluating the role of the faults and permeability anisotropy in the Asal hydrothermal systems. Numerical simulations of the Asal hydrothermal system were therefore undertaken with different isotropic and anisotropic permeability scenarios defined for subsurface geological units and basement rocks according to a conceptual model developed with an interpretation of magnetotelluric surveys [14]. Multiphase flow and heat transfer was simulated to understand how features of fault systems, such as the geometry of faults, their permeability, location, and the relative distance between the heat source, effects the formation of the hydrothermal system and determine the preferred recharge and discharge area that influences the general pattern of hydrothermal fluid circulation.
2. Geodynamic Background and Geological Context
The Asal rift is close to the western tip of the Aden Gulf rift which propagates to the Afar depression at 30 mm/year (Figure 1). The eroded Asal rift is located at the center of the Republic of Djibouti and is bound to the east by Ghoubbet Bay and to the west by the saline Lake Asal. Steep normal faults with a principal direction of northwest–southeast with a displacement of up to 150 m are the main structural elements observed at the surface [15]. The latter authors also suggested an asymmetric distribution of Holocene fault slip in Asal where faults located in the northeast part of the rift have a higher summed slip rate than faults located in the southwest part. The dip angle of faults at the innermost part of the rift is approximately 60–80° [15]. These faults were active during the Holocene [15]. Northeast dipping normal faults are predominant in both the Asal and Ghoubbet Bay [8]. The subaerial rift is 15 km long, has an 11 km wide rift valley, and an inner width of 7 km. These structural and topographic characteristics are common features of slow-spreading oceanic ridges with faulting and thinner crust [12,16]. Faults throughout the Asal rift valley are active; half the rift faults slipped together in the last eruption of Ardoukoba volcano (Figure 1), which occurred in the Asal rift in November 1978. This recent slip could imply that this group of faults is activated every 100 years [15]. Thus, the long-term vertical deformation in the Asal rift has not reached steady state, and it is likely the result of cyclic rifting and the filling of lava [15].
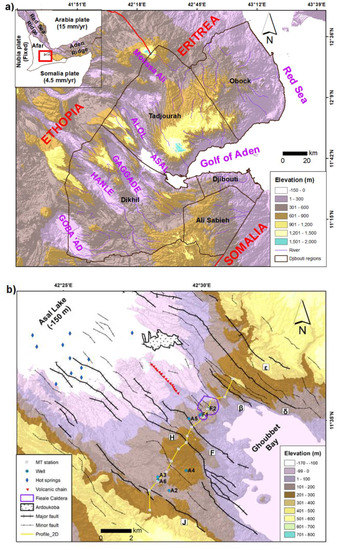
Figure 1.
Topography and main structural elements of (a) Djibouti and (b) Asal rift. The red rectangle is Djibouti. MT abbreviates magnetotelluric modified from [13].
The deformation of the Asal Lake, which pre-existed as a freshwater lake, and the recent basaltic lava flow that covers the rift axial zone [15,17] provides further evidence that this area was affected by recent volcanic and tectonic activity. The Fieale Caldera observable at the surface (Figure 1) was built almost 100 ky ago by a magmatic eruption, and subsequent tectonic activity faulted the Fieale Caldera crater [18]. The active normal faults have dismantled volcanic edifices of that last magmatic period that should be observable at the actual surface location of the Fieale Caldera [16,18].
Recorded seismicity and inferred fault activity is concentrated at the surface and the areas surrounding the Fieale Caldera. Such activities are evidence that a central volcanic system can exist below the Fieale Caldera [11,12,19]. An intense seismic swarm associated with an earthquake of a magnitude greater than five happened in November 1978 in the Asal–Ghoubbet rift, which was followed by a week-long fissured basaltic eruption, and ended by the extrusion of approximately 2 × 10⁷ m3 of lava [15]. This gave rise to the Ardoukoba volcano previously mentioned (Figure 1).
The long-term opening velocity of the Asal–Ghoubbet rift is close to the local and regional extension rate estimated by the restoration of horizontal and vertical displacement of the topography [16,18]. Therefore, even with the presence of few minor transient slip events on fissures and faults determined by interferometric synthetic aperture radar (InSAR) [11] and the absence of intense localized seismic activity [12], it is hypothesized that weak tectonic and magmatic activities currently exist under the Asal rift.
Fault dip angles inferred from the inversion of passive seismic data [12] suggest a sub-vertical dip of 90° at the center of the rift and 60° at the rift margins. Moreover, the dip estimated from mechanical deformation related to the surface morphology of normal faults indicates a nearly constant dip between 50–60° [20]. A recent study of the dimensionality analysis of magnetotelluric data additionally suggests the presence of a northeast electrical anisotropy in the upper crust [14]. This anisotropy may be associated with the horizontal deformation of the rift. A north–south electrical anisotropy in the lower crust and upper lithosphere is associated with vertical deformation and dike injection [14]. The geo-electric strike and anisotropy direction of magnetotelluric data proposed a sub-vertical dip (90°) for the MT stations close to the normal faults in the Asal rift (see Figure 4 in [14]). In addition, epicenters of the November 1978 eruptions determined after 5 days of seismic activity indicated a clear trending direction of N120E in Ghoubbet Bay, which corroborates with the direction of dike injection described above [16]. Two months of continued recorded seismicity after that event indicated the continuation of the seismicity in the Ghoubbet pass and in the transfer zone between the Asal–Ghoubbet rift and the Tadjoura submerged rift segment [15,16]. Rift extension at shallow depth is mainly controlled by opening fissures and normal faulting in both the Ghoubbet seafloor and the emerged Asal rift [8]. Seismicity recorded between 1979 and 1984 with moderate magnitude was concentrated in the northeast of the rift axis in the emerged part of the rift [12].
3. Methodology
A 2D numerical model parallel to the rift axis and to the shallow groundwater flow direction believed to be from the Ghoubbet sea to Asal Lake has been developed for the first 3 km of the upper crust [13]. This previous work showed the importance of the topography-driven groundwater flow interacting with the hydrothermal circulation in such a regional 2D model. Further work was thus needed to better understand the deep hydrothermal circulation perpendicular to the rift axis to shed light on the role of the main normal rift faults. With such a model, we believe it can be possible to better understand the relation between the upward magmatic fluids and the permeability of rock and faults considering potential anisotropic layers where lateral fluid circulation can be expected.
The multiphase modeling software HYDROTHERM developed by the USGS was used in this study. This code allows the modeling of flow and heat transport where the differential equations describing the conservation of mass and energy are coupled to be solved numerically with the finite difference method using the Newton–Raphson algorithm [21,22]. The description of the governing equations was presented in [13] and are expressions of mass and energy conservation with respect to enthalpy and pressure. Pressure is chosen as the dependent variable for fluid flow because density fields can be formulated as a function of pressure but not as a function of the potentiometric head. All pressure is expressed as absolute, and the water–component flow equation is based on the conservation of water mass in a volume element, coupled with Darcy’s law for multiphase flow through a porous medium:
where φ is the porosity (dimensionless), ρ is the fluid density (kg m−3), Sw is the saturation of liquid phase (water), Ss is the saturation of the gas phase (steam or air; dimensionless), k is the porous-medium permeability tensor (m2), kr is the relative permeability (dimensionless), μ is the viscosity of fluid (Pa s), P is the fluid pressure in the liquid phase (Pa), Pg is the fluid pressure in the gas phase (Pa), g is the gravitational constant (m s−2), qsf is the flow-rate intensity of a fluid-mass source (positive into the region; kg s−1 m−3), t is the time (s), and ∇ is the spatial gradient (m−1). The phase subscripts w and s refer to water (liquid phase) and steam (gas phase or vapor phase), respectively. In the single-component (water) zone, pg = p because the capillary pressure is assumed to be zero. Any point in the mesh, can be a single component or two component zone, and the saturation constraint is Sw + Sg = 1.
The thermal-transport equation is formulated based on the conservation of enthalpy in both the fluid phases and the solid phase of the porous medium:
where h is the specific enthalpy of the fluid phase (J kg−1), hr is the specific enthalpy of the porous-matrix solid phase (J kg−1), ρr is the density of the porous-matrix solid phase (kg m−3), Ka is the effective thermal conductivity (W m−1 K−1) of the bulk porous medium (combined liquid, gas, and solid phases), I is the identity matrix of rank 3 (dimensionless), T is the temperature (°C), and qsh is the flow-rate intensity of an enthalpy source (positive into the region; W m−3).
The following assumptions are considered for multiphase flow modeling with the HYDROTHERM software used in this study. The fluid is pure water, capillary pressure effect is negligible, porous medium and fluid are in local thermal equilibrium, heat transfer by radiation and dispersion can be neglected, Darcy’s law is valid with two phase forms, relative permeability is a nonhysteretic function of liquid volume saturation, and erosion is not considered.
All simulations made in this work considered an equivalent porous medium with the assumption of uniform permeability to represent the different rock and fault zones where fluid transport is governed by Darcy’s law and phase changes occur gradually. Fault zones were assumed to have a permeability higher than the adjacent units. Consequently, this approach allowed higher fluid flow in the fault zones than in the surrounding rock units.
3.1. 2D Conceptual Model
The 2D conceptual model perpendicular to the rift axis has a width of 12 km and a depth of 10 km (Figure 2). This model was inferred from interpretation of a 2D conductivity model developed in [14]. This 2D section (Figure 1) was chosen due to the location of deep geothermal wells A6 and A4. The measured temperature in these wells could be used for comparison with simulated temperature. The section was made perpendicular to the rift axis to include the main normal faults and geological units identified from outcrops and in geothermal wells [17]. To simulate the behavior of the hydrothermal system in simplified but realistic conditions, the 2D section across the rift axis encloses the area overlying the seismogenic crust zone between 3 and 5 km, the assumed deep magma reservoir, and the main normal faults [10,12,19]. The upward flux of magmatic fluids is know to depend mainly on the depth, composition, and dimensions of a magma body [23]. In this context, the hydrodynamic regime of a hydrothermal system is expected to depend primarily on the magmatic heat supply rate and the location of the recharge/discharge areas, as well as the permeability structure of the crust.
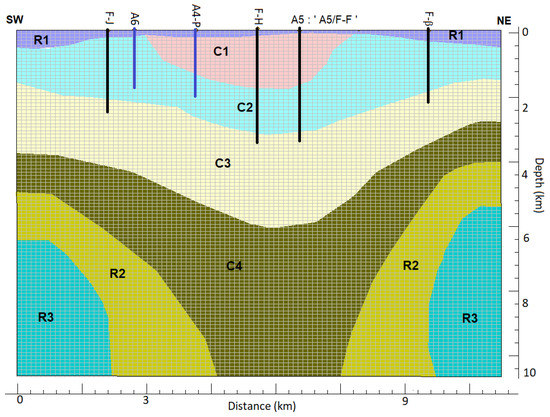
Figure 2.
A 2D finite difference grid and conceptual model interpreted from a 2D magnetotelluric profile of the Asal rift (Figure 1). F-J, F-H, F-β indicate the emplacement of faults with their name; for example, F-J is the fault J location. A6, A-4P (projected A4 well), and A5 are the geothermal wells (Figure 1). A5 is located at the same position of F-F and is denoted A5: ‘A5/F-F’.
3.2. Hydraulic and Thermal Properties
Base Case Scenario
The simplified stratigraphy of the conceptual model is derived from the interpretation of a 2D conductivity model recently developed by the same authors [14]. This model, illustrated in Figure 2, is composed of a dry volcanic rock (R1) that covers a shallow aquifer (C1). The latter overlies a host rock (C2) that is considered a potential hydrothermal reservoir. A hydraulically conductive medium having fractures that could represent a deep reservoir (C3) underlies the C2 potential hydrothermal reservoir.
The deep structure considered in the conceptual model is a resistive zone assumed to be the top of the basement (R2) overlying a highly resistive medium (R3) that can be the base of the basement and a magma system. The magma system is a layer likely filled by dike intrusion (C4) at the center of the rift (Figure 2 and Table 1).

Table 1.
Thermo-hydraulic properties for the base case (scenario 1).
Four major normal faults are included in the 2D conceptual model (Figure 2). The exact dip of the faults is unknown, and simulations with different dip angles were made to evaluate their impact.
Thermo-hydraulic properties for the base case called scenario 1, which excludes faults, are presented in Table 1. The permeability of geological units in this scenario 1 is anisotropic. The simulation of scenario 1 was performed for comparative purposes to later evaluate how anisotropic permeability can influence the deep hydrothermal circulation and allow lateral fluid circulation. The thermal conductivity and specific heat capacity varying with temperature were calculated with the methods presented by [13].
3.3. Boundary and Initial Conditions for Fluid Flow and Heat Transfer
At the top of the 2D model, a constant hydrostatic pressure of 1 bar was assigned with a free flow boundary. Fluid is thus allowed to be recharged/discharged at the top boundary domain. The base of the model is a no flow boundary. Lateral boundaries are impermeable. The hydrostatic pressure distribution with depth was used as initial conditions.
A temperature of 20 °C was assigned at the surface and a Gaussian bell distribution was used to represent basal heat flow along the bottom boundary of the 2D model. The conductive heat flow coming from the cooling of the magma system (C4) was represented in the model’s center by a heat flow of 0.4 W m−2 at the lower boundary of the C4 layer. The lower boundaries of R2 and R3 on the edges of the model were assigned a basal heat flow of 0.13 W m−2, which corresponds to the brittle–ductile transition temperatures. Thus, a conductive heat flux (Fourier) was used and the assigned value was an average inferred from the temperature log of geothermal wells (see Figure 2 in [13]). Lateral boundaries were adiabatic. A linear geothermal gradient of 40 °C km−1 was used as the initial conditions.
3.4. Spatial and Temporal Discretization
Mesh independence was verified to confirm the accuracy of numerical simulations. To achieve this, different grids were used with scenario 1 to evaluate temperature at the position of wells A6 and A4 (Figure 2) at a depth of 1480 m (Appendix A). The geometry of the 2D model was optimally discretized in the simulator with a regular grid of 100 × 100 cells (Figure 2). The simulation reaches a quasi-steady state temperature regime over 800,000 years with an initial time step of 0.001 years. The choice of this default simulation time is close to the duration of the Asal rift opening due to intense volcanic activity followed by normal faulting that was estimated about 1,000,000 years ago [16]. Thus, we assumed that geological materials at depth were present 800,000 years ago. Due to the greater permeability for some simulation scenarios, the simulation time span was reduced. An automatic time step algorithm where smaller time steps are selected when conditions of pressure, enthalpy, and saturation are rapidly changing was used by the simulator. The maximum values for changes in pressure, enthalpy, and liquid saturation, which are specified before running the simulations, are the factors controlling the length of time step. In the simulations, the maximum changes in pressure, enthalpy, and saturation were found to be 10%, 5%, and 0.03%, respectively. This resulted in a maximum time step of 13,697 years.
3.5. Simulation Scenarios
Different scenarios were conducted, and modifications were made to increase the complexity of the 2D numerical model starting from the base case scenario in Section 3.2.1 (Table 2). Properties for the shallow units were chosen similarly to those determined from the numerical modeling of multiphase flow parallel to the Asal rift axis [13]. Properties of the deep model units were determined from compilations of previous scientific works [5,24,25,26]. We assumed that geological units R1, C1, and C2 have horizontal permeabilities two times higher than the vertical permeability, while R2 and R3 have a vertical permeability of two orders of magnitude higher than the horizontal. We assumed that electrical anisotropy evaluated in the work of [14] can be interpreted as permeability anisotropy.
Table 2.
Modification of each different scenario from the base case scenario 1.
Fault expression at the surface is well known [8,15,16], but subsurface fault geometry is uncertain. In scenario 2A, four normal faults were added to the model with a vertical dip of about 90° which is consistent with the direction of diking and faulting [8,15] and the inferred geoelectric strike and anisotropy direction [14]. The faults are simplified to be represented by a zone of high permeability equal to 3 × 10⁻¹⁶ m2 over a given width of 100 m. Mechanical and chemical processes existing in faults were neglected. Note that fault width and permeability are not independent from a hydrogeological point of view. The product of fault width and permeability correspond to the transmissivity. Another simulation scenario (2B) where the average dip of faults is 60° as proposed by [12,20] is included in Appendix A. We concluded that the flow pattern is less dependent on the dip angle of faults but is more affected by the location, number, and permeability of faults, explaining why these results are only shown in the Appendix A.
Moreover, scenario 3 was made to investigate the effect of the fault permeability, which was increased to 7 × 10⁻¹⁶ m2. Scenario 4 evaluates the importance of the potential presence of cap rock that is less permeable. In this case, the C1 layer was assumed to act as a cap rock with a low isotropic permeability equal to 2 × 10⁻¹⁷ m2. Furthermore, to understand the influence of unit permeability and the importance of significant lateral flow, additional scenarios 5A and 6A were made in which the permeabilities of geological units C2 and C3 (Figure 2 and Table 2) were horizontally increased by one order of magnitude compared to the base case (Table 1). The aim of these scenarios was to evaluate the impact of favorable permeability conditions that can create zones of high hydrothermal fluid velocity and high temperature. Properties selected for scenarios 1 and 2A were reconsidered in scenarios 5A and 6A but with anisotropic permeabilities. A horizontal permeability one order of magnitude higher than the horizontal permeability of scenario 2A was used in scenario 5A, whereas the conditions of scenario 5A were repeated without faults to simulate scenario 6A. We also considered scenarios 5B and 6B where the northeast of the Asal rift is assumed more permeable than the southwest in the upper crust. To accomplish this, we reconsidered the properties selected for scenario 5A and assigned a permeability two times higher than the permeability of scenario 5A for geological units (R1, C1, C2, and C3; Figure 2) located to the northeast of H fault, whereas the geological units located at the southwest of H fault remained the same as those of scenario 5A in order to simulate scenario 5B. Then, we simulated scenario 6A with the same conditions where geological units located to the northeast are more permeable than those located to the southwest of the rift in order to simulate scenario 6B. Finally, scenarios 7 and 8 were made to quantify the role of the magmatic fluid injection into the hydrothermal system. To this end, conditions of scenario 1 were reconsidered to simulate scenario 7 with a magmatic fluid flux equal to 18 × 104 m3 year−1 as determined by [15]. This magmatic fluid flux is located at the bottom of the C4 layer (at approximately 9 km depth) in the 2D conceptual model (Figure 2). Scenario 2A was reconsidered to simulate scenario 8 with a magmatic fluid flux of 18 × 104 m3 year−1.
Simulated temperature versus measured temperature in geothermal wells A6 and A4 were compared to better understand the main characteristics that control the hydrothermal system and infer the most realistic scenarios that represent the thermal state observed in geothermal wells.
4. Results
The results of scenario 1 and scenario 2A (Figure 3) show that there are two distinct flow patterns. At the center of the rift between fault H and fault F (A5), cold downflow dominates and separates two hot upflow zones. The C3 layer is shown to host supercritical fluids where temperature is equal to or above 400 °C (Figure 2 and Figure 3).
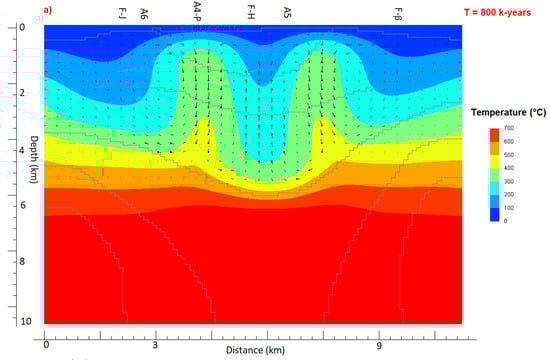
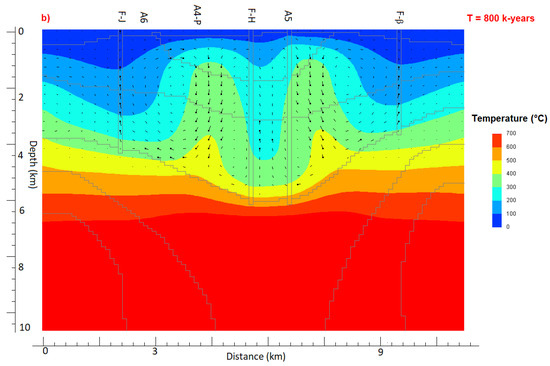
Figure 3.
Simulated temperature and flow vectors at time 800,000 years for (a) scenario 1 and (b) scenario 2A. The direction of flow is from the point to the end of straight lines. The length of each line indicates the flow vector magnitude, where 1.2 km = 10−6 g s−1 cm−2.
The cold downflow is toward the center of the C3 layer, and due to the temperature increase, the flow direction reverses and the hot upflow circulates toward the overlying units and migrates according to the development of the high-temperature zones. When considering the presence of faults (scenario 2A), there is less cold downflow at the center between faults H and F than in scenario 1 without faults, but the outermost faults (F-J and F-β) act as a preferred path for the downflow circulation. In scenario 3 (Figure 4), the hot upflow takes place along fault H, whereas faults F-J and F-β exhibit a preferred path for the downflow circulation. Additionally, fault F (A5) experiences a mixture of cold and relatively hot downflow. In scenario 4 (Figure 4), the pattern of flow is similar to scenario 2A, but between faults F and β, the hot upflow circulates toward the northeast direction (toward fault β), and the system at the center of the rift is hotter between faults H and F where a hot upflow replaces the downflow when compared to scenario 3. In scenarios 5A and 6A (Figure 5), lateral flow is more pronounced than for the preceding simulations due to the increased horizontal permeability. Moreover, the direction of flow is different in each layer (C2 and C3; Figure 2) and inside the fault systems. At the center of the rift in the C2 layer, the hot upflow is toward the rift margins (toward the northeast and southwest) direction, while the downflow originates from the rift margins and is toward the center of the rift. There is a significant lateral flow toward the rift center in the C3 layer, while the hot upflow is directed vertically toward the C2 layer and is concentrated inside the 300–400 °C isotherms. Furthermore, the flow vectors inside the faults show two different patterns in scenario 5A. The first pattern is a dominant downflow circulation inside the outermost faults (F-J and F-β), whereas the second pattern illustrates upflow and discharge and is localized in the upper part of the faults (F-J and F-β) close to the surface (Figure 5). For this same simulation scenario 5A, fault H (F-H) does not seem to act as a preferred path for fluid flow while there is an important hot upflow taking place along the fault F (F-F). In scenario 6A, significant lateral and vertical flow co-exist in the C3 unit. At the center of the rift, there is a hot and wide zone with significant oblique upflow (azimuthal direction). Each hot upflow area is surrounded by cold downflow areas, but lateral flow toward the center of the rift also exists, particularly inside the C3 layer.
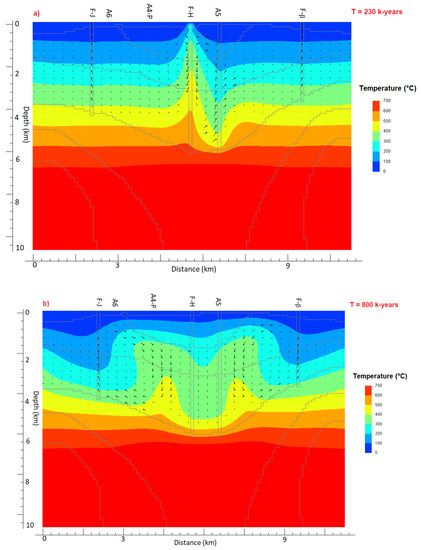
Figure 4.
Simulated temperature and flow vectors for (a) scenario 3 at time 230,000 years and (b) scenario 4 at time 800,000 years. The direction of flow is from the point to the end of straight lines. The length of each line indicates the water vector magnitude, where 1.2 km = 10−6 g s−1 cm−2.
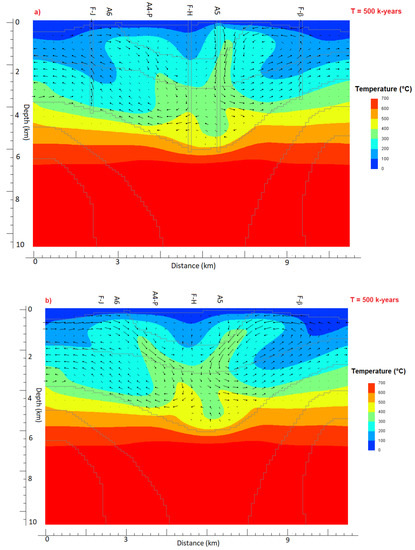
Figure 5.
Simulated temperature and flow vectors at time 500,000 years for (a) scenario 5A and (b) scenario 6A. The direction of flow is from the point to the end of straight lines. The length of each line indicates the water vector magnitude, where 1.2 km = 10−6 g s−1 cm−2.
Results obtained with scenario 5B show that both the deep and shallow hydrothermal circulations are directed toward the southwest rather than the northeast of the rift. Thus, one main hot upflow zone exists in the southwest of the rift whereas the northeast of the rift seems less hydrothermally active with potential cooling (Figure 6). Results obtained with scenario 6B are similar to those of 5B, but in the case of 6B, we observe a high magnitude of fluid vectors at the southwest edge of the rift, which can be considered a high discharge zone (Figure 6).
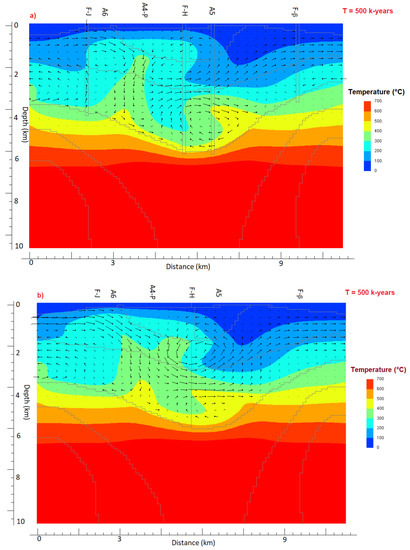
Figure 6.
Simulated temperature and flow vectors at time 500,000 years for (a) scenario 5B and (b) scenario 6B. The direction of flow is from the point to the end of straight lines. The length of each line indicates the water vector magnitude, where 1.2 km = 10−6 g s−1 cm−2.
Fluid circulation in scenarios 7 and 8 (Figure 7) present common features and similarities. In scenario 7, the hot upflow area is concentrated in the 300–400 °C isotherms, and part of the fluid is discharged at the surface close to faults H and F (F-H and F-F), whereas in the other parts of the rift, fluid is flowing laterally and directed toward the northeast and southwest before recirculation with vertical downflow that takes place at depth. Additionally, the high temperature gradient at the center allows the formation of convection cells which transforms the downflow into a hotter upflow toward the upper unit. Scenario 8 displays approximately the same flow patterns, but the outermost faults (F-J and F-β) are, in this case, the preferred fluid discharge pathway, and the main upflow is concentrated between faults H and F.
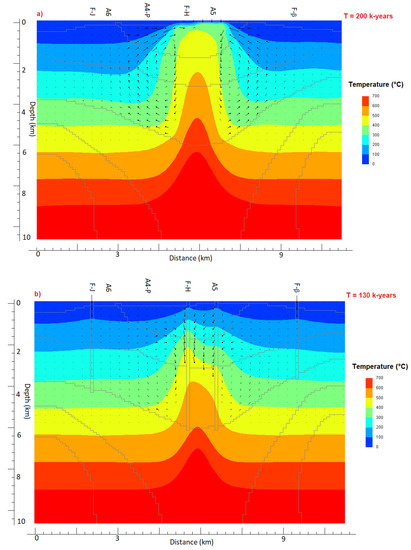
Figure 7.
Simulated temperature and flow vectors for (a) scenario 7 at time 200,000 years and (b) scenario 8 at time 130,000 years. The direction of flow is from the point to the end of straight lines. The length of each line indicates the water vector magnitude, where 1.2 km = 10−6 g s−1 cm−2.
Measured temperatures in geothermal wells A6 and A4 best match with the simulated temperatures at the locations of the wells for scenarios 5A, 5B, 6A and 6B (Figure 8). Notably, the simulated temperatures for both wells A6 and A4 best match in scenarios 5B and 6B. This confirms that the layered anisotropy of horizontal permeability better reproduces the observed thermal state in the geothermal wells of the Asal rift.
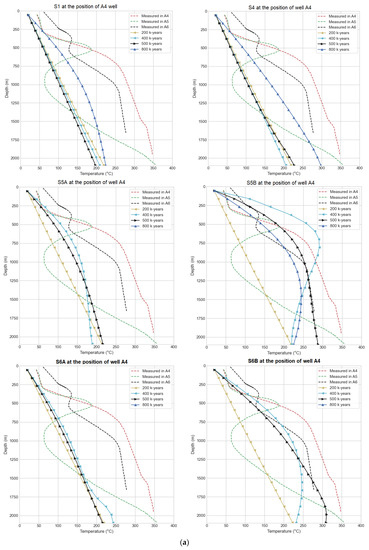
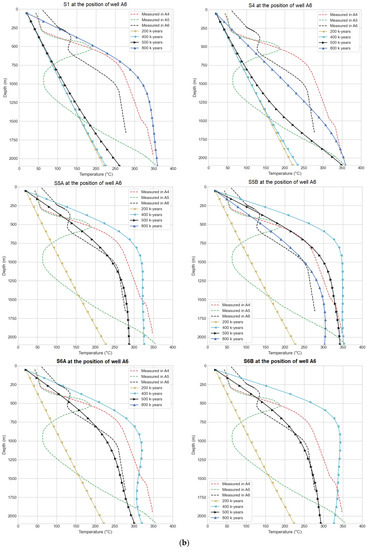
Figure 8.
(a). Comparison between the observed and simulated temperatures at well A4. The word S represents scenario. (b). Comparison between the observed and simulated temperatures at well A6. The word S represents scenario.
It can be concluded that horizontal anisotropic permeability (higher horizontal permeability than vertical) of the upper geological units impacts the observed thermal state in the deep geothermal wells. Moreover, the general flow pattern illustrated by scenarios 5B and 6B is believed to be most representative of hydrothermal fluid circulation in the Asal rift (Figure 5). In addition, simulated temperature and observed temperature at well A6 are in good agreement for both scenarios 5B and 6B (Figure 8b). It is interesting to note that the modified scenarios (5B and 6B) reproduce the observed thermal state of the upper part of well A6 better than the original scenarios (5A and 6A), whereas the observed thermal state of the lower part are almost the same compared to both scenarios (Figure 8). This suggests that the permeable northeast part of the rift facilitates recharge while hydrothermal upflow concentrates in the southwest part of the rift.
5. Discussion
5.1. Rock Permeability
In all scenarios simulated in this study, the main property that was subject to variation is permeability. Furthermore, the complexity of the model is increased from scenarios 1 to 8 in order to understand the overall behavior of fluid circulation inside the 2D conceptual model to give a reliable interpretation of the features that control fluid flow. Permeability plays an important role in the development of hydrothermal systems [5,6]. The presence of a cap rock (low permeable unit), represented in this study with layer C1, allows the formation of high temperature inside the C2 and C3 layers (scenario 4). This confirms the well-known theory that a favorable high-temperature hydrothermal system needs a cap rock at a shallow depth and above the vertical projection of the heat source to trap heat in the underlying units. As postulated previously by [24], the presence of a cap rock facilitates the maximum steam saturation with the formation of a vapor-dominated system. Moreover, the increase in pore pressure commonly occurs under a capped hydrothermal system [27]. The importance of the moderate host rock permeability and seafloor topography as the major factors controlling the long-life hydrothermal circulation and venting temperature were also inferred for the lost city hydrothermal system [28].
A uniform permeability was assumed in each unit for this study, but permeability can be affected by dynamic processes, such as alteration, metamorphism, and diagenesis [6]. The long life time of hydrothermal systems suggests that a dynamic permeability evolving with time is more representative than a fixed value based on an actual physical system state [23]. In cases of moderate to low permeability, as in scenario 4 (with cap rock), a high-temperature system is developed with a wider 400 °C isotherm resulting from the slow flow velocities. When the permeability of rock increases (as in scenarios 5A and 6A), the duration of the development of the hydrothermal system with high fluid enthalpy decreases from 800 ky to 500 ky. The duration of the development is the time needed for the hydrothermal system to approach a steady state. In other words, temperatures and life spans of hydrothermal systems decrease with increasing permeabilities, which is corroborated by our simulation results. This was previously demonstrated by [7,23]. A high permeability of geological units favors the formation of a low enthalpy hydrothermal system because heat advects away from the heat source. As suggested by [5,24,29], the most favorable location for the development of a two-phase fluid zone is expected to occur within intermediate rock permeability ranging between 10−16 and 10−15 m2, as evidenced in scenarios 5A and 6A. In our simulations, a low permeability was assigned to deep model units (C4, R2, and R3), and the driving forces of fluid flow are consequently governed by fluid density variation due to temperature differences. The development and formation of brine lenses above volcanic conduits in hydrothermal systems requires a narrow and high permeability pathway, high salinity, and an elevated temperature of magmatic fluid where the extension and depth of brine lenses can also be associated to zones of high hydraulic conductivity at shallow depths [30]. This corroborates with the results of scenarios 7 and 8 (Figure 7 and Table 2), where a narrow hot zone can be observed at the center of the rift. Ref. [30] found consistent correlations between the extension of brine lenses and the high conductivity zone close to the surface. This kind of consistent correlation may exist in the Asal rift because the extension and the width of the highly conductive layer (C1 layer in Figure 9 [14]) corresponds to zones of upflowing fluids with high enthalpy between the H and F faults (Figure 7) that could potentially correspond to the brine lens formation.
5.2. Fault Permeability and Number of Active Faults
Fault permeability plays an important role in the circulation of fluids between the heat source and the surrounding geological units. Increasing fault permeability, like in scenario 3, creates a selective switch mechanism in which previously less hydrothermally active faults (H and F) act as a preferred path of fluid flow compared to in scenario 2A. As illustrated in scenario 3, fault H acts as a discharge for the hot upflowing fluids, whereas the outermost faults (F-J and F-β) remain recharge conduits, as seen in scenario 2A. In scenario 3, fault F becomes a new recharge conduit at the center of the rift. Increasing fault permeability decreases the life span of the hydrothermal system, whereas increasing the number of faults with the addition of two other minor faults in the numerical simulations (this scenario is not presented above; see Appendix A for more details) allows high velocities of hot discharged fluid between faults J and H and a rising hot upflow area between faults F and β with relatively low velocities. That means if more faults are added in the numerical simulations (assuming all faults are active and permeable), the convection scheme is modified, and an asymmetric hydrothermal fluid circulation pattern can be expected in which the southwest part of the rift is the host of fluid discharge at the surface and is hotter than the northeast (Appendix A).
Fluid velocity increases in the Asal rift with increasing fault permeability affecting the fluid flow pattern. A similar characteristic was found in the mid-ocean ridge-flank, where the relative space between adjacent faults controlled the wavelength of the heat flow variation and, consequently, the hydrothermal fluid circulation [31]. Additionally, high fault permeability leads to a narrower upflow zone, whereas low fault permeability allows the development of wider upflow zone [32]. This same pattern indicating a rising hot upflow where the shape and extension depend primarily on fault permeability was found within a tectonically active rift ridge in Iceland with numerical simulations of hydrothermal fluid circulation [32]. A comprehensive review including mechanical behavior, structure, and flow properties of fault zones was presented by [33], who argue that fluid flow is mainly controlled by the 3D architecture of fault zones, which can be heterogeneous. Ref. [33] concluded that, in crystalline rock at depth, significant flow along faults can be observed where flow is controlled by a small number of fractures within the surrounding damage zone of faults. This may correspond to the conditions of the realistic simulated scenarios (5A, 5B, 6A and 6B) in this study.
5.3. Permeability Anisotropy and Asymmetry
A volcanic context with subparallel layered lava flows and pyroclastic units suggests potentially higher horizontal permeability than vertical permeability [34]. This condition may be present in the Asal rift where vertical and horizontal deformation were recorded [10,35]. Horizontal deformation is related to the extension of plate motion that controls the development of shear zones in which higher horizontal permeability should be expected in the crust. This phenomenon was previously inferred in many tectonically active areas where fluid-filled oriented fractures or shear zones induced electrical anisotropy (see paragraph 5.2 in [14]). This was correlated with the recent dimensionality analysis of MT data suggesting the presence of anisotropic layers in the crust and continuous conductive subparallel layers inferred from the 2D conductivity model [14]. Additionally, volcanic layering can cause permeability anisotropy with higher horizontal permeability. Fluid accumulation in sills extruded under the ductile regime can also be a possible mechanism for permeability anisotropy [36]. Interestingly, we found that a greater horizontal permeability (scenarios 5A and 6A, 5B and 6B) better reproduced the fluid flow pattern as evidenced by the thermal state that was better matched to the temperature of the geothermal wells (Figure 8). Additionally, regional stretching can facilitate high temperature related to magma intrusions and fault creep [10]. Those authors calculated the deviatoric stress along a 2D thermo-mechanical model parallel to the 2D conceptual model built in this study. Surprisingly, the high deviatoric stress determined by those authors (see Figure 7a in that paper) correlates with the isotherms of the two hot upflow zones (scenarios 5A and 6A) and may likely result in poroelastic effects induced by hydrothermal fluid circulation inside anisotropic layers. The higher horizontal permeability relative to the vertical permeability favors lateral fluid flows with additional stress originating from the thermal state and the activity of the magma system. Regional stretching further implies the formation of regional fracture patterns where permeability anisotropy can emerge and be maintained by regional stress direction at a shallow depth and by the supply rate of the overpressurized magma system at a great depth. The co-existence of regional stress direction and injection of hot magmatic materials likely accommodates the general pattern of fluid circulation in an anisotropic medium like rock units of the Asal rift. Similar structural controls playing an important role for the hydrothermal fluid circulation were inferred for the Taupo Volcanic Zone of New Zealand [1]. And these authors postulated that the preferred direction of extensional structures and their distribution in parallel striking array imply the development of permeability anisotropy where enhanced axial or lateral flow is expected in the shallow crust and enhanced vertical permeability is expected in the basement rocks.
An interesting dynamic is observed when we consider that the northeast part of the Asal rift is more permeable than the southwest part based on the results of scenarios 5B and 6B (Figure 6). These simulation results demonstrate an unexpected hydrothermal fluid flow direction which is mainly directed toward the southwest part of the rift instead of toward the northeast which is more permeable. This may be the first time where the numerical modeling of multiphase flow and heat transfer demonstrates how the general pattern of regional hydrothermal fluid circulation can be changed and modified if the asymmetry distribution of rock permeability is assigned in a 2D conceptual model. This pattern of fluid circulation may occur in the Asal rift where the northeast of the rift is supposed to be more deformed and permeable than the southwest [11,12,13]. It is important to recall that [15] previously suggested an asymmetric distribution of basaltic rocks where the thickness of the crust is higher in the southwest of the rift. This asymmetry can imply higher porous thickness and consequently higher transmissivity in the southwest.
The impacts of porous medium stratification were recently studied by [37,38], who concluded that the thermal stratification effect in a porous medium can easily enhance the heat transfer rate and decrease velocity and temperature fields, whereas porosity can enhance the axial velocity field. In addition, ref. [37] used Cattaneo–Christov heat flux in the flow-saturated porous medium, and later, ref. [38] proposed dimensionless variables derived from ferrohydrodynamic and thermal energy equations to quantify the influence of thermal stratification.
5.4. Heat Source and Magmatic Volatile Release
Magmatic fluid release or the addition of magmatic volatile represented in the model with a boundary condition of higher heat flow, as in scenarios 7 and 8, changed the dynamic of flow and the behavior of faults (F-J and F-β). For example, in scenario 8, the faults F-J and F-β act as a preferred path to discharge the hot fluid at the surface, while the rising hydrothermal fluid in the inner faults (H and F) seems to flow laterally near the surface and toward the rift shoulders (northeast and southwest) instead of flowing vertically to be discharged at the surface. It is also important to note that the presence of magmatic fluid flux modified the convection pattern of fault systems, as shown in scenario 8. As presented in the majority of scenarios, the inner faults (F-H and F-F) and the surrounding areas hosted the main hot upflow zones. An additional scenario (not presented here) was considered in which the entire bottom boundary of the 2D model was assigned with a constant heat flow of 0.13 W.m−2 to verify if this convection scheme is related to the strata topography or to the boundary conditions. Surprisingly, the convection scheme is similar to the above previous scenarios when high heat flow is assigned at the center of the lower boundary of the C4 layer. It can be interpreted as evidence of the convection scheme that is more impacted by the basement shape or by the depth distribution of the layers in the initial conceptual model than by the heat flow. The relative importance of basement shape was previously highlighted with 2D numerical simulations in a mid-ocean ridge where there are no active faults [31]. Furthermore, magmatic fluid release created a super-critical geothermal system with a vertical upflow zone extending in the upper crust that originated from the underlying overpressurized fluid flow driven by the magma system providing the heat source (scenarios 7 and 8; Figure 7). Additionally, the simulation results of scenario 7 corroborate with previous numerical simulations conducted in a magmatic hydrothermal ore deposit with hydrothermal circulation [7]. In this case, the magmatic fluid release can create hydrological barriers separating the inner system, dominated by ascending magmatic fluids under near-lithostatic pressures, from surrounding outer systems, dominated by the convection of colder meteoric fluids under near-hydrostatic pressure [7]. Studies analyzing the transmission of heat and fluid resistance to the flow found that temperature distribution grows with increasing heat flow. The Cattaneo–Christov heat flux, known as the heat paradox to compute the heat transfer in a material, showed promising results that may accurately predict the transmission of thermal energy [37,38,39,40].
Another interesting hidden dynamic that can be deduced from numerical simulations is the nature of the magma system beneath the Asal rift. The presence of a cooling magma system at the center of the rift was proposed by [14] in their 2D electrical conductivity model, while multiphase flow modeling conducted in this study suggests that the preferred path of the magmatic fluids is likely confined to the inner faults (scenarios 7 and 8), where hot ascending magmatic fluid can migrate before reaching the surface. Faults H and F are the largest major faults located at center of the rift, and fault F aligns with the volcanic chain (Figure 1) that preceded the eruption of Ardoukoba volcano in 1978 [12]. The axial upper and lower basaltic deposit series and youngest volcanic deposits have an average deposition date of 30 k years and are mostly present between fault H and Fiaele Caldera [15,16]. Thus, as the youngest volcanic deposits are located at the center close to faults H and F, we hypothesized that the preferred actual path of magmatic volatile release is somehow limited between fault H and Fieale Caldera (Figure 1), which has important implications for the simulation results of scenarios 7 and 8. Moreover, simulations without magmatic fluid releases but with high heat flow at the lower boundary of the rift (scenarios 1, 2A, 4, 5A, 6A) demonstrated that two hot upflow zones can co-exist, one between fault H and well A6 (F-H and A6; Figure 5) and another one between well A5 and Fieale Caldera (Figure 1 and Figure 5). The latter upflow is evidently aligned with the volcanic chain and the seismogenic crust inferred by the tomography inversion of passive seismic waves [12]. Thus, that upflow can be interpreted as a permeable zone with over-pressured vertical conduits. Additionally, the hot upflow zone between fault H and well A6 is correlated with the main hot upflow zone determined from the 2D numerical modeling of multiphase flow aligning with the rift axis, recently presented by [13].
The ground surface deformation rate in the Asal rift is believed to be controlled by the injection of magma at a shallow depth over geological time [19]. However, this kind of deformation in volcanic/tectonic context was also suggested to result from the transient poroelastic variation induced by hydrothermal fluid circulation [34]. The latter indicates that the injection of hot aqueous fluid (not necessarily magmatic fluid) can induce ground surface deformation observed in some calderas. This corroborates with the results of scenario 5A where magmatic fluid was not injected at its base but the thermal state observed in geothermal wells of the Asal rift was reproduced. Measured temperatures in geothermal wells are in agreement with the simulated temperature for scenario 5A, where the hot upflow zone in the northeast part of the rift (Figure 5) coincides with the inferred source of deformation at depths below Fieale Caldera [10,12,19]. Additionally, we suppose that the temperature measured in well A4 corresponds to an early stage of the simulated temperature of well A6 (see Figure 8b scenarios 5A, 5B, 6A, and 6B). One possible explanation is that A4, located at the center of the rift, is closer to the heat source than A6 (Figure 2, Figure 5, and Figure 6). That means the regional thermal state is uniform and can be perturbed by the episodic volcanic activity which influences measured temperatures relative to the distance between the heat source and the location of geothermal wells.
The goal of this study was to better understand hydrothermal fluid circulation at a regional scale. The software used, HYDROTHERM, is based on Darcy’s law, which is used for subsurface multiphase flow simulation and can be considered a valid approximation to study groundwater flow at a regional scale. However, erosion and swelling effects in a porous media were recently incorporated in numerical models; for example, in a study by [41]. They concluded that erosion caused a decrease in solid volume, whereas swelling caused an increase in solid volume. Erosion depends on the shear stress [41], which can become significant when flow velocities are high, particularly at the interface between different flow regimes. Thus, Darcy’s law is valid when fluid flows without turbulence in a porous layer where the shear stress can be neglected. However, close to open faults and fractures, where shear stress is significant and flow velocities are important, the Brinkman equation may be more appropriate. Consequently, further work could be performed to either compare Darcy’s law and the Brinkman equation to quantify shear stress prior to considering the erosion and the deformation of rocks or to extend Darcy’s law to the Brinkman equation in faults and fractures to better consider the interface between two media having different permeability. This may also be useful to better understand the fluid dynamics during the transition between a slow flow in a saturated porous media and a fast flow in production wells or in open faults and fractures.
5.5. Fluid Flow Pattern and Thermal State of the Asal Hydrothermal System
General pattern of fluid flow along the 2D model developed in this paper can be combined with the previous simulations of fluid flow in the Asal rift that was investigated by numerical modeling along a 2D profile parallel to the rift axis and aligned to the shallow groundwater circulation believed to be from the Ghoubbet Bay to Lake Asal [13]. The main findings in that study were the existence of superimposition permeable zones where a deep hydrothermal circulation is covered by a shallow topography-driven flow toward Asal Lake and the Ghoubbet Bay. Simulation results parallel and perpendicular to the rift axis can be reinterpreted together to globally understand hydrothermal fluid flow circulation. All simulations presented in this study demonstrated ascending hot upflow concentrated in the inner part of the rift. Lateral and descending fluid flow co-exist inside geological units (C1, C2, and C3) that hosted the potential hydrothermal system. Additionally, the direction of flow is somehow different and variable within each unit. In C3, fluid flows toward the center of the rift, whereas in C2 and C1, fluid mainly flows toward the rift shoulders (northeast and southwest) where part of this fluid is recirculated, going downward. This means we can expect four different flow directions that can be regrouped in a whole circular convection scheme. In other words, the system is recharged by the cold downflow (mainly by fault systems), and the cold downflow mixes with the density-driven flow at the deeper level of the system to form a hot upflow area. The latter flows laterally close to the surface toward the rift margins (northeast and southwest) before fluid mixes through the cold downflow toward the deeper unit. The important feature with this convection pattern, when considered in complement to the previous simulation work [13], is the existence of a saddle point where lateral fluid flow at a shallow depth is toward the rift margins and toward both Asal Lake and Ghoubbet Bay (Figure 1). In geothermal areas of New Zealand, the same pattern of fluid flow is anticipated where the deep fluid flow is influenced by magmatic intrusion and conveyed at a shallow depth by faults to allow the formation of localized convection cells where the brittle–ductile transition at the base of the seismogenic zone limits the downflow of meteoric water [2].
The 2D numerical model used in this study appears to be a good approximation to understand fluid dynamics where hydrothermal convection can dominantly affect heat transfer mechanisms in such hydrothermal systems where axial flow and upflow co-exist [7,23,25,29,42,43,44,45]. Similar patterns of fluid dynamics were obtained with a 3D model with realistic thermodynamic properties considering saline fluid in mid-ocean ridges [46].
5.6. Implications for Geothermal Energy Exploration
Potential areas for future geothermal exploration drilling targets could be the two upflow zones illustrated in Figure 5. The deepest geothermal well, A5, was not productive, and this is consistent with the results of the majority of scenarios simulated in this study (scenarios 1, 2A, 4, 5A, 5B, 6A, and 6B), where high enthalpy fluid circulation is not present in the surrounding of well A5. A complementary exploration option is to determine, with geophysical methods and structural analysis, if faults H and F are active and permeable to determine where they can act as preferred paths for fluids. In cases where these major faults are active and permeable, further analysis should be undertaken to determine the permeability of their damage zone by drilling exploration wells across the faults and to estimate the in situ permeability with hydraulic tests. If high permeability inside fault zones is inferred, as hypothesized in scenario 3, then fault H should be considered as a potential drilling target. Moreover, in these cases, the relative amount of magmatic fluid release can be determined with joint inversion of electrical resistivity and seismic velocity to better characterize the rheological parameters of porous rocks and the potential amount of molten rock. Geochemical methods with a detailed analysis of notable isotope gas and their relative spatial degassing distribution may give a first order indication of the magmatic fluid release. The geochemical methods could confirm the amount of fluid release assumed in this study. If the approximate location of magmatic fluid release exists, then the area between the inner faults F-H and F-F can be a drilling target where high enthalpy fluid flow and supercritical geothermal system are expected, as shown in Figure 7 (scenarios 7 and 8).
The temperature log measured in geothermal well A5, close to fault F, is more difficult to explain (Figure 1). Hydrothermal mineral assemblages identified in drill cuttings correlate with the temperature measured in all geothermal wells of the Asal rift, except for well A5, where a chlorite–epidote mineral assemblage was identified [17]. This mineral assemblage is representative of a high temperature and was observed at a depth between 500 and 1200 m, where a temperature inversion is observed in the well. Thus, a pre-existing high temperature reservoir must have existed before at the location of well A5 before it cooled down (see Figure 2 in [13]). The recent infiltration of seawater may explain this decrease in temperature [13].
6. Conclusions
The numerical modeling of multiphase flow was performed in this study in order to understand the role of hydrothermal fluid circulation inside the Asal rift hydrothermal system. Intermediate and moderate permeability of the host rock was shown to facilitate the formation of a two-phase fluid zone, whereas the presence of a low permeability cap rock unit above the heat source allows the development of a high enthalpy system. Moreover, fault permeability and the total number of faults create selective switch mechanisms between the faults with respect to their location and their hydrothermal activity. Some fault zones switched from discharge to recharge areas depending on the simulation scenarios. Greater fault permeability and a higher total number of faults in the 2D model decreased the life span of the hydrothermal system. Magmatic fluid release implies the development of super-critical fluid flow zones at the rift center and can change the behavior of fault zones acting as recharge or discharge zones. The assumption of higher horizontal permeability inside an anisotropic porous medium incorporated in some simulations best reproduced the observed thermal state measured in geothermal wells A4 and A6. The expected general fluid flow pattern under these simulation scenarios is a hydrothermal fluid flow direction toward both the northeast and southwest of the rift. A comparison between the inferred fluid flow direction of this study with the previous work developed by [13] allows us to hypothesize the presence of a saddle point in the Asal rift where fluid flow direction is toward the southwest, northeast, northwest, and southwest. A full picture of topography-driven flow and density-driven flow in the hydrothermal system of the Asal rift could be better evidenced as the next step with 3D multiphase flow and heat transfer simulations to confirm the presence of the saddle flow point and the general pattern of fluid circulation. Our multiphase flow model assumes that the fluid consists of a single pure water component. The presence of non-condensable gas (CO2) or dissolved salt (NaCl) that could have been taken into account in the numerical simulations by considering a multicomponent fluid would likely increase the rate of ground surface deformation and extend the fluid boiling and condensation conditions [45,46]. In addition, all faults in the Asal rift could be modeled and studied to understand their relative contribution to the discharge and recharge of fluid and heat. Buried faults that are not visible at the surface could further contribute to the hydrothermal fluid circulation and could also be taken into account with proper seismic monitoring.
Author Contributions
Conceptualization, A.H.A.; Methodology, A.H.A.; Software, A.H.A.; Validation, A.H.A., J.R. and B.G.; Formal analysis, A.H.A.; Investigation, A.H.A.; Resources, A.H.A. and J.R.; Data curation, A.H.A.; Writing—original draft, A.H.A.; Writing—review & editing, A.H.A., J.R. and B.G.; Visualization, A.H.A. and J.R.; Supervision, A.H.A. and J.R.; Project administration, A.H.A. and J.R.; Funding acquisition, A.H.A. and J.R. All authors have read and agreed to the published version of the manuscript.
Funding
This research was funded mainly by the Islamic Development Bank through a PhD scholarship awarded to the first author. Therefore, we gratefully acknowledge the financial support from the Islamic Development Bank. A complementary research aid from INRS that was awarded to the second and third authors also contributed.
Data Availability Statement
The data presented in this study are not publicly available due to privacy restrictions. However, data can be obtained on request from the corresponding authors.
Acknowledgments
We would like to thank the contribution of Professor Philippe Pasquier and Engineer Gaetan Sakindi for their precious help on this project. Two anonymous reviewers are also acknowledged for their useful comments of earlier version of this manuscript, which improved our manuscript.
Conflicts of Interest
The authors declare no conflict of interest.
Appendix A

Figure A1.
Simulated temperature and flow vectors for (a) scenario 2A at time 800,000 years and (b) the same scenario 2A with two additional minor faults (six faults instead of four faults) at time 450,000 years. The direction of flow is from the point to the end of straight lines. The length of each line indicates the water vector magnitude, where 1.2 km = 10−6 g s−1 cm−2.

Figure A2.
Simulated temperature and flow vectors for (a) scenario 2A at time 800,000 years and (b) scenario 2B with a dipping angle of faults equal to 60° at time 800,000 years. The direction of flow is from the point to the end of straight lines. The length of each line indicates the water vector magnitude, where 1.2 km = 10−6 g s−1 cm−2.
Table A1.
Verification of mesh independence for simulation of scenario 1 at the location of geothermal A6 well.
Table A1.
Verification of mesh independence for simulation of scenario 1 at the location of geothermal A6 well.
| Number of Elements | Temperature at 1480 m Depth T (°C) | Absolute Value of Relative Difference (%) |
|---|---|---|
| 1200 | 390.484 | --- |
| 3700 | 351.897 | 0.098 |
| 5700 | 365.068 | 0.037 |
| 8000 | 372.647 | 0.020 |
Table A2.
Verification of mesh independence for simulation of scenario 1 at the location of geothermal A4 well.
Table A2.
Verification of mesh independence for simulation of scenario 1 at the location of geothermal A4 well.
| Number of Elements | Temperature at 1480 m Depth T (°C) | Absolute Value of Relative Difference (%) |
|---|---|---|
| 1200 | 199.784 | --- |
| 3700 | 259.183 | 0.297 |
| 5700 | 234.065 | 0.096 |
| 8000 | 233.427 | 0.002 |
References
- Rowland, J.V.; Sibson, R.H. Structural controls on hydrothermal flow in a segmented rift system, Taupo Volcanic Zone, New Zealand. Geofluids 2004, 4, 259–283. [Google Scholar] [CrossRef]
- Rowland, J.V.; Simmons, S.F. Hydrologic, Magmatic, and Tectonic Controls on Hydrothermal Flow, Taupo Volcanic Zone, New Zealand: Implications for the Formation of Epithermal Vein Deposits. Econ. Geol. 2012, 107, 427–457. [Google Scholar] [CrossRef]
- Faulds, J.; Hinz, N. Favorable tectonic and structural settings of geothermal systems in the Great Basin region, western USA: Proxies for discovering blind geothermal systems. In Proceedings of the World Geothermal Congress, Melbourne, Australia, 19–25 April 2015. [Google Scholar]
- Bellani, S.; Brogi, A.; Lazzarotto, A.; Liotta, D.; Ranalli, G. Heat flow, deep temperatures and extensional structures in the Larderello Geothermal Field (Italy): Constraints on geothermal fluid flow. J. Volcanol. Geotherm. Res. 2004, 132, 15–29. [Google Scholar] [CrossRef]
- Driesner, T.; Geiger, S. Numerical Simulation of Multiphase Fluid Flow in Hydrothermal Systems. Rev. Miner. Geochem. 2007, 65, 187–212. [Google Scholar] [CrossRef]
- Rojstaczer, S.A.; Ingebritsen, S.E.; Hayba, D.O. Permeability of continental crust influenced by internal and external forcing. Geofluids 2008, 8, 128–139. [Google Scholar] [CrossRef]
- Weis, P. The dynamic interplay between saline fluid flow and rock permeability in magmatic-hydrothermal systems. Geofluids 2015, 15, 350–371. [Google Scholar] [CrossRef]
- Audin, L.; Manighetti, I.; Tapponnier, P.; Métivier, F.; Jacques, E.; Huchon, P. Fault propagation and climatic control of sedimentation on the Ghoubbet Rift Floor: Insights from the Tadjouraden cruise in the western Gulf of Aden. Geophys. J. Int. 2001, 144, 391–413. [Google Scholar] [CrossRef]
- Mlynarski, M.; Zlotnicki, J. Fluid circulation in the active emerged Asal rift (east Africa, Djibouti) inferred from self-potential and Telluric–Telluric prospecting. Tectonophysics 2001, 339, 455–472. [Google Scholar] [CrossRef]
- Cattin, R.; Doubre, C.; de Chabalier, J.-B.; King, G.; Vigny, C.; Avouac, J.-P.; Ruegg, J.-C. Numerical modelling of quaternary deformation and post-rifting displacement in the Asal–Ghoubbet rift (Djibouti, Africa). Earth Planet. Sci. Lett. 2005, 239, 352–367. [Google Scholar] [CrossRef]
- Doubre, C.; Peltzer, G. Fluid-controlled faulting process in the Asal Rift, Djibouti, from 8 yr of radar interferometry observations. Geology 2007, 35, 69. [Google Scholar] [CrossRef]
- Doubre, C.; Manighetti, I.; Dorbath, L.; Dorbath, C.; Bertil, D.; Delmond, J.C. Crustal structure and magmato-tectonic processes in an active rift (Asal-Ghoubbet, Afar, East Africa): 2. Insights from the 23-year recording of seismicity since the last rifting event. J. Geophys. Res. Solid Earth 2007, 112. [Google Scholar] [CrossRef]
- Aden, A.H.; Raymond, J.; Giroux, B.; Sanjuan, B. New Insights into Hydrothermal Fluid Circulation Affected by Regional Groundwater Flow in the Asal Rift, Republic of Djibouti. Energies 2021, 14, 1166. [Google Scholar] [CrossRef]
- Hassan Aden, A.; Giroux, B.; Raymond, J. Hydrothermal reservoir and electrical anisotropy investigated by Magnetotelluric data, case study of Asal Rift, Republic of Djibouti. Submitt. Publ. J. Appl. Sci. 2022. under review. [Google Scholar]
- Stein, R.S.; Briole, P.; Ruegg, J.-C.; Tapponnier, P.; Gasse, F. Contemporary, Holocene, and Quaternary deformation of the Asal Rift, Djibouti: Implications for the mechanics of slow spreading ridges. J. Geophys. Res. Solid Earth 1991, 96, 21789–21806. [Google Scholar] [CrossRef]
- Manighetti, I.; Tapponnier, P.; Gillot, P.Y.; Jacques, E.; Courtillot, V.; Armijo, R.; Ruegg, J.C.; King, G. Propagation of rifting along the Arabia-Somalia Plate Boundary: Into Afar. J. Geophys. Res. Solid Earth 1998, 103, 4947–4974. [Google Scholar] [CrossRef]
- Zan, L.; Gianelli, G.; Passerini, P.; Troisi, C.; Haga, A.O. Geothermal exploration in the republic of djibouti: Thermal and geological data of the hanlé and asal areas. Geothermics 1990, 19, 561–582. [Google Scholar] [CrossRef]
- De Chabalier, J.-B.; Avouac, J.-P. Kinematics of the Asal Rift (Djibouti) Determined from the Deformation of Fieale Volcano. Science 1994, 265, 1677–1681. [Google Scholar] [CrossRef]
- Smittarello, D.; Grandin, R.; De Chabalier, J.-B.; Doubre, C.; Deprez, A.; Masson, F.; Socquet, A.; Saad, I.A. Transient deformation in the Asal-Ghoubbet Rift (Djibouti) since the 1978 diking event: Is deformation controlled by magma supply rates?: Transient Deformation in Asal Rift. J. Geophys. Res. Solid Earth 2016, 121, 6030–6052. [Google Scholar] [CrossRef]
- Pinzuti, P.; Mignan, A.; King, G.C. Surface morphology of active normal faults in hard rock: Implications for the mechanics of the Asal Rift, Djibouti. Earth Planet. Sci. Lett. 2010, 299, 169–179. [Google Scholar] [CrossRef]
- Kipp, K.; Hsieh, P.; Charlton, S. Guide to the Revised Groundwater Flow and Heat Transport Simulator: HYDROTHERM—Version 3; USGS: Reston, VA, USA, 2008. [Google Scholar]
- Ingebritsen, S.E.; Flinders, A.F.; Kauahikaua, J.P.; Hsieh, P.A. Modeling Groundwater Inflow to the New Crater Lake at Kīlauea Volcano, Hawaii. Groundwater 2021, 59, 7–15. [Google Scholar] [CrossRef]
- Scott, S.; Driesner, T.; Weis, P. The thermal structure and temporal evolution of high-enthalpy geothermal systems. Geothermics 2016, 62, 33–47. [Google Scholar] [CrossRef]
- Hayba, D.; Ingebritsen, S.E. Multiphase groundwater flow near cooling plutons. J. Geophys. Res. Solid Earth 1997, 102, 12235–12252. [Google Scholar] [CrossRef]
- Raguenel, M.; Driesner, T.; Bonneau, F. Numerical modeling of the geothermal hydrology of the Volcanic Island of Basse-Terre, Guadeloupe. Geotherm. Energy 2019, 7, 28. [Google Scholar] [CrossRef]
- Raymond, J.; Langevin, H.; Comeau, F.-A.; Malo, M. Temperature dependence of rock salt thermal conductivity: Implications for geothermal exploration. Renew. Energy 2022, 184, 26–35. [Google Scholar] [CrossRef]
- Okubo, A.; Kanda, W. Numerical simulation of piezomagnetic changes associated with hydrothermal pressurization. Geophys. J. Int. 2010, 181, 1343–1361. [Google Scholar] [CrossRef]
- Titarenko, S.S.; McCaig, A.M. Modelling the Lost City hydrothermal field: Influence of topography and permeability structure. Geofluids 2016, 16, 314–328. [Google Scholar] [CrossRef]
- Scott, S.; Driesner, T.; Weis, P. Geologic controls on supercritical geothermal resources above magmatic intrusions. Nat. Commun. 2015, 6, 7837. [Google Scholar] [CrossRef]
- Afanasyev, A.; Blundy, J.; Melnik, O.; Sparks, S. Formation of magmatic brine lenses via focussed fluid-flow beneath volcanoes. Earth Planet. Sci. Lett. 2018, 486, 119–128. [Google Scholar] [CrossRef]
- Yang, J. Influence of normal faults and basement topography on ridge-flank hydrothermal fluid circulation. Geophys. J. Int. 2002, 151, 83–87. [Google Scholar] [CrossRef]
- Lupi, M.; Geiger, S.; Graham, C.M. Hydrothermal fluid flow within a tectonically active rift-ridge transform junction: Tjörnes Fracture Zone, Iceland. J. Geophys. Res. Solid Earth 2010, 115. [Google Scholar] [CrossRef]
- Faulkner, D.; Jackson, C.; Lunn, R.; Schlische, R.; Shipton, Z.; Wibberley, C.; Withjack, M. A review of recent developments concerning the structure, mechanics and fluid flow properties of fault zones. J. Struct. Geol. 2010, 32, 1557–1575. [Google Scholar] [CrossRef]
- Hurwitz, S.; Christiansen, L.B.; Hsieh, P.A. Hydrothermal fluid flow and deformation in large calderas: Inferences from numerical simulations. J. Geophys. Res. Solid Earth 2007, 112, B02206. [Google Scholar] [CrossRef]
- Vigny, C.; De Chabalier, J.-B.; Ruegg, J.-C.; Huchon, P.; Feigl, K.L.; Cattin, R.; Asfaw, L.; Kanbari, K. Twenty-five years of geodetic measurements along the Tadjoura-Asal rift system, Djibouti, East Africa. J. Geophys. Res. Solid Earth 2007, 112, 1–12. [Google Scholar] [CrossRef]
- Coulon, C.; Hsieh, P.; White, R.; Lowenstern, J.; Ingebritsen, S. Causes of distal volcano-tectonic seismicity inferred from hydrothermal modeling. J. Volcanol. Geotherm. Res. 2017, 345, 98–108. [Google Scholar] [CrossRef]
- Nadeem, S.; Muhammad, N. Impact of stratification and Cattaneo-Christov heat flux in the flow saturated with porous medium. J. Mol. Liq. 2016, 224, 423–430. [Google Scholar] [CrossRef]
- Muhammad, N.; Nadeem, S.; Mustafa, T. Squeezed flow of a nanofluid with Cattaneo–Christov heat and mass fluxes. Results Phys. 2017, 7, 862–869. [Google Scholar] [CrossRef]
- Muhammad, N.; Nadeem, S.; Khan, U.; Sherif, E.-S.M.; Issakhov, A. Insight into the significance of Richardson number on two-phase flow of ethylene glycol-silver nanofluid due to Cattaneo-Christov heat flux. Waves Random Complex Media 2021, 1–19. [Google Scholar] [CrossRef]
- Ahmad, S.; Nadeem, S.; Muhammad, N.; Khan, M.N. Cattaneo–Christov heat flux model for stagnation point flow of micropolar nanofluid toward a nonlinear stretching surface with slip effects. J. Therm. Anal. Calorim. 2021, 143, 1187–1199. [Google Scholar] [CrossRef]
- Matias, A.F.; Coelho, R.C.; Andrade, J.S.; Araújo, N.A. Flow through time–evolving porous media: Swelling and erosion. J. Comput. Sci. 2021, 53, 101360. [Google Scholar] [CrossRef]
- Jupp, T.; Schultz, A. Physical balances in subseafloor hydrothermal convection cells. J. Geophys. Res. Solid Earth 2004, 109. [Google Scholar] [CrossRef]
- Kissling, W.M. Transport of Three-Phase Hyper-Saline Brines in Porous Media: Theory and Code Implementation. Transp. Porous Media 2005, 61, 25–44. [Google Scholar] [CrossRef]
- Pola, M.; Fabbri, P.; Piccinini, L.; Zampieri, D. Conceptual and numerical models of a tectonically-controlled geothermal system: A case study of the Euganean Geothermal System, Northern Italy. Central Eur. Geol. 2015, 58, 129–151. [Google Scholar] [CrossRef]
- Scott, S.; Driesner, T.; Weis, P. Boiling and condensation of saline geothermal fluids above magmatic intrusions. Geophys. Res. Lett. 2017, 44, 1696–1705. [Google Scholar] [CrossRef]
- Coumou, D.; Driesner, T.; Heinrich, C.A. The Structure and Dynamics of Mid-Ocean Ridge Hydrothermal Systems. Science 2008, 321, 1825–1828. [Google Scholar] [CrossRef]
Publisher’s Note: MDPI stays neutral with regard to jurisdictional claims in published maps and institutional affiliations. |
© 2022 by the authors. Licensee MDPI, Basel, Switzerland. This article is an open access article distributed under the terms and conditions of the Creative Commons Attribution (CC BY) license (https://creativecommons.org/licenses/by/4.0/).