Abstract
The global trend is constantly increasing investments in strategic sectors of the economy, for example the electric power industry, which, in many countries, is becoming diversified and dispersed due to the multitude of entities investing in energy production and renewable resources, which leads to an increase in the heterogeneity of investment decisions. There is an urgent need to control the movement of investments, budget funds, as well as their development in the process of implementing investment programs of energy companies. The control of the movement of investments is the most promising direction of studying the subject of finance and audit. The increasing volume of public and private targeted investments in the energy sector and the lack of control over the effectiveness of investment projects (since each program contains several thousand lists of projects) necessitated the introduction of additional regulation of budget spending. The development of a mathematical apparatus for such regulation led to the creation in the Russian Federation of an institute of an independent public technological and price audit (TPA). The TPA is seen as a mechanism to ensure an effective project evaluation and selection process. This article describes methodological improvements using power system optimization models. The Integrated MARKAL-EFOM System (TIMES) was developed as part of the Energy Technology Systems Analysis Program of the IEA-ETSAP, an international community that uses long-term energy scenarios to conduct in-depth energy and environmental analyzes. This approach includes two different but complementary systematic approaches to energy modeling: an engineering approach and an economic approach. The same approach is used when conducting a TSA, when an investment object is evaluated as a set of technological and price parameters. The article considers a model of resource allocation in the energy sector and a mechanism for using TPA for investment projects with state participation in a natural monopoly. An approach to the financial and long-term distribution of investments of electric power companies based on the search for a balance of interests of the supplier and consumer and available energy sources is proposed. A model has been developed to find the optimal plan of technical solutions, taking into account the balance of the possibilities of the electric power industry and the needs of the economy. The relevance of the article is due to the requirements of investment efficiency, since the prevailing share in the costs is occupied by the costs of equipment and the construction of power plants.
1. Introduction
All financiers in the world are busy studying the possibilities of new energy (distributed energy). In Russia, new energy has led to innovations in auditing and financial control. More and more professional organizations are paying attention to the methods of conducting a technological price audit (TPA) and financial control over the investment flow in the energy sector [1,2,3]. Tasks solved with the help of TPA include the following:
- Control of the amount of capital costs for the construction (reconstruction) of energy facilities;
- Control over the availability of sources of financing for the relevant project;
- Project payback control;
- Control of the need to implement a project to develop or improve the reliability of the power system.
From 2023, Russia plans to launch a system of mandatory carbon reporting for enterprises.
Each country has its own drivers for the development of the electric power industry. It all depends on what energy resources the state has, in what climate zone it is located, what technologies and financial resources it owns, how traditional the region’s energy is, how much it costs, and how much the state’s policy is aimed at decarbonization, reducing the carbon footprint. In Russia, the Russian Federation has its own unique conditions, and they differ in each region. According to the data of the Ministry of Energy of Russia (https://minenergo.gov.ru/node/532, accessed on 1 September 2022) the largest volume of installed electrical capacity in the country is accounted for by thermal power plants (about 67%), which consume gas, coal and fuel oil for the production of electrical energy. Further, hydroelectric power plants are in second place in terms of installed electrical capacity (about 20%), and nuclear power plants are in third place, the share of which is about 12%. Renewable energy sources in the Russian Federation account for about 1% of the total installed capacity of power plants of the UES of Russia (https://www.atomic-energy.ru/list/news, accessed on 1 September 2022). It should be noted that despite the current, very small share of renewable energy facilities, this generation direction is rapidly developing and on the horizon of 10 years, its share in the overall balance will increase significantly [4].
The Russian government has approved the Low-Carbon Development Strategy until 2050. The implementation of the target scenario will require investments in reducing greenhouse gas emissions in the amount of about 1% of GDP in 2022–2030 and up to 1.5–2% of GDP in 2031–2050. By 2050, their net emission will decrease by 60% from the level of 2019 and by 80% from the level of 1990. Further implementation of this scenario will allow Russia to achieve carbon neutrality by 2060 (https://www.atomic-energy.ru/list/news, accessed on 1 September 2022).
The increasing volume of public and private targeted investments in the energy sector and the lack of control over the effectiveness of investment projects (since each program contains several thousand project lists) necessitated the introduction of additional regulation of budget spending. The development of a mathematical apparatus for such regulation led to the creation of the institute of independent technological and price audit (TPA). The TPA is the most effective mechanism for ensuring an effective evaluation and selection of a project with a strict time limit [5].
Due to the aggravation of environmental problems due to global climate change, as well as the desire of many countries for energy independence, renewable energy sources (RES) have appeared. The impetus was also the fact that in 2015 at the COP21 Paris conference on climate change, the leadership of 196 countries of the world came to an agreement “on taking measures to prevent devastating climate change” (https://www.c-o-k.ru/articles/razvitie-raspredelennoy-generacii-v-mire-i-v-rossii, accessed on 1 September 2022).
So far, there are no serious drivers in the field of reducing the carbon footprint in Russia, but there are many projects for alternative, that is, small-scale, distributed energy in cases where it is economically beneficial.
The main emphasis is now placed on meeting all the needs for energy resources based on innovative technologies. The requirements for equipment and technologies contain the standards of the “green economy”. These requirements are the guarantor of investments in the Russian Federation. Currently, numerous state and interstate programs are being implemented to transition from centrally controlled large high-tech generation integrated by high-voltage networks to generation at the place of consumption, to “smart” power distribution networks with local “system operators”, proactive consumption, and changing the configuration of energy supply for freight and public transport and others providing “distribution” solutions and technologies.
For example, all public transport methods in large cities in Russia are already absolutely safe for the environment.
In particular, it should be noted that during the COVID-19 pandemic, the population and many companies migrated from large cities to the periphery, which contributed to the use of alternative energy sources. After the pandemic, the reverse process was observed, but the economic situation has changed a lot. The structure and cost of rent and energy resources have changed dramatically.
Hydropower is an alternative power source. Nuclear power in Russia, and in the world generally, is a serious alternative to gas and coal power. Now, consider the sun, the wind, and in the very distant future, junk energy or tidal. In Russia, these two industries have been created thanks to the participation of PJSC Rosnano; the Hevel plant in Chuvashia produces solar panels that are in the top five in terms of energy efficiency in the world. There are three factories in Nizhny Novgorod, Ulyanovsk and Taganrog, which are engaged in the construction of wind farms [5].
The distribution of investments among projects and programs focused on energy conservation and energy efficiency is extremely uneven. For example, in the Russian Federation, the maximum investment flows are now concentrated in the Kaluga, Magadan and Omsk regions (https://www.economy.gov.ru/material/file/d81b29821e3d3f5a8929c84d808de81d/energyefficiency2019.pdf, accessed on 1 September 2022). Energy is also unevenly generated by companies and regions. The planning of generating capacities, as well as the development of environmental policy tools and incentives for cost-effective and reliable implementation of energy policy goals is quite a difficult task, especially for entities located in different energy regions. In order to remain on the energy market, generating companies must form an optimal product portfolio for various consumers. The formation of an assortment of energy products is the task of microeconomics. Currently, this market is just beginning to take shape; however, a special TIMES module has been created to model the production process of generating companies [6,7].
The main criteria for choosing an investment program are energy security, capacity utilization and efficiency in the use of energy resources. For example, The European Union Dynamical Exascale Entry Platform (EU-DEEP) offered recommendations for almost every country that need to be achieved to ensure a technological safety improvement program for a number of years.
According to the authors, to develop a plan for supplying local economic entities with energy resources, one should use the theory of production functions and mathematical optimization.
Forming the energy policy of a generating company is a rather difficult task, especially for entities located in regions with different levels of energy supply and different needs of the population. Generating companies are now renewing their equipment fleet. In all countries of the world, this process is carried out with state support.
Therefore, there is a need for public audit control, technological price audit. For an effective TPA, audit standards are constantly being developed and improved, both at the national and international levels for facilities that meet the criteria for mandatory audit [8,9]. Thus, this article attempts to ascertain which group of actors should invest in which generation technology, and where in the Russian Federation in particular, so that the supply sector is aimed at achieving the goals of the energy program at minimal system costs.
2. Materials and Methods
The intersection of the issues of mathematical modeling of the flow of investments, distribution of energy resources and optimization of their structure, innovations in the energy sector and audit is an innovative area of research. TPA is a Russian innovation in financial control. The main difference between TPA and conventional audit is that TPA is a public mandatory audit, which is divided into two aspects: technological and price. A technological audit is an expert assessment of the justification for the choice of the designed technological and design solutions, as well as their compliance with modern materials and equipment necessary for the operation of a capital construction facility. A price audit is an expert assessment of the cost of a capital construction object, taking into account the technological audit. Thus, TPA is an independent expert assessment of the economic, technical and technological characteristics of a capital construction investment project at different stages of the project life cycle, carried out by an independent organization.
E. Brisset (2018) [10], financial director of Schneider Electric, draws attention to the fact that distribution processes are such that soon “everyone will be his own power engineer.” E. Brisse describes the change in distribution: direct external customers have appeared and the partner sales channel is still operating; increased diversification into alternative energy sources, for example, increased contacts with green energy companies and power grid companies. Now, many companies are working on the complete unification of processes.
Control over the investment flow should be carried out at various levels: the state, professional specialized organizations, society and investors. According to the Russian Ministry of Energy (https://minenergo.gov.ru/node/558, accessed on 1 September 2022), the volume of financing of investment programs of the largest state-owned electric power companies amounted to more than 614 billion dollars. US and institutional investors account for most of the investment, although the energy sector has many market shareholders. At the same time, the largest share of investments fell on the power grid complex of the country (PJSC Rossetti, PJSC FGC UES, part of the enterprises of the PJSC RusHydro group). The volume of financing investment programs of the electric grid complex once again confirms the special attention paid to the state regarding the financial control of investment activities. One of the tools of this type of control is the legislation in the field of technological and price audit of investment programs of electric grid organizations. One of the signs of the correct direction of financial control of grid companies, chosen by the state, is the result of the implementation of the annual plan for financing investment programs by electric power industry entities for 2021, according to which PJSC Rossetti and PJSC FGC UES are the leaders in the execution of financing investment programs; see Figure 1.
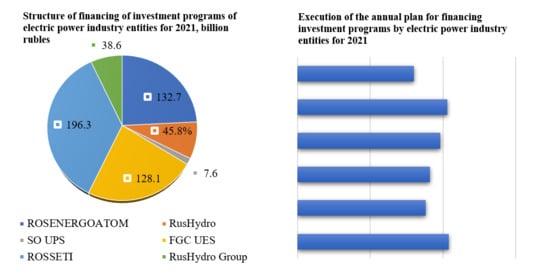
Figure 1.
Structure of financing of investment programs of state electric power companies (https://minenergo.gov.ru/node/558, accessed on 1 September 2022).
With the help of the TIMES model generator, a significant number of power system models have been developed. MARKAL/TIMES is a model based on linear programming for energy system investment at the lowest cost, optimized in accordance with a number of restrictions of investors and users located in one of the 13 regions of the Russian Federation with special features in energy supply [11]. However, most models of energy systems consist of several medium actors representing large groups of decision makers, without taking into account their heterogeneity both in terms of investment volume and in terms of their location [12]. The volume of investments in the electric power industry of the Russian Federation annually amounts to 614 billion dollars. The United States and the bulk of investment come from institutional investors, although the energy sector has many market shareholders. The formation of an economic-mathematical model for the distribution of energy resources and investments and their optimization by region and by project is a complex process of long-term financial planning.
It is necessary to take into account the peculiarities of the resource potential, the cost of transportation and production, the heterogeneity of investors, including institutional ones. Energy development is now oriented towards distributed generation, due to the fact that today, decentralization is a megatrend in the world, according to A. Troshin (2019). Therefore, now it is necessary to create not just substations that expand the distribution network, but alternative generators. A. Troshin (2019) [5] gives the following example. "Suppose you have a house in a village with a peak demand of 50 kilowatts. The village gives only 20 kilowatts. Where do you get the remaining 30 kilowatts? We put solar panels on the roof, and a lead-acid storage device in the basement, which produces 30 kilowatts of energy. This is the best world practice." In general, in a number of countries, integrated energy planning is a regular process based on the continuous revision of the calculated tariff values in accordance with the actual data on the economic situation on the scale of the country, region, and Figure 2.
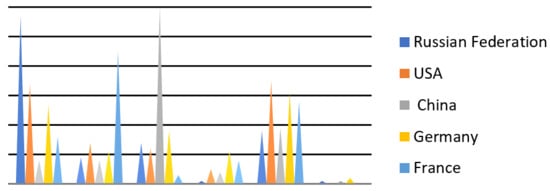
Figure 2.
Structure of alternative energy resources in 2021 (Global Energy Trends—2022 Edition (https://yearbook.enerdata.ru/total-energy/world-consumption-statistics.html, accessed on 1 September 2022).
According to the commentary of [13,14] the following issues are relevant within the framework of the energy development task:
- (1)
- Determination of priorities in production, volumes or efficiency;
- (2)
- Regulation of dependencies between the rate of commissioning of generating capacities and the growth of the risk of tariff increases;
- (3)
- Risks of excess capacity;
- (4)
- Drawing up long-term forecasts for fuel and energy: assortment, change in the structure of assets, cost forecast, assessment of volatility in the need for investment.
Consider the starting points for modeling the project of an electric power company:
- (1)
- At present, there is no competitive advantage of Russian manufacturers in terms of costs; moreover, the energy intensity is the highest in the world;
- (2)
- The efficiency of energy consumption should be regulated by multi-unit tariffs, “price signals” [15];
- (3)
- The resource conservation policy should allow the transition to responsible investment;
- (4)
- Distribution processes should take into account the elasticity and optimization of alternative supply additions [16].
Ordering new equipment by the electric power industry to provide the consumer with the necessary amount of electrical and thermal and alternative energy can lead to the construction of excess capacity and inefficient use of investments, energy intensity is still too high (especially in the Russian Federation), and distribution processes are limited. The relevance of the audit to ensure the formation of an optimal investment program for the development of the energy complex is due to the high costs of purchasing power equipment, uneven distribution of investment programs across regions and different levels of financial control [17,18]. The energy system of the Russian Federation consists of the UES of Russia (seven unified energy systems (IPS)—the IPS of the Center, the Middle Volga, the Urals, the North-West, the South and Siberia) and territorially isolated energy systems (Chukotka Autonomous Okrug, Kamchatka Krai, Sakhalin and Magadan regions, Norilsk-Taimyr and Nikolaev energy regions, energy systems of the northern part of the Republic of Sakha (Yakutia)) (http://www.suenco.ru, accessed on 1 September 2022).
Graphs of peak loads of energy consumption by consumers, along with energy supply quality standards and the degree of reliability of the energy system, should be taken into account when drawing up a forecast of energy consumption. This can be done based on monitoring, elasticity (both in terms of price and income), establishing the type of relationship between the average per capita income of a family and the quantity and structure of electricity consumption. To form a program for the development of the energy complex, it is necessary to consider the entire set of possible technical solutions that can be implemented at all stages of the technological chain “production—transportation—consumption of energy resources”, taking into account the elasticity of the population’s demand for energy, see Table 1. In the short term, electricity is a commodity essential, as can be seen from the data in Table 2 in almost all countries, for which there are practically no substitute goods, and in all countries, see Table 2. This gives reason to expect short-term price elasticity to be low. In the long run, electricity demand should be more elastic. For an industrial consumer, the demand for electricity can be written as a cost minimization problem and the Cobb-Douglas production function can be used for each generating company.
where is the Cobb-Douglass production function, the amount of electricity generated by the generating company, kWh; A is a technological coefficient determined by a technological audit, reflecting the specifics of the equipment of a given company, for example, the coefficient of power utilization, wear and tear, the coefficient of technological replacement of resources [19,20,21,22]; L is the number of employees; w is the average wage; is the price of the i-th resource (oil, coal, natural gas, electricity, biomass, thermal power engineering); —the cost of consumed resources for energy production; R is a vector of resources; K is the amount of capital consumed, investments in the generating company; —price of capital; Y is the budget constraint of the generating company; —elasticity of resources: labor, raw materials, capital; —the sum of elasticity’s shows the type of production scale.

Table 1.
The largest electric power companies (http://www.suenco.ru, accessed on 1 September 2022).
Table 2.
Coefficients of elasticity of energy demand for the population for 2014–2019 (%) (https://www.economy.gov.ru/material/file/d81b29821e3d3f5a8929c84d808de81d/energyefficiency2019.pdf, accessed on 1 September 2022).
Defining the value of elasticity:
The price elasticity of demand for the labor factor will be equal to:
The elasticity of demand by income determines which category the energy product currently belongs to: the worst product, the first necessity, the second or luxury:
The price elasticity of demand for the raw materials, resources factor will be equal to:
The price elasticity of demand for the capital factor will be equal to:
The condition for reaching the limit of technology use is determined by the equality of the average and marginal products differentiated by energy resources:
MPr = APr
The database for the purposes of econometric estimation was prepared on the basis of sources from Rosstat and the Ministry of Energy of Russia.
For example, one should take into account the spread of smart home and smart system technologies for energy supply of companies, RAB (Regulatory Asset Base) investment (this is a system of long-term tariff formation, the main purpose of which is to attract investments in the expansion and modernization of infrastructure) which is carried out in parallel with TPA. Companies in the RAB system receive a guaranteed return on investment and return on investment sufficient to service loans and make a profit. In addition, they receive an incentive to reduce costs, since the saved funds remain in the company, in contrast to the “cost plus” system used historically in Russia. From the point of view of consumers, the advantages of the RAB system are the increased reliability of power supply and the quality of services provided through new investments [23,24].
To apply RAB investment, the guidelines for tariff regulation using the method of return on invested capital are applied, which define the rates of return on invested capital.
Unfortunately, according to forecasts, the target benchmarks for the energy intensity of GDP in the Russian Federation are to reduce it by at least 60% while maintaining the current production rates. This goal will be achieved according to forecasts only in 2043, with a significant lag behind the plan (https://www.economy.gov.ru/material/file/d81b29821e3d3f5a8929c84d808de81d/energyefficiency2019.pdf, accessed on 1 September 2022).
Let us denote the set of all possible technical solutions at all stages of the technological process of generating energy resources as J (j = 1, 2, …, J), and xji are the costs of the technical solution of the energy complex development program in the region. The index j shows the number of the activity from the entire set of possible activities J. The index i shows what kind of resources the activity belongs to. In this case, i = 1—nuclear power plants, i = 2—hydropower facilities, i = 3 thermal power plants. As can be seen from Figure 1, i varies in the range from 1 to 6. Then the set of technical solutions for the XJi energy complex development program for resource i activities includes: {x1i, x2i, …, xj − 2i, xj − 1i, xji, xj + 1i, xj + 2i, …, xJi}. The xji variable from the set of technical solutions can take the values 0 or 1 depending on whether the measure is implemented or not (1 if the measure is implemented, and 0 if it is rejected).
For example, based on the classical microeconomic theory of profit maximization for a household, we can write down the optimization problem of utility maximization, in which the demand for electricity is formed:
where U (q, r) is the utility function for the household; q is the volume of electricity consumption; r is the volume of consumption of other goods.
pe is the price of electricity; pr—the price of other goods (the cost of the consumer basket); I—the budget constraint of the household (its income).
In the long term, electricity consumers have the opportunity and time to form a stock of power-consuming equipment in an optimal way. Accordingly, the long-term model does not directly take into account the volume of stocks of power-consuming equipment, implying that in the long term it is formed in an optimal way—depending on prices and incomes. Each investment project has its own characteristics, which can be divided into the following four groups. Economic features [25]:
- –
- The amount of capital costs for the implementation of the investment project Kj (thousand rubles);
- –
- The service life for which the project is designed Tj (year);
- –
- The cost of operating costs in the t year of the service life of the solution E t (thousand rubles);
- –
- The cost of debt service costs associated with financing the development program at all stages of the production cycle for T years Kj (thousand rubles).
- –
- Technological features (they determine the method of production of electrical and thermal energy): CHP, TPP using various types of fuel (coal, gas, fuel oil, nuclear energy, etc.);
- –
- Hydroelectric power plants;
- –
- Tidal power plants; solar panels;
- –
- Solar collectors; geothermal stations;
- –
- Wind power plants;
- –
- Combined methods of energy production using two or more technologies.
- –
- Signs of a logistical connection between energy production and its consumption:
- –
- Scheme of centralized power generation;
- –
- Scheme of decentralized power generation;
- –
- Scheme of combined (part of centralized, part of decentralized) energy generation;
- –
- The scheme of energy transport from the producer to the consumer;
- –
- Energy storage scheme.
- –
- Technical features:
- –
- Is the volume of produced resource per year Wji;
- –
- Regime maps of resource depletion Wi(t).
- –
- The initial data for the formation of a program for the development of the energy complex are:
- –
- Data on the demand for energy resources for the period of implementation of the development program;
- –
- A source of energy for the production of a resource within the boundaries of the energy complex;
- –
- Environmental requirements that limit the use of technical solutions and technologies.
The amount of funds for the project by years of program implementation will be denoted by CFig(t). The volume of investments should be made taking into account the long-term forecast of energy consumption. To do this, it is necessary to assess consumer demand depending on the value of the non-linear tariff for the energy resource:
pit = generation cost (up to 40% of the price) + transmission tariff (up to 50% of the price) + sales and infrastructure surcharges
The tariff should be set in such a way as to encourage resource conservation of consumers.
In a deterministic form, the dependence of consumer demand g in the t-th year for the corresponding resource i have the form:
The volume of resource consumption for all consumers will be equal to:
where G—j, investment volume per year (g = 1, 2, G).
The depth of the forecast should correspond to the time for which the project is designed. When forecasting, the probabilities of the occurrence of a particular scenario should be determined.
Let us designate the scenarios of dynamics in time of demand for resources—µi. The number of developed scenarios for changing demand over time can be different.
The most likely scenario (“before and after” (BAU)) is a continuation of the current conditions, when there is no environmental policy or model improvements, and serves as a benchmark. In addition to BAU, several other scenarios are considered:
- (1)
- Achievement of certain quotas for renewable energy sources provided for by the Law on Renewable Energy Sources for each control year of the modeling horizon (RES);
- (2)
- The introduction of taxes on carbon emissions, which increase during the control years of the modeling horizon (CO2);
- (3)
- Resource-saving technologies that reduce energy consumption.
The mathematical expectation of the volume of consumption for the corresponding type of resource for the S-th scenario will be equal to:
In the conditions of state regulation where Wi(t) is the volume of investments in the project in the t-th year by the consumer g, units. Res./year; µS is the probability of the implementation of the s-th scenario.
Each variant of the set of technical solutions of the energy complex development program is determined by the volume of the produced resource W i for the entire set of technical solutions J in at all stages of the technological process (production, transportation and consumption of energy resources). In this way, a system of constraints can be defined. Each variant of the set of technical solutions of the energy complex development program is determined by the volume of the produced resource W i for the entire set of technical solutions J in accordance with the schedule of its consumption Wg in the entire range (T):
WJi > Wgi; Wji (T) > Wgi (T)
Taking into account the probabilities of the occurrence of resource consumption scenarios in the entire range T:
Wji > M (Wi); Wji (T) > M (Wi (T))
The amount of excess in relation to the volume of consumption of energy production can be considered a measure of ensuring the reliability of energy supply. A measure of reliability is any algorithm for judging whether there is a necessary level of reliability or a degree of confidence in the performance of specified functions by some object in the past, present and future tense. The measure of reliability includes indicators and criteria (logical and analytical expressions) related to the algorithm for inferring a judgment about reliability [25].
The cost of the costs of ensuring the reliability of energy supply is denoted by:
Vi (T) = f (Wi (T) − Wi (T)).
The higher the reliability of the power supply system, the more expensive the cost of generated energy.
We can propose the following formulation of the target function for the formation of an optimal program for the development of the energy complex: meeting the needs of consumers for heat and electric energy in the required volume and with the required reliability of energy supply, with minimal costs at all stages of the technological process production, transportation and consumption of energy resources. Under the conditions of state regulation of energy tariffs, the tariff directly depends on the production costs and transportation costs of energy resources.
The volume of capital investments in year t for some technical solution j is equal to Kj and for T years is calculated by the formula:
For a certain set of technical solutions in the amount of J we obtain:
The operating costs per year e for some event o will be equal to Uo and for E years will be:
The operating costs associated with the implementation of technical solutions for T years in the amount of J will be equal to the sum of the operating costs for all activities:
Energy conservation policy involves the protection of biodiversity and involves the differentiation of ownership of energy resources to ensure competition in the field of production.
Attracting sources of financing leads to the appearance of debt servicing costs on a loan allocated for the implementation of a technical solution j per year t in the amount of:
The cost of debt servicing at all stages of the production cycle for T years will be:
The costs of ensuring the reliability of energy supply for a certain set of technical solutions in the amount of O over E years will be:
Then the objective function of forming an optimal program for the development of the energy complex for resource i can be written as follows:
3. Results
There is a change in the energy development trend in the world, which is manifested in a slowdown in the growth rates of production and consumption of primary energy resources and electricity in the general context of a decrease in the growth rates of the world population and GDP. The developed model makes it possible to find the optimal plan of technical solutions, taking into account the balance of the possibilities of the electric power industry and the needs of the economy in energy resources, taking into account the scenario being implemented in the selected region. On the basis of the plan for the production of energy products, equipment is selected and public investments are distributed, the effectiveness of which is assessed by audit methods. The approach considered here reflects the relationship between investment and the distribution structure of alternative sources. Thus, it is shown that the relevance of consideration in the programs for the development of technical solutions in the energy sector is due to the structure of the cost of energy, in which, as already noted above, the predominant share (60%) is occupied by the costs of building power plants, including the entire value chain from energy equipment suppliers to the construction of power plants. In terms of energy supply, this includes fuel extraction, primary and secondary production, and external imports and exports. The “agents” on the supply side are the “producers” and are listed in Table 3. Different types of energy are delivered to consumers in the residential, commercial, agricultural, transport and industrial sectors. “Agents” from the side of demand for energy are “consumers”, for whom a multi-level personalized tariff for energy products is being developed. Solar energy, wind energy, wave energy, biomass energy, geothermal energy and hydroelectricity are all examples of sustainable energy. The mathematical, economic and engineering relationships between these “producers” and “consumers” of energy are the basis underlying the TIMES models [6,7]. Approbation of the considered model contributes to the transition of the economy from the stage of high energy intensity to a new level of increasing the rate of energy efficiency based on the use of renewable sources. Based on the financial statements of TNCs of energy companies, a calculation was made using a mathematical model, the calculation results are presented in Table 3, and these are the recommended optimal values.
Table 3.
Total indicators by companies.
Table 3 shows the optimal structure of resources for generating companies for energy production, taking into account the optimization of investments and taking into account the specifics of the regions, which is determined by the technology audit. The model allows defining future investment roles.
In addition, the cost-effective path for the system indicates that institutional investors should be solely focused on making all high-value investments in offshore wind power in the north. The rest of the investment potential of institutional investors in other regions should be directed to traditional sources. The relative roles of regions show the cumulative net electricity exchange between regions over the modeling horizon to determine the roles each region should play in the future to form the system at the lowest cost. The relative roles of regions show the cumulative net electricity exchange between regions. Modeling allows one to determine the roles that each region should play in the future to form a system for the production of energy products at the lowest cost.
This additional generation is then exported to the south and west.
In the BAU scenario, the fuel mix for electricity generation does not change significantly over the modeling horizon, with the exception of phasing out nuclear power from 2023. However, with the policy scenario imposing targets for the share of renewable energy sources (RES), hard coal is replaced by renewable sources, while the system remains relatively inert towards phasing out lignite until the end of the simulation horizon. In CO2 emission scenarios, natural gas is noticeably rapidly replacing lignite and hard coal, as they are costing the system prohibitively due to the increasing carbon tax imposed. Given the significant amount of carbon emissions through natural gas, as well as the steady increase in carbon taxes over the modeling horizon, carbon capture and storage (CCS) in combination with natural gas and biomass technologies, as well as other renewable energy sources, will gradually replace most of the fossil fuels by 2060. The total net electricity exchange between regions over the entire modeling horizon (only in scenarios with regional division and transmission between regions) will increase significantly [21].
The total net electricity exchange between regions over the entire modeling horizon (only in scenarios with regional division and transmission between regions).
Since the goal in both scenarios is to achieve a certain share of renewable generation in final electricity consumption (not total generation), these two factors remain the same in both scenarios. Thus, losses in the network are compensated by more energy production.
4. Discussion
The concept of life in the energy industry is changing rapidly, with most smart energy solutions coming from Europe and the United States. Gary Huang (2021) [26] observes that if the country does not engage in digitalization in the energy sector, this may lead to a situation where the national substation will be controlled from abroad. The problems of “control interception” in the energy sector were dealt with by such scientists as Gamayunova O., Vatin N. (2015) Clayton, E. (1999) [27].
Technical innovations with renewable energy sources are now implemented by many companies around the world. For example, the Rockefeller Family Foundation (RFF) and the IKEA Charitable Foundation decided to create a joint fund to support renewable energy programs [28].
The authors of [8] describe the basic procedure for conducting TCA. The authors of [18] considered the problems of optimizing design solutions and controlling the reliability of costs. The authors Karakozova I.V., Prokhorova Y.S. (2015) [17] considered the technological and price audit of the terminal-logistics center project. The authors of Savushkin S.A., Gorbunov V.G., Tsyganov V.V., Lemeshkova A.V. (2016) [9] considered the controlling of investment programs of electric power companies. The authors of Gryzunova N.V., Kiseleva I.A., Tramova A.M. (2021) [29] showed that the solution of the problem of finding the optimal option for designing energy facilities essentially boils down to choosing the optimal method for comparing capital costs and operating costs. Klyuev, Yu.B. et al. (1992) [25] showed that the solution of the problem of finding the optimal option for the design of energy facilities essentially comes down to choosing the optimal way to measure capital costs and operating costs. At the same time, the publications known to us do not consider the issues of forming an optimal investment program for the development of the energy complex, taking into account the limited amount of financial resources allocated for investment needs.
Models for optimizing the structure of electrical networks are highlighted by Yu.B. Klyuev Yu.B (1992), Savushkin S.A., Gorbunov V.G. Artyugina and V.R. Okorokov (1988), Brisset E. (2018) and Wang S. et al. (2020) [9,22,25]. It is shown that the solution to the problem of finding the optimal design option for energy facilities essentially results in choosing the optimal way to measure capital costs and operating costs Ogedengbe E., Aderoyu P.A., Shitta M.B. (2019) [30].
At the same time, the publications known to us do not consider the issues of forming an optimal program of projects for the development of a complex of distributed energy and TPA to control the effectiveness of capital investments.
5. Conclusions
The sustainability and diversity of the types of energy produced in the region can be achieved by modeling distributed energy, optimizing consumption and available resources. The local assortment base determines the structure of the equipment fleet. Planning TPA involves the use of the TIMES model generator.
- In the course of the analysis, it can be concluded that the existing methodology for conducting TPA does not take into account such a stage in the implementation of an investment project as optimizing the structure of consumption of energy resources in the energy system.
- The TPA methodology will be more efficient, covering a wide range of financial parameters, if TPA is carried out at the stage of business planning.
- The TPA mechanism will allow simultaneous use of key indicators and control them within the approved boundaries.
- Comparative analysis showed that the TPA methodology is rational, but the risks during the operation period are significant.
- We consider it expedient, within the framework of measures to develop the existing methodology for conducting TPA for investment projects with state participation, to expand the list of ongoing stages. Additionally, take into account the methodology for conducting TPA for investment projects of natural monopoly facilities.
Subsidiaries of electric power organizations are often natural monopolies.
The practice of using TPA will expand, as the Russian Energy Development Strategy until 2035 includes measures to decarbonize, replicate and scale low- and non-carbon technologies, stimulate the use of secondary energy resources, changes in tax, customs and budgetary areas. The strategy provided for the development of green finance, measures to increase the absorption capacity of forests and the utilization of greenhouse gases. Currently, programs are already being formed that are consistent with the recommendations of the European Union Dynamical Exascale Entry Platform (EU-DEEP) for the use of alternative energy sources in the coming decades.
Author Contributions
Conceptualization, N.G.; methodology, K.V.; software, V.M.; formal analysis, I.K.; writing—original draft preparation, M.B.; writing—review and editing, N.G. All authors have read and agreed to the published version of the manuscript.
Funding
This research received no external funding.
Data Availability Statement
Not applicable.
Conflicts of Interest
The authors declare no conflict of interest.
References
- Schubert, T.; Breitschopf, B.; Plötz, P. Energy efficiency and direct and indirect consequences of energy audits and implementation support programs in Germany. Energy Policy 2021, 157, 112486. [Google Scholar] [CrossRef]
- Moreva, Y.A.; Surovtsov, M.M.; Panova, E.A. Development of Distributed Generation in the World and in Russia; Kurchatov Institute: Moscow, Russia, 2020; Available online: https://www.c-o-k.ru/articles/razvitie-raspredelennoy-generacii-v-mire-i-v-rossii (accessed on 1 September 2022).
- Clayton, E. Debt, Investment, and Product Market Competition. 11 November 2008. NYU Working Paper No. FIN-99-056. Available online: https://papers.ssrn.com/sol3/papers.cfm?abstract_id=1298329# (accessed on 1 September 2022).
- Degtyarev, K.S. Global Energy Trends. Available online: https://yearbooi.enerdata.ru/total-energy/world-consumption-statistics.html (accessed on 1 September 2022).
- Troshin, A. Energy Develops Through Customization, Interviews, Technologies, 10 October 2019. 12:00. Moscow business Magazine Invest Foresight. 21 June 2021. Available online: https://www.if24.ru/ (accessed on 1 September 2022).
- Keppo, N.S. Incorporating homeowners’ preferences of heating technologies in the UI TIMES model. Energy 2018, 148, 716–727. [Google Scholar]
- Tash, A.; Akhanchyan, M.; Fahl, E. Improved representation of investment decisions in the German energy supply sector: An approach to optimization using the TIMES model. Rev. Energy Strategy 2019, 26, 100421. [Google Scholar] [CrossRef]
- Kutsenko, D.I.; Petrochenko, M.V.; Naboka, A.A. Methods of Conducting a Technological and Price Audit of an Investment and Construction Project. Alfabuild 2019, 3, 23–35. [Google Scholar]
- Savushkin, S.A.; Gorbunov, V.G.; Tsyganov, V.V.; Lemeshkova, A.V. Technological and Price Audit of the Terminal and Logistics Center Project. 2016, pp. 47–56. Available online: https://elibrary.ru/item.asp?id=26377377 (accessed on 1 September 2022).
- Brisset, E. Smart Energy is a Necessity. Invest Foresight, 4 September 2018. Available online: https://www.if24.ru/gari-huan-uskorit-tsifrovizatsiyu-rossii/ (accessed on 1 September 2022).
- Salvucci, R.; Tattini, J.; Gargiulo, M.; Lehtil, A.; Iarlsson, I. Modelling transport modal shift in TIMES models through elasticities of substitution. Appl. Energy 2018, 232, 740–751. [Google Scholar] [CrossRef]
- Azam, W.; Khan, I.; Ali, S.A. Alternative energy and natural resources in determining environmental sustainability: A look at the role of public spending on final consumption in France. Environ. Pollut. 2022, 1–7. [Google Scholar] [CrossRef]
- Belussi, L.; Danza, L.; Svaldi, S.D. Integrated Intelligent Energy Audit System: Methodology and Application. Energy Proced. 2017, 140, 231–239, ISSN: 1999-2300. [Google Scholar] [CrossRef]
- Frani, M.Z.; Goyal, V.I. Testing the peciing order theory of capital structure. J. Financ. Econ. 2003, 67, 217–248. [Google Scholar] [CrossRef]
- Bergenzle, K.; Guniel, F.A. Intersectoral flexibility, investments in storage and integration of renewable energy sources: Taking into account the impact of network tariffs. Energy Policy 2022, 164, 112937. [Google Scholar] [CrossRef]
- Çağman, S.; Soylu, E.; Ünver, Ü. Research of easy-to-use energy efficiency indicators for energy audit and energy monitoring of industrial compressed air systems. J. Clean Prod. 2022, 365, 132698. [Google Scholar] [CrossRef]
- Karakozova, I.V.; Prokhorova, Y.S. Technological and price audit as a tool for optimizing design solutions and monitoring the reliability of costs in construction. Econ. Entrep. 2015, 56, 682–686, ISSN: 1999-2300. [Google Scholar]
- Wang, X.; Zhao, T.; Chang, C. FAHP-MCGP Integrated Approach to Project Selection and Resource Allocation in risk-based Internal Audit Planning: Case Study. Comput. Ind. Eng. 2020, 152, 107012. [Google Scholar] [CrossRef]
- Kukoverov, M.V. RANEPA, Moscow On Price Elasticity of Electricity Demand. J. New Econ. Assoc. 2019, 2, 70–92. [Google Scholar] [CrossRef]
- Liu, C.; Alharti, M.; Khan, I. Nonlinear analysis of the impact of Natural resources and education on environmental quality: Green Energy and its Role in the Future. Resources 2022, 79, 102940. [Google Scholar]
- Zachary, A.; Tavria, V.; Li, G. Ensuring sustainable consumption and production patterns in Africa: Data from green energy perspectives. Energy Policy 2022, 169, 113183. [Google Scholar]
- Artyugina, I.M. Methods of Technical and Economic Analysis in Energy [Test]; Artyugina, I.M., Korokov, L.V.R., Eds.; Publishing House: Moscow, Russia, 1988; 264p. [Google Scholar]
- Liu, C.; Alharti, M.; Khan, I. The role of the Trilemma in the Global Energy sector Transition to sustainable Energy: A Study of Economic Growth and the Environment. Energy Policy 2022, 170, 113238. [Google Scholar] [CrossRef]
- Feiju, F.; Pfeiffer, A.; Dudich, N. A model of long-term investment in capacity and operational planning of energy consumption using power-to-X technologies and flexibility. Renew. Sustain. Energy 2022, 167, 112781. [Google Scholar]
- Kluev, I.B.; Lavrov, A.N.; Okorokov, V.R. Economic-Mathematical Modeling of Manufacturing Systems Energy: Studies; For Stud. Universities, Higher School: Moscow, Russia, 1992; 430p. [Google Scholar]
- Huang, G. We will help accelerate the digitalization of Russia. Invest-Foresight, 25 June 2021; INFOLine Information and Analytical Agency, Russia, Saint Petersburg. Available online: https://www.advis.ru/php/view_news.php?id=91F04F3A-6D93-FE4A-BE39-108EA409B2EF (accessed on 1 September 2022).
- Gamayunova, O.; Vatin, N. The role of the state and citizens to improve energy efficiency. Appl. Mech. Mater. 2015, 725–726, 1493–1498. [Google Scholar] [CrossRef]
- The Rockefellers Will Lead the Development of Green Energy. Moscow Business Magazine Invest Foresight, 21 June 2021. Available online: https://www.if24.ru/ (accessed on 1 September 2022).
- Gryzunova, N.V.; Kiseleva, I.A.; Tramova, A.M. Controlling Investment Programs of Electric Power Companies, Russia. Bull. North Cauc. Fed. Univ. 2021, 49–62. Available online: https://vestnikskfu.elpub.ru/jour/article/view/174/174 (accessed on 1 September 2022).
- Ogedengbe EO, B.; Aderoy, P.A.; Shita, M.B. Optimization of energy efficiency by determining the size of a renewable energy project using several target functions. Energy Rep. 2019, 5, 898–908. [Google Scholar] [CrossRef]
Publisher’s Note: MDPI stays neutral with regard to jurisdictional claims in published maps and institutional affiliations. |
© 2022 by the authors. Licensee MDPI, Basel, Switzerland. This article is an open access article distributed under the terms and conditions of the Creative Commons Attribution (CC BY) license (https://creativecommons.org/licenses/by/4.0/).