Abstract
In order to solve the poor flow performance issues of selective catalytic reduction (SCR) denitration systems, the effect of the static mixer on the flow field was studied using computational fluid dynamics (CFD) numerical simulations. Based on the analysis of the original SCR denitration system, two static mixers were selected to explore their influence on system performance. The results show that both static mixers can effectively improve the denitration performance under different conditions. The static mixer with a rotating arrangement showed a better performance in the uniformity of concentration. The pressure loss without a static mixer is 834 Pa, and the pressure loss increases by 94 Pa and 73 Pa for rotating and X-arranged static mixers, respectively. Meanwhile, a static mixer will increase energy loss. Therefore, power plants can choose the layout of their static mixers according to the actual situation to achieve the optimal performance.
1. Introduction
Nitrogen oxides damage the atmosphere and are responsible for acid rains and other environmental concerns. China relies heavily on coal for electricity generation. Coal combustion produces significant NO emissions every year in China due to the nature of coal burning and the large quantity of coal consumed [1]. Even through there are emerging new denitrition technologies such as the electron beam process [2], low-temperature absorption [3] and oxidative scrubbing [4], selective catalytic reduction (SCR) is still the main technology for processing the fuel gas of thermal power plants, which uses NH as a reductant to convert NO into environmentally friendly substances, such as N and HO, under proper temperature and with catalysts. SCR denitration systems have advantages such as high removal rates, technological maturity, and high economic efficiency [5,6,7]. However, there are still many improvements that could be achieved in current SCR systems to improve their denitration effects [8].
However, due to the negative effect caused by the structure of the flue, deflectors, and the combustion performance of boilers, uneven concentrations and uneven flows can occur inside the SCR system, which results in drops in the efficiency of NO reduction, increases in the ammonia fugitive rate, heavy local wear on catalysts, and blockages in the operation of the air preheater. Severe deterioration in the SCR system affects the operation of other units.
Research shows that arrangement of deflectors and flow equalizers greatly influences the performance of the denitrition system [9,10]. It was found that the velocity uniformity can be effectively improved by optimizing the structure of the guide devices [11]. Sohn [12] indicated that the mixing of injected NH and the uniformity of the velocity account for most of the denitration effect. The proper installation of mixers gave the best results. Muncy [13] enhanced the ammonia and nitrogen mixing effect by adding extra mixers when investigating the interlayer mixing to improve the distribution. Tan et al. [14] conducted numerical experiments to investigate the effects of static mixers in an SCR device with a diesel engine. He found that static mixers split spray droplets to smaller particles, which enhanced conversion efficiency. In order to obtain a suitable arrangement of vaporizers and mixers in high-pressure SCR systems, Zhu et al. [15] found mixers to be superior to other guide structures. Park et al. [16] compared the mixing effect of a line-and-swirl-type mixer and its geometric parameters. The results showed that mixers improved the performance by 20% but with a pressure drop trade-off. Sung et al. [17] studied the synergistic effect of utilizing static mixers and a mixing chamber on denitration performance. Mixers in the flue resulted in recirculation, which improved the turbulence. Combined with a mixing chamber, this arrangement showed the highest conversion rate. Researchers have also tried to enhance the performance of SCR system in power plants. Ye et al. [18] compared two styles of mixer arrangement and a simulation revealed that the SCR system performance of a 600 MW power plant was better with an inline arrangement than a staggered arrangement. Yu et al. [19] added guide plates to the SCR system of a 2 × 300 MW power plant, and the homogeneity of the velocity and concentration were improved. Tian [20] proposed four mixers for enhancing the performance of an SCR system. A large eddy simulation was also performed on a coal-fired power plant to reveal the influence of mixers and grilles on the flow and concentration field where a static mixer greatly impacted the velocity’s uniformity while mixing NH and NO. Meanwhile, rectifying grilles improved the homogeneity of the flow field [21]. Therefore, a proper design of mixers improves the performance of the SCR system.
Obtaining the flow field and concentration field inside an SCR system is a rather complicated problem. Computational fluid dynamics is the most viable, and sometimes the only way to obtain an SCR’s flow characteristics due to the irregular geometry of the flue and other mixers. Researchers have used computational fluid dynamics (CFD) to help solve various problems related to SCR systems. Chen et al. [22] established a numerical model to provide information when optimizing the catalyst packing structure. Their structure-resolved CFD simulation model demonstrated the influence of the catalyst structure on the behavior of the SCR system. Burstrom et al. [23] proposed a CFD model with a commercial code for spray injection that simulated the real grate flow field of an SNCR system. Promising results were found for an SNCR with urea rather than ammonia. You et al. [24] proposed a novel three-dimensional CFD heat-transfer model for honeycomb regenerators coated with catalysts. The model gave reasonable predictions of the unsteady SCR performance. Ye et al. [25] combined a chemical reaction model and a turbulence numerical model to study factors relating to SCR performance. Then, a response surface was constructed to optimize the catalyst inlet velocity, reaction temperature, and NH/NO molar ratio. CFD simulation was also used to predict the breakage failure in a coal-fired power plant. The simulation results were consistent with real industrial applications [26]. CFD is a mature and powerful tool for profiling the characteristics of SCR systems.
The performance of an SCR system mainly relies on the uniformity of its flow field and concentration field. Therefore, optimizations focuses on improving these two factors. Numerical results supported by cold-state tests showed that adding deflectors and optimizing static mixers effectively improved the uniformity at a given system configuration [27]. Liu et al. [28] considered both a porous medium model and a component transport equation to simulate the SCR system of a 1000 MW coal-fired power plant. The corner vane cascades and rectifier grills reduced 15% of the non-uniformity in the flow and vortex mixers and ensured the blending effects of ammonia and flue gas. Gao et al. [29] analyzed the influence of the structural parameters, including the locations and number of guide plates and the shape of mixers. A proper configuration was found to greatly boost the NO removal rate and reduce the NH slip. Zhang et al. [30] studied a low-temperature denitration device. With the help of numerical tools, a new static mixer was designed to enhance the performance. The optimized mixer effectively reduced the risk of crystallization while ensuring a higher distribution of the reducing agent. Liu et al. [31] optimized the control strategy of the valves for different ammonia spray nozzles, which was validated by trial in a 660 MW plant for a year. The ammonia consumption rate decreased, and the uniformity of the output NO greatly improved. The mixers are critical factors affecting the operation performance of SCR systems, and further optimization could be achieved to enhance the performance and reduce the waste of ammonia.
This paper takes the SCR denitration system of a 660 MW unit as the subject. A CFD simulation of the system is conducted. The simulation region starts from the ammonia spray grilles, and the full characteristics of the SCR system are studied. To improve the NO removal rate, static mixers are installed, and spiral-type and X-type static mixers are compared. This paper aims to provide a theoretical reference for the selection of static mixers.
2. Methods
2.1. Calculation Domain
A boiler of 660 MW units was arranged with separation screens, rear screens, and screen reheaters. The front wall and the front of the side walls were all arranged with wall-type radiant reheaters. The horizontal flue consisted of a water wall extension and a rear flue shaft extension. The rear flue shaft was equipped with low-temperature superheaters and an economizer. The design coal was Zhungeer coal, and the checked coal was Dongsheng coal from Nalinmiao, Inner Mongolia. Each boiler was installed with two SCR reactors, and the denitration catalyst used plate-type vanadium–titanium–tungsten catalysts from the German YaJie company with a “2 + 1” setting. The originally designed NOx levels of inflow and outflow were below 400 mg/Nm3 and 100 mg/Nm3, respectively. The calculation domain of the SCR system began at the economizer outlet and ended at the inlet of the air preheater, the model of which is based on the real flue size, ignoring parts of minor influence on the flow, such as supporting structures and other parts. Five sets of deflectors, ammonia spray grille, rectifier grille, and 3 + 1 layer catalysts were installed in the flue. Detailed parameters are listed in Table 1.

Table 1.
Main structure parameters of the SCR denitration system.
The calculation domain model is displayed in Figure 1 according to the structure characteristics of the SCR denitration system.
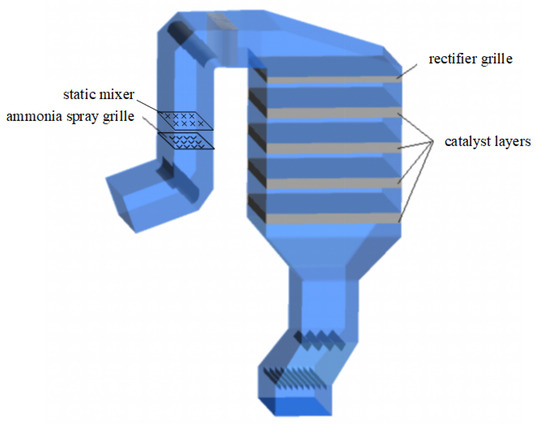
Figure 1.
Calculation domain model diagram of original SCR denitration system.
The mesh diagram of the calculation domain is shown in Figure 2. Most flue domains are meshed with structured mesh, and unstructured mesh was used to reflect the complex flow field in the static mixer region. The rectifiers and catalyst layers are denoted in red to indicate porous media region.
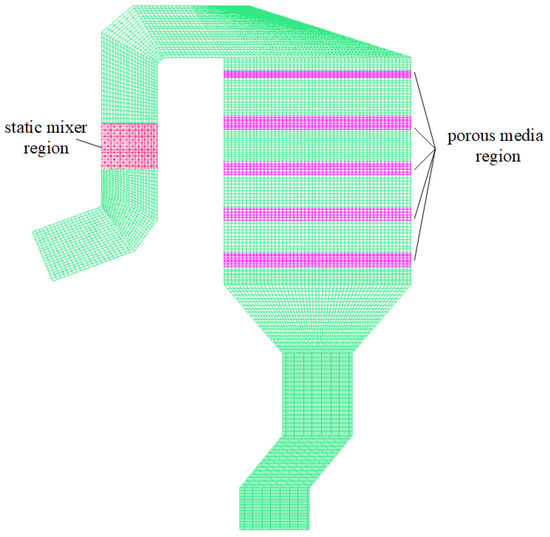
Figure 2.
Cross-sectional view of mesh diagram of SCR denitration system.
No static mixers were set close to the ammonia spray grille in the original design. The center height of the static mixer designed in this paper was located 1550 mm above the ammonia spray grille. As shown in Figure 3, the two groups of static mixers consisted of 12 steel plates each, arranged in 6 × 2 sets, which are 1800 × 1800 mm in size. The angles between the plates and the horizontal planes in the two groups were all 45°. The 2 steel plates in each row of static mixer 1 crossed each other; the angles of the plates were obtained by rotating the steel plates from the initial position in the horizontal direction, as shown in Figure 3a. Two steel plates in each row of static mixer 2 were parallel, in an X-type arrangement, as shown in Figure 3b.
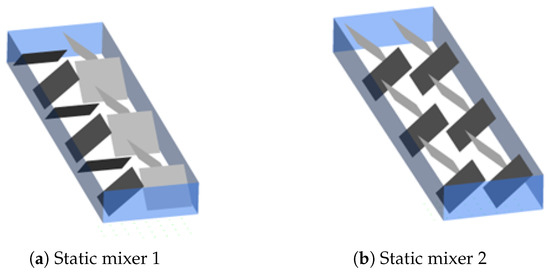
Figure 3.
Arrangement of static mixers: (a): The arrangement of static mixer 1. (b): The arrangement of static mixer 2.
Using a plate catalyst, the rectifiers and catalyst layer regions were defined as porous media, and the resistance characteristics of the rectifiers and catalyst layer were defined by the anisotropic method. The porosity of the catalyst layer was set to 0.81 and the reference pressure drop of each catalyst layer was fixed as 180Pa, where the values were determined from experimental data. Due to the presence of deflectors and grilles in the SCR system, ICEM software was used to mesh the grid using a sub-regional meshing method. Structured meshing was adopted in regular flues, such as vertical flues, and unstructured meshing was used in irregular domains, such as the deflectors near the inlet of the SCR system and flue turnings. To match the nodes on the interfaces, meshes around the ammonia spray grille and other regions were locally refined.
2.2. Control Equations
Fuel gas was treated as an incompressible fluid during the simulation, using the standard k-e equation. The transport equation was selected to describe the mixing behaviors of each component. The governing equations include the conservation of mass equation, conservation of momentum equation, and conservation of energy equation.
Conservation of mass equation of steady flow is shown in Equation (1).
where u is the velocity component, x is the position, and subscript i is the direction.
Conservation of momentum equations of steady flow are shown as Equation (2):
where is density, p is the pressure, is the viscosity, S is the source term, subscript j is the other directions, and subscript t is the turbulence term.
The k- model is used to calculate the turbulence viscosity of the fluid in Equation (3) and Equation (4):
where is the deformation rate, are constants determined by data fitting, and is the turbulence viscosity which is calculated in Equation (5).
Porous media were used to describe the catalyst layer, and a momentum source term was selected to represent the influence on flow. For anisotropic porous media, the source term is calculated with Equation (6):
where D is the mass diffusion coefficient and C is the inertia drag coefficient.
2.3. Evaluation Criteria
The performance of an SCR denitration system is dependent on the uniformity of its flow and concentration fields. Flow and concentration fields are represented by the velocity and molar ratio of ammonia and nitrogen. In the simulation results, the relative standard deviations () of parameters on the cross-sectional plane before the catalyst layer are evaluated, where a smaller means better uniformity. The relative standard deviation is the ratio of standard deviation to the average of the flow field at the cross-section, which is expressed as:
where is the standard deviation and is the average.
According to “Flow field simulation technical specification for SCR flue gas denitration system of coal-fired power plants” (DLT 1418-2015), a qualified SCR denitration system should meet the criteria of 15% maximal velocity relative standard deviation and 5% maximal ammonia nitrogen molar ratio relative standard deviation at the cross-sectional plane before the first layer of catalysts.
2.4. Boundary Condition and Calculation Method
The calculation conditions are that a boiler works at a boiler maximum continuous rating (BMCR) and the SCR system processes 100% of the flue gas, under which the inflow velocity of the flue gas is 10.39 m/s and the flue gas is composed of multiple substances, as shown in Table 2. All ammonia spray grilles evenly sprayed ammonia into the flue, for which the nozzle outlet velocity was 13.58 m/s and NH accounts for 5% of the ammonia–air mixture. The outlet of calculation domain was set to free-flow, and flue walls were set as no-slip adiabatic walls. The mass diffusion coefficient was and inertia drag coefficient was set to 7.039.
Table 2.
Composition of inlet flue gas.
ANSYS Fluent was used to solve the numerical simulation of the SCR system with double-precision format. The SIMPLE method couples velocity and pressure. The second-order up-wind method was employed to solve pressure and momentum for better precision, where the second-order precision is set to solve both the transportation of each component and chemical reactions which occurs at the catalyst layers.
3. Results and Discussion
3.1. Calculation Results of Original Model
A flow stream chart of an SCR denitration system with no static mixers and corresponding analyzed plane locations is shown in Figure 4, in which the flue gas is evenly distributed in the flue and little vortexing exists. Due to the changes in the cross-sectional areas, the flow velocity reduces after entering the SCR reactor and increases upon exit but remains smooth throughout the whole passage. Because of the inertia of flue gas and the fact that the top flue is turned on, the flue gas flows towards the outer wall, causing a small turning angle in the inner flow, which accounts for the lower velocity value and the greater velocity gradient closer to the flue before the first layer of catalysts. Moreover, for any other region, the flow velocity falls into the range of 27.5∼3 m/s. Additionally, the rectifier grilles effectively rectify the flow of the flue gas, improving the uniformity. The calculated relative standard deviation is 10.84% < 15%, which satisfies the criteria for the flow field.
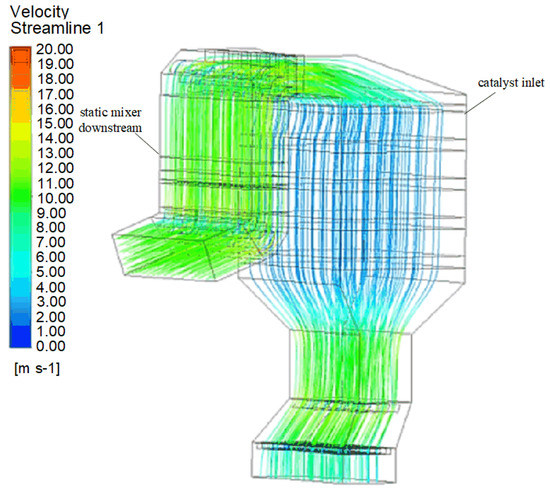
Figure 4.
Streamline diagram of original model.
The flow downstream of the ammonia spray grilles remains stable, and the flow velocity of the flue gas remains uniform at the inlet of the SCR system, as shown in Figure 5. However, without additional mixers to enhance mixing, by only relying on the inner deflectors and the inertia of flue gas, the mixing of NO and NH in the flue gas is relatively poor.
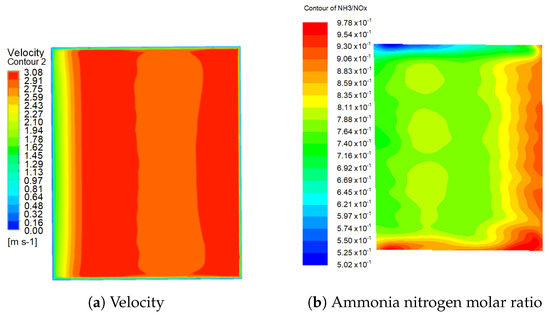
Figure 5.
Flow and concentration characteristics of original design. (a): Velocity distribution diagram of section in front of the catalyst layer. (b): Distribution diagram of ammonia–nitrogen molar ratio of section in front of the catalyst layer.
The ammonia–nitrogen molar ratio distribution at the cross-section before the first layer of catalysts is shown in Figure 5b. Affected by the flow velocity, the overall distribution is in the form of a striped pattern. The ammonia concentrates in the outer part because of the greater inertia of the injected ammonia mixture and the influence from the flow distribution. A less clear striped distribution is caused by the ammonia spray grilles being installed upstream in the flue [12]. The flow velocity is higher in the outer and lower areas of the inner part due to the inertia of the flue gas, as shown in Figure 5a. At the ends of the other direction, there are regions of extreme and minimal values. The overall extreme deviation is 0.476, and the relative standard deviation is calculated to be 7.33%, which exceeds the limited value. In the operation of the SCR denitration system, an uneven molar ratio of ammonia to nitrogen causes an uneven denitration reaction in the catalyst layer, which likely results in excess NO or increasing the local fugitive ammonia at the outlet of the SCR system. Furthermore, excess NH that does not participate in the reduction reaction could react with SO later to generate NHHSO under certain conditions. The generated NHHSO is then absorbed by the air preheater after leaving the SCR system, leading to clogging and even corrosion in the piping of the air preheater, affecting the normal operation of the unit.
3.2. Calculation Results with Static Mixers
To enhance the mixing effect of nitrogen oxides and ammonia, a static mixer was installed downstream of the ammonia spray grille, and simulation calculations were performed.
3.2.1. Calculation Results with Spiral Mixers
After installing the spiral static mixer, the flow pattern downstream of the ammonia spray grille is changed, the up-flow of the flue gas is restricted, and vortexes generate in the region. The vortex pattern is shown in Figure 6 and Figure 7a. As shown in the velocity distribution diagram of the downstream section of the static mixer, three vortexes of similar distribution are formed in the flow region, which corresponds to three sets of steel plates. Influenced by the spiral static mixer, the up-flow concentrates at the center with the change in the flow region; at the same time, flow streams are entrained towards the center as well, resulting in vortexes. In each vortex’s center, high-velocity regions are observed, and high-velocity and low-velocity zones cross each other. Vortexes develop upwards to the elbow of the top flue, gradually weaken, return to a smooth flow, then enter the SCR reactor. The velocity distribution of the section in the front of the catalyst layer is shown in Figure 7b, for which the relative standard deviation of the velocity is 10.58%. The velocity’s uniformity in the outer flue is greatly improved, but a high-velocity region still occurs in the inner section. The uniformity is slightly improved compared with the original design. This indicates that high-velocity regions formed by static mixers cause only small negative effects on the uniformity in the downstream and even have slight beneficial effects. This is mainly due to the buffering effect of the flue gas disturbance in the straight section after the static mixer, allowing the disturbance in the room to develop and weaken, realizing dual optimization effects in both the concentration field and the flow field.
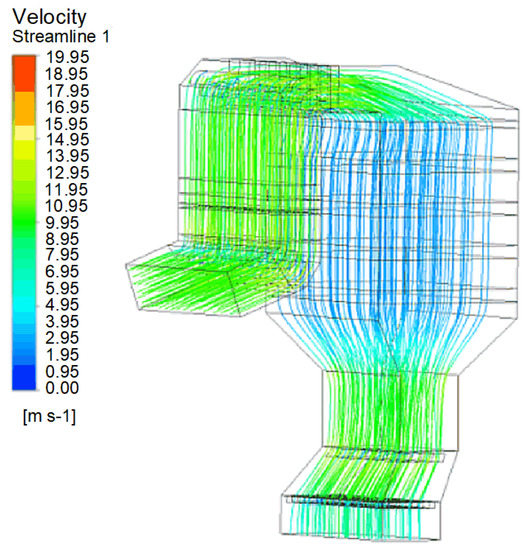
Figure 6.
System streamline diagram with static mixer 1.
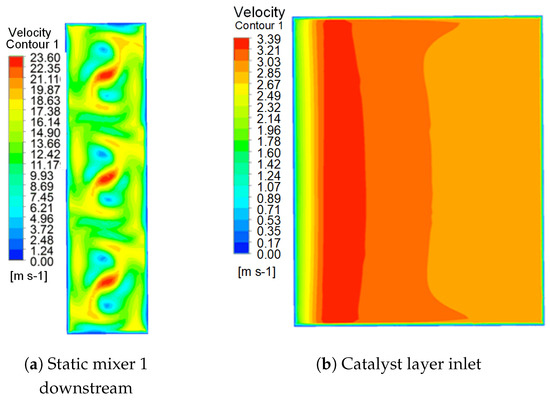
Figure 7.
Velocity field with static mixer 1. (a): Velocity distribution diagram of downstream section of static mixer. (b): Velocity distribution diagram of section in front of the catalyst layer.
Vortexes formed when the entrainments intensify the disturbance of the flue gas, facilitating the substance exchange between high-velocity and low-velocity regions, which further improves the mixing effects of NH and NO in the flue gas. The distribution of the ammonia concentration in the downstream of the static mixer is shown in Figure 8a, which is consistent with the flow field. Swirl-shaped patterns are observed, and the uniformity of the concentration is improved. The distribution pattern is similar to the flow field. This swirl pattern in the concentration field is generally consistent with the results in Ref. [29], although they installed different static mixers. The distribution of the ammonia–nitrogen molar ratio of the section plane in front of the catalyst layer is shown in Figure 8b. Compared with the original design, the large-scale striped pattern disappeared. Small ranges of deviation in the left and right wall are found. Such a phenomenon is caused by the rotation direction of the flow field. Generally, the variance in the molar ratio of ammonia to nitrogen remains small in most regions, and the uniformity of the concentration field is significantly better than the original design. Extreme value differences decreased to 0.211, and the overall relative standard deviation is 3.32%, which is 54.7% better than the original model. The uniformity of the concentration field satisfies the demand for the system.
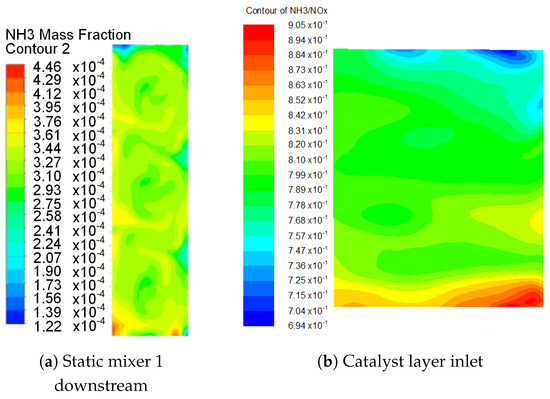
Figure 8.
Concentration field with static mixer 1. (a): Distribution diagram of ammonia concentration in the downstream section of static mixer. (b): Distribution diagram of ammonia nitrogen mole ratio of section in front of the catalyst layer.
3.2.2. Calculation Results with X-Type Static Mixer
As can be seen in Figure 9 and Figure 10, the X-type static mixer 2 also changes the flow pattern of the inflow. However, its flow characteristics differ from the vortexes formed by static mixer 1. Downstream of the static mixer, the high-velocity region is triangular and accompanied by linear regions, as shown in Figure 10a. The disturbed flow enters the SCR reactor after passing the elbow of the flue on the top, and the relative standard deviation of the velocity before the first layer of catalysts is 9.69%. The distribution of the velocity is similar to static mixer 1, but the maximum value is smaller. The uniformity is better than the spiral static mixers, as shown in Figure 10b. For these reasons, the maximal absolute velocity caused by X-type static mixers is relatively small. Buffered by the top region, the uniformity of the downstream flow is improved.
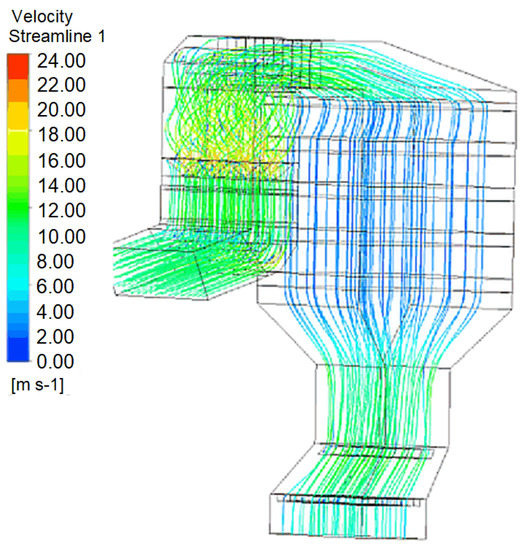
Figure 9.
System streamline diagram with static mixer 2.
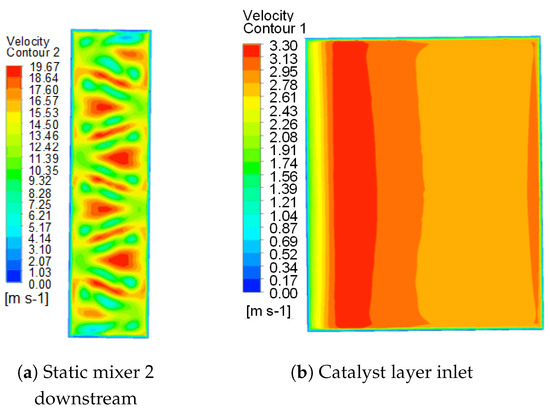
Figure 10.
Velocity field with static mixer 2. (a): Velocity distribution diagram of downstream of static mixer. (b): Velocity distribution diagram of section in front of the catalyst layer.
Disturbances generated by the X-type static mixer have a weaker entrainment effect on the up-flow in terms of the flow pattern. Moreover, because of the lower absolute velocity in the high-velocity region, the turbulence is weaker, making the mixing effects slightly inferior to the spiral type, as shown in Figure 11. However, compared to the original design, good improvements are also shown. The distribution of the ammonia concentration downstream of the static mixer is shown in Figure 11a. Three vortexes are also generated to enhance the mixing of ammonia. The concentration distribution of the section in front of the catalyst layer is shown in Figure 11b, in which the high- and low-concentration areas are relatively larger than static mixer 1, but the mixing effect in the center section is still acceptable. The relative standard deviation is 3.9%, which satisfies the criteria for the flow field.
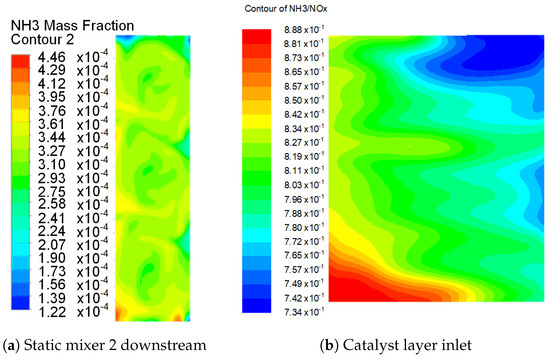
Figure 11.
Concentration filed with static mixer 2. (a): Distribution diagram of ammonia concentration in the downstream section of static mixer. (b): Distribution diagram of ammonia nitrogen mole ratio of section in front of the catalyst layer.
3.2.3. Pressure Drop Comparison
The flow of the flue gas is limited after installing static mixers, and non-parallel flow causes energy loss while enhancing the mixing of substances. The pressure loss in this SCR system is bound to increase. The pressure loss in the calculation region is 834 Pa without static mixers, whereas spiral static mixers add 94 Pa of pressure loss to the original design and 73 Pa of extra pressure loss is added by the X-type static mixers. The pressure loss in both designs is smaller than the design value, 1000 Pa, which thus qualifies.
3.3. Off-Design Performance
The performance comparison of denitration systems under 100% BMCR, 75% BMCR, and 50% BMCR is tabulated in Table 3, where BMCR is the boiler’s maximum continuous rating. Comparing the existing study in [18] with the original design, both kinds of mixers improved the uniformity to ensure the parameters in concentration field and flow field within the required range. However, the performance of each differed: spiral mixers have better performance over X-type mixers, but the improvement is not predominant. In addition, the off-design uniformity decreased only slightly in both types of static mixers.
Table 3.
Performance comparison table of denitration systems under various working conditions.
4. Conclusions
The flow field and concentration distribution characteristics of an SCR denitration system without static mixers, spiral static mixers, and X-type static mixers were compared and analyzed using the CFD numerical simulation method. The distributions of velocity and concentration are the key indicators for performance. The pressure drop and off-design performances are also discussed. The following conclusions are made:
- SCR systems with no static mixer, a spiral static mixer, or an X-type static mixer before the catalyst layer section showed relative standard deviations of velocity of 10.84%, 10.58%, and 9.69%, respectively, which are in line with industry norms. These results indicate that the addition of mixers is conducive to the full mixing of components, and X-type mixers have the best effect.
- Static mixers can effectively improve the operation performance of an SCR denitration system, and the improvement in concentration field is especially more obvious; they also have good adaptability to the low-load operation of the unit.
- Spiral static mixers and X-type static mixers will produce vortexes and disturbance in the domain, respectively, which can enhance the exchange of substances in the domain and thus improve the mixing effect of NH3 and NOx in flue gas. The distribution characteristics of the concentration field and velocity field in the ammonia injection area after the addition of static mixers have certain similarities.
- Static mixers have different effects on the optimization of the flow field, and the increased energy consumption varies. Compared to the pressure loss of 834 Pa without a mixer, the pressure losses of spiral and X-type static mixers increase by 94 Pa and 73 Pa, respectively. In practice, power plants can choose different arrangements of static mixers according to their needs.
Author Contributions
Conceptualization, Z.P. and Y.C.; methodology, Z.P.; software, Z.P.; validation, R.C.; formal analysis, R.C.; writing—original draft preparation, R.C.; writing—review and editing, Y.C. All authors have read and agreed to the published version of the manuscript.
Funding
This research received no external funding.
Data Availability Statement
The data presented in this study are available on request from the corresponding author.
Conflicts of Interest
The authors declare no conflict of interest.
References
- Han, L.; Cai, S.; Gao, M.; Hasegawa, J.Y.; Wang, P.; Zhang, J.; Shi, L.; Zhang, D. Selective Catalytic Reduction of NOx with NH3 by Using Novel Catalysts: State of the Art and Future Prospects. Chem. Rev. 2019, 119, 10916–10976. [Google Scholar] [CrossRef] [PubMed]
- Chmielewski, A.G.; Sun, Y.; Zimek, Z.; Bułka, S.; Licki, J. Mechanism of NOx Removal by Electron Beam Process in the Presence of Scavengers. Radiat. Phys. Chem. 2002, 65, 397–403. [Google Scholar] [CrossRef]
- Wang, S.; Xu, S.; Gao, S.; Xiao, P.; Jiang, M.; Zhao, H.; Huang, B.; Liu, L.; Niu, H.; Wang, J.; et al. Simultaneous Removal of SO2 and NOx from Flue Gas by Low-Temperature Adsorption over Activated Carbon. Sci. Rep. 2021, 11, 11003. [Google Scholar] [CrossRef] [PubMed]
- Flagiello, D.; Erto, A.; Lancia, A.; Di Natale, F. Advanced Flue-Gas Cleaning by Wet Oxidative Scrubbing (WOS) Using NaClO2 Aqueous Solutions. Chem. Eng. J. 2022, 447, 137585. [Google Scholar] [CrossRef]
- Yu-zhen, Y.; Wei-liang, L.; Shao-long, W. Numerical Simulation and Optimization of SCR DeNOx System Flow Channel Flow-Equalizing Equipment. Proc. CSEE 2018, 38, 7304–7313+7457. [Google Scholar]
- Xu, M.; Wu, Y.; Zhang, P.; Liu, Z.; Hu, Z.; Lu, Q. Green and Moderate Activation of Coal Fly Ash and Its Application in Selective Catalytic Reduction of NO with NH3. Environ. Sci. Technol. 2022, 56, 2582–2592. [Google Scholar] [CrossRef]
- Cao, J.; Rohani, S.; Liu, W.; Liu, H.; Lu, Z.; Wu, H.; Jiang, L.; Kong, M.; Liu, Q.; Yao, X. Influence of Phosphorus on the NH3-SCR Performance of CeO2-TiO2 Catalyst for NOx Removal from Co-Incineration Flue Gas of Domestic Waste and Municipal Sludge. J. Colloid Interface Sci. 2022, 610, 463–473. [Google Scholar] [CrossRef]
- Li, X. Optimization and Reconstruction Technology of SCR Flue Gas Denitrification Ultra Low Emission in Coal Fired Power Plant. IOP Conf. Ser. Mater. Sci. Eng. 2017, 231, 012111. [Google Scholar] [CrossRef]
- Rogers, K.; Albrecht, M.; Varner, M. Numerical Modeling for Design Optimization of SCR Applications; ICAC NOx Forum; ICAC: Washington, DC, USA, 2000; pp. 1–6. [Google Scholar]
- Pudasainee, D.; Lee, S.J.; Lee, S.H.; Kim, J.H.; Jang, H.N.; Cho, S.J.; Seo, Y.C. Effect of Selective Catalytic Reactor on Oxidation and Enhanced Removal of Mercury in Coal-Fired Power Plants. Fuel 2010, 89, 804–809. [Google Scholar] [CrossRef]
- Hu, B.; Chen, C.; Jiang, S.; Liu, X.; Dai, Q. Investigating the Optimization Design of Internal Flow Fields Using a Selective Catalytic Reduction Device and Computational Fluid Dynamics. Energies 2022, 15, 1451. [Google Scholar] [CrossRef]
- Sohn, J.; Hwang, I.S.; Hwang, J. Improvement of Ammonia Mixing in an Industrial Scale Selective Catalytic Reduction De-NOx System of a Coal-Fired Power Plant: A Numerical Analysis. Process Saf. Environ. Prot. 2021, 147, 334–345. [Google Scholar] [CrossRef]
- Muncy, J.; Shore, D.; Martz, T. Interlayer Mixing for Improved SCR Performance. In Proceedings of the Environmental Controls Conference, Pittsburgh, PA, USA, 1 July 2006. [Google Scholar]
- Tan, L.; Feng, P.; Yang, S.; Guo, Y.; Liu, S.; Li, Z. CFD Studies on Effects of SCR Mixers on the Performance of Urea Conversion and Mixing of the Reducing Agent. Chem. Eng. Process.—Process Intensif. 2018, 123, 82–88. [Google Scholar] [CrossRef]
- Zhu, Y.; Li, T.; Xia, C.; Feng, Y.; Zhou, S. Simulation Analysis on Vaporizer/Mixer Performance of the High-Pressure SCR System in a Marine Diesel. Chem. Eng. Process.—Process Intensif. 2020, 148, 107819. [Google Scholar] [CrossRef]
- Park, T.; Sung, Y.; Kim, T.; Lee, I.; Choi, G.; Kim, D. Effect of Static Mixer Geometry on Flow Mixing and Pressure Drop in Marine SCR Applications. Int. J. Nav. Archit. Ocean. Eng. 2014, 6, 27–38. [Google Scholar] [CrossRef]
- Sung, Y.; Choi, M.; Park, T.; Choi, C.; Park, Y.; Choi, G. Synergistic Effect of Mixer and Mixing Chamber on Flow Mixing and NOx Reduction in a Marine Urea-SCR System. Chem. Eng. Process.—Process Intensif. 2020, 150, 107888. [Google Scholar] [CrossRef]
- Ye, D.; Wang, X.; Wang, R.; Gao, S.; Liu, H.; Wang, H. Optimizing Flow Field in an SCR System of a 600 MW Power Plant: Effects of Static Mixer Alignment Style. Waste Dispos. Sustain. Energy 2021, 3, 339–346. [Google Scholar] [CrossRef]
- Yu, R.; Cai, Z.; Li, Z.; Gao, Z. Experimental Study of a Cold Model of a Selective Catalytic Reduction (SCR)Denitrification System. J. Beijing Univ. Chem. Technol. 2011, 38, 26. [Google Scholar]
- Tian, X. Study on Mixing, Modelling and Control of an SCR System; STAX: Saitama, Japan, 2016. [Google Scholar]
- Zhou, Z.; Chang, J.; Wang, X. Large Eddy Simulation of Hydrodynamics and deNOx Process in a Coal-Fired Power Plant SCR System. J. Environ. Manag. 2022, 320, 115800. [Google Scholar] [CrossRef] [PubMed]
- Chen, H.; Shi, Y.; Li, Z.; Yu, J.; Duan, X. Structure-Resolved CFD Simulations to Guide Catalyst Packing of Selective NO Reduction. Chem. Eng. J. 2022, 446, 136888. [Google Scholar] [CrossRef]
- Burström, P.; Lundström, T.; Marjavaara, B.; Töyrä, S. CFD-Modelling of Selective Non-Catalytic Reduction of NOx in Grate-Kiln Plants. Prog. Comput. Fluid Dyn. Int. J. 2010, 10, 284–291. [Google Scholar] [CrossRef]
- You, Y.; Wu, Z.; Zeng, W.; Zhang, Z.; Wang, S.; Dai, F.; Yi, Z. CFD Modeling of Unsteady SCR deNOx Coupled with Regenerative Heat Transfer in Honeycomb Regenerators Partly Coated by Vanadium Catalysts. Chem. Eng. Res. Des. 2019, 150, 234–245. [Google Scholar] [CrossRef]
- Ye, M.; Qian, F.; Gao, Y.; Lu, J.; Han, Y.; Huang, N.; Xu, B.; Wu, H. CFD Analysis of Influencing Factors on SCR Denitration Efficiency of Sintering Flue Gas Based on Response Surface Methodology. Atmos. Pollut. Res. 2021, 12, 101107. [Google Scholar] [CrossRef]
- Xu, Y.; Zhang, Y.; Liu, F.; Shi, W.; Yuan, J. CFD Analysis on the Catalyst Layer Breakage Failure of an SCR-DeNOx System for a 350 MW Coal-Fired Power Plant. Comput. Chem. Eng. 2014, 69, 119–127. [Google Scholar] [CrossRef]
- Liu, X.; Sun, Y.; Xue, F.; Su, J.; Chen, F. Study on Flow Field Optimization for SCR System of Coal-Fired Power Plants. J. Physics Conf. Ser. 2019, 1300, 012027. [Google Scholar] [CrossRef]
- Liu, H.; Guo, T.; Yang, Y.; Lu, G. Optimization and Numerical Simulation of the Flow Characteristics in SCR System. Energy Procedia 2012, 17, 801–812. [Google Scholar] [CrossRef][Green Version]
- Gao, Y.; Liu, Q.; Bian, L. Numerical Simulation and Optimization of Flow Field in the SCR Denitrification System on a 600 MW Capacity Units. Energy Procedia 2012, 14, 370–375. [Google Scholar] [CrossRef]
- Zhang, C.; Sun, C.; Wu, M.; Lu, K. Optimisation Design of SCR Mixer for Improving Deposit Performance at Low Temperatures. Fuel 2019, 237, 465–474. [Google Scholar] [CrossRef]
- Liu, G.; Cui, Y.; Ji, J.; Shen, D.; Wang, Q.; Li, C.; Luo, K.H. A Technical Method to Improve NOx/NH3 Mixing Ratio in SCR System and Its Engineering Applications. J. Energy Inst. 2019, 92, 1757–1764. [Google Scholar] [CrossRef]
Publisher’s Note: MDPI stays neutral with regard to jurisdictional claims in published maps and institutional affiliations. |
© 2022 by the authors. Licensee MDPI, Basel, Switzerland. This article is an open access article distributed under the terms and conditions of the Creative Commons Attribution (CC BY) license (https://creativecommons.org/licenses/by/4.0/).