Abstract
Photovoltaic solar energy is booming due to the continuous improvement in photovoltaic panel efficiency along with a downward trend in production costs. In addition, the European Union is committed to easing the implementation of renewable energy in many companies in order to obtain funding to install their own panels. Nonetheless, the nature of solar energy is intermittent and uncontrollable. This leads us to an uncertain scenario which may cause instability in photovoltaic systems. This research addresses this problem by implementing intelligent models to predict the production of solar energy. Real data from a solar farm in Scotland was utilized in this study. Finally, the models were able to accurately predict the energy to be produced in the next hour using historical information as predictor variables.
1. Introduction
Renewable energies are attracting more and more interest in the energy industry, contrary to fossil fuels. This is because renewable energies do not produce greenhouse gas emissions and cause climate changes. They are inexhaustible sources and their waste is easy to treat. In addition to this, the recent advances in technology and the costs of production are positively affecting the implementation of such renewables. According to IRENA [1], the price of different renewable energies has dropped significantly. This has promoted the change to more sustainable resources such as wind and photovoltaic energies, which are foreseen to reach 40% of the global energy in 2040 [2].
Solar energy can be obtained by taking advantage of solar heat and photovoltaic (PV) technology. The latter directly transforms sunlight into electricity thanks to technology based on the photovoltaic effect [3]. This effect is a property of certain materials such as silicone that allow us to generate electricity when they are irradiated. It happens when photons are incident on PV materials, where they collide with electrons, creating an electric energy flow.
Nonetheless, its main downside is the volatility of the energy produced owing to changes in climate. This drawback is a strong barrier for numerous electricity companies. In large-scale PV energy farms, an erroneous forecasting system may lead to a significant loss of benefits. However, an accurate forthcoming estimate within a short-time period can result in optimal management of the energy so that it could be stored, sold or distributed [4].
Since the first PV cell was created in 1883 with 1% of efficiency [5], researchers have been focusing on developing better panels by testing different materials in order to improve such efficiency, and therefore, energy production. So far, the highest efficiency was achieved in 2020 up to 44.5% [6].
As mentioned before, energy production based on PV technologies is catching the attention of researchers. Nowadays, there are many physical models that provide information as to how environmental variables influence the energy generated by solar panels. However, the nature of the problem, heavily dependent on the weather, makes these models not as accurate as one may expect. Here is where the Machine Learning techniques come into play to reduce the impact of the aforementioned issue.
The base model used by many researchers is known as the persistence model [7,8,9], which assumes that the generated power within time-lapse is equal to the previously generated power in earlier intervals. In other words, the energy produced during one day at a certain time would be the same as the day before. The main advantage of this approach is that they assume some climate stability over some time. Statistical models do not need internal information to simulate the system. They are a data-driven approximation capable of extracting relationships from the past to predict the future [10].
Proper data extraction and processing have shown to positively influence how the results are obtained. Many authors have studied the correlation between the selection of inputs and the accuracy of the model. One can find the work of Almeida et al., [11] who concluded the best combination to predict the energy production of the following day in a PV plant was to employ the previous 30 days. Other authors achieved promising outcomes by applying classification methods as a function of climate conditions (sunny, windy, cloudy) and thus implementing different models [12,13,14,15].
In this study, a complete methodology to predict energy production in a PV farm is proposed. Data from a real scenario was employed, in particular, from the Scottish solar farm Cononsyth. The main goal was to implement forecasting models that allow us to estimate the forthcoming hour. To do so, an implementation and comparison of several machine learning methods were carried out, from the simplest linear techniques, passing through tree-based algorithms to the most complex neural networks.
2. Materials and Methods
2.1. Dataset
The dataset employed to validate the proposed methodology was collected from a solar farm located in Cononsyth, Scotland. This solar plant was built in October 2011 with 50 kWp of solar PV modules and a Feed-in Tariff of 31.5 p/kWh. It generates around 45 MWh a year with a gain of GBP 18,000/annum [16]. Although the Cononsyth Farm also handles energy generation by wind-based technologies, this study will be focused only on solar panels in order to test our models on historical information to predict electric production without any external information. Provided the proposal is feasibile, incorporating new data could enrich the forecasting process.
What motivates the selection of this data was the current scenario in the country. Due to the enduring electricity distribution crisis, electricity costs have been gradually rising. In addition to this, the current untaxed diesel costs make the goal of the price control law difficult to reduce the cost of these operational processes. As a consequence, the growth of solar energy in the UK along with the price difference between solar PV other more contaminant resources [17] create a key scenario for providing predictive models so as to support the generation of renewable energy.
The dataset originally contained seven CSV files regarding different photovoltaic panels from 2011 to 2017 on an hourly basis and, therefore, the information to be managed will be the panel production in Wh. In total, there are around 54,000 samples. Figure 1 illustrates the representation of the data. It can be seen from this figure that all the years follow a similar trend, although each piece has certain particularities that will feature each period.

Figure 1.
Representation of the whole dataset.
Since most of the models implemented cannot work with time variables, it was decided to split this into four explanatory variables, i.e., year, month, day and hour. Similarly, columns that gather information about past energy production were created. The number of lags selected can be observed in Figure 2. Different values from 1 to 50 were tested to check the error of one of the models, and the optimal number of previous values to take into account were 3. As a consequence, the dataset will have three more columns for .
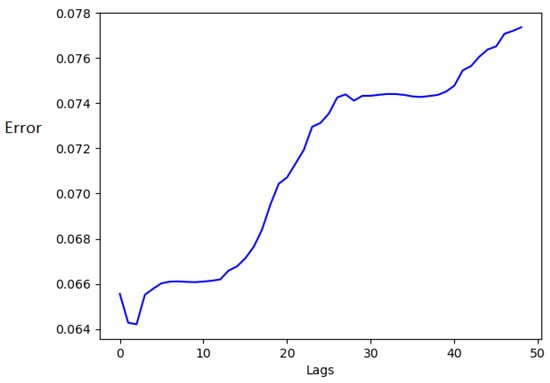
Figure 2.
Selection of the number of lags.
In short, the dataset consists of 54,000 samples with eight variables, and this is the information the models will have to adjust.
2.2. Data Analysis
The PV production indicates the power generated by the solar panels per hour. This variable varies within the range of kW before pre-processing of the data. The max power reached was in 7 May 2017 with 43 kW. The next highest productions can be seen in the next table (see Table 1).

Table 1.
Intervals with the highest PV production.
As an example, it can be said that the production of the highest seven days would be equal to the average household monthly expenditure on lighting in Spain.
As can be seen from Figure 3a, most of the PV production is gathered within Wh. This is mainly because most of the time it presents null production as a consequence of the sunlight absence. On the other hand, Figure 3b displays the data without taking into consideration the nocturnal period and it can be appreciated how most of the observations, 75%, registered less than 150 kWh. In addition to this, it can be inferred that data do not show a normal distribution. The following histogram (Figure 4) shows how the bulk of the production is close to 0.
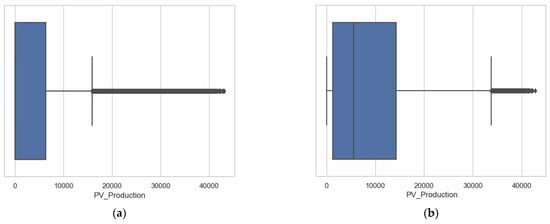
Figure 3.
Boxplot of the PV production (a) with null production and (b) removing those 0 Wh samples.
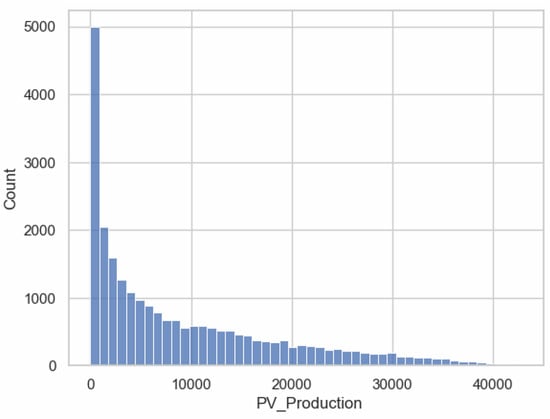
Figure 4.
Histogram of the PV production.
The annual production does not have much variation from one year to another since the climate is a clear seasonal component. In this way, energy production forecasting will be very similar to previous years (see Figure 5).
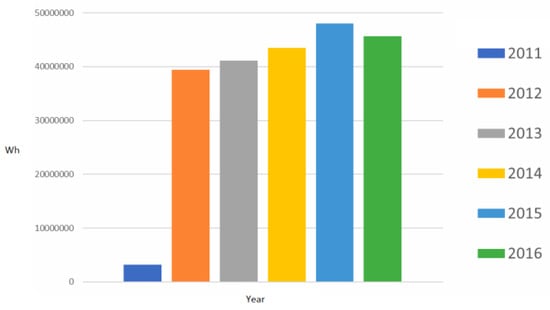
Figure 5.
Energy production over the years.
The monthly production is concentrated between May and August, as can be seen in Figure 6. It is worthy of mention that in the summer of 2012, the energy production suffered a notable decrease compared to the rest of the years.
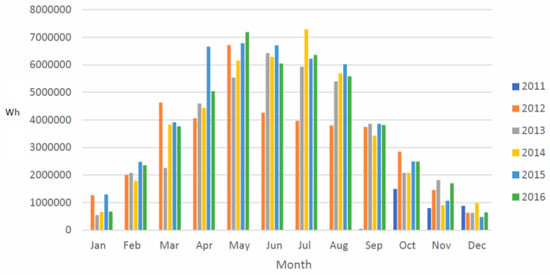
Figure 6.
Monthly representation of the PV production.
It was also analyzed whether there is any significant difference when disaggregating the energy production over the days of the months and no differences were found. Nonetheless, as expected, by doing the same but on an hourly basis, the hours with more energy corresponded to the ones with more solar activity, and therefore higher irradiation, which was observed between 10 a.m. and 2 p.m. (see Figure 7).
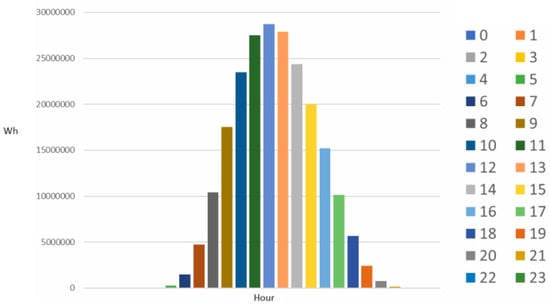
Figure 7.
Representation of the accumulative sum of energy production on a daily basis.
Finally, it is interesting to study the correlation between variables. The more information we have, the better to the chance to improve the prediction of our models. However, when managing a sheer amount of data, some information could turn out to be irrelevant or even noise. Thus, Figure 8 illustrates a strong correlation between the energy production at time and the preceding values, the closest one being the most correlated.
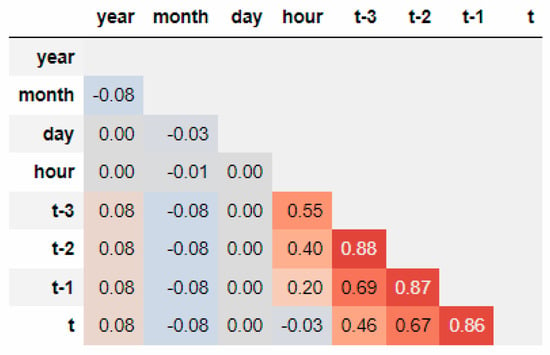
Figure 8.
Correlation matrix of the dataset with the previous values.
The latter fact can be confirmed if the relevance of each variable is examined. To do so, one of the tree-based models that will be detailed below may be very handy on this occasion (see Table 2). It can be observed how has the strongest importance, which is the variable that represents the energy produced in the previous hour. Interestingly, the time of day becomes more important, as the hour may lead us to know whether the forthcoming hour will have production or not, showing a clear seasonality, as was depicted in previous graphs.

Table 2.
Relevance of each variable.
2.3. Methodology
To address this problem, the use of several machine learning algorithms that have been employed in recent studies in this field [18,19,20] was proposed. This section is intended to describe these methods in detail and some properties needed to solve the problem. The following methods were implemented: Linear Regression (LR), k-Nearest Neighbour (kNN), Decision Tree (DT), eXtreme Gradient Boosting (XGB), Light Gradient Boosting (LGBM), Multi-Layer Perceptron (MLP), Elman Neural Network (ENN) and Long Short-Term Memory neural network (LSTM).
2.3.1. Linear Regression
LR [21] is a statistical method whose aim is to represent the relationship between an objective variable and the predictor variables by means of a linear equation. It can be defined as a tuple of independent variables as follows:
where is the value of the estimation for the observation , is the weight for each target variable and is the difference between the observed value and the prediction.
Thus, with LR, the endeavours were focused on approximating the best values utilizing the samples from the dataset. The most-used method to do so is known as least squares, which will be the one employed here, and it consists of minimizing the sum of the offsets of points between the sample and the curve.
2.3.2. k-Nearest Neighbours
kNN is a non-parametric method; in other words, it does not presume any distribution in the data. It estimates the value of a new sample through the closest points to it by computing that proximity using a distance or similarity metric [22]. Once obtained, the closest points (or neighbours) and the target variable are calculated using the mean of these two variables:
As one may imagine, the most relevant parameter in this method is , i.e., the number of observations that will influence the computation of the new element. After sorting these values according to their distance, the first values are chosen. Commonly, the popular distance in this algorithm is the Euclidean distance, although one may find some others such as the Minkowski distance, which is a generalisation of the Euclidean distance:
where is an integer that defines the order of the distance.
2.3.3. Decision Tree
The third method adopted is DT [23,24,25], which builds different regression models, giving it a tree structure. The model splits the original feature space into diverse subsets that become increasingly smaller. The expected goal is a tree with decision nodes. These nodes divide the space into two subspaces with eventual leaf nodes. The latter represents the last split of the data.
Originally, DT was oriented to classification problems, so in order to adapt them to a regression problem, the CART algorithm to generate binary trees is employed, i.e., each node splits into exactly two branches. When dealing with regression problems, DT utilises a greedy algorithm to select the optimal local solution.
The function costs can be mathematically defined as follows:
where is the attribute in question, is the limit of such attribute, is the number of samples and represents Mean Square Error. The subindexes and stand for left and right margins, respectively.
2.3.4. eXtreme Gradient Boosting
XGB is an open access library that provides an efficient and effective implementation of the gradient boosting algorithm that comes from a greedy function approximation of the gradient [26]. The idea behind this technique is to adjust multiple weak prediction models sequentially so that each model takes the results obtained by the previous one to eventually generate a stronger model.
This goal is achieved thanks to the Gradient Descent algorithm. Formally, if it starts with sample and moves forward to a positive distance, α, the new position, , will be:
One of the main issues with this technique is that it cannot be determined whether the algorithm found a local or global minimum. Thus, allows us to control the convergence of the method. In the training stage, these parameters are iteratively adjusted so as to minimize this error. To do so, the Mean Absolute Error or the Root Mean Square Error was employed, and which will be defined later.
2.3.5. Light Gradient Boosting
In terms of functionality, LGBM is similar to XGB. LGBM [27] was developed by Microsoft and is based on the Gradient Descent algorithm too. The main difference is the way the «weak» models are modified in the subsequent iterations. LGBM adapts the trees utilising a depth-first expansion; in other words, it changes the nodes in the same branch first, as opposed to XGB, which creates it transversally by establishing a depth limit.
2.3.6. Multi-Layer Perceptron
MLP [28,29,30] is a supervised algorithm that learns the function on the training set, where is the dimension of the input vector and is the output variable. Given feature vector and output , MLP is capable of learning a non-linear function to predict future values.
The structure of MLP is divided into three layers, the input layer with as many nodes (or neurons) as the input vector . Each neuron in the input layer transforms these values into a new weighted linear combination of values following the next equation:
where is the hidden neuron and and is the weight associated to the input . Finally, each neuron applies an activation function to this combination to eventually transfer the information of that neuron to the next layers.
2.3.7. Elman Neural Network
The second ANN evaluated is an improvement of MLP. MLP has certain limitations for its design that can be solved by making some changes in its architecture. ENN is known as a simple recurrent network, and it presents an improvement in the feedforward design thanks to the incorporation of feedback among hidden layers.
An ENN is a net with three layers (input, hidden and output) to which a «context» layer is added. These context (or memory) nodes are in charge of storing the previous weights of the neurons, giving it a certain memory in time [18,31].
The reminding process is produced through this context layer, which is fed by the hidden neurons. Mathematically, this process can be defined as follows:
where is the input vector, has the vector of the hidden layer, and are the matrices of weights, is the activation function and is bias.
2.3.8. Long Short-Term Memory
Recurrent Neural Networks have an architecture that allows us to connect neurons among diverse layers. This feature provides the net with new information from the preceding activations. This information is constantly renewed in each iteration. In this way, the importance of each iteration varies according to the number of steps. This may be a problem if the information lasts for many time steps.
To solve this problem, LSTM was introduced. Instead of storing the historical information from antiquity, LSTM uses neurons that allow the net to decide what to data save and what to forget [20].
An LSTM neuron consists of a cell, input gate, output gate and a forget gate. The node remembers values over time intervals. In summary, this model can be defined as follows:
where can be the input, output, cell or the output gate, and are the matrices of the weights and is the bias. To this, the update of the cell state should be added as follows:
Here, is the forget gate, and the input gate. Finally, the computation of the hidden neurons with the output gate :
2.3.9. Metrics
After introducing all the techniques implemented in this study, the metrics employed to evaluate and compare the predictions made must be presented. Although two of them are quite similar, in the literature, one may find discussions done by any of them interchangeably. In this study, three metrics were selected so as to confirm the behaviour and in the case of a tie or similarity in terms of performance, other metrics can be checked.
The first metric is the Mean Absolute Error (MAE) [32]:
The second metric is the Root Mean Square Error (RMSE) [32]:
Finally, the last metric is the Coefficient of determination R2 [33]:
where is the number of observations, is the actual value of the point, is the prediction of the model and stands for the residual.
2.3.10. Pre-processing
An important aspect of an adequate learning process is the pre-processing stage. Most machine learning models suffer from this when not performing properly, most specifically, those algorithms based on distances, e.g., kNN. Similarly, ANNs are sensitive to the input scale, particularly when using certain activation functions such as the sigmoid function.
Scaling allows us to rearrange a variable’s domain within a specific range, usually, . In this case, the MinMaxScaler was applied to the data, which is defined in the following formula.
Being and the minimum and maximum values respectively.
Another key piece in this stage is the proper representation of the data. The main problem with the time-related variables (hour, day, month) is that the values of such variables do not represent their seasonal nature. As an example, the distance between two observations whose months are 1 (January) and 12 (December) would be always 11, although this is not necessarily true as there is only 1 month between them. The solution found for this issue consists of increasing the dimensionality of each variable by means of trigonometric functions. In this way, one may work with cyclical variables that represent the information in a better way, as can be seen in Figure 9.
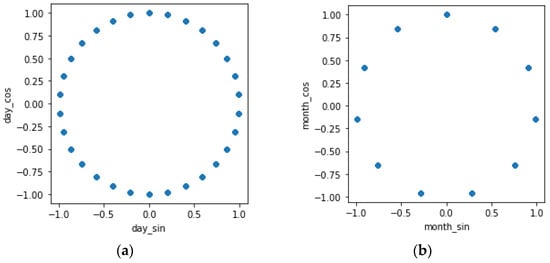
Figure 9.
Cyclical representation of variables (a) day and (b) month.
It is not very common to find many studies that apply such a pre-processing technique, but they are quite effective in the end. In doing so, the final dataset will have ten variables—six time variables, three past values of the photovoltaic production and the current value.
3. Results
The first results pursued in this study were to find the best hyperparameter combination of for each model. Since each model has its particular features, in order to compare their results, Table 3 was built. Here, P1 and P2 are two of the most tested parameters using the grid search.

Table 3.
Grid search results. Best results obtained and the combination of the paired parameters P1 and P2 for each model. Each hyperparameter stands for a particular feature of the model in question. All rows of the same model are sorted by MAE.
The following lines describe all the hyperparameters studied. LR was tested using different values for its parameter and . The main hyperparameter of kNN is , and the number of neighbours was set to . How the were influenced was also tested, and computed by , which stands for distance and uniform, respectively. In this table, DT shows the and , although the criterion and the max depth were also modified. The model developed by Microsoft, LGBM, was analysed under and . This experiment mainly looked for the and in the case of XGB. Finally, all the ANN-based models were examined by combining different within two layers, which are the columns shown in the table. Other hyperparameters were also inspected, such as the activation function, learning rate and alpha.
Presently, all the results obtained using a one-hour-ahead prediction are presented, i.e., the prediction of the total amount of photovoltaic energy generated for the next hour by means of the previous three hours as well as the time variables. Note that the latter, the lag selection, was made in the previous section, specifically in Figure 2 while the dataset was being prepared. As a reminder of those results, one has to take into consideration that this value was obtained by testing past values from 1 to 50 and the best error was obtained with the three past hours.
The period used to test the models was the year prior, i.e., 2017. Table 4 gathers the results obtained and sorted by MAE. On the whole, these metrics confirm the expected outcomes. Bear in mind that the data were previously scaled within the range [0, 1], so these metrics will be as well.

Table 4.
Summary of the results obtained, sorted by MAE with the best metric in bold.
It is interesting to see how ANN models provided evenly distributed predictions among them and the position they received, since they are also sorted in terms of complexity, i.e., LSTM first, which is the most complex model, then ENN and finally MLP. This fact confirms how the historical information latent in the data helps them to enhance their predictions. They were followed by a slightly worse prediction by LR, which is the most traditional approach implemented. In contrast, XGB was ranked in the first position followed by its counterpart LGBM. This gives us the hint that this problem benefits from boosting solutions.
Finally, some graphs will be depicted to show the adjustment of the models. Given the sheer number of observations in the test, an illustrative example of the predictions is shown. It can be observed how the models adjust properly to the test data, although in most cases, the peak demand during the hours of maximum solar irradiance is underestimated. All of them follow a similar trend in both stable and unsteady days, being the latter harder to predict.
Another remarkable fact observable in this figure is that the first day presents an uncommon behaviour compared to the rest of the days. This is because that day was cloudy and there was not much irradiance. Surprisingly and logically, all the models start overestimating the production. However, the information of the previous three hours manages to correct this overestimation, miscalculating only the first hours.
4. Conclusions and Future Work
This section exposes the conclusions reached in the course of this research work, along with a series of improvements and future work.
The prediction of power demand plays an essential role in photovoltaic production plants. The enhancement of such estimates is an issue that has recently led to increased importance in the search for more accurate and reliable predictions. In this research, several forecasting machine learning techniques most used in the literature were implemented with a short-term horizon prediction, specifically, on a one-hour basis. The most accurate model was the tree-based XGB which obtained the lowest RMSE and MAE. On the whole, all the implemented models provided good results while predicting the next hour thanks to the extra variables incorporated.
Nevertheless, the main issue of this proposal is the lack of meteorological information. Some information about the weather might improve the estimation of the predictors. An instance of this can be seen in Figure 10, if the model would have known that that day was cloudy, it may have varied the estimate in that period. Therefore, the incorporation of this kind of information is proposed so as to validate this hypothesis.
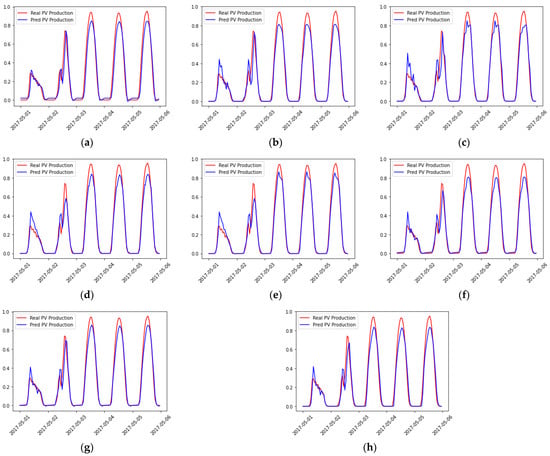
Figure 10.
Hourly prediction of the first five days of May 2017 for (a) LR, (b) kNN, (c) DT, (d) XGB, (e) LGBM, (f) MLP, (g) ENN and (h) LSTM.
As a second improvement, it was proposed to extend the forecasting horizon for at least 24 h. It may be attained by increasing the amount historical values the models have to adjust, i.e., increasing the number of lags as considered in this research. Moreover, it can be of great interest to incorporate external information such as weather variables or other more specific ones such as the sort of radiation the panels receive.
Author Contributions
All the authors have contributed equally to this work. All authors have read and agreed to the published version of the manuscript.
Funding
We acknowledge financial support from the Ministerio de Ciencia e Innovación (Spain) (Research Project PID2020-112495RB-C21) and the I + D + i FEDER 2020 project B-TIC-42-UGR20.
Data Availability Statement
Not applicable.
Conflicts of Interest
The authors declare no conflict of interest.
Abbreviations
| DT | Decision Tree |
| ENN | Elman Neural Network |
| kNN | k-Nearest Neighbour |
| LGBM | Light Gradient Boosting Machine |
| LR | Linear Regression |
| LSTM | Long Short-Term Memory |
| MAE | Mean Absolute Error |
| MLP | Multi-Layer Perceptron |
| PV | Photovoltaic |
| RMSE | Root Mean Square Error |
| XGB | eXtreme Gradient Boost |
References
- Dhabi, A. Irena. Renewable Energy Statistics. 2020. Available online: http://www.evwind.es/2020/06/05/renewable-energy-costs-plummet-according-toirena/75021 (accessed on 3 September 2021).
- Nassar, N.T.; Wilburn, D.R.; Goonan, T.G. Byproduct metal requirements for U.S. Wind and solar photovoltaic electricity generation up to the year 2040 under various clean power plan scenarios. Appl. Energy 2016, 183, 1209–1226. [Google Scholar] [CrossRef]
- Zhang, Y.J.; Ideue, T.; Onga, M.; Qin, F.; Suzuki, R.; Zak, A.; Tenne, R.; Smet, J.H.; Iwasa, Y. Enhanced intrinsic photovoltaic effect in tungsten disulfide nanotubes. Nature 2019, 570, 349–353. [Google Scholar] [CrossRef]
- Buwei, W.; Jianfeng, C.; Bo, W.; Shuanglei, F. A Solar Power Prediction Using Support Vector Machines Based on Multi-Source Data Fusion. In Proceedings of the 2018 International Conference on Power System Technology (POWERCON), Guangzhou, China, 6–8 November 2018; pp. 4573–4577. [Google Scholar]
- Fritts, C.E. On a new form of selenium photocell. Am. J. Sci. 1883, 26, 465–472. Available online: http://www.pveducation.org/node/310 (accessed on 3 September 2021). [CrossRef]
- Geisz, J.F.; France, R.M.; Schulte, K.L.; Steiner, M.A.; Norman, A.G.; Guthrey, H.L.; Young, M.R.; Song, T.; Moriarty, T. Six-junction iii–v solar cells with 47.1% conversion efficiency under 143 suns concentration. Nat. Energy 2020, 5, 326–335. [Google Scholar] [CrossRef]
- Fernandez-Jimenez, L.A.; Muñoz-Jimenez, A.; Falces, A.; Mendoza-Villena, M.; Garcia-Garrido, E.; Lara-Santillan, P.M.; Zorzano-Alba, E.; Zorzano-Santamaria, P.J. Short-term power forecasting system for photovoltaic plants. Renew. Energy 2012, 44, 311–317. [Google Scholar] [CrossRef]
- Monteiro, C.; Santos, T.; Fernandez-Jimenez, L.A.; Ramirez-Rosado, I.J.; Terreros-Olarte, M.S. Short-term power forecasting model for photovoltaic plants based on historical similarity. Energies 2013, 6, 2624–2643. [Google Scholar] [CrossRef]
- Lorenz, E.; Heinemann, D.; Kurz, C. Local and regional photovoltaic power prediction for large scale grid integration: Assessment of a new algorithm for snow detection. Prog. Photovolt. Res. Appl. 2012, 20, 760–769. [Google Scholar] [CrossRef]
- Bourdeau, M.; Zhai, X.Q.; Nefzaoui, E.; Guo, X.; Chatellier, P. Modeling and forecasting building energy consumption: A review of data-driven techniques. Sustain. Cities Soc. 2019, 48, 101533. [Google Scholar] [CrossRef]
- Almeida, M.P.; Perpiñán, O.; Narvarte, L. Pv power forecast using a nonparametric pv model. Sol. Energy 2015, 115, 354–368. [Google Scholar] [CrossRef]
- Mellit, A.; Massi Pavan, A.; Lughi, V. Short-term forecasting of power production in a large-scale photovoltaic plant. Sol. Energy 2014, 105, 401–413. [Google Scholar] [CrossRef]
- Shi, J.; Lee, W.J.; Liu, Y.; Yang, Y.; Wang, P. Forecasting power output of photovoltaic systems based on weather classification and support vector machines. IEEE Trans. Ind. Appl. 2012, 48, 1064–1069. [Google Scholar] [CrossRef]
- Chen, C.; Duan, S.; Cai, T.; Liu, B. Online 24-h solar power forecasting based on weather type classification using artificial neural network. Sol. Energy 2011, 85, 2856–2870. [Google Scholar] [CrossRef]
- Bouzerdoum, M.; Mellit, A.; Massi Pavan, A. A hybrid model (sarima–svm) for short-term power forecasting of a small-scale grid-connected photovoltaic plant. Sol. Energy 2013, 98, 226–235. [Google Scholar] [CrossRef]
- Muneer, T.; Gago, E.J.; Berrizbeitia, S.E. The Coming of Age of Solar and Wind Power; Springer Nature: Berlin/Heidelberg, Germany, 2022. [Google Scholar] [CrossRef]
- Muneer, T.; Dowell, R. Potential for renewable energy–assisted harvesting of potatoes in scotland. Int. J. Low-Carbon Technol. 2022, 17, 469–481. [Google Scholar] [CrossRef]
- Ruiz, L.G.B.; Rueda, R.; Cuéllar, M.P.; Pegalajar, M.C. Energy consumption forecasting based on elman neural networks with evolutive optimization. Expert Syst. Appl. 2018, 92, 380–389. [Google Scholar] [CrossRef]
- Ruiz, L.G.B.; Cuellar, M.P.; Delgado, M.; Pegalajar, M.C. An application of non-linear autoregressive neural networks to predict energy consumption in public buildings. Energies 2016, 9, 684. [Google Scholar] [CrossRef]
- Ruiz, L.G.B.; Capel, M.I.; Pegalajar, M.C. Parallel memetic algorithm for training recurrent neural networks for the energy efficiency problem. Appl. Soft Comput. 2019, 76, 356–368. [Google Scholar] [CrossRef]
- Saber, A.Y.; Alam, A.K.M.R. Short Term Load Forecasting Using Multiple Linear Regression for Big Data. In Proceedings of the 2017 IEEE Symposium Series on Computational Intelligence (SSCI), Honolulu, HI, USA, 27 November–1 December 2017; pp. 1–6. [Google Scholar]
- Himeur, Y.; Alsalemi, A.; Bensaali, F.; Amira, A. Smart power consumption abnormality detection in buildings using micromoments and improved k-nearest neighbors. Int. J. Intell. Syst. 2021, 36, 2865–2894. [Google Scholar] [CrossRef]
- Mikučionienė, R.; Martinaitis, V.; Keras, E. Evaluation of energy efficiency measures sustainability by decision tree method. Energy Build. 2014, 76, 64–71. [Google Scholar] [CrossRef]
- Galicia, A.; Talavera-Llames, R.; Troncoso, A.; Koprinska, I.; Martínez-Álvarez, F. Multi-step forecasting for big data time series based on ensemble learning. Knowl.-Based Syst. 2019, 163, 830–841. [Google Scholar] [CrossRef]
- Duque-Pintor, F.; Fernández-Gómez, M.; Troncoso, A.; Martínez-Álvarez, F. A new methodology based on imbalanced classification for predicting outliers in electricity demand time series. Energies 2016, 9, 752. [Google Scholar] [CrossRef]
- Yucong, W.; Bo, W. Research on ea-xgboost hybrid model for building energy prediction. J. Phys. Conf. Ser. 2020, 1518, 012082. [Google Scholar] [CrossRef]
- Chowdhury, S.R.; Mishra, S.; Miranda, A.O.; Mallick, P.K. Energy Consumption Prediction Using Light Gradient Boosting Machine Model; Springer Nature Singapore: Singapore, 2021; pp. 413–422. [Google Scholar]
- Iruela, J.R.S.; Ruiz, L.G.B.; Capel, M.I.; Pegalajar, M.C. A tensorflow approach to data analysis for time series forecasting in the energy-efficiency realm. Energies 2021, 14, 4038. [Google Scholar] [CrossRef]
- Soofastaei, A.; Aminossadati, S.M.; Arefi, M.M.; Kizil, M.S. Development of a multi-layer perceptron artificial neural network model to determine haul trucks energy consumption. Int. J. Min. Sci. Technol. 2016, 26, 285–293. [Google Scholar] [CrossRef]
- Dudek, G. Multilayer perceptron for gefcom 2014 probabilistic electricity price forecasting. Int. J. Forecast. 2016, 32, 1057–1060. [Google Scholar] [CrossRef]
- Torres, J.F.; Hadjout, D.; Sebaa, A.; Martínez-Álvarez, F.; Troncoso, A. Deep learning for time series forecasting: A survey. Big Data 2020, 9, 3–21. [Google Scholar] [CrossRef] [PubMed]
- Chai, T.; Draxler, R.R. Root mean square error (rmse) or mean absolute error (mae)?—Arguments against avoiding rmse in the literature. Geosci. Model Dev. 2014, 7, 1247–1250. [Google Scholar] [CrossRef]
- Di Bucchianico, A. Coefficient of Determination (r2). In Encyclopedia of Statistics in Quality and Reliability; Wiley: Hoboken, NJ, USA, 2007. [Google Scholar] [CrossRef]
Publisher’s Note: MDPI stays neutral with regard to jurisdictional claims in published maps and institutional affiliations. |
© 2022 by the authors. Licensee MDPI, Basel, Switzerland. This article is an open access article distributed under the terms and conditions of the Creative Commons Attribution (CC BY) license (https://creativecommons.org/licenses/by/4.0/).