Abstract
In the process of promoting economic development, carbon peaks and carbon neutrality have gradually received more attention. The question of how to steadily and rapidly improve the carbon neutrality capacity of each province and excavate the key factors hindering the carbon neutrality capacity has become particularly important. In this study, the DPSIR (driving, pressure, state, influence, response) framework was used to construct an index system of the provincial carbon neutrality capacity of the middle and lower Yellow River Basin, which included 37 indices. Based on the entropy weight matter-element model, the time evolution, regional differences, and restriction indicators of the carbon neutrality capacity of four provinces in the middle and lower Yellow River Basin from 2008 to 2021 were analyzed. The results showed that the carbon neutrality capacity of the four provinces in the middle and lower Yellow River Basin has significantly improved over time and has gradually reached a grade of “good”. Differences in carbon neutrality capacity among the provinces still exist but are gradually shrinking. the per capita car ownership, urban population density, and other factors have hindered the improvement of the carbon neutrality capacity in each province, but with the reduction in restriction indicators and increase in positive indicators such as urbanization rate, forest grass coverage, and others, the overall development direction tended to be promising.
1. Introduction
The Yellow River Basin is an important economic corridor in China’s Belt and Road Initiative, as well as an important economic link that covers the eastern, central, and western provinces and regions and plays an important role in national economic and social development and ecological protection [1]. The middle and lower Yellow River Basin flows through the Shaanxi, Shanxi, Henan, and Shandong provinces. Its carbon neutrality capacity and social and economic development affect the economic development of the northern region as well as that of the country as a whole. There are many ecological, hydrological, and water resource-related problems in the Yellow River Basin, such as soil erosion, desertification, surface mining collapse, water shortage, and downstream flooding. There are also many economic and social development problems, such as lagging economic development, large regional gaps, and low-end industries. Therefore, the key to improving the coordinated development of regional carbon neutrality capacity and promoting relevant strategies lies in the following points. The first point is the need for a comprehensive understanding of the provincial carbon neutrality capacity in the middle and lower Yellow River basin. The second point is the need to find regional carbon neutral capacity-building barriers. The third point is to explore the path of carbon neutrality capacity optimization.
Carbon neutrality starts with reducing carbon emissions and improving carbon absorption. Research on reducing carbon emissions has mainly focused on both low-carbon transportation and low-carbon economic development. Fan, Zhou, Li, Wang, Zhou, and Su, taking Dalian city, Beijing city, Harbin city, Taiyuan city, and Shanxi Province as the research objects, applied the DPSIR framework to determine an index system for urban low-carbon transportation development, measure the level of urban low-carbon transportation, and put forward relevant suggestions for urban low-carbon and transportation development [2,3,4,5,6,7]. Dai, Li, Wang, Zhang, and Sun constructed a low-carbon economic index system in Shandong province as well as in Changsha and other cities based on the DPSIR framework. According to the relevant statistical data, the hierarchical analysis method and expert scoring method were used to quantitatively evaluate the change in low-carbon economic development, and they discussed the path of low-carbon economic development. The ecological environment and ecological security of cities and river basins are the main pathways to improving carbon absorption [8,9,10,11,12]. Ting Xu, Fu, and Ycab, based on the PSR model, used the Fuzzy matter element analysis and entropy weight methods to evaluate the urban ecological security of Lanzhou city and Hengyang city and the urban agglomerations of Jiangsu and Zhejiang, and discussed the impact of each index on their urban ecological security [13,14,15,16]. Li, Zhou, and Yanan established an index system for urban land ecological security from different perspectives and carried out a land ecological security analysis of the Yimeng Mountain area, Inner Mongolia Autonomous Region, and Urumqi city using the entropy weight and object methods, respectively [17,18,19]. Huang, Jiang, and Cao constructed an index system from the three aspects of water resources management, underground water quality, and water security. The comprehensive weight of the index was determined by coupling the hierarchical analysis (FAHP) and entropy weight methods, and the model was established using the material element theory [20,21,22]. Ru, Xue, and Pei evaluated the vulnerability of urban ecological environments and their carrying capacity using the entropy weight method [23,24,25]. Zhang, Xiong, Lu, and Sun studied the ecological environments of the middle reaches of the Yangtze River, the water resource carrying capacity of the Yellow River Basin, and the health of the lake ecological system and established an index system [26,27,28,29].
In summary, indexes based on the DPSIR framework and the data processing method based on the entropy weight method and object model have been widely used to evaluate ecological safety and low-carbon economic development. However, the research object has generally been a single area or field, and the results have not reflected regional differences. At the same time, most of the studies related to carbon emissions and absorption have remained at the low-carbon level, and discussions of carbon peak and carbon neutrality are still rare. Therefore, this study took the Shaanxi, Henan, Shanxi, and Shandong provinces in the middle and lower Yellow River Basin as the research objects, established a DPSIR carbon neutrality capacity framework, and used the entropy weight method to weight each index based on the corresponding index data for each province and city from 2008 to 2021. The matter-element model was used to evaluate the carbon neutrality capacity of each province in the middle and lower Yellow River Basin to improve its ecological environment and carbon neutrality capacity. Based on the DPSIR model, this study studied the carbon neutrality capacity level of the middle and lower reaches of the Yellow River basin from the dimensions of time and space. The entropy weight method was applied to assign weights to the index system. A matter element model was established to evaluate the carbon neutrality capacity of the middle and lower reaches of the Yellow River, and the indicators with “bad” and “poor” evaluation grades were listed as restrictive indicators.
2. Materials and Methods
2.1. DPSIR Framework for Carbon Neutrality Evaluation
The DPSIR framework was created by the European Environment Agency by integrating the strengths of the “press-state-response” and “driving-state-response” models. The DPSIR framework for carbon neutrality capacity evaluation in the middle and lower Yellow River provinces is shown in Figure 1. Driving force represents the driving factor of carbon neutrality, which is mainly reflected in economic status, population distribution status, industrial development status, and other aspects. Stress represents the impact of social development on carbon neutrality, which is mainly reflected in three aspects: carbon emissions, ecological environment, and resource pressure. State represents the status quo of the main factors related to carbon neutrality capacity under the influence of pressure factors, which are mainly reflected in three aspects: carbon emission level, energy structure, and environmental status of the basin. Influence represents the feedback result and degree of the influence of stress factors and state factors on carbon neutrality capacity, which is mainly reflected in the two aspects of social and economic development and environmental optimization. Response represents various positive measures and countermeasures for the destruction of carbon neutrality capacity caused by economic development.
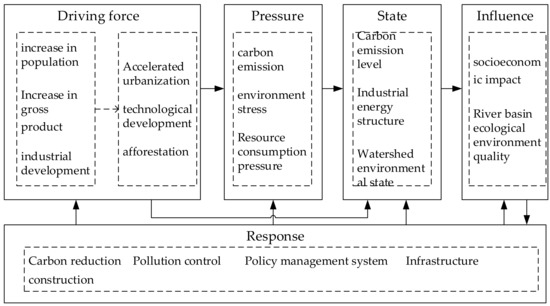
Figure 1.
DPSIR framework of the provincial carbon neutrality capacity framework in the middle and lower Yellow River Basin.
2.2. Construction of a Carbon Neutrality Capacity Index System
The index system of carbon neutrality capacity is established based on the five standard levels of DPSIR framework: driving force, pressure, state, impact, and response. Population, economy, industrial structure, energy intensity, existing ecological environment, carbon emissions, and carbon absorption constraints are fully considered [3,9,11,19,24,27,30]. Based on the DPSIR model, the index system of provincial carbon neutrality capacity in the middle and lower reaches of the Yellow River was constructed with a total of 37 indicators, as shown in Table 1. Its properties represented the influence of the index on carbon neutrality capacity, with positive indicators expressed as “+” and negative indicators expressed as “–”.

Table 1.
Provincial carbon neutrality capacity index system in the middle and lower Yellow River Basin.
2.3. Determination of Index Weights Based on the Entropy Weight Method
The entropy weight method is an objective empowerment method that judges the entropy value of an indicator based on a comprehensive evaluation according to the information entropy value (i.e., weight), which provides a basis for the comprehensive evaluation of multiple indicators. The specific steps are as follows.
The data of each index are standardized and normalized.
First, the index data is standardized to remove the differences in attributes, units, and orders of magnitude from the data and transform it into dimensionless data .
In the formula, and represent the value of the α index of province j before and after standardized treatment in the year i, j ∈ (1, 4), i ∈ (1, 14), α ∈ (1, 37).
and represent the maximum and minimum values of the α index in all years and in all provinces.
Then, the standardized data is mapped to the range of 0~1 for normalization processing, and the normalized data is obtained.
- (1)
- The index information entropy is calculated
In the formula, .
- (2)
- The index scale redundancy is calculated
- (3)
- The index weight is determined
2.4. Construction of the Matter-Element Model
2.4.1. Matter Element Description
Matter-element analysis describes objects in terms of “things (N), characteristics (C), and values (V)” in the form of orderly triples. The element model of provincial carbon neutrality capacity in the middle and lower Yellow River Basin is given by Formula (6).
In the formula, represents the evaluation object of the provincial carbon neutrality capacity of the middle and lower Yellow River Basin (i.e., Shaanxi, Shanxi, Henan, and Shandong provinces; j = 4), the feature C represents the index in the carbon neutrality capacity index system (α = 37), and V represents the value corresponding to the index C of evaluation object .
2.4.2. The Matter-Element Matrix of the Classical and Nodal Domains
In the matter-element model, the object element to be tested has a value. The classical domain refers to the standard value interval of the selected evaluation object and index in the level corresponding to the index. The section domain refers to the sum of all grade standard value ranges of the selected evaluation objects and indicators.
Suppose that the grade of carbon neutrality capacity index is divided into m levels, or the α index . The range of values under level m is denoted as . The value range is . Then, the classical domain element matrix under rank m is expressed as:
The union of the α index over the range of values of all m values is denoted as . The value range is . Then, the node domain matter-element matrix is expressed as:
2.4.3. Determination of the Object Element Distance to Be Measured and the Classical Object Element Distance
The modulus of the bounded interval [a.b] of the index value V is defined as . The distance from the value to V corresponding to the index of the evaluation object is:
The distance of the object element to be measured represents the distance between the value corresponding to the index of the evaluation object and the node domain . The distance of the classical matter element represents the distance between the value corresponding to the index of the evaluation object and the m evaluation classical domain.
2.4.4. Calculation of Correlation Function and Degree
The correlation function was used to determine the degree of membership of the index regarding the evaluation rank m. The value corresponding to the maximum value of the correlation function is the value to which the α index belongs.
In the formula, is the length of the grade interval.
2.4.5. Determination of the Comprehensive Correlation Degree and Evaluation Level
The comprehensive correlation degree is used to determine the attribution degree of evaluation object to the evaluation level, and the level corresponding to the maximum comprehensive correlation degree value is the value of the evaluation object.
The evaluation grade corresponding to the maximum comprehensive correlation degree is the evaluation grade of the evaluation object.
2.4.6. Determination of the Variable Feature Values
Variable eigenvalues are used to measure which level things are more inclined to. Assuming that the level is divided into five grades (e.g., excellent, good, medium, bad, and worse), the variable eigenvalue is expressed as:
where
2.5. Data Source
Data from 2008–2021 for the Shaanxi, Shanxi, Henan, and Shandong provinces in the middle and lower Yellow River Basin were selected as research objects. The 2008–2020 index data mainly came from the China Statistical Yearbook, China Environmental Statistical Yearbook, China Forestry and Grassland Statistical Yearbook, China Industrial Statistical Yearbook, Shandong Statistical Yearbook, Henan Statistical Yearbook, Shanxi Statistical Yearbook, Shaanxi Statistical Yearbook, and Yellow River Yearbook as well as related documents. The 2021 data were predicted using a linear prediction model.
3. Results and Discussion
3.1. Determination of Weight of the Carbon Neutrality Capacity Index
Using Formulas (1)–(5), we calculated and assigned the provincial carbon neutral index system and obtained the weight of 37 variables in 2008–2021, as shown in Table 2.
Table 2.
Weight of the provincial carbon neutrality capacity index system in the middle and lower Yellow River Basin.
3.2. Determination of the Classical and Node Domains of the Carbon Neutrality Index
The evaluation of the middle and lower Yellow River Basin had five grades: excellent, good, middle, bad, and worse. The variables, d8, s7, i1, i2, and r3 were divided according to the National Demonstration County and City Index of Ecological Civilization Construction, Evaluation Standard for Urban Landscaping, and the provincial ecological environment standards. The variables d1, d2, d3, d4, d5, d6, p4, and s8 were classified according to the 14th Five-Year Plan for National Economic and Social Development and the Outline of 2035 Long-term Goals of each province. The p2, s6, and i5 indices were divided into evaluation equivalence according to the Chinese Carbon Accounting Database CEADs [31]. The variables p3, s5, r6, and r9 were classified according to China’s Energy Big Data Report. Other indicators referred to the index value of the year and were graded according to the data sample.
An index data sample of 31 provinces was used, and the normal distribution and number of grades were used to determine the classical and node domains, as shown in Table 3.
Table 3.
Classical and node domain value ranges of carbon neutrality capacity variables.
3.3. Analysis of Grades and Characteristic Values of Carbon Neutrality Capacity
Using the matter-element calculation process described in Section 2.2, Section 2.3 and Section 2.4, the grades and variable eigenvalues of carbon neutrality capacity in the middle and lower Yellow River Basin from 2008 to 2021 were calculated, as shown in Table 4.
Table 4.
Grades and characteristic values of carbon neutrality capacity in the middle and lower Yellow River Basin from 2008 to 2021.
It can be seen that from 2008 to 2021, the grades of the four provinces fluctuated along a trend from worse to bad to medium to good. The eigenvalues generally showed a decreasing trend, which indicated that the carbon neutrality capacity of the four provinces has generally improved. The value of the highest comprehensive correlation degree constantly fluctuated, which in turn created fluctuations in the grades of the four provinces in their transformation processes.
3.4. Analysis of Provincial Carbon Neutrality Capacity-Limiting Indicators
The matter-element model was used to calculate the correlation function of each index, and the indices with grades of “worse” and “bad” were identified as the main limiting factors of carbon neutrality capacity, as shown in Table 5. It can be seen that the main limiting indicators of carbon neutrality capacity in all provinces in the middle and lower Yellow River Basin were significantly reduced, and their carbon neutrality capacity has improved. The total permanent resident population (d5), urban population density (p1), per capita carbon emissions (p2), per capita automobile ownership (p5), carbon absorption to carbon emissions ratio (s6), and power generation capacity of hydropower stations (r9) were the common factors hindering the improvement of carbon neutrality capacity. While promoting economic development, we should continuously adjust the industrial structure, promote scientific and technological innovation, advocate for green transportation, and further improve the carbon neutrality capacity.
Table 5.
Main limiting indices of provincial carbon neutrality capacity of the middle and lower Yellow River Basin.
3.5. Analysis of Regional Differences in Provincial Carbon Neutralization Capacity
The temporal and spatial difference curves of the provincial carbon neutrality capacity of the middle and lower Yellow River Basin are shown in Figure 2. It can be seen that the provincial carbon neutrality capacity has significantly improved with time, while there were persistent regional differences. According to the changing characteristics of carbon neutrality capacity over time, it could be divided into a stagnation stage (2008–2012), a rapid improvement stage (2013–2017), and an oscillating improvement stage (2018–2021). The regional differences in each stage were analyzed according to the data in Table 4 and Table 5.
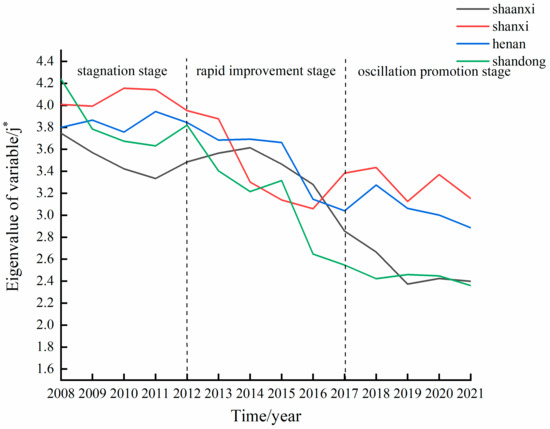
Figure 2.
Regional differences in provincial carbon neutrality capacity of the middle and lower Yellow River Basin.
In the stagnation stage (2008–2012), which was characterized by the adjustment of energy consumption and changes to the industrial structure, the carbon-neutral pressure in the four provinces was at a high level, and the regions showed slight fluctuations. The variable values decreased steadily but remained high, the improvement of restrictive indicators was not obvious, and the carbon neutrality capacity treatment stagnated. Factors such as single and fragile industrial structures, urban distribution, insufficient economic development, and insufficient application of low-carbon technologies led to the persistence of restrictive indicators in this period, for example, per capita GDP (d2), urbanization rate (d4), GDP ratio of secondary industry (p4), per capita cultivated land area (s2), success rate of air quality (s4), renewable energy capacity (s5), carbon absorption and carbon emission (s6), hydropower capacity (r9), etc.
In the rapid improvement stage (2013–2017), the regional industrial structure was gradually clear, and the fluctuation was significantly reduced. The variable values decreased rapidly, and the restrictive indicators decreased significantly. Restrictive indicators such as per capita cultivated land area (s2) and renewable energy generation ratio (s5) were improved, and regional carbon neutrality capacity was significantly improved. However, the Yellow River basin has a dense population, a concentrated industrial structure, relatively insufficient carbon sink resources, and a weak power generation capacity. The above factors were still the main factors restricting the improvement of its carbon neutrality capacity. At this stage, due to adjustments to the energy structure of its secondary industries and an accelerated implementation of the industrial energy replacement policy, the variable values were significantly reduced, and the carbon neutrality capacity significantly improved, which was an improvement over the trends observed in the other three provinces. As an important coal-producing area, Shanxi Province’s energy structure limited the speed with which carbon neutrality capacity could be improved and thus it remained relatively underdeveloped. It should therefore further adjust its industrial structure, promote the replacement of old and new energy sources, and promote the application of low-carbon technologies to industrial development.
In the oscillating stage (2018–2021), the carbon neutrality capacity of Shaanxi and Shandong provinces was further enhanced and stabilized, while Shanxi and Henan were in their bottleneck stage of development. The levels of the main restrictive indicators were not significantly reduced, and those of the new restrictive indicators, such as per capita automobile ownership (p5), became the main restrictive indicators. Regulating the urban and rural populations, giving priority to the development of primary and tertiary industries, and maintaining the ecological environment in the middle reaches of the Yellow River Basin are the keys to continuously improving the carbon neutrality capacity of Henan Province. Optimizing environmental protection standards, adjusting the energy structure, and promoting the replacement of old enterprises are the keys to achieving the same in Shanxi Province.
3.6. Discussion
(1) The DPSIR-model based carbon neutrality capacity evaluation system for the Yellow River Basin had some limitations. The indicators and factors affecting carbon neutrality will change with the change in the spatio-temporal relationship. The index systems affecting the carbon neutrality capacity of the same region in different time periods were different, and the index systems of the carbon neutrality capacity of different regions in the same time period were also different. The 37-index system established in this study was only applicable to the carbon neutrality capacity evaluation of the Yellow River Basin from 2008 to 2021. With the change in time, the index system that affects the carbon neutrality capacity of the Yellow River Basin will also change.
(2) When determining the classical and node domain value ranges of each index, this study discussed, calculated, and developed the classical and node domain value ranges under the corresponding index system of the Yellow River Basin based on the data of 31 provinces and autonomous regions in China. In the process of determining classical and node domain value ranges, the mathematical statistical method of normal distribution was used to divide the matter-element domain, and the conclusions in Table 3 were finally determined. The above methods were used to make the classical and node domain value ranges more objective as far as possible. However, due to policy changes in different regions, force majeure, and people’s response degree to environmental protection, there were certain subjective factors in the process of determining the classical and node domain value range of the matter-element model.
4. Conclusions and Policy Recommendations
4.1. Conclusions
(1) Based on the DPSIR framework, the carbon neutrality capacity framework of the middle and lower reaches of the Yellow River was constructed from the five aspects of driving force, pressure, state, impact, and response. The carbon neutrality capacity model was constructed based on the entropy weight method and the factor model [13,14,15,16,17,18,19,20,21,22,23,24,25]. The index data from 2008 to 2021 proved that the model had a good applicability.
(2) In 2008–2021, the provincial carbon neutrality capacity of the middle and lower Yellow River Basin went through a stagnation stage, a rapid improvement stage, and an oscillating stage. The value trended from worse to bad to medium to good, and its correlation with good values continuously improved until it became stable. The restrictive indicators of carbon neutrality capacity were significantly reduced. The current restrictive indicators, such as carbon absorption to carbon emissions ratio and per capita vehicle ownership, show regional consistency and universality. The adjustment should be to accelerate industrialization, promote clean energy to replace traditional fossil energy, develop new modes of public transportation [2,3,4,5,6,7], and improve the ecological environment [13,14,15,16]. Regional variation has always existed, especially as carbon neutrality capacity has increased. At present, the Shanxi and Henan provinces are in their bottleneck stage, and policies and measures should be formulated with respect to the restrictive indicators.
(3) According to the carbon neutrality capacity levels, restriction indices, time, and region differences, it is necessary to change the mode of industrial development, promote the low-carbon transformation of traditional industries, develop modern services, and accelerate the transformation of old and new driving forces in the economy of the Yellow River Basin. It is also necessary to protect its ecological environment [13,14,15,16], enhance its carbon sink capacity, and vigorously develop its green industrial chain while strengthening innovation in green science and technology, stepping up the research and development of low-carbon and environmental protection technologies, increasing new energy exploration, increasing the proportion of renewable energy consumption, and promoting the low-carbon transformation of traditional industries in the Yellow River Basin.
(4) This study analyzed the evolution process of regional carbon neutrality capacity over time and space, and deeply explored the specific influencing index factors of regional carbon neutrality capacity. Corresponding improvement methods and policy suggestions were put forward for each influencing factor. The specific evaluation grade of carbon neutrality capacity in the basin was given to provide help for the self-understanding of carbon neutrality capacity of each province. The problems faced by carbon neutrality are of great diversity and particularity. This study also identified deficiency aspects in the current carbon neutrality capacity of the studied provinces and provides directions for future policy making.
4.2. Policy Recommendations
Combined with the above analysis, the restrictive indicators that limit the carbon neutrality capacity of the provinces in the Yellow River Basin in different time periods and regions were obtained from 2008 to 2021. At the same time, the carbon neutrality level of the provinces in the basin was also evaluated. Accordingly, some policy suggestions to promote the carbon neutrality capacity of provinces in the Yellow River Basin are put forward as follows:
(1) Provinces have actively developed emerging industries, strengthened ecological and environmental protection in the Yellow River basin, formulated and implemented low-carbon development plans, and effectively eliminated obstructive indicators. The carbon neutrality status of most provinces in the Yellow River Basin is relatively severe, and the resource and environmental problems in the middle reaches are prominent. To improve the carbon neutrality capacity of the Yellow River basin, the resources and environment in the Yellow River basin need to be further rationally utilized, managed, and protected. It is necessary to establish a reasonable resource and environmental utilization mechanism, strictly control the emission of industrial pollutants, advocate for public transportation, promote the implementation of low-carbon economic development plans, and improve the comprehensive capacity of carbon neutrality in the provinces along the Yellow River Basin.
(2) The distribution of the middle and lower reaches of the Yellow River’s provincial carbon neutral pressure is generally larger, strengthens the response and the implementation of policy, and increases the factors of flow across the land. Digging in the middle and lower reaches of the Yellow River and Yangtze River along the banks of the leading types of carbon neutral city gives full play to their ability to experience a carbon neutral spillover effect, which is a progressive effect, and the formation of the carbon cycle in the Yellow River urban agglomeration will drive the improvement of the provincial carbon neutrality capacity in the form of urban agglomeration. Based on the development advantages of each region, the differences in factors hindering carbon neutrality shown by each region should be solved.
(3) While dredging economic development, the government should constantly coordinate the contradiction between environmental protection and economic development, improve the overall coordinated development level at the material level, such as industrial support and the accumulation of development factors, and formulate relevant policies according to local conditions.
Author Contributions
Methodology, H.W.; validation, J.X.; data curation, Z.L.; writing—original draft preparation, Z.L.; writing—review and editing, J.X. and H.W.; supervision, H.W.; and project administration, J.X. All authors have read and agreed to the published version of the manuscript.
Funding
This research was funded by Research on the Modernization of Rural Governance from the Perspective of Risk Society [grant number 20BGL214], the National Social Science Fund Project and the Impact of China’s Coal Market Changes on the Economic Development of Shaanxi Province and Policy Research [grant number 2015KRM005], Soft Science Program of Shaanxi Province and Study on Energy Environment Economy Comprehensive Accounting and Its Derivatives of Shaanxi Province Based on Green Social Accounting Matrix [grant number 16JZ040], and the Key Scientific Research Program of Shaanxi Provincial Department of Education.
Data Availability Statement
Not applicable.
Conflicts of Interest
The authors declare no conflict of interest.
References
- Zhang, X. Research on ecological compensation mechanism of the Yellow River Basin Economic Zone. North. Econ. 2021, 5, 58–61. [Google Scholar]
- Fan, H.; Xu, Z.; Zhang, R. Analysis of urban low-carbon transportation indices based on DPSIR—Dalian city as an example. Ecol. Econ. 2018, 34, 64–69. [Google Scholar]
- Zhou, Y.; Wang, J.; Gao, J.; Ren, J. Evaluation of low-carbon transportation development based on DPSIR and analysis of barrier factors—Beijing as an example. Ecol. Econ. 2020, 36, 13–18. [Google Scholar]
- Li, L. Evaluation of the Current Situation and Development Path of Low-Carbon City in Taiyuan. Master’s Thesis, Shanxi University of Finance and Economics, Taiyuan, China, 2019. [Google Scholar]
- Duan, J. Research on low-carbon city construction strategy in Shanxi based on DPSIR framework. Sci. Tech. Innov. Prod. 2022, 5, 33–37. [Google Scholar]
- Zhou, G.; Singh, J.; Wu, J. Evaluating low-carbon city initiatives from the DPSIR framework perspective. Habitat Int. 2015, 50, 289–299. [Google Scholar] [CrossRef]
- Su, M.; Zheng, Y.; Yin, X. Practice of Low-carbon City in China: The Status Quo and Prospect. Energy Procedia. 2016, 88, 44–51. [Google Scholar] [CrossRef]
- Dai, X. Evaluation of Low-Carbon Economy Development and Promotion Measures in Shandong Province. Master’s Thesis, Qingdao University, Qingdao, China, 2016. [Google Scholar]
- Li, M.; Deng, C.; Xie, B.; Liu, B.; Lei, G. Evaluation of Change of Low Carbon Economic development in Changsha Based on DPSIR Model. Res. Agric. Modern. 2016, 37, 453–459. [Google Scholar]
- Wang, Q.; Jiang, R. Is carbon emissions growth decoupled from economic growth in emerging countries? New insights from labor and investment effects. J. Clean. Prod. 2020, 248, 119188. [Google Scholar] [CrossRef]
- Zhang, L.; Li, N.; Qin, Y.; Zhang, J.; Wang, X. Evaluation of low carbon development level and spatial differentiation of Chinese cities based on DPSIR framework. World Geogr. Res. 2019, 28, 85–94. [Google Scholar]
- Sun, Y.; Shen, L.; Zhong, S.; Liu, L.; Wu, N.; Li, L.; Kong, X. Analysis of the driving force effect of carbon emissions change in China. Res. Sci. 2017, 39, 2265–2274. [Google Scholar]
- Ma, T.; Shao, Z. Research on Land Ecological Security Evaluation Based on PSR Model and Entropy Right Method—Lanzhou City as an example. Hubei Agric. Sci. 2021, 60, 67–71. [Google Scholar]
- Xu, Z.; Wang, P.; Dong, Y. Land ecological security evaluation in Hengyang City based on PSR model and grey prediction model. J. Xinjiang Normal Univ. 2020, 39, 49–56. [Google Scholar]
- Fu, G.; Liu, W. Evaluation of urban ecological level based on the material element topologizable model—An example of urban clusters in Jiangsu and Zhejiang provinces. Ecol. Econ. 2021, 37, 86–91. [Google Scholar]
- Ycab, C.; Yba, C. Improving the ecological environmental performance to achieve carbon neutrality: The application of DPSIR-Improved matter-element extension cloud model. J. Environ. Manag. 2021, 293, 112887. [Google Scholar]
- Li, Z.; Shuo, W.; Liang, M.; Aixia, J. Study on Dynamic Change of Land Ecological Security in Yimeng Mountain Area Based on Entropy Element Model. Chin. J. Soil Sci. 2021, 52, 425–433. [Google Scholar]
- Zhou, R. Land Ecological Security Evaluation in Inner Mongolia Autonomous Region Based on Material element Analysis. World Agric. 2017, 12, 217–224+260. [Google Scholar]
- Zhu, Y.; Yan, Z.; Pu, C.; Liu, Z. Land use/overlying change and ecological security evaluation in Urumqi city. For. Resour. Manag. 2020, 1, 79–91. [Google Scholar]
- Huang, X.; Zhong, J.; Fang, G.; Chen, Y. Evaluation of Water Resources Management Based on Material Analysis. Adv. Sci. Tech. Water Resour. 2017, 37, 22–28. [Google Scholar]
- Yu, W.; Jia, C.; Di, S.; Li, K.; Yuan, H. Groundwater quality evaluation based on comprehensive weight and improved extension model. J. Jilin Univ. (Earth Sci. Ed.) 2019, 49, 539–547. [Google Scholar]
- Cao, Y. Study on Evaluation of Water ecological safety in Northwest China based on DPSIR framework. Water Resour. Dev. Manag. 2021, 1, 17–23. [Google Scholar]
- Ru, S.; Ma, R. Evaluation, spatial analysis and prediction of ecological environment vulnerability in the Yellow River Basin. J. Nat. Resour. 2022, 37, 1722–1734. [Google Scholar] [CrossRef]
- Wang, X. Study on Ecological Safety Assessment of Yuzhong Section of the Yellow River Basin Based on DPSIR Framework. Master’s Thesis, Lanzhou University, Lanzhou, China, 2021. [Google Scholar]
- Tang, P.; Yang, W. Study on ecological environment carrying capacity and obstacle factors in Hangzhou. Jiangsu Agric. Sci. 2020, 48, 273–280. [Google Scholar]
- Zhang, W.; Sun, C.; Su, C.; Zhang, X. The Health Evaluation and Research of the Lake Ecological Environment System. Water Resour. Plan. Des. 2021, 4, 15–19+31. [Google Scholar]
- Xiong, S.; Li, T.F. Ecological environment quality evaluation of the economic zone in the middle reaches of the Yangtze River. Stat. Decis. 2021, 37, 84–87. [Google Scholar]
- Lu, Y.; Xu, S.; Si, B.; Shen, L. Study on the dynamic evolution characteristics of water resources environmental carrying capacity in nine provinces (regions) of the Yellow River Basin. Yellow River 2021, 43, 103–108. [Google Scholar]
- Sun, X.; Zhu, B.K.; Zhang, S. New indices system for quantifying the nexus between economic-social development, natural resources consumption, and environmental pollution in China during 1978–2018. Sci. Total Environ. 2022, 804, 150180. [Google Scholar] [CrossRef]
- Wang, J.; Kang, W.; Jingyu, Z.; Xuerong, L.; Jia, Z.; Zhixue, L. Preliminary study on the evaluation of low-carbon city development in Harbin based on DPSIR framework. J. Nat. Sci. Harbin Norm. Univ. 2017, 33, 92–97. [Google Scholar]
- Tsinghua University. China Carbon Accounting Database. Available online: https://www.ceads.net.cn (accessed on 24 March 2022).
Publisher’s Note: MDPI stays neutral with regard to jurisdictional claims in published maps and institutional affiliations. |
© 2022 by the authors. Licensee MDPI, Basel, Switzerland. This article is an open access article distributed under the terms and conditions of the Creative Commons Attribution (CC BY) license (https://creativecommons.org/licenses/by/4.0/).