1. Introduction
The world’s electrical and thermal energy usage had recently become greedy due to the clear growth in manufacturing and residential needs. Therefore, energy planners were directed to incorporate heat and power supplies to reduce the downsides of traditional facilities. Likewise, there has been a global push to minimize the pollution emissions contributing to global warming [
1].
It has become necessary to reduce operational expenses and accomplish reliable power generation system operations because fuel costs for power generation are rising sharply, and the power demands are increasing daily. With the economic load dispatch (ELD), the system’s reliability is increased, the energy capacity of thermal units is maximized, and the cost of production is decreased [
2]. A non-convex ELD distributes the load demand on a power system among committed generating units to retrieve the operation economy within specific operational and system restrictions. An ELD can be considered a nonlinearly constrained optimization problem with equality and inequality constraints and nonlinear cost properties.
For handling challenging optimization issues, meta-heuristics have become progressively popular in numerous academic domains [
3]. In contrast to traditional optimization approaches, which are underestimated due to problems that include local optimal stagnation [
4], meta-heuristics optimizations constitute one of the most effective and impactful methods for identifying optimal solutions. Several metaheuristics, such as biogeography-based optimization (BBO) [
5], learning-based optimization (TLBO) [
6], TLBO with Levy flight (CTLBO) [
7], the enhanced cuckoo search (ECS) algorithm [
8], the social spider algorithm (SSA) [
9], and grey wolves [
10], have been proposed to solve ELD while taking into account the fuel cost, supply/demand constraints, and transmission losses.
However, because of the high concentration of pollutants that thermoelectric plants produce, it is essential to consider the environmental issues besides the lowest possible cost while defining the problem. This becomes significantly more difficult when ecological issues are added, which is the environmental/economic load dispatch. It considers ecological pollution and seeks to reduce emissions at the lowest possible cost [
11]. Various studies have included both the economic and environmental charges, such as the differential evolution algorithm (DEA) [
12] and the modified differential evolution algorithm (MDEA) [
13], with handling various constraints.
In typical thermal power plants, a considerable portion of thermal energy is squandered and discharged into the environment through cooling towers, flue gas, or other means. As a consequence, despite the most efficient newer combined cycle plants, the efficiency of turning fossil fuels into electrical energy is only 50% to 60%. By collecting and utilizing waste heat, combined heat and power (CHP) systems boost the conversion efficiency of typical units from 50–60% to over 90% [
14]. The Economic Dispatch Model (EDM) integrating CHP units is an important topic in managing the operation of these units [
15]. Traditionally, the EDM integrating CHP units aims to minimize fuel costs by managing the power-only, CHP, and heat-only units. On the other hand, environmental issues are inextricably linked to energy generation and utilization.
The goal of the EDM integrating CHP units is to reduce fuel expenditures by optimizing the distribution of the heat load and power load orders [
16]. Economic optimization alone, however, is unable to address the demands of social energy conservation and environmental protection due to the growing importance of environmental problems [
17]. Multiple equality and inequality constraints transform the ecological EDM integrating CHP units into a difficult objective optimization issue. The two competing goals of economic emission dispatch are to reduce pollutant emissions and to maintain the lowest fuel costs [
18]. Therefore, the environmental EDM integrating CHP units involves finding a collection of ideal, workable solutions that have the lowest possible fuel prices and pollution emissions. The environmental EDM integrating CHP units is additionally always non-smooth, non-convex, nonlinear, and multi-constrained [
19,
20].
Metaheuristic strategies have been recommended to the non-convex EDM with CHP units, thermal plants, and boilers to acquire the lowest operating costs by analyzing all practically important restrictions such as valve-point impacts, transmission loss, and environmental issues. The Gravitational Search Algorithm (GSA) was characterized in [
21] for the environmental EDM integrating CHP units, with studying the valve-point effect and losses of power-only units. A multi-player harmony search technique (MPHST) [
22] was manifested for the environmental EDM integrating CHP units with the impact of the thermal plants and valve-point loading. In [
23], the Cuckoo Search Technique (CST) was illustrated to minimize the fuel cost of the EDM integrating CHP units, and the valve point effect has been considered for power-only units. In [
24], the heap optimizer was applied on the EDM integrating CHP units considering the valve-point impact constraint and transmission loss; however, the environmental objective has not been studied. Deep Reinforcement Learning (DRL) and Artificial Neural Networks [
25] with low computing complexity were elaborated to manifest the EDM integrating CHP units with diverse operating circumstances [
26]. However, these two papers have not considered transmission loss, valve-point impact constraints, and environmental objectives. In [
27], Marine predator (MPA) was utilized to solve the EDM integrating CHP units with iterations’ separation into three distinct units. In [
28], the Jellyfish technique emerged with the Heap technique, and it was applied to the EDM integrating CHP units system, taking into consideration unit outages.
Additionally, the hybridization of algorithms has been suggested to solve the optimal EDM integrating CHP units, such as hybrid particle swarm optimizer (PSO) with firefly techniques [
29] and the cuckoo optimization algorithm with a penalty [
30], which is a differential evolution with migrated variables [
31]. However, despite their impressive achievements, most MAs are delicately sensitive to changes in user-defined parameters. Therefore, it is necessary to test a new technique to solve the EDM integrating CHP units considering the economic and emissions aspects.
The honey badger optimization algorithm (HBOA) is a novel, innovative meta-heuristic search technique motivated by the honey badger’s intelligent foraging behavior to find prey. In HBOA, the honey badger’s dynamic searching behavior with digging and honey-seeking tactics is divided into the exploration and exploitation phases [
32]. The HBOA has been previously performed for handling different optimization problems such as feature selection problems based on the neighborhoods rough-set theory [
33], estimation of parameters of solar cells and photovoltaic modules [
34], parameters estimation for steady-state and dynamic models of solid oxide fuel cells [
35], and identification of proton-exchange membrane fuel cells [
36]. This paper proposes a novel honey badger optimization algorithm (HBOA) to handle the Economic Dispatch Model (EDM) integrating combined heat and power (CHP) units. It aims to minimize fuel costs and pollutant environmental emissions by managing the power-only, CHP, and heat-only units. HBOA is employed in comparison to several modern meta-heuristic optimization algorithms, including the African Vultures Algorithm (AVO), Dwarf Mongoose Optimization Algorithm (DMOA), Coot Optimization Algorithm (COA), and Beluga Whale Optimization Algorithm (BWOA). These algorithms are applied in a comparative manner considering the seven-unit test system. Various loading levels are taken into account with different power and heat loading. For each loading level, four cases are investigated, which are different based on the objective task and the power losses consideration. The main contributions of the article can be stated as follows:
A novel HBOA is designed to solve the EDM integrating CHP units while accounting for power losses in the system.
The proposed HBOA shows the best performance compared to AVO, DMOA, COA, and BWOA in minimizing the fuel costs considering different loading levels.
The proposed HBOA outperforms other reported algorithms in minimizing fuel costs.
The suggested HBOA significantly reduces pollutant environmental emissions compared to the initial case at varying loading levels.
2. The EDM Integrating CHP Units
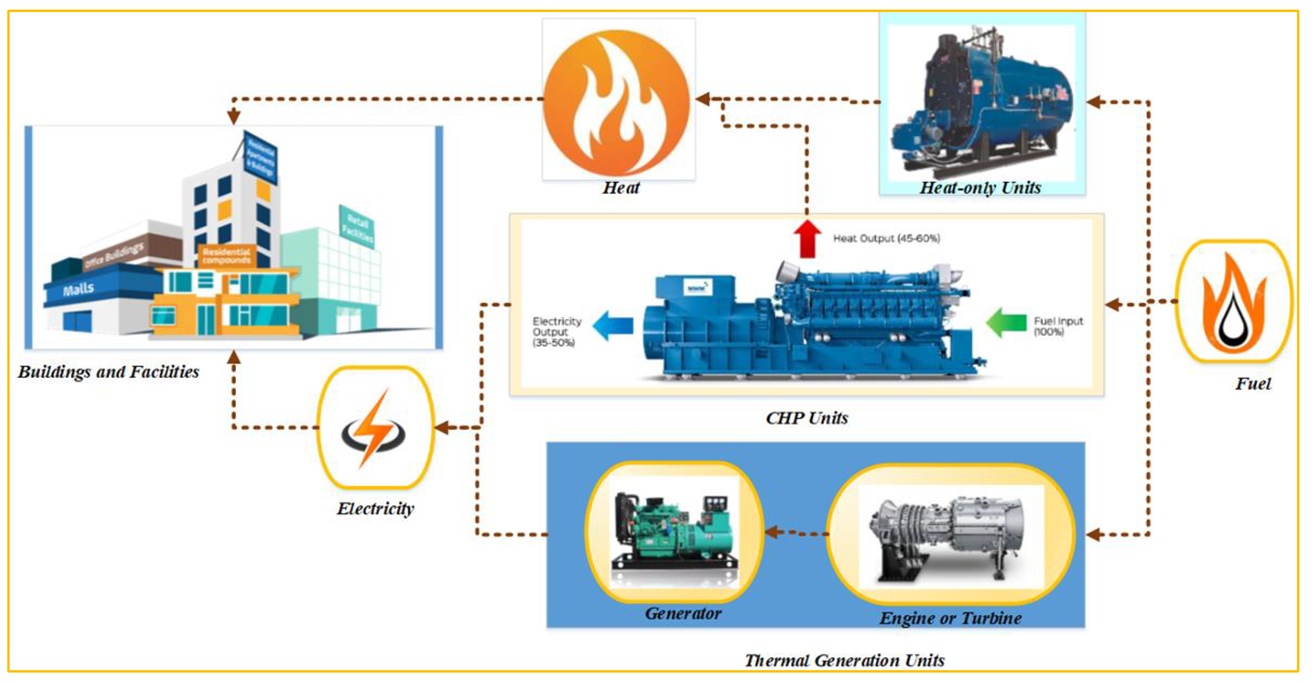
Figure 1 describes the EDM’s main participants in feeding the buildings’ and facilities’ power and heat requirements. The primary objective of the EDM integrating CHP units is to produce the optimal value for power obtained from power generators, heat obtained from heat generators, and both heat and electricity obtained from co-generators, while maintaining the different limitations. Moreover, energy production and consumption are the causes of energy and environmental issues. In this context, the EDM integrating CHP units elaborates on reducing the emission of air pollutants from fossil fuel combustion and reducing the entire fuel cost of the system. The minimization of generation costs (
F1) is represented as follows [
37]:
where
NCHP,
NH, and
NG denote the number of the CHP, heat, and power units, respectively, while
Ci(Pi,Hi),
Cj(Hj), and
Ck(Pk) elaborate the cost functions for the CHP, heat, and power units, respectively, that can be mathematically described as follows [
38]:
where the symbols
β1,
β2,
β3,
β4,
β5, and
β6 manifest the CHP units’ cost coefficients, respectively, while the symbols
φ1,
φ2, and
φ3 represent the heat units’ cost coefficients, respectively, and the symbols
α1,
α2,
α3,
α4, and
α5 represent the power units’ cost coefficients, respectively.
The valve-point effects are introduced in a sinusoidal fashion to power units, as shown in (4), to demonstrate the non-convexity and non-differentiability of the EDM integrating CHP units [
27]. The valve point effect is the reduction in efficiency which occurs whenever a turbine is operated from a valve point or immediately following the opening of the preceding valve. For gas power plants, the valve point impact is a key aspect of their operations, but modeling it presents computational difficulties since the fuel cost model has to be non-convex and non-smooth [
39,
40].
The emissions (
F2) take into consideration the pollutant gases of CO
2, SO
2, and NOx, and the minimization of
F2 can be mathematically formulated as follows:
where
Ei(Pi,Hi),
Ej(Hj), and
Ek(Pk) represent the emission functions for the CHP, heat, and power units, respectively, and they can be represented mathematically as follows [
41]:
where
γ and
π denote the emission coefficients of the CHP and heat units, respectively, while the symbols
δ1,
δ2,
δ3,
δ4, and
δ5 characterize the power units’ emission coefficients, respectively.
The inequality constraints in terms of the capacity of the heat, power, and CHP units, as considered in (9)–(12), respectively, for the EDM integrating CHP units, must be sustained, and can be represented as follows:
where the superscript terms ‘
max’ and ‘
min’ reflect the maximum and minimum bounds, respectively.
Additionally, the equality constraints in terms of the heat and power balance, as considered in (13) and (14), respectively, for the EDM integrating CHP units, must be sustained, and can be represented as follows:
where
Hdemand represents the system heat demand, while
Pdemand defines the electric demand.
Further, non-convexity for the problem can be created by adding the transmission losses as manifested in (15):
where
PLoss defines the total losses, whereas the term
Bji denotes the line losses correlating the units and depicts the coefficient component in the B-matrix.
In this regard, the reformulation of (7) can be illustrated as follows:
3. Proposed HBOA for Solving the EDM Integrating CHP Units
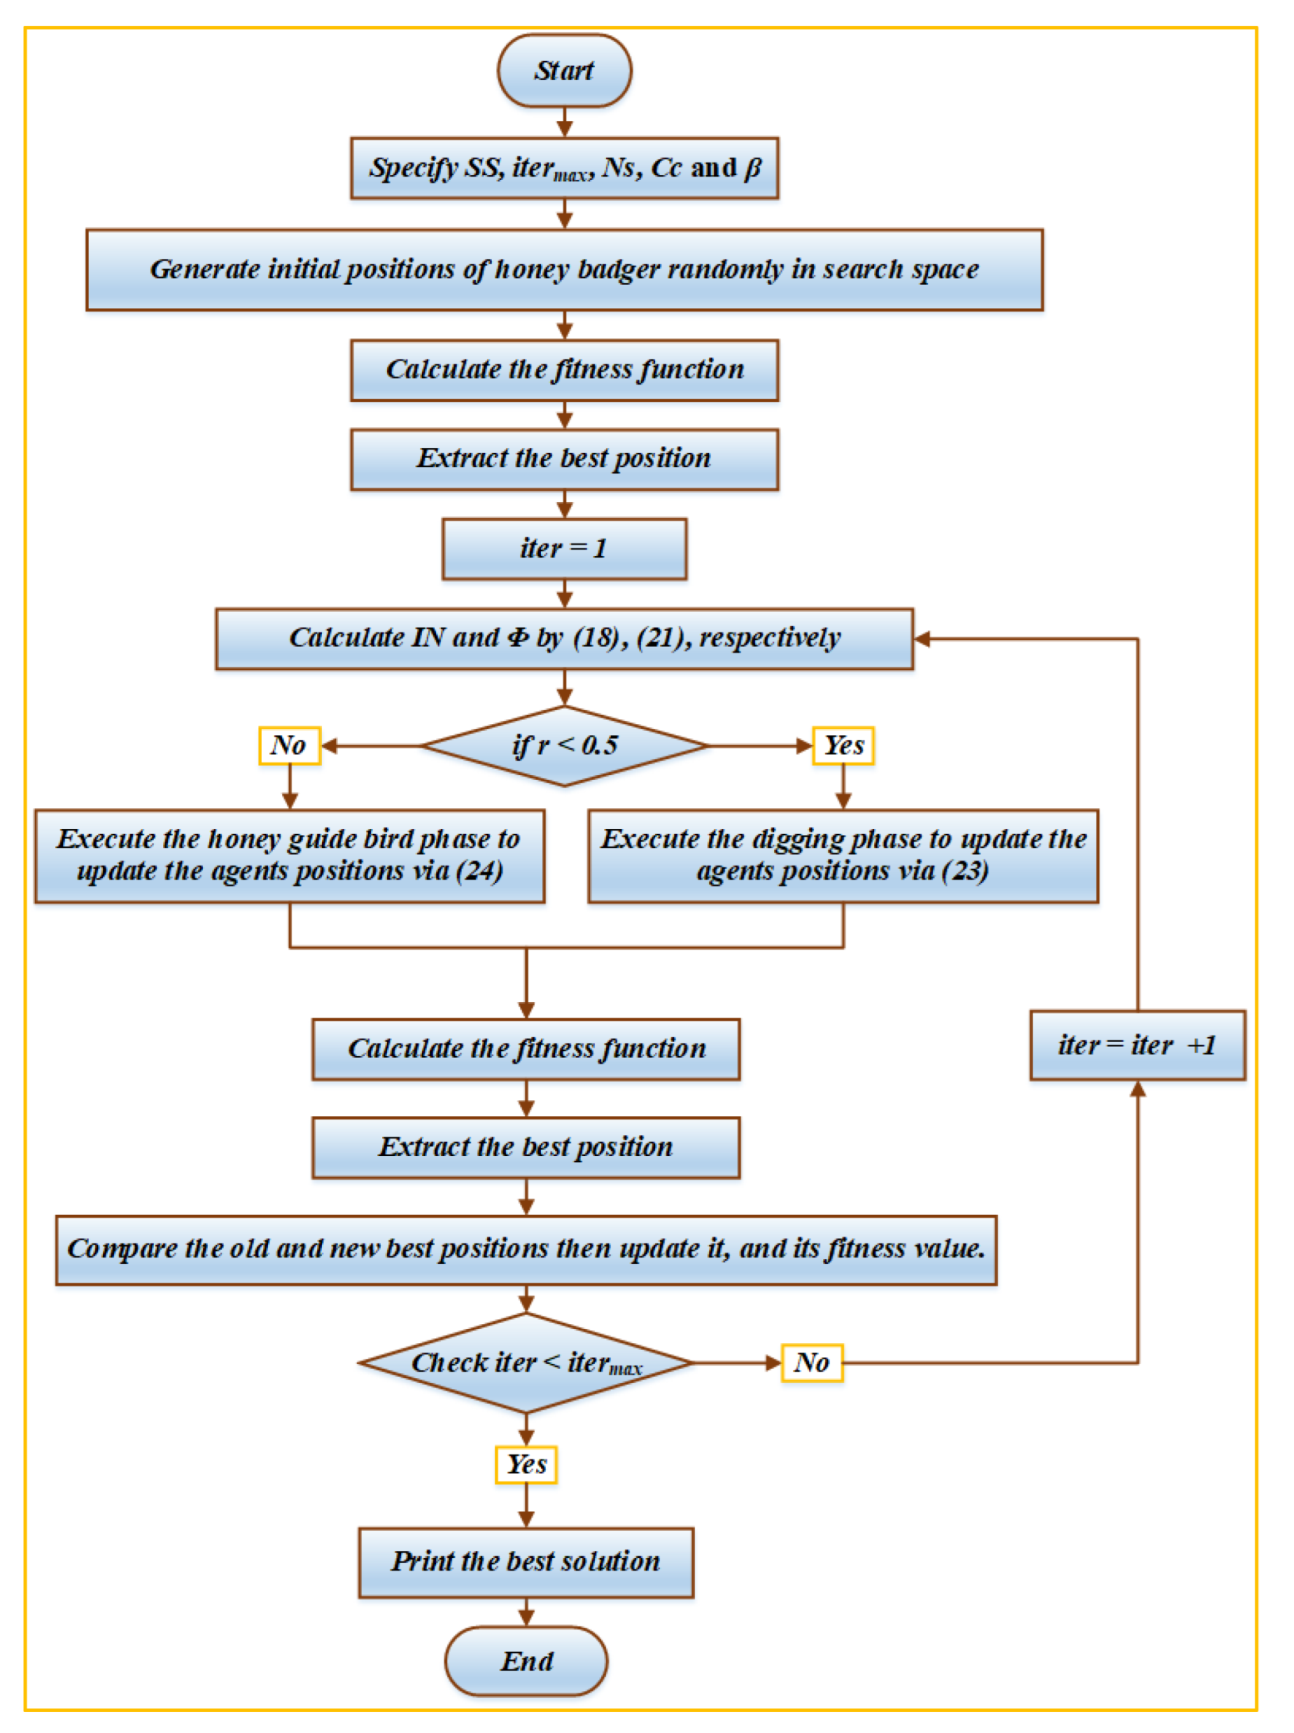
For solving the proposed EDM integrating CHP units, a new HBOA has been designed. The honey badger’s sophisticated foraging activity inspired this meta-heuristic search technique. In the HBOA, the honey badger’s dynamic search behavior with digging and honey-seeking tactics is divided into exploitation and exploration stages [
32]. The honey badger prefers to live alone in self-dug tunnels and only encounters others to mate. However, due to their brave attitude, they may be hunted by much larger animals when they are unable to flee.
On the other hand, a honey badger can climb a tree to access bird nests and beehives for food. A honey badger finds its meals by sniffing out mouse nests and digging or following the honey guide bird, which can discover hives but cannot obtain honey. The first-way honey badgers receive their food supply is known as the searching mode, whereas the second approach is known as the honey mode. The first technique is carried out only by the honey badger, while the second strategy is carried out with the assistance of other birds to identify beehives. The second mode’s phenomenon leads to a relationship between two entities experiencing the benefits of collaboration. However, due to its capacity to maintain the trade-off balance between exploration and exploitation during the search process, the HBOA features dynamic search modes.
The HBOA’s mathematical framework is depicted as follows:
The suggested HBOA begins with an initialization of the number of honey badgers based on the population number (
Ns) and the following positions:
where
is honey badger position,
and
are the lower and upper limits of each position in the search space, and
is a random number between 0 and 1.
The intensity (
Int) is specified, which would be proportional to concentrate, prey strength, and the length between the
jth honey badger and the prey. The prey will move quickly when the smell strength is strong and vice versa. The following formula is used to compute the defining intensity [
32]:
where
is the source strength,
is a random number, and
denotes the distance between
and the
jth badger position. The strength in (19) is considered to be the squared difference between the honey badger’s current and next position since the strength must always be positive as it indicates the intensity.
The density factor
is specified and updated, which controls time-varying randomization to ensure a smooth transition from exploration to exploitation. This factor decreases with iterations to decrease randomization with time as [
34]:
where
is the maximum iterations number and
Cc is a constant equal to 2.
To enhance escaping from local to optimal regions, a flag (
Fg) is generated, which alters the search direction. Thus, agents have availing high opportunities to scan the search space rigorously. They are determined by:
where
is a random number between [0,1].
Then, the agent’s positions are updated where is updated, according to two phases of the digging phase and the honey phase as follows:
In the digging phase, a honey badger performs actions similar to a cardioid shape, which can be simulated as [
32]:
where
is the ability of the honey badger to obtain food that is greater than or equal to 1 (default = 6) and
,
, and
are three different random numbers between 0 and 1.
In the honey phase, a honey badger follows a honey guide bird to reach a beehive, which is simulated as [
33]:
where
is a random number between 0 and 1. The flowchart diagram of the HBOA is shown in
Figure 2.
Therefore, a honey badger searches close to the prey’s location, and the searching process is influenced by time-varying density factors (
). In addition, the HBOA performance is significantly affected by two user-defined parameters (
), and so these parameters should be selected carefully. In this context, the best parameter values of the proposed algorithm, which are
, are taken from [
32].
4. Simulation Results
The findings for the EDM incorporating CHP units were compared to different algorithms to show the effectiveness of the proposed algorithm. The algorithms involved are the HBOA, African Vultures Algorithm (AVO) [
42], Dwarf Mongoose Optimization Algorithm (DMOA) [
43], Coot Optimization Algorithm (COA) [
44], and Beluga Whale Optimization Algorithm (BWOA) [
45]. The competitive algorithms were tested on seven-unit systems. The test systems comprised two CHP units, four thermal generation units, and a heat-only unit. The systems’ data, consisting of coefficients of losses, fuel costs, emissions, and heat/power restrictions, were obtained from reference [
46] as reported in
Appendix A. In addition, three loading levels were taken into account with different power and heat loading, as described in
Table 1.
The three loading levels represent different loading variations of a peak, shoulder, and low values of the power and heat loading, and so this proves without any doubt the capability of the proposed technique compared to the others in one instance and for all conditions. Four cases were investigated for each loading level, which were different based on the objective task and the power losses consideration, as shown in
Table 2.
The simulation implementations were run using MATLAB 2017b. In addition, the competitive algorithms’ population size and maximum number of iterations were adjusted to 100 and 300, respectively.
4.1. Implementation of Case 1
The proposed HBOA and the AVO, DMOA, COA, and BWOA were applied for solving the EDM integrating CHP units for minimizing targets of costs. In this case, the minimization of fuel costs was handled. For the first loading level of 600 MW power demand and 150 MWth heat demand,
Table 3 illustrates the optimal operating settings of the power-only, CHP, and heat-only units based on the competitive algorithms.
The proposed HBOA showed better outcomes (as seen in
Table 3) by achieving the lowest fuel costs of USD 10,091.91/h. On the other side, the COA achieved the second rank by obtaining fuel costs of USD 10,092.13/h. The DMOA achieved the third degree by obtaining fuel costs of USD 10,092.36/h. The AVO achieved the fourth degree by obtaining fuel costs of USD 10,094.59/h. Finally, the BWOA shows the worst performance by achieving the last degree with fuel costs of USD 10,200.34/h.
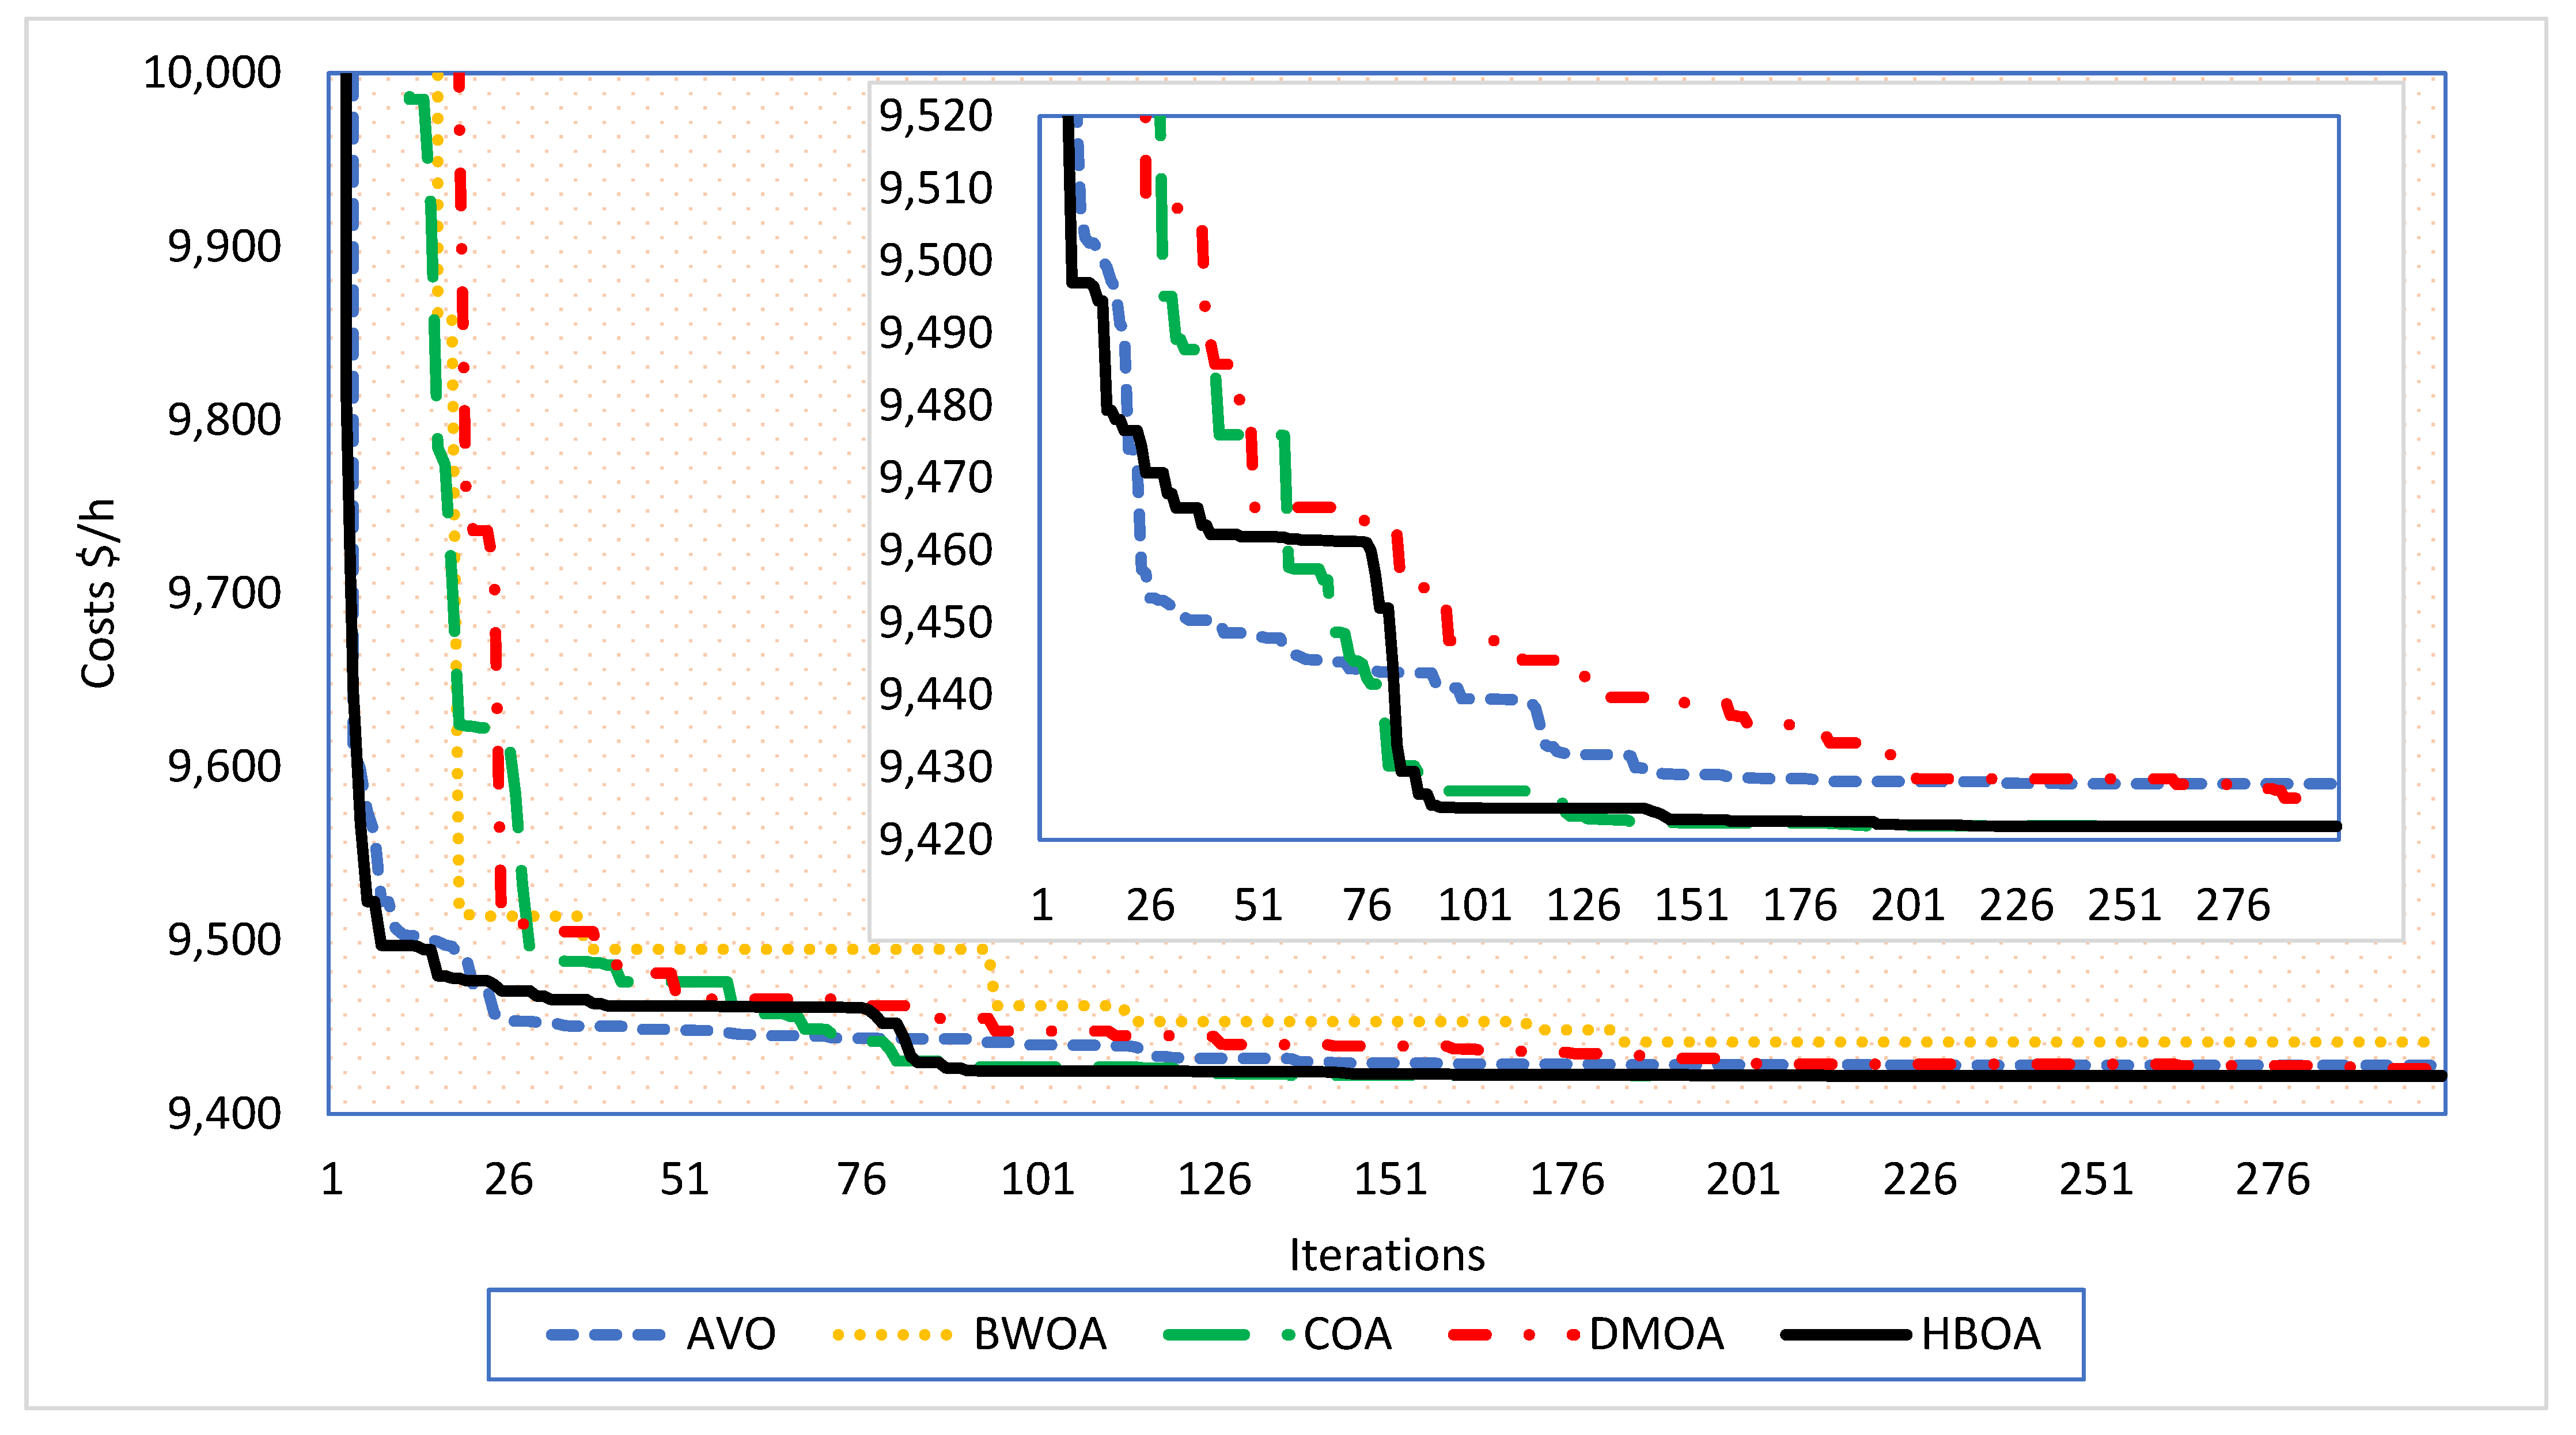
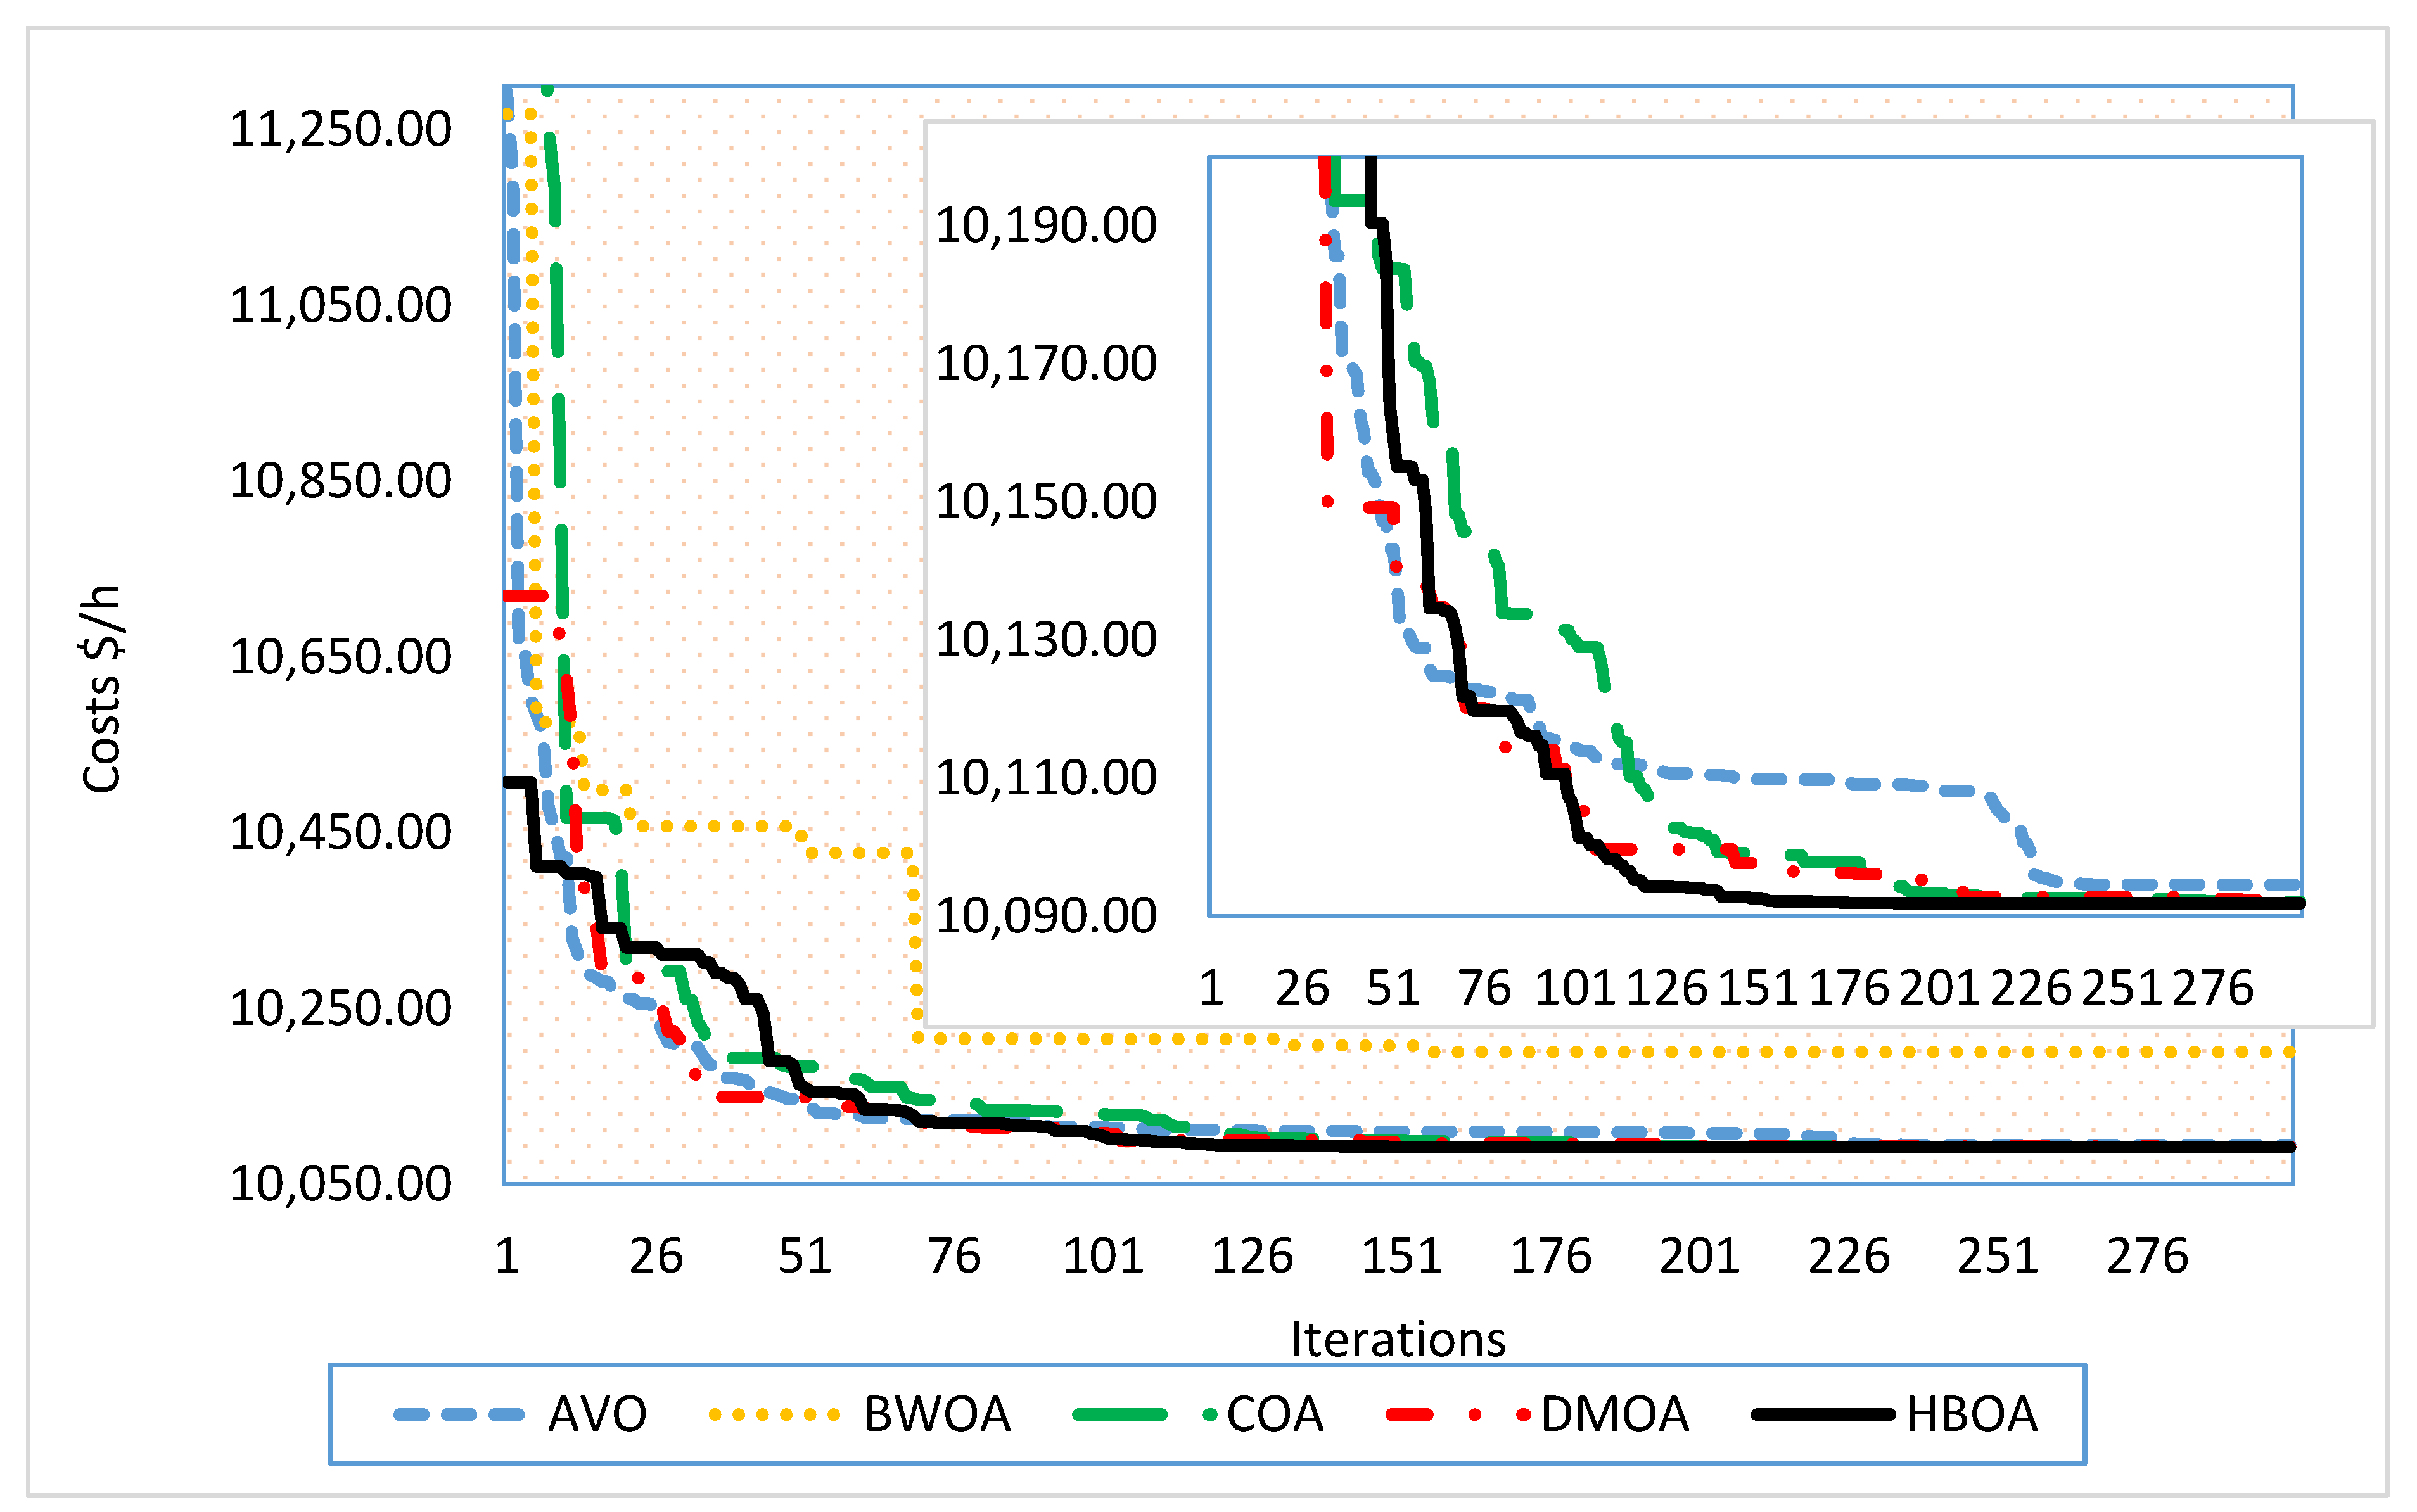
Figure 3 displays the convergence rates of the proposed HBOA and the AVO, DMOA, COA, and BWOA of Case 1 for the first loading. The HBOA, AVO, DMOA, and COA showed appropriate converging characteristics in their evolution to reduce the objective throughout the iterations. The subfigure (or the zoomed part) in
Figure 3 shows a zoomed picture that illustrates the performance of the techniques up close. Thus, it illustrates the superiority of the submitted HBOA in minimizing the considered costs. However, the proposed HBOA had the fastest rate of converging toward the minimum fuel costs since it approximately reached the minimum fitness at the 200th iteration, as shown in the figure. This is due to the significant exploitation feature of the proposed HBOA in the honey phase, where a honey badger follows a honey guide bird to reach a beehive.
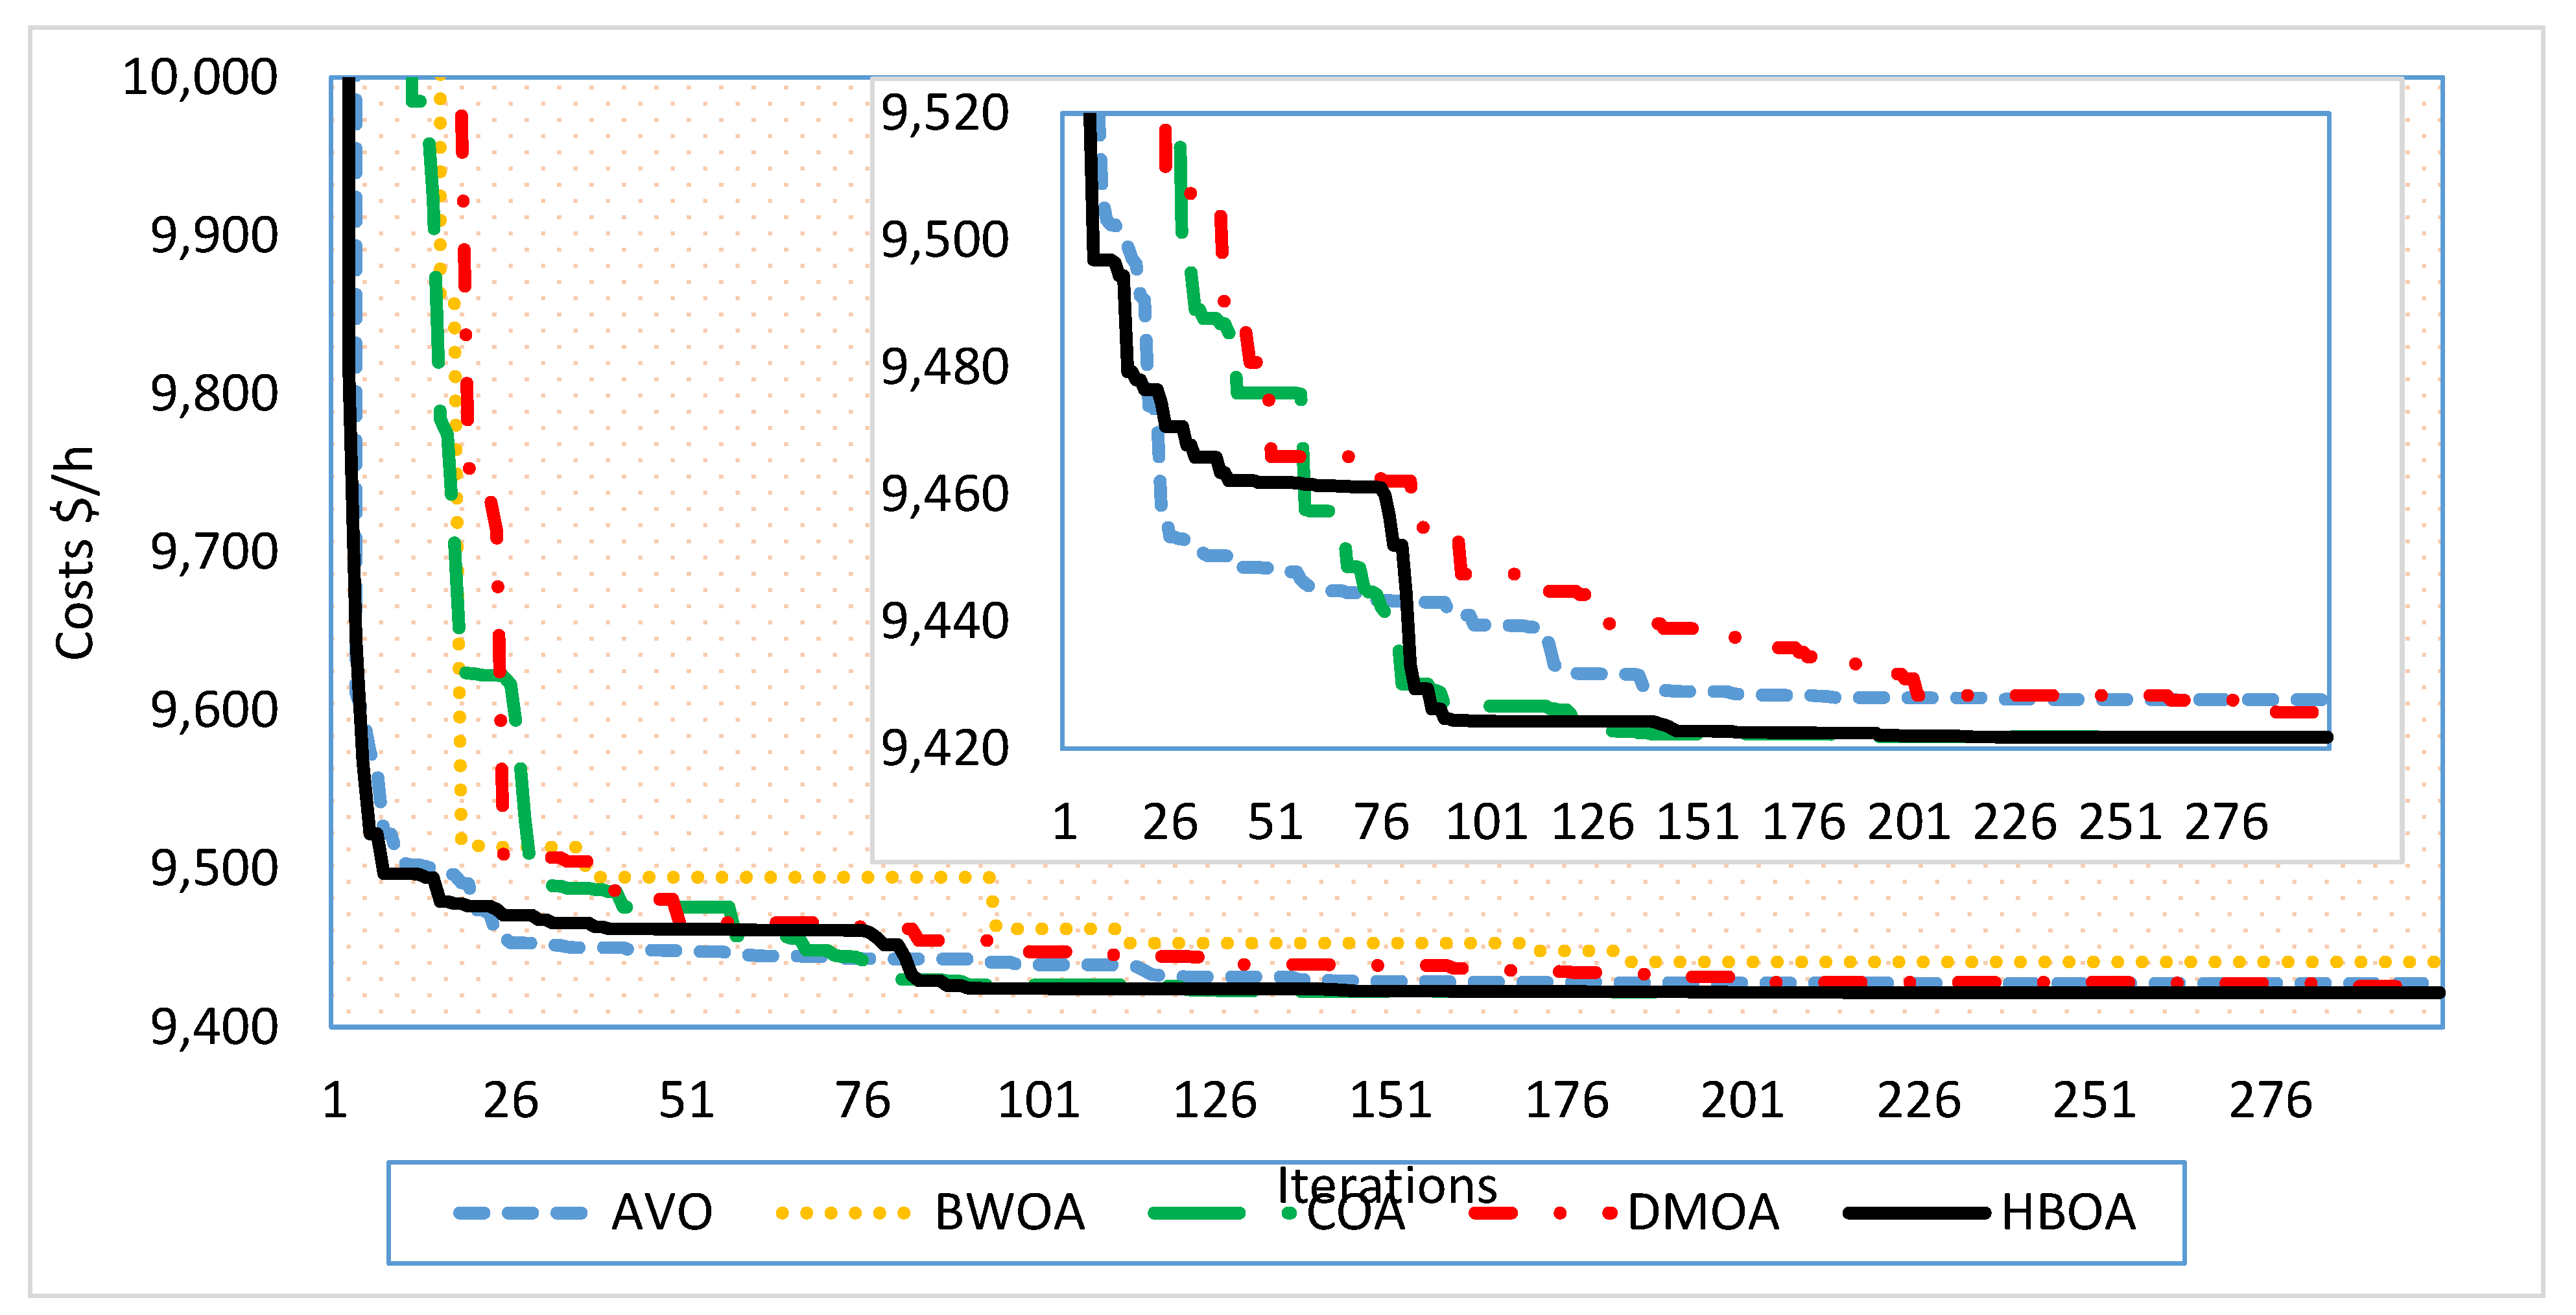
For the second loading level, a power demand of 250 MW and a heat demand of 175 MWth were maintained.
Table 4 illustrates the optimal operating settings of the power-only, CHP, and heat-only units based on the proposed HBOA and the AVO, DMOA, COA, and BWOA. The proposed HBOA showed better outcomes (as seen in this table) by achieving the lowest fuel costs of USD 9421.84/h.
Figure 4 displays the convergence rates of the proposed HBOA and the AVO, DMOA, COA, and BWOA of Case 1 for the second loading, whereas the zoomed image in this figure proves the superiority of the proposed HBOA in minimizing the considered costs. The proposed HBOA had the fastest rate in converging toward the minimum fuel costs.
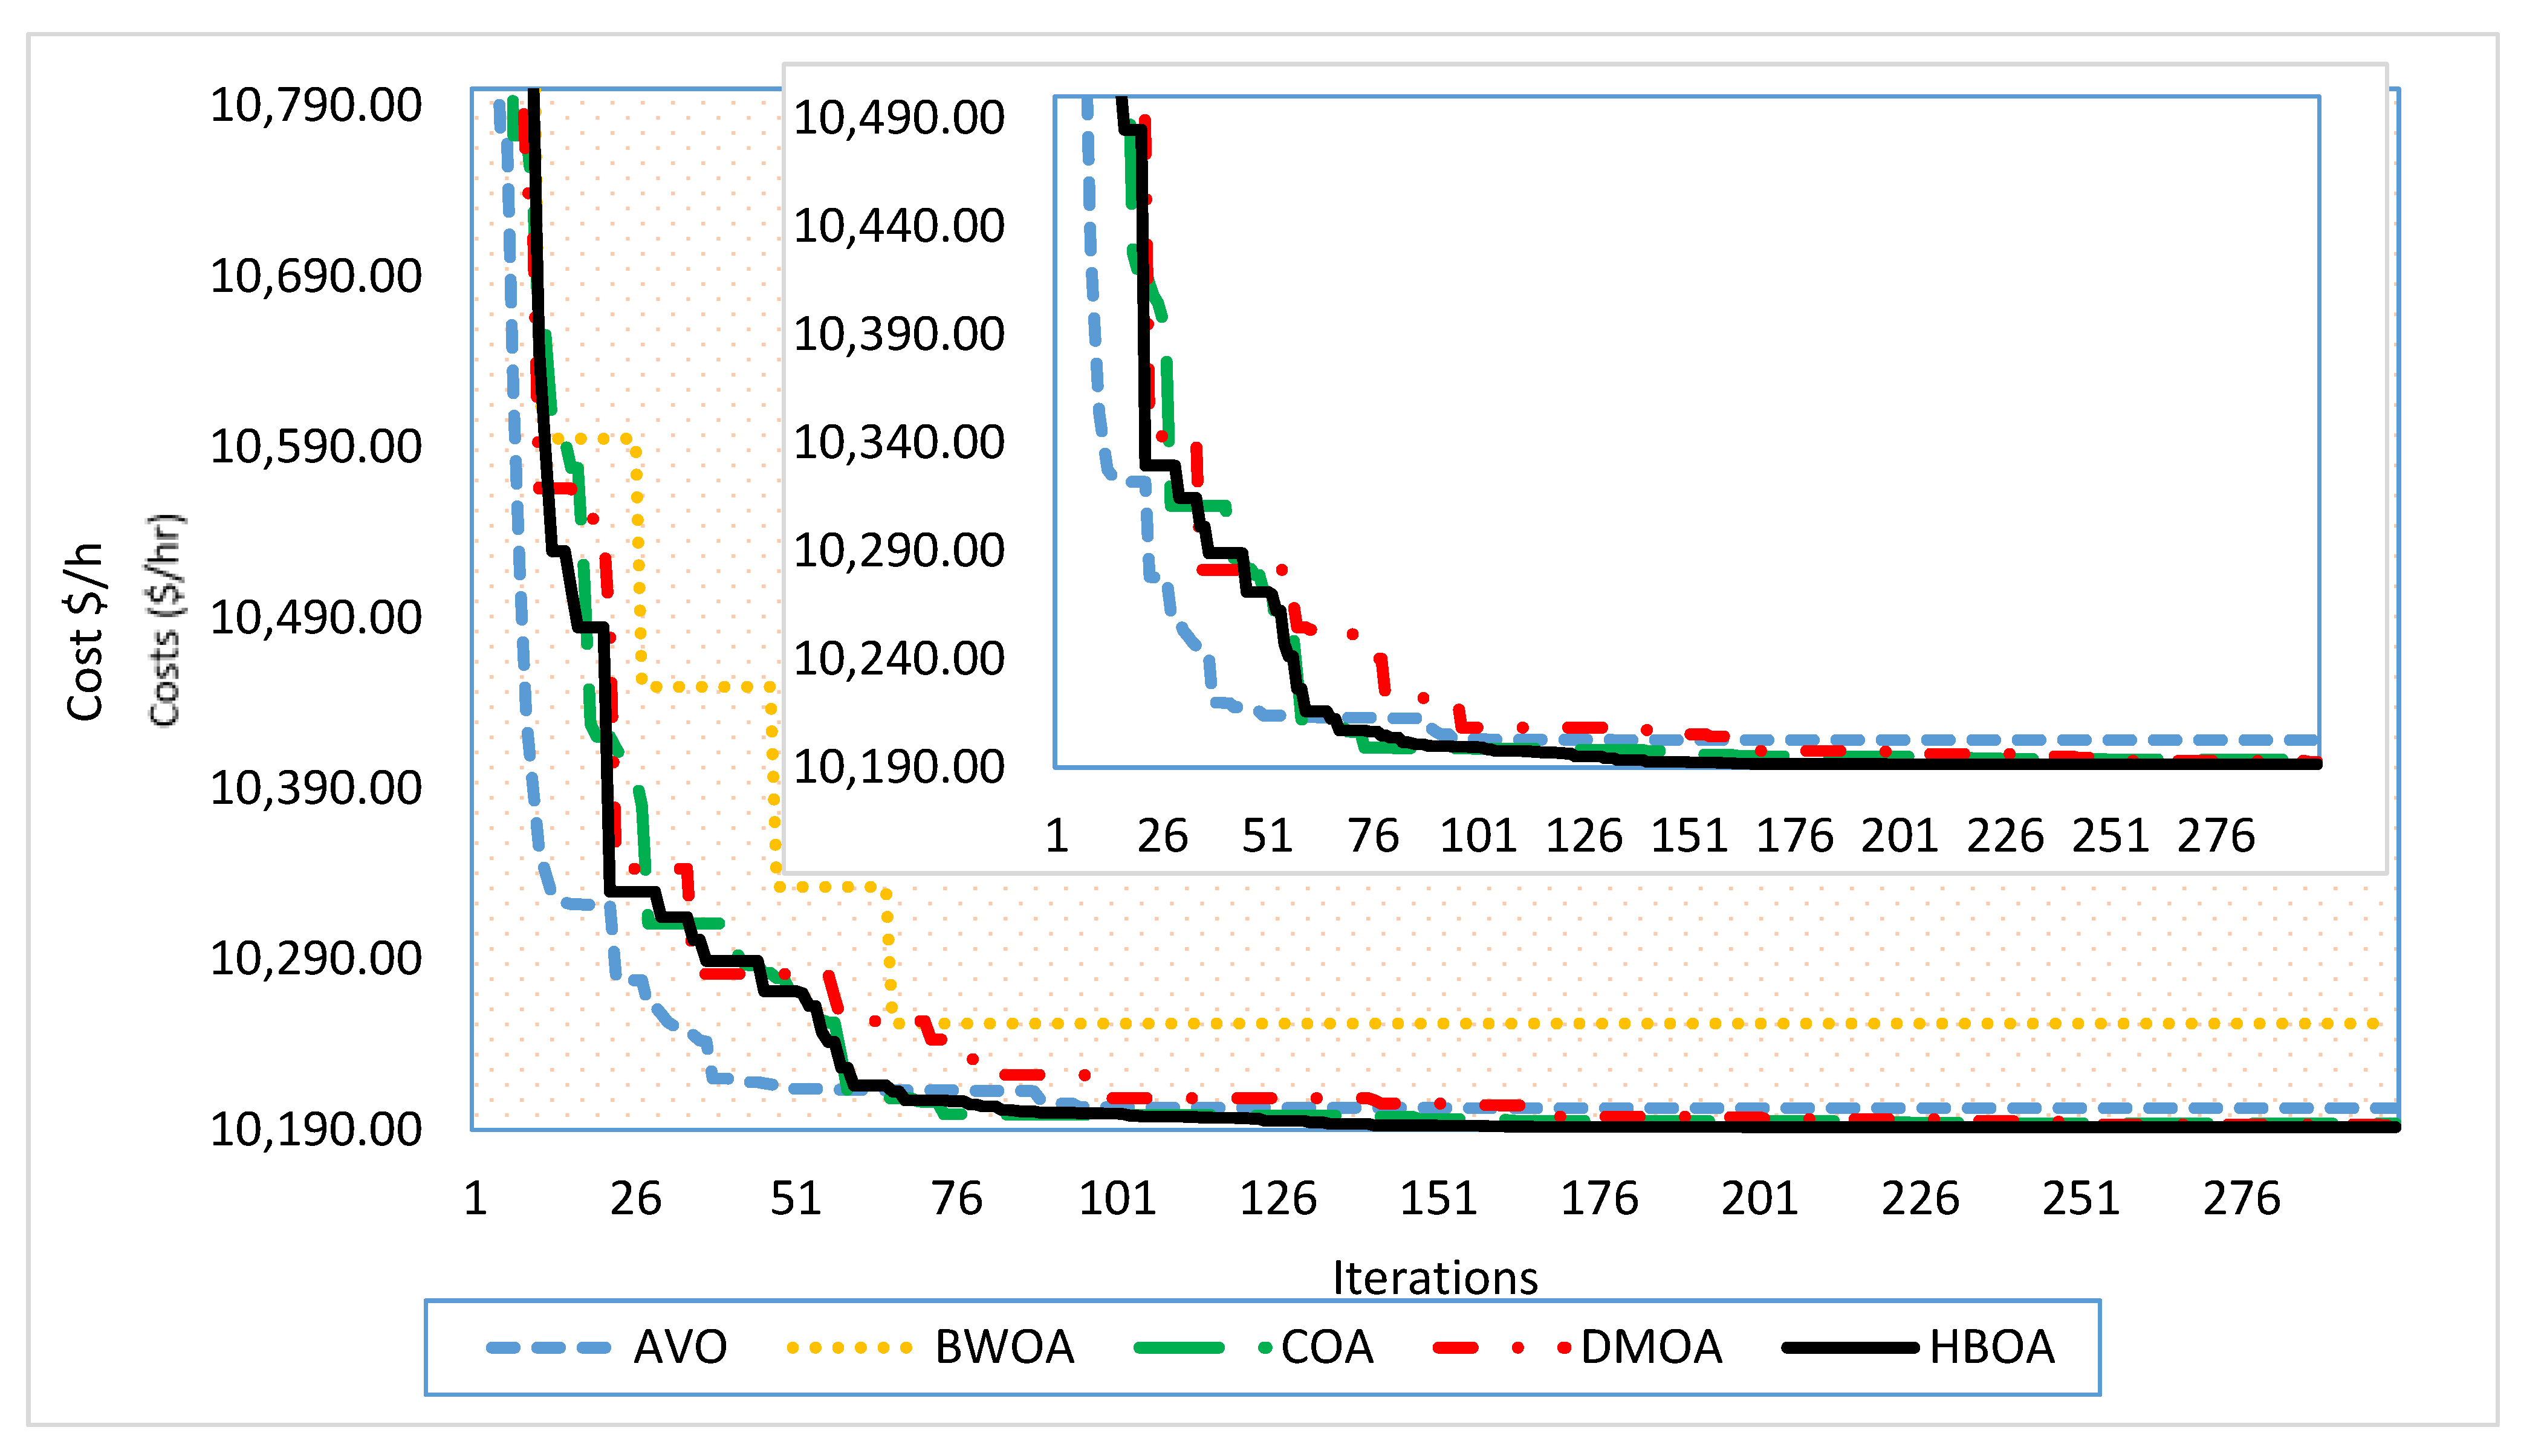
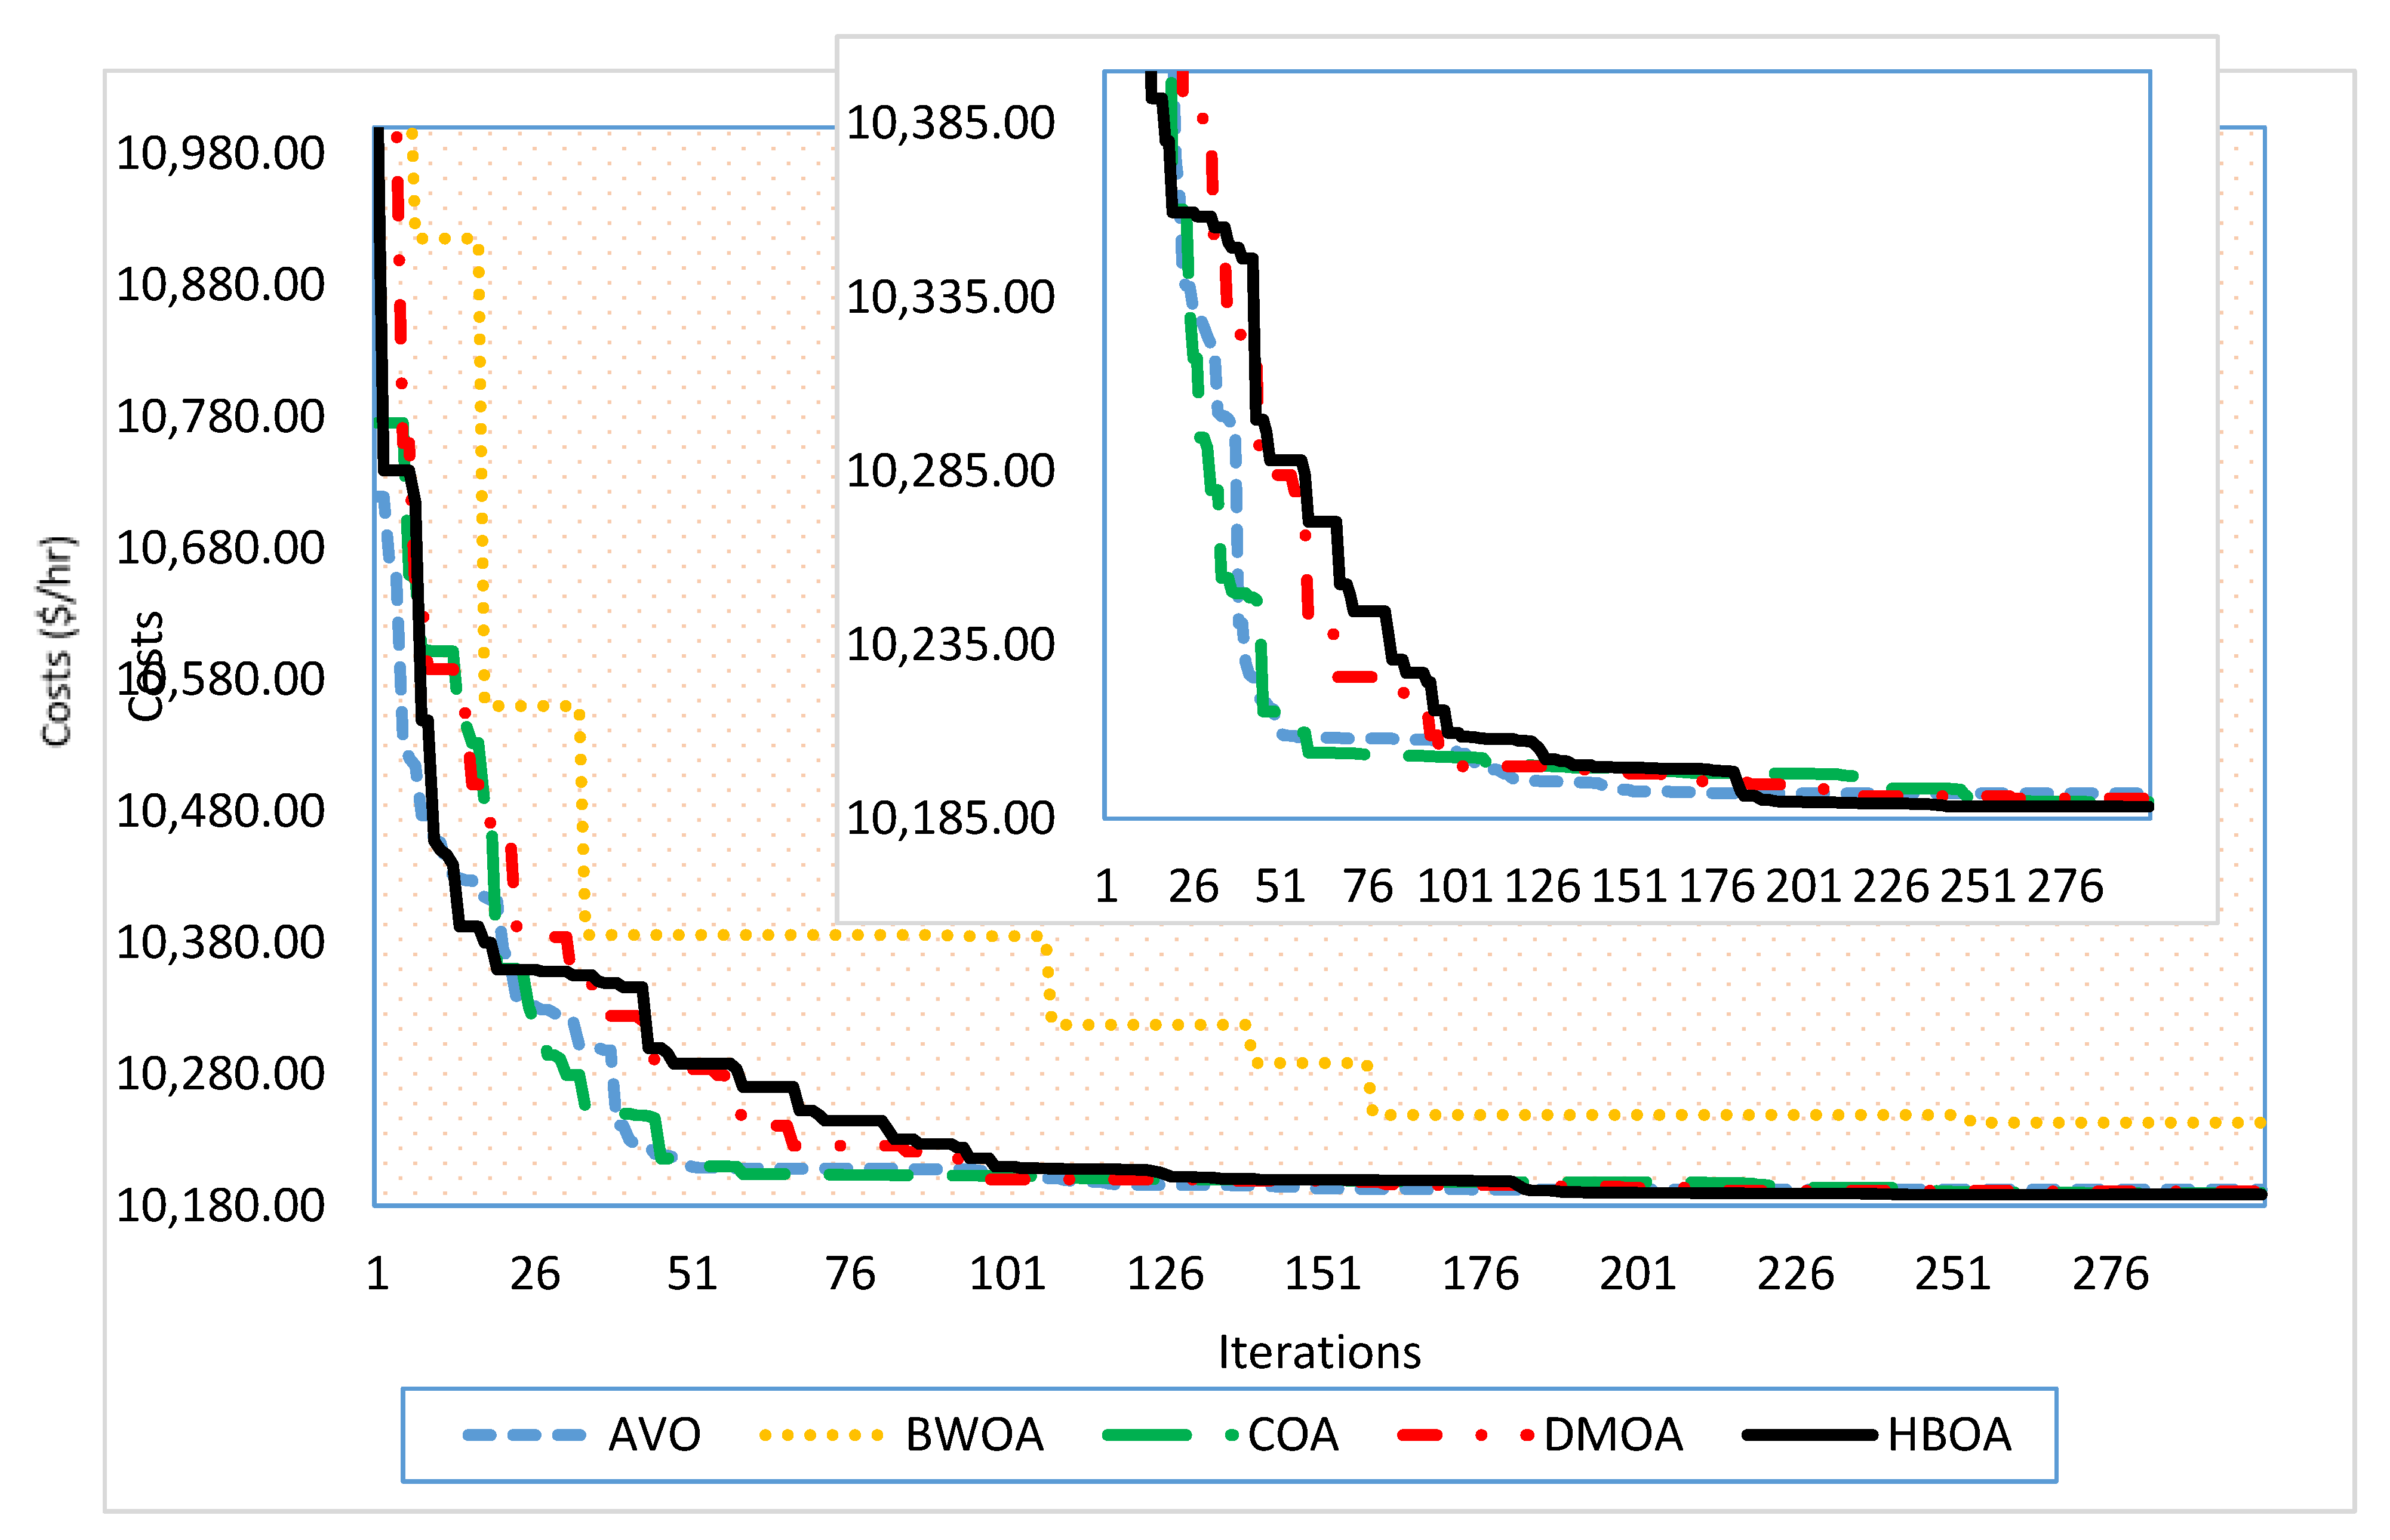
For the third loading level, a power demand of 160 MW and a heat demand of 220 MWth were maintained.
Table 5 illustrates the optimal operating settings of the power-only, CHP, and heat-only units based on the proposed HBOA and the AVO, DMOA, COA, and BWOA. The proposed HBOA showed better outcomes (as seen in this table) by achieving the lowest fuel costs of USD 10,191.57/h. On the other side, the DMOA achieved the second rank by obtaining fuel costs of USD 10,192.66/h. The COA ranked third by obtaining fuel costs of USD 10,193.7/h. The AVO achieved fourth by obtaining fuel costs of USD 10,202.71/h. Finally, the BWOA showed the worst performance by achieving the last degree by obtaining fuel costs of USD 10,252.24/h. This is due to the significant searching capability of the proposed HBOA over that of the AVO, DMOA, COA, and BWOA.
In addition,
Figure 5 displays the convergence rates of the proposed HBOA and the AVO, DMOA, COA, and BWOA of Case 1 for the third loading. Again, the HBOA, AVO, DMOA, and COA showed appropriate converging characteristics in their evolution to reduce the objective throughout the iterations. However, the proposed HBOA had the fastest rate of converging toward the minimum fuel costs.
4.2. Implementation of Case 2
In this case, the power losses through the system network were considered while the minimization of fuel costs was handled. The proposed HBOA and the AVO, DMOA, COA, and BWOA were applied considering the three loading levels. In this regard,
Table 6 illustrates the optimal operating settings of the power-only, CHP, and heat-only units for the three loading levels. Further, for this case,
Figure 6,
Figure 7 and
Figure 8 display the convergence rates of the proposed HBOA and the AVO, DMOA, COA, and BWOA for the three loading levels.
As shown, the proposed HBOA showed better outcomes compared to the others for the three loading scenarios. For the first loading level, the proposed HBOA achieved the lowest fuel costs of USD 10,094.42/h, while the COA achieved the second rank by obtaining fuel costs of USD 10,094.51/h. Additionally, the DMOA achieved the third degree by obtaining fuel costs of USD 10,095.19/h, and the AVO achieved the fourth degree by obtaining fuel costs of USD 10,096.22/h. Finally, the BWOA showed the worst performance by achieving the last degree by obtaining fuel costs of USD 10,224.56/h.
For the second loading level, the proposed HBOA achieved the lowest fuel costs of USD 9422.844/h, while the AVO achieved the second rank by obtaining fuel costs of USD 9423.118/h. Additionally, the COA achieved the third degree by obtaining fuel costs of USD 9423.261/h, and the DMOA achieved the fourth degree by obtaining fuel costs of USD 9426.352/h. Finally, the BWOA showed the worst performance by achieving the last degree by obtaining fuel costs of USD 9457.449/h.
For the third loading level, the proposed HBOA achieved the lowest fuel costs of USD 10,091.91/h, while the COA achieved the second rank by obtaining fuel costs of USD 10,092.13/h. The DMOA achieved the third degree by obtaining fuel costs of USD 10,092.36/h, and the AVO achieved the fourth degree by obtaining fuel costs of USD 10,094.58/h. Finally, the BWOA showed the worst performance by achieving the last degree with fuel costs of USD 10,200.34/h.
In addition, the HBOA, AVO, DMOA, and COA showed appropriate converging characteristics in their evolution to reduce the objective over the course of the iterations. However, the proposed HBOA had the fastest rate of converging toward the minimum fuel costs. Added to that,
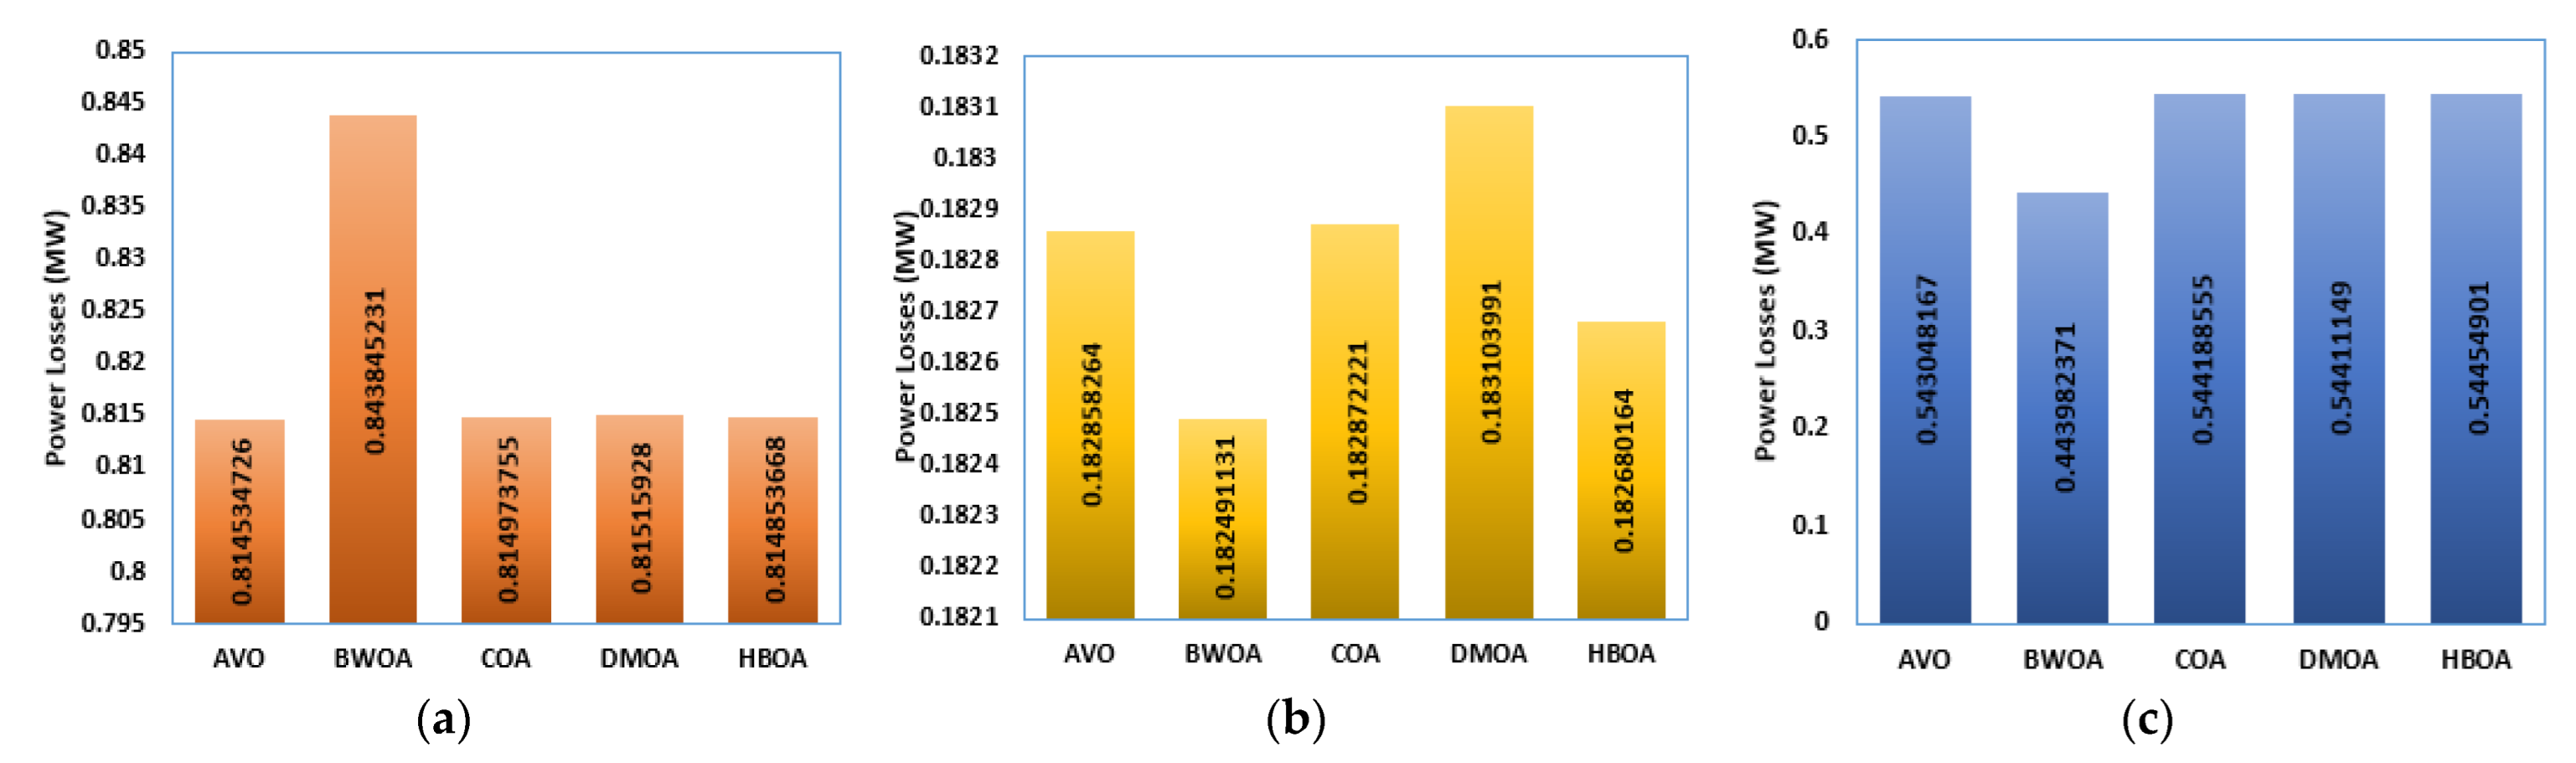
Figure 9 shows a comparison between the competitive algorithms, the HBOA, AVO, DMOA, and COA, in terms of the power losses at different loading conditions.
For this case, and considering the first loading level,
Table 7 illustrates the comparisons between the proposed HBOA and the other reported techniques of Case 2, which are the teaching learning-based optimization [
47], particle swarm optimization with time-varying acceleration [
48], improved genetic algorithm [
49], effective cuckoo search algorithm [
50], and bee colony optimization [
51]. From this table, the achieved costs based on the proposed HBOA were better than those presented by other works that used the same data set.
4.3. Implementation for Case 3
In this case, the minimization of pollutant environmental emissions was handled. The proposed HBOA was applied considering the three loading levels.
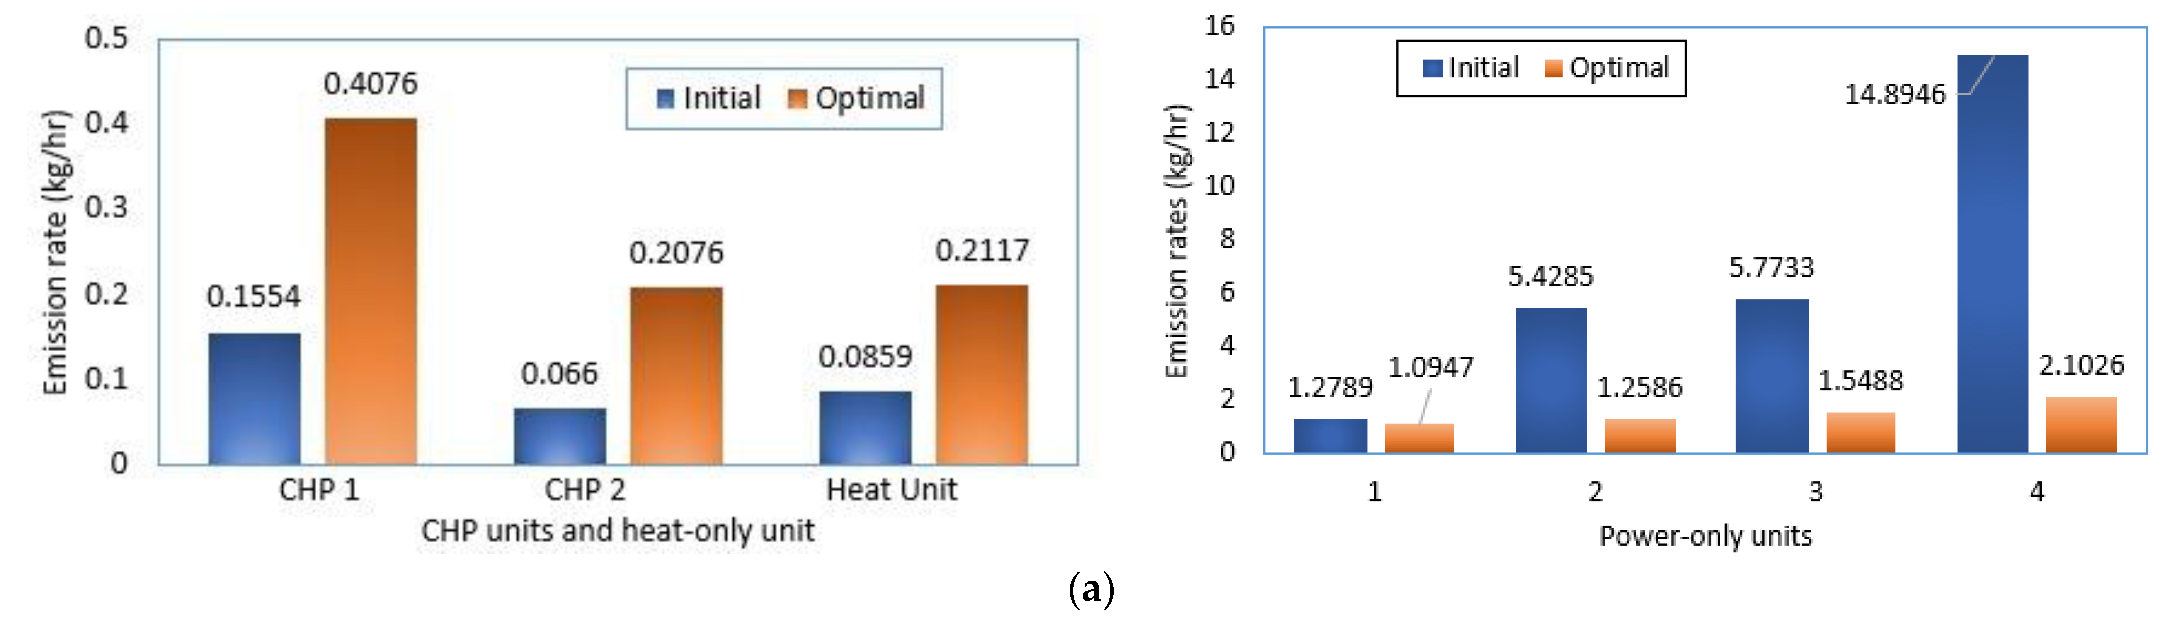
Table 8 illustrates the corresponding outcomes compared to the initial case, which was considered the operating point of the minimum fuel costs. From this table, it is clearly shown that the proposed HBOA achieved great improvement in the reduction of pollutant emissions in the whole system. For the first loading, the total pollutant emissions were reduced from 27.6826 to 6.8314 kg/h. For the second loading, the total pollutant emissions were reduced from 1.961 to 1.4501 kg/h. For the first loading, the total pollutant emissions were reduced from 15.5226 to 1.9818 kg/h. Consequently, the proposed HBOA reduced 75.32%, 26.053%, and 87.233% of the total pollutant emissions for the three loading levels, respectively, compared to the initial case.
Additionally,
Figure 10 displays the emission rates of all the units of Case 3 for the three loading levels. The proposed HBOA resulted in a large decrease in the environmental pollution related to the power-only units, especially for the first and third loading levels. This was due to the high participation value of these units inside the total objective function. On the other side, only the decrease in emissions was achieved for the first power-only unit in the second loading level. This was due to the small loading nature of this scenario, which required operating the second, third, and fourth power-only units at their minimum limit. On the contrary, for the CHP and heat-only units, there were increases in their outputs, especially for the first and third loading levels. This was due to the power compensation from the power-only units to the CHP and heat-only units with lower emission coefficients.
4.4. Implementation of Case 4
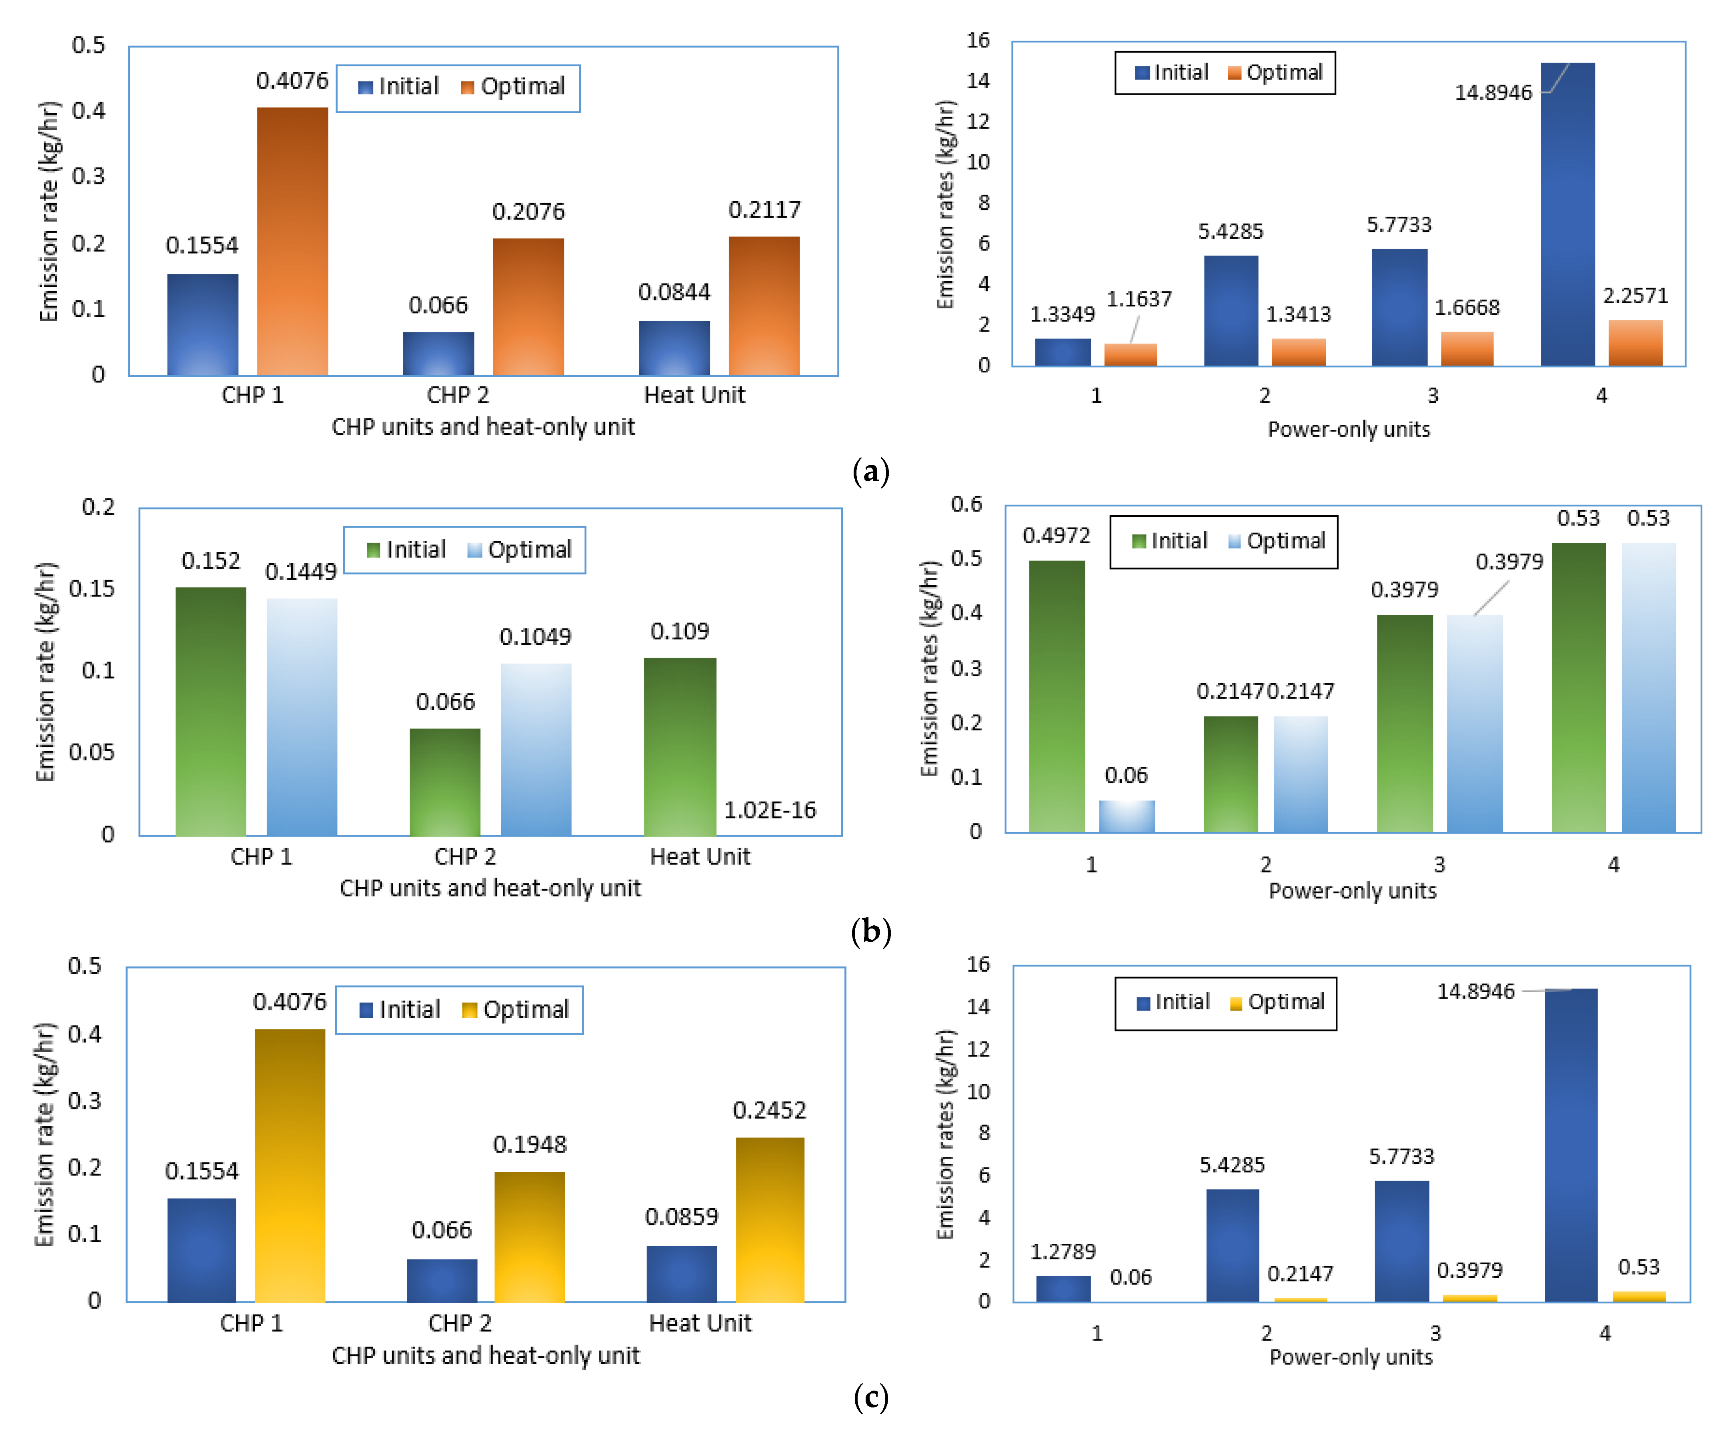
In this case, the minimization of pollutant environmental emissions was handled while the power losses through the system network were considered. For the three loading levels,
Table 9 illustrates the outcomes of the proposed HBOA compared with the initial case related to the minimum fuel costs’ operating points. From this table, it is clearly shown that the proposed HBOA achieved great improvement in the reduction of pollutant emissions in the whole system. It performed reductions of 73.841%, 26.155%, and 92.595% for the three loading levels, respectively, compared to the initial case. Additionally,
Figure 11 displays the emission rates of all the units of Case 4 for the three loading levels. The proposed HBOA resulted in large decreases in the environmental pollution related to the power-only units, especially for the first and third loading levels. Additionally, there were increases in their outputs, especially for the first and third loading levels for the CHP and heat-only units.
5. Conclusions
A novel honey badger optimization algorithm (HBOA) was proposed for solving the Economic Dispatch Model (EDM) integrating combined heat and power (CHP) units. This study minimized the total fuel costs and pollutant environmental emissions by managing the power-only, CHP, and heat-only units. The proposed HBOA was applied to the seven-unit test system with and without additional nonlinear constraints of the power losses. Multiple load levels with varying power and heat burdens were evaluated. Four instances were explored for every level of the loading, each with a distinct target task and power loss consideration. Several modern meta-heuristic optimization algorithms were employed, which included the African Vultures Algorithm, Dwarf Mongoose Optimization Algorithm, Coot Optimization Algorithm, and Beluga Whale Optimization Algorithm. The proposed HBOA outperformed the others in terms of minimizing the considered objective. The proposed HBOA was the best-performing algorithm, while the BWOA was the worst-performing algorithm. The suggested HBOA outperformed the others in reducing the total fuel costs with and without power losses. It also provided a higher speed in reaching the minimum objective. Moreover, the proposed HBOA achieved a high reduction in pollutant emissions with and without losses for the three loading levels. According to the numerical results, the suggested HBOA outperformed the others considering the fuel costs minimization objective. Moreover, considering the pollutant emissions minimization objective, the proposed HBOA achieved reductions, without losses considerations, of 75.32%, 26.05%, and 87.23% for the three loading levels, respectively, compared to the initial case. Similarly, it achieved reductions of 73.84%, 26.16%, and 92.59% for the three loading levels, respectively, compared to the initial case considering the power losses.
The main limitation of the proposed approach is its dependence on the number of individuals and the maximum number of iterations, especially in handling large-scale engineering optimization problems. In future work, the validation of the proposed approach will be investigated compared to other recent techniques in solving large-scale engineering optimization problems.


