Abstract
Since more than half of the crude oil is deposited in naturally fractured reservoirs, more research has been focused on characterizing and understanding the fracture impact on their production performance. Naturally open fractures are interpreted from Fullbore Formation Micro-Imaging (FMI) logs. According to the fracture aperture, they are classified as major, medium, minor and hairy fractures in decreasing order of their respective aperture size. Different fracture types were set up in this work as a Discrete Fracture Network (DFN) in synthetic models and a sector model from a highly naturally fractured carbonate reservoir. The field sector model includes four wells containing image logs from two wells and production data from two other wells. Numerous simulations were conducted to capture the contribution of fracture type on production performance. Primary recovery was used for synthetic and field sector models, while waterflooding and gas injection scenarios were considered just for the synthetic models. The results showed that the fracture type and its extent play an essential role in production for all studied models. The reservoir production capabilities might be underestimated by ignoring any fracture types present in the reservoir, especially the major ones. In the secondary recovery, fractures had different impacts. Better displacement and higher recovery were promoted for waterflooding, whereas faster breakthrough times were observed for the gas injection. The performance during gas injection was more dependent on fracture permeability changes than waterflooding. This study’s findings can help in better understanding the impact of the different types of fracture networks on oil recovery at the various production stages. Additionally, the history matching process can be improved by including all types of fractures in the dynamic model. Any simplification of the fracture types might end in overestimating or underestimating the oil recovery.
1. Introduction
Naturally fractured reservoirs (NFRs) hold substantial amounts of remaining crude oil reserves [1,2,3]. Characterizing and understanding the fractured reservoirs’ production mechanisms is vital in providing the future energy demand [4]. Important mechanisms such as imbibition and drainage can be reduced or enhanced due to the matrix-fracture systems. Many studies have been published regarding these effects [5,6]. Development strategies and the simulation of mechanisms and EOR screening involve special consideration for successfully studying fractured reservoirs—for example, Discrete Fracture Networks and dual-continuum modeling [7]. Additionally, studies such as carbon storage and oil production optimization have highlighted the requirement of realistic models for storage and hydrocarbon potential and field development plans for these reservoirs [8,9].
Open fractures in naturally fractured reservoirs can act as highly permeable channels embedded in the low-permeable matrix blocks. This creates a highly complex rock structure, leading to more complex fluid flow mechanisms than conventional reservoirs [10]. Predominantly, oil fills the matrix pores and fractures at the beginning of the production life cycle. The fracture oil is produced in the initial primary recovery, resulting in very high recovery peaks, which may decline rapidly [11]. Few studies have reported fracture effects on primary, secondary and tertiary production stages [12,13,14,15]. Fracture characteristics such as aperture size, height and spacing play an essential role in studying the effects of fracture networks on fluid flow in porous media [16]. When oil production declines, the secondary production stage starts in the form of water flooding. An increase in the water saturation in the fracture network can be observed. The water level rises through the fractures, but due to the gravity head and spontaneous imbibition, water starts encroaching into the matrix, slowly displacing the oil. Therefore, almost all of the oil comes from fracture networks before the breakthrough (B.T.). Hence, all fractures are filled with water after the breakthrough, and the produced oil results from the matrix [17].
On the other hand, one of the primary displacement mechanisms for injecting gas into NFRs is Gas-Assisted Gravity Drainage (GAGD). After the gas invasion, gas-filled fractures surround the oil-filled matrix blocks, and the gas can enter (gravity-driven) into the matrix, displacing the oil. In gas injection, fracture permeability is a key property for high oil recovery. When vertical fracture permeability is higher than horizontal fracture permeability, higher recovery can even be reached [18]. Gugle et al. (2022) studied the effect of fracture impact on the oil recovery for the gas-invaded zone in fractured reservoirs under secondary and tertiary recovery conditions [4]. The fracture network properties were reported to significantly affect the recovery in the two studied EOR processes: water-alternating gas injection [WAG] and foam-assisted water-alternating gas [FAWAG] injection. In huff and puff gas injection, fracture conductivity was less important than fracture spacing. In the case of fracture spacing, higher recoveries are reported in lower fracture spacings [19]. Another essential factor controlling gravity drainage during the gas injection is the vertical direction’s reservoir height (thickness). The reimbibition process In fractured rock was studied by Aghabarari and his colleagues by creating stacked matrix blocks in the vertical direction. The significance of re-imbibing from matrix to matrix, forced by the gravity drainage of gas, was confirmed for naturally fractured reservoirs [20].
Different types of fractures are present in the reservoirs, ranging from hairy to major, depending on their aperture. Limited work has been published regarding the different fracture network types in production; hence, this research aimed to investigate the impact of fracture types on oil recovery in naturally fractured reservoirs during the primary stage, gas and water injection.
2. Methodology
This work studied the effect of fracture networks on natural depletion and water/gas injection processes using commercial simulator software. Different models with increasing complexity were created, starting from two separate two-dimensional models (2D) in horizontal and vertical directions. Eventually, a cubic three-dimensional (3D) model was investigated, in which the characteristics of both 2D models were combined. Lastly, the learnings on the 3D primary recovery results were used to examine the effect of fracture flow on a field sector model referring to a giant oil field. The workflow of the conducted study is illustrated in Figure 1.
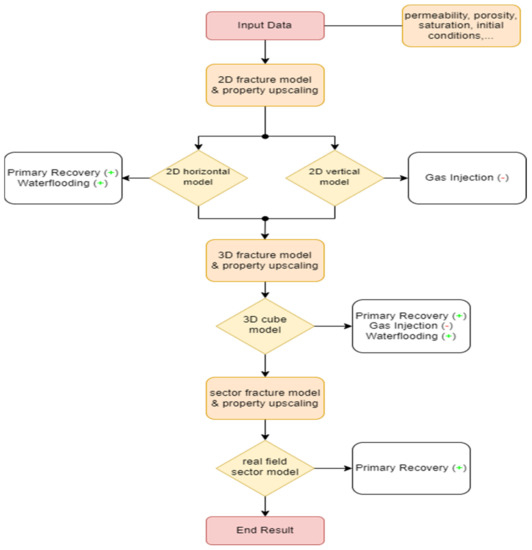
Figure 1.
Workflow through the different models and production regimes: 2D horizontal for primary recovery and waterflooding, 2D vertical for gas injection, 3D cube model for primary recovery, waterflooding and gas injection, sector model for primary recovery. The icon (+) refers to fractures enhancing the production, and (-) refers to fractures compromising the production.
Different fracture systems were studied in two- and three-dimensional models to simulate the impact of fractures on production. At first, the effect of fractures on primary production was studied; this was followed by simulating water and gas injection as primary production options. Finally, a field case sector model was built based on the different fracture sets in the field. The Formation Micro-Imaging (FMI) logs, fluid model, porosity, permeability, fluids in place, phase contacts, fracture data and production history were used for the sector model construction. The fracture orientation and properties were obtained from FMI logs, from which the DFN networks were built and used in the sector model. Fractures were classified based on the aperture of the open fractures, where four distinct fracture types were defined: major, medium, minor and hairline fractures. The highest and lowest apertures (permeability) are major and hairline, respectively.
The results of the sector model were verified by the construction of the synthetic reservoir models. The sector model was extracted from a field after the history matching. These synthetic models were created as 2D and 3D slices in the horizontal and vertical directions. The 3D cube model was then studied to verify the results of the sector model. The synthetic models use the same relative permeability functions and fluid model as the sector model, but they have simpler representations of fractures. The synthetic model features a deterministic distribution of the fractures in three types. The sector model has naturally dispersed and highly heterogeneously distributed fractures.
Figure 2 shows the synthetic 2D model with the deterministic fracture system. Three types of fractures were implemented, represented in three colors. The configuration of fractures is as follows: major, medium and minor open fractures are described in black (a), red (b) and green (c) colors, respectively. The 3D synthetic model generally uses the same fracture types with different fracture–fracture distances or fracture densities, which may be comparable in 2D and 3D. The 3D model contains six black (large) fractures (a) instead of four, six red fractures (medium) (b) instead of four and nine green fractures (minor) (c) instead of six.
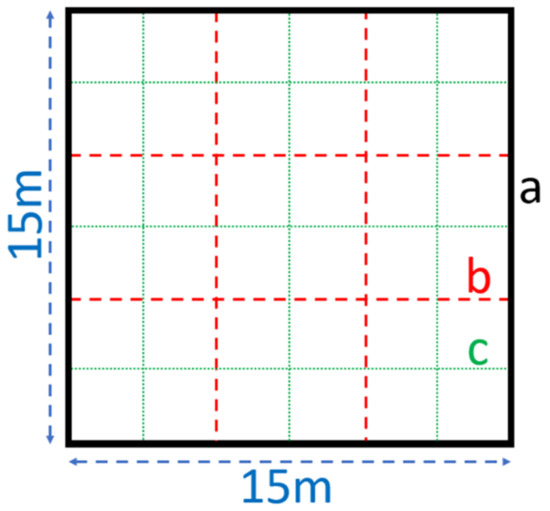
Figure 2.
Schematic of the deterministically distributed fractures model. (a) Major, (b) Medium, (c) Minor.
Table 1 shows the size of the 2D and 3D synthetic models. Three cases—namely, major fractures, major + medium fractures and major + medium + minor—were used to conduct the synthetic models’ simulations. A fair number of grid cells should be known to generate working simulation grids with symmetric matrix blocks between the fractures. This is important because the cell at the fracture location is taken as a dual-permeability cell, and other cells are considered matrix cells. Hence, the user must find a fitting number of cells to honor the symmetric matrix block size between fracture sets. For example, grid cells with 67 × 67 are taken with all fracture sets in the two-dimensional horizontal synthetic models, while the matrix block size between the fractures is 10 × 10 grid cells. When only major and medium fractures are considered, the matrix blocks are represented symmetrically by 21 × 21 grid cells for the same model.

Table 1.
Synthetic model dimensions.
Rock Physics and Fluid Model
The rock properties used in all synthetic models are presented in Table 2. The matrix properties are assumed constant throughout all synthetic models. A different matrix permeability at the low-Darcy scale was used to capture the fracture’s contribution for the primary recovery case. For the sector model, matrix properties are not constant as obtained through log data from the field. The fractures are first introduced as geometrical planes in space and are then combined into three separate DFNs:
- Major fracture DFN
- Major and medium fracture DFN
- Major, medium and minor fracture DFN
After property upscaling, fracture permeability, porosity and shape factor values are used.
Table 2.
Rock properties for the 2D and 3D synthetic models.
Table 2.
Rock properties for the 2D and 3D synthetic models.
| Property & Units | Value |
|---|---|
| Matrix porosity, fraction | 0.20 |
| Matrix permeability, mD | 1.00 |
| Major fracture porosity, fraction | 0.45 |
| Medium fracture porosity, fraction | 0.22 |
| Minor fracture porosity, fraction | 0.04 |
| Major fracture permeability, Darcy | 4.5 |
| Medium fracture permeability, Darcy | 1.10 |
| Minor fracture permeability, Darcy | 0.044 |
| Shape factor sigma, 1/m2 | 80 |
In this work, the black oil fluid (live oil), based on field data, was used for the designed reservoir models in almost all simulation cases. A different fluid model was used in the primary production cases as the only exception. Because of the fast pressure drop during primary production, a synthetic dead oil fluid model was used to handle convergence issues. The dead fluid model consists of water and oil, whereas the field fluid model includes dissolved gas in addition to water and oil phases. The densities of all phases for the live and dead oil are given in Table 3. All synthetic models considered the upper reservoir edge at 1000 m TVD. The initial reservoir pressure was set to 250 bar. The upper edge in the sector model is set at a depth of 6200 ft, with an initial pressure of 3630 psi.
Table 3.
Fluid model properties.
For describing multi-phase flow effects, eight relative permeability saturation functions were used for the matrix in the sector model—four for the drainage and four for the imbibition processes. The relative permeability in the synthetic models was simplified, because only one representative relative permeability function (Figure 3) was chosen for all the available permeability functions of the sector model. For the fracture relative permeability curves, straight lines with zero capillary pressure in the fractures were assumed. The fractures in the synthetic model use the same relative permeability function as those in the sector model.
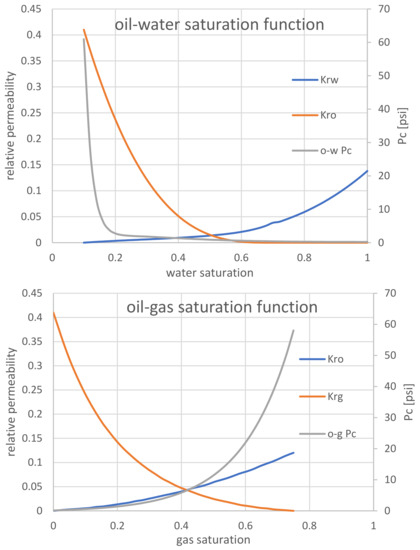
Figure 3.
Relative permeability curves for the synthetic models.
3. Results & Discussion
This section is organized based on production regimes. First, the primary recovery was studied in 2D and 3D synthetic models, followed by secondary production by water injection and gas injection. Then, the results of the sector model are presented and discussed for primary recovery considering real field data.
3.1. Primary Recovery
The primary recovery was investigated in both synthetic models (2D and 3D) and the sector model. The single producer, well under pressure control, allows for setting up a specific pressure limit above the bubble point pressure and capturing the reservoir’s potential without adjusting any rates manually. No additional pressure support was applied in the synthetic models.
Figure 4 illustrates the 2D horizontal model with embedded fractures and wells. This model was used mainly as a base model to test the fractures’ impact on oil production. Fluid flow and pressure changes are only possible inside the model restrictions because a no-flow boundary is applied to prevent exchanges with the surrounding environment.

Figure 4.
2D horizontal slice with major, medium, and minor fractures; blue dot: producer well; red dot: injector for secondary waterflooding.
The vertical production well (blue dot in Figure 4) has a bottom hole pressure limit of 10 bar and directly contacts the major fractures. The results are based on this fact; different behavior would be expected if the well was not in direct contact with the fracture network.
Figure 5 and Figure 6 represent the influence of each fracture type on production performance. In Figure 4, and throughout a large portion of this work, curves in plots are named after the fracture types: MajFr stands for major fractures, MajMedFr stands for major + medium fractures and MajMedMinFr stands for major + medium + minor fractures. Matrix permeability at the low-Darcy scale was chosen for the primary recovery, which is why extremely low recoveries were produced. Nevertheless, fractures show a positive effect on recovery. As anticipated, the pressure drops faster when more fractures are introduced and more are produced in the reservoir model. Obviously, fractures enhance production significantly. The relative difference can be obtained by comparing the endpoints of two recovery curves and creating a ratio. For example, by comparing the MajMedFr curve (Rf,end,MajMed = 0.01976) and MajFr curve (Rf,end,Maj = 0.01151) with the relation 1 − (Rf,end,Maj/Rf,end,MajMed) an increase of 42% can be observed. An additional increase of 13% in oil recovery might be observed if all fractures are considered compared to only major and medium fractures. This indicates that medium fractures comprehend more oil production than minor fractures.
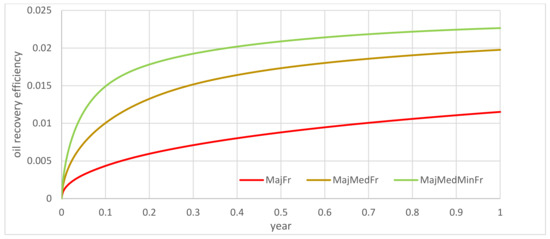
Figure 5.
Primary production for all fracture types in the 2D horizontal slice.
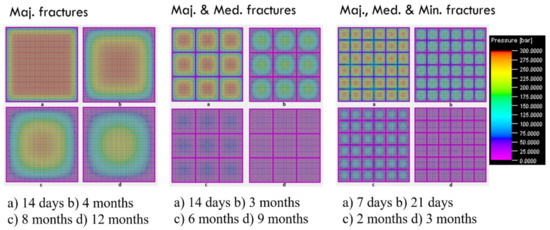
Figure 6.
Pressure distribution in the 2D horizontal slice during primary production for different fracture sets: major fractures on the left, major and medium fractures in the middle and medium and minor fractures on the right.
Interestingly, although the single producer is placed only in one corner, the pressure distribution in Figure 6 is symmetrical, as the fractures are much more permeable than the matrix. This allows the pressure to drop symmetrically around the matrix block, where it contacts the fractures. The considerable gap in permeability between the fracture and matrix domain is necessary to capture the fracture’s contribution to primary production, at least for such small-scale models.
Similar findings in the 3D cube model, as illustrated in Figure 7, are observed. The contribution of each fracture type is very similar to the 2D slice. As can be seen, the lowest recovery efficiency was achieved with the major fractures. Again, by comparing the endpoints of the recovery curves, the relative contribution of every fracture type was estimated. An increase of 32% can be observed compared to major fractures alone. The increase in oil recovery depends on which fracture type is added to the major fractures. The relative increase is smaller when medium and minor fractures are added to the major ones, increasing by around 40% compared to the only major fracture case. In other words, MajMedFr produced 32% more than MajFr, but MajMedMinFr had 40% more than MajFr, meaning that the minor fractures contributed less than the medium fractures to the ultimate oil recovery.
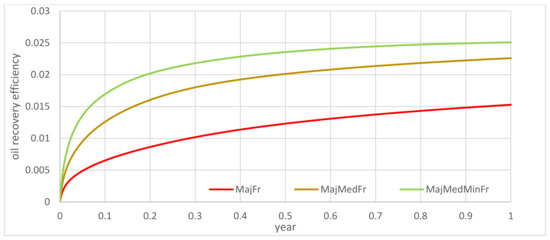
Figure 7.
Recovery efficiency under primary production for all three fracture sets in the 3D cube.
The pressure distribution shows the same trend for the 2D horizontal model. Faster pressure drops were observed when more fractures were included. In general, the third dimension did not offer new or additional effects in the primary recovery; instead, the same findings as in the 2D model were observed.
Fractures improve the 2D and 3D performance regarding natural depletion without any pressure support. The case with major, medium and minor fractures performed 40% better than the major fractures only. Fractures support the depletion of the reservoir more efficiently, resulting in higher pressure drops and faster declines. Less oil recovery was observed if no fractures were included in the 2D models. The relative influence of each fracture type on production corresponds to their permeability (aperture size).
3.2. Secondary Recovery by Waterflooding
Waterflooding was first studied in the 2D horizontal model. Water is injected with a constant rate of 0.24 m3/day, which equals approximately two pore volumes in one year. Secondary recovery by waterflooding is conducted under initial conditions and not after the primary production.
As shown in Figure 8, the trend is more complex than primary recovery. Two trends appear; the oil is displaced in the fractures, and then the oil starts to be drained from the matrix. Further investigation is needed to confirm this with the 3D model. The second observation shows that the fracture network impacts recovery in the early period. Almost all of the fracture networks performed similarly, but the major fracture network alone performed the worst at later times. The initial equal production between the three cases is as expected because the volume of oil initially in the fractures is minimal compared to the total pore volume. Hence, the displacement of this oil in the fractures is almost equal for all three cases. When the minor fracture was added to the major + medium case, a slight difference was observed in the recovery, indicating the nonimpact minor fractures in the studied case.
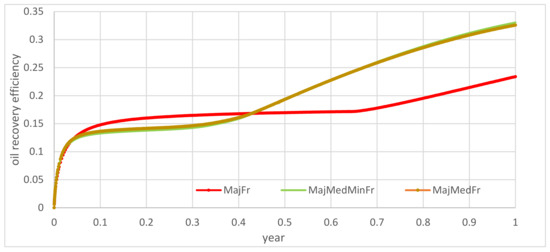
Figure 8.
Oil recovery efficiency during water flooding in the 2D horizontal slice.
Regarding the pressure response, as shown in Figure 9, severe decline at early times is related to the fast production from fractures. Subsequently, the pressure remains constant, representing a matrix-governed flow behavior.
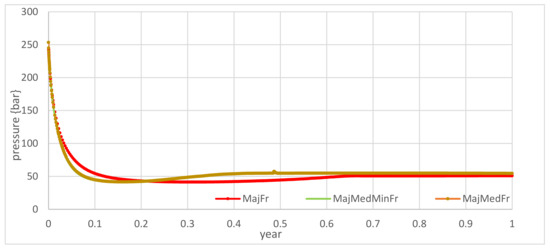
Figure 9.
Pressure curve in the 2D horizontal model during waterflooding.
The waterflooding case was conducted using vertical injectors and producer wells in the 3D synthetic model. Water was injected with a rate of 0.246 m3/day throughout 15 years, which approximates two pore volumes, and a pressure limit of 245 bar constraints the producer.
The main observation from Figure 10 is that the oil recovery curve is similar to the 2D slice model. The MajMedMinFr case performed best, although the difference between the MajMedMinFr and MajMedFr cases is relatively small. This indicates that minor fractures do not affect oil production to a large extent. By comparing the ultimate recovery endpoints, it was estimated that the MajMedFr case produced around 10% more oil than the case with major fractures alone (10% = 1 − RfMajFr/RfMajMedFr). Once the minor fractures are included, an additional increase in production is observed. By comparing the recovery curves again, the MajMedMinFr case produced 4% more than the MajMedFr case. These results were obtained with two pore volumes of water injected over 15 years, and the pressure was maintained to be constant. The waterflooding cases show more sensitivity to very high drawdown pressures. For example, to honor the two-pore volumes injected, the same simulation cases were run for two years but with higher injection rates. The results disclosed increased drawdown pressure by reducing the bottom hole pressure limit to 100 bar. The high drawdown pressure resulted in high production rates, which enhanced the fast depletion of fractures. This allowed for distinguishing two periods in the oil recovery curve, as was observed in the 2D horizontal slice during waterflooding. The first period initially involves a sharp increase in oil production, approaching a plateau due to oil displacement in the fractures by water. Subsequently, most recovery initiates from the imbibition of water into the matrix, driving the oil from the matrix to the fractures. Another observation is that the imbibition is dependent on the fracture types. As can be seen from Figure 8, when more fractures are included, the plateau starts and ends earlier, indicating an easy oil displacement from the matrix to the fractures. In Figure 10, the plateau is not visible anymore. Still, the bend in the recovery curves (approximately 1.5 years of production for all curves) eventually indicates that the fracture types impact the oil displacement. According to that, the MajFr case performed the least efficiently. Similar to the observations discussed for the 2D model, adding fractures to the major ones increases recovery. The major + medium fracture (MajMedFr) case resulted in 10% more oil than the major fractures alone. The minor fractures contribute significantly less to the production than the medium fractures. Less than 1% higher ultimate recovery can be reached in the MajMedMinFr case compared to the MajMedFr case.
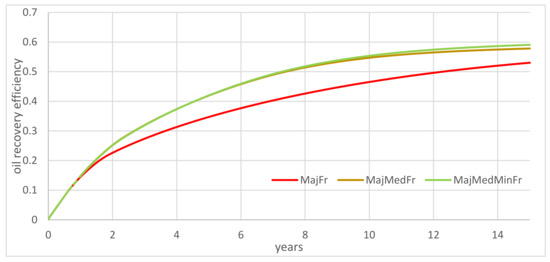
Figure 10.
Waterflooding recovery in the 3D cube.
Moreover, the contribution of the fractures in oil production is independent of the drawdown pressure. In other words, the contribution of the different fracture sets compared to each other remained constant even though the drawdown pressure changed. However, the runs with two pore volumes over 15 years of injection are more realistic for further study. Their drawdown is expected to be more reasonable for sensitivity studies (Figure 10).
Figure 11 shows the water saturation for the three waterflooding cases with reasonable drawdown (2 P.V. injected over 15 years). The slices are taken from a middle layer of the synthetic 3D model after different time steps. In the vertical slice, the flow direction is from left to right. The waterfront encroaches into the matrix blocks as the colors represent the saturation scale. When more fractures are introduced, the water principally utilizes the fractures for more efficient oil displacement. In the case with all fractures included, some oil is left in the fractures even after 13 years. The imbibition of water into the matrix and the following oil transport into the fracture are especially visible at later time steps of the major, medium and minor fracture cases.
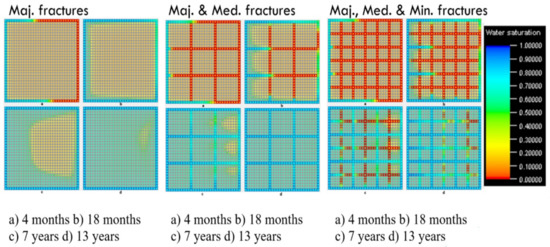
Figure 11.
Water saturation distribution during water flooding in the 3D cube model for different sets of fractures applied: major fractures on the left, major and medium fractures in the middle and major, medium and minor fractures on the right side.
In this work, fractures showed positive effects in the case of water flooding. Better performance was observed when more fractures were used in the DFN construction. The water injection utilizes all fractures for the oil displacement; hence, excluding some might result in a lower recovery. Ignoring fractures or their permeability, underestimating their number would lead to underestimating the model’s potential. Fractures help distribute the water in the domain, allowing for more effective oil displacement from the matrix. The water imbibition is a time-dependent process that determines oil delivery to the fracture system, where it can be produced. If fractures are depleted quickly, a plateau in production is reached, with water imbibition being the critical time process at a later stage.
3.3. Secondary Recovery by Gas Injection
A vertical 2D model was used for the gas injection since gravitational effects are expected. The same properties were assigned for the 2D horizontal model but in a vertical orientation to enable gravity-related mechanisms. As can be seen in Figure 12, two horizontal wells are placed into the model for better observation of gravity-related mechanisms. The two horizontal wells are perforated over the whole length and directly contact the fracture system.
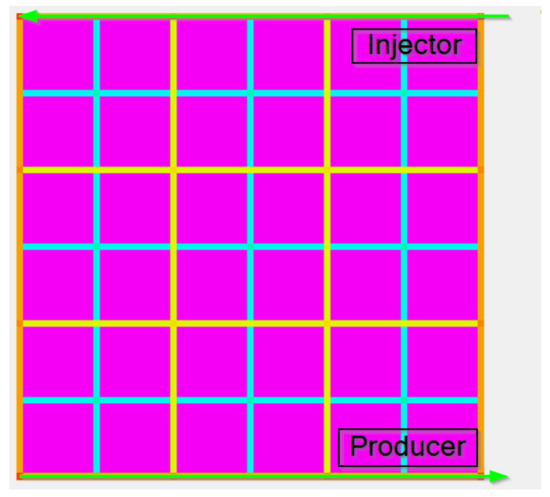
Figure 12.
Horizontal wells for secondary production by gas injection.
The simulation results for vertical and horizontal wells were obtained under the assumption of immiscible gas injection. The gas injection takes place with 0.05 m3/day under reservoir conditions, irrespective of whether vertical or horizontal wells are used. For five years, two-pore volumes of gas were injected (Figure 13). Horizontal wells perform better than vertical wells, which is mostly related to enhanced gravity effects. Thus, horizontal wells are implemented in the 3D model for future studies. Moreover, the results show the inverse trend for the fracturing effect. Due to the matrix height reduction when more fractures are included in the model, simulation cases with only major fractures perform better than other cases (major + medium or major + medium + minor fractures system).
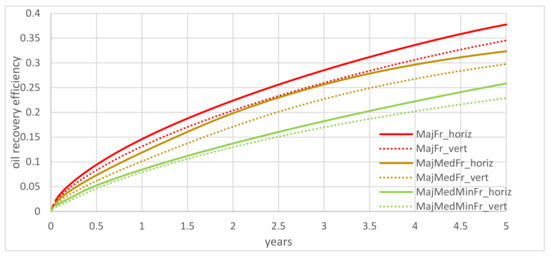
Figure 13.
Oil recovery performance of the gas injection in the 2D vertical model.
A model with a doubled size in vertical length was created to study the gravity-related effects. This extended 2D vertical slice model resembles the standard 2D vertical but with a doubled height. The larger height case validates that the 2D vertical slice results are not due to the limited size or gravitational effects. However, the same results were observed in the 2D and extended 2D vertical models. This is why it was concluded that the gas injection process could be studied in the 3D model without changing its size.
Based on the 3D model results, the opposite order is observed for the three cases compared to the primary production. The maximum oil recovery is attained in the major fracture type case, which might be related to the matrix block height. The smaller the matrix blocks, the more the continuity of the oil in the vertical direction is disrupted, leading to less effective gravity drainage. Additionally, smaller matrix blocks are estimated to feature a higher capillary pressure threshold, acting as a barrier to gravity drainage. One grid block is expelling the non-wetting phase (oil), which must enter the next grid block—for this, it needs to overcome the capillary entry pressure from the fracture to the matrix, which works with a high gravity head. This conclusion is based on results obtained with different vertical matrix block sizes. As can be seen from Figure 14, larger matrix block sizes resulted in higher recoveries. However, when minor or medium fracture types are added to the model, the matrix block sizes decrease, decreasing the recovery efficiency. Larger matrix block sizes permit the smoother displacement of oil by gas. The fracture type and matrix dimensions of the studied cases are given in Table 4.
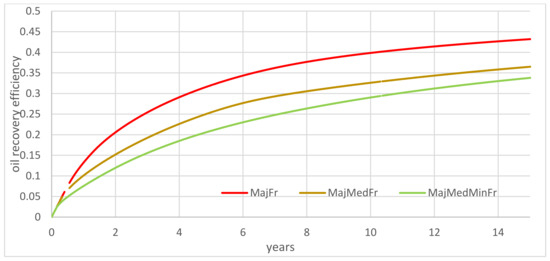
Figure 14.
Oil recovery efficiency during gas injection in the 3D model.
Table 4.
Matrix block dimension of different fracture sets.
The gas saturation profile for three cases is shown in Figure 15. The gravity-driven encroachment of injected gas can be observed in all cases. The most efficient displacement occurs in the case of major fractures, as gravity drainage can occur most effectively. The snapshots are taken perpendicular to the horizontal wells from the central section of the cube. Fractures in Figure 15 tend to be dominated by red colors, indicating high gas saturation and that gas breakthrough occurs at very early stages. The injected gas flows through the fractures, bypassing the majority of oil in the matrix since there is not enough time for the gas to encroach the matrix and displace the oil.
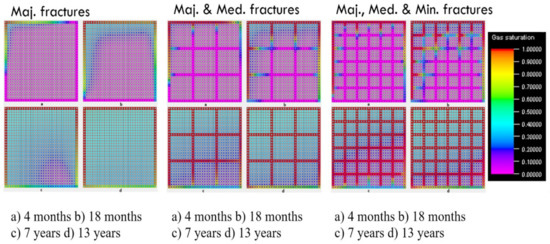
Figure 15.
Gas saturation distribution in the 3D cube model during gas injection for different sets of fractures applied: major fractures on the left, major and medium fractures in the middle and major, medium and minor fractures on the right side.
The gas injection in 3D domains appears very sensitive to early breakthrough. Therefore, oil recovery might be affected by the fracture types and their extent. The results show that the injected gas flows through the fractures and hardly enters the matrix surrounded by highly permeable fractures. When different fracture types are combined—for instance, major, medium and minor fractures—the performance is still retarded, because it seems that the gas did not have enough time to enter the matrix and displace the oil. A smaller number of fractures, in combination with matrix-fracture permeabilities of approximately the same order, resulted in the most effective displacement. The observed effects might be related to the height of the matrix block. The gravity drainage mechanism activates gas rushes through the fractures and surrounds the matrix block, and a higher recovery results from more prominent gravity drainage with larger matrix block sizes. With fractures being introduced, matrix blocks are parted into smaller elements, and the continuity of the oil in the matrix is broken, mitigating gravity drainage effects. Additionally, higher capillary pressure thresholds in smaller matrix blocks act as a barrier for the injected gas to enter the matrix and displace the oil.
3.4. Sector Model
The sector model is from a highly heterogeneous, naturally fractured carbonate reservoir. Natural fractures are due to tectonic stresses and can be oriented vertically and horizontally. Horizontal ones are less often observed than vertical fractures. High overburden stress seals the horizontal fractures in many places if no propping agent can keep them open. Regardless, both can be recorded and measured by formation image logs. First and foremost, open fractures can be distinguished from closed or filled fractures. In this simulation study, the closed or sealed fractures are considered the matrix, and only the open fractures are classified into specific fracture groups.
Open fractures might have positive and negative impacts on oil production. Fractures benefit production by generating high permeable paths through the reservoir and promoting early breakthrough or coning effects [21]. Figure 16 illustrates the shape of the sector model. Four wells are realized; well #1 and #2 are production wells, whereas well #3 and #4 are data acquisition wells for the FMI logs.
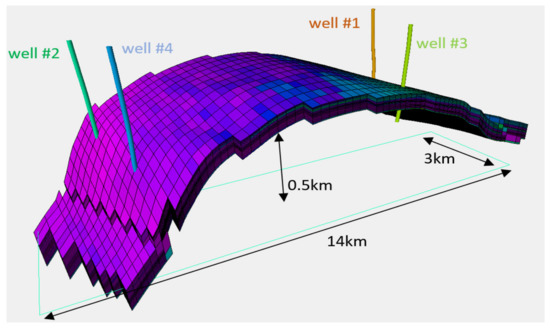
Figure 16.
The anticline-shaped sector model with four existing wells. The sector model is part of a giant carbonate field.
Once open fractures are interpreted and verified (e.g., image logs, mud loss data, resistivity logs, core analysis, seismic interpretation), they are classified into subgroups. The studied field had too many interpreted open fracture types; however, only four fracture categories for the simulation work were defined based on the fracture’s aperture due to the objectives of this work. The classified fracture types include major, medium, minor and hairline fractures. The average aperture size and permeability of these fractures are given in Table 5. All other closed fracture types were not considered because of their minimal impact on production.
Table 5.
Fracture types and their properties.
As part of the studied field, the sector model uses the fluid model and SCAL data assigned to the sector of interest. The objective is to study and examine the contribution of four different fracture types. The available historical production and pressure data are used as a reference line for a better visual assessment of the results.
In the sector, no injection wells exist, so the results obtained were only valid for primary recovery. Figure 17 shows the oil production of producer well #01 from the sector model with different fracture type combinations. The red dots represent the observed data from the well in this period, whereas the curves are simulation results. As expected from the studies with the synthetic models, higher production and a good match are achieved when all fractures are included. The cases with all four fractures and those with major, medium and minor fractures overlap. However, the impact of the minor fractures is noteworthy compared to the hairline fractures but not as high as the influence of the medium fractures. Although the trend might be coherent with the observed production data, the decline of the curves is prominent. This is expected because the sector model represents only a fraction of the field.
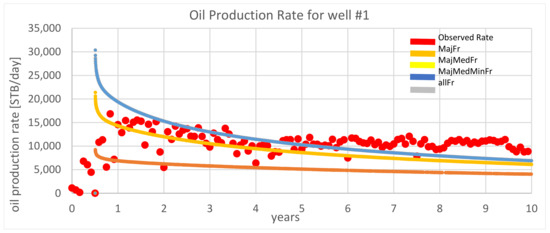
Figure 17.
Oil production rates for well #01 in the sector model under natural depletion.
A similar trend for the pressure curves is shown in Figure 18. Again, hairline fractures do not contribute, and the blue curve overlaps the grey curve. The same results were obtained for the second producer (well #2), demonstrating the significance of fracture types in the studied field.
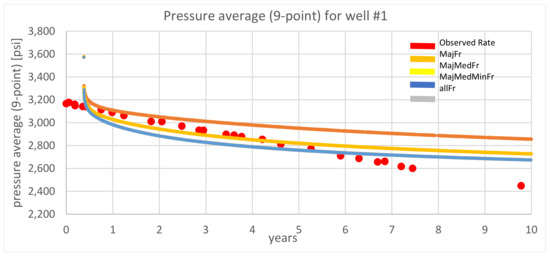
Figure 18.
Pressure profile for well #1 in the sector model under natural depletion.
In the sector model, fractures were also vital elements in oil production. When all fractures are included, the trend better represents the observed production data. Removing fracture types from simulation cases resulted in lower production that does not describe the observed data precisely. The influence of each fracture type during the sector model’s primary production corresponds to the synthetic models’ findings. Hairline fractures barely contributed to the production, whereas the major fractures contributed the most, followed by medium and minor fractures. As seen from the production and pressure profiles, there is no difference between all four fracture type cases and those without hairline fractures.
Fractured reservoirs are treated as non-fractured reservoirs during primary production; even though they are fractured, they are overestimated according to the observed effects of this work. In fractured reservoirs with matrix permeability, the matrix alone cannot supply the observed production without the transport capabilities of the fractures. The determination and validation of the existing open fractures play a key role in optimally understanding and producing a given reservoir. As was observed in this study, not all fractures contribute equally to oil production. The identification and classification of open fractures based on their aperture can provide a better understanding of fracture contribution not only in the primary production but also in the gas injection and water flooding due to the different related production mechanisms.
4. Conclusions
Based on the results of the fracture and matrix properties used in this study for the different constructed models, the following conclusions can be outlined:
- Primary production in the synthetic models depends on the permeability difference between the fracture and matrix. The contribution of fractures is more pronounced when the permeability ratio is in the order of 107. If the permeability contrast is not large enough, all synthetic cases, which are very restricted in terms of the size and number of fractures, deliver the same oil recovery, and no additional contribution of fractures can be observed. Nevertheless, fractures positively affected oil production during primary recovery, resulting in smooth pressure distribution and depletion. For larger models with stochastically distributed fractures, such as the sector model, the permeability contrast between the fracture and matrix is 10-103. It is enough to capture the contribution of fracture types to oil production because historical production can be used as a reference.
- Major fractures were found to contribute the most to the production in the sector model, followed by medium and minor fractures. No contribution of the hairline fractures is found, indicating that hairy fractures have no impact on the primary recovery. The history matching process can be improved by including all types of fractures in the dynamic model. Any simplification of the fracture types might end in overestimating the oil recovery.
- Water injection benefited from the given fracture networks in this work. The capillary imbibition of water into the matrix drained the oil into the fractures, allowing for transport towards the producer. High injection rates delay the imbibition process, with a plateau in recovery during production.
- Significant contributions were observed for major and medium fractures, and major fractures contribute more to oil production than medium fractures. The most negligible contribution is detected for the minor fractures, which hardly impact the ultimate recovery efficiency.
- If high injection rates were applied, the gas injection process was prone to an early breakthrough, in which fractures negatively affect oil recovery.
- Gravity drainage is a slow process that benefits from large matrix blocks apart from low injection rates. The case with only major fractures showed the highest recovery due to larger matrix sizes. Therefore, efficient gas injection is expected with low permeable fractures and larger matrix sizes.
Author Contributions
Conceptualization, R.K.; Formal analysis, M.P. and R.K.; Investigation, M.P.; Methodology, R.K., A.K. and S.A.; Software, M.P., A.K. and S.A.; Supervision, R.K. and H.O.; Writing—review & editing, M.P., R.K., H.O., A.K. and S.A. All authors have read and agreed to the published version of the manuscript.
Funding
This research received no external funding.
Institutional Review Board Statement
Not applicable.
Informed Consent Statement
Not applicable.
Data Availability Statement
Not applicable.
Conflicts of Interest
The authors declare no conflict of interest.
Nomenclature
| m | Meter |
| ft | Foot |
| psi | Pounds per square inch |
| mD | Millidarcy |
| µm | 10−6 m |
| Kro | Oil relative permeability |
| Krw | Water relative permeability |
| P.C. | Capillary pressure (psi) |
| allFr | All fractures |
| DFN | Discrete Fracture Network |
| EOR | Enhance Oil Recovery |
| FAWAG | Foam-Assisted Water-Alternating Gas |
| FMI | Formation Micro-Imaging |
| GAGD | Gas-Assisted Gravity Drainage |
| MajFr | major fractures |
| MajMedFr | major + medium fractures |
| MajMedMinFr | major + medium + minor fractures |
| NFR | Naturally Fractured Reservoir |
| P.V | Pore volume |
| R.F. | Recovery factor |
| STB/day | Standard barrels per day |
| WAG | Water-Alternating Gas Injection |
| TVD | true vertical depth |
References
- Saidi, A.M. Reservoir Engineering of Fractured Reservoirs (Fundamental and Practical Aspects); TOTAL Edition Presse: Paris, France, 1987. [Google Scholar]
- Spence, G.H.; Couples, G.D.; Bevan, T.G.; Aguilera, R.; Cosgrove, J.W.; Daniel, J.M.; Redfern, J. Advances in the study of naturally fractured hydrocarbon reservoirs: A broad, integrated interdisciplinary applied topic. Geol. Soc. Lond. Spec. Publ. 2014, 374, 1–22. [Google Scholar] [CrossRef]
- Kharrat, R.; Zallaghi, M.; Ott, H. Performance Quantification of Enhanced Oil Recovery Methods in Fractured Reservoirs. Energies 2021, 14, 4739. [Google Scholar] [CrossRef]
- Gugl, R.; Kharrat, R.; Shariat, A.; Ott, H. Evaluation of Gas based EOR Methods in Gas Invaded Zones of Fractured Carbonate Reservoir. Energies 2022, 15, 4921. [Google Scholar] [CrossRef]
- Firoozabadi, A. Recovery Mechanisms in Fractured Reservoirs and Field Performance. J. Can. Pet. Technol. 2000, 39, 13–17. [Google Scholar] [CrossRef]
- Kovscek, A.; Zhou, D.; Jia, L.; Kamath, J. Scaling of counter-current imbibition processes in low-permeability porous media. J. Pet. Sci. Eng. 2001, 33, 61–74. [Google Scholar]
- Torres, F.; Xavier, M.; Ailin, J.; Yu, W.; Yunsheng, W.; Junlei, W.; Xie, H.; Li, N.; Miao, J. Comparison of Dual Porosity Dual Permeability with Embedded Discrete Fracture Model for Simulation Fluid Flow in Naturally Fractured Reservoirs. In Proceedings of the 54th U.S. Rock Mechanics/Geomechanics Symposium, Virtual Conference, 28 June–1 July 2020. ARMA-2020-1462. [Google Scholar]
- Thanh, H.V.; Sugai, Y.; Nguele, R.; Sasaki, K. Integrated workflow in 3D geological model construction for evaluation of CO2 storage capacity of a fractured basement reservoir in Cuu Long Basin, Vietnam. Int. J. Greenhouse Gas Control. 2019, 90, 102826. [Google Scholar] [CrossRef]
- Ba, T.N.; Thanh, H.V.; Sugai, Y.; Sasaki, K.; Nguele, R.; Quang, T.P.H.; Bao, M.L.; Hai, N.L.N. Applying the hydrodynamic model to optimize the production. J. Pet. Explor. Prod. Technol. 2020, 10, 31–46. [Google Scholar]
- Litvak, B.; Satter, A.; Etebar, S. An Analysis of Naturally Fractured Reservoir Performance Using a Novel Fractured Reservoir Simulator. In Proceedings of the International Meeting on Petroleum Engineering, Tianjin, China, 1–4 November 1988; SPE-17615-MS. p. 10. [Google Scholar]
- Kleppe, J.; Morse, R. Oil Production from fractured Reservoirs by Water Displacement. In Proceedings of the Fall Meeting of the Society of Petroleum Engineers of AIME, Houston, TX, 6–9 October 1974; SPE-5084-MS. p. 20. [Google Scholar]
- Bahrami, H.; Rezaee, R.; Hossain, M. Characterizing natural fractures in tight gas reservoirs. J. Pet. Explor. Prod. Technol. 2012, 2, 107–115. [Google Scholar] [CrossRef]
- Doe, T.; Lacazette, A.; Dershowitz, W.; Knitter, C. Evaluating the Effect of Natural Fractures on Production from Hydraulically Fractured Wells Using Discrete Fracture Network Models. In Proceedings of the SPE/AAPG/SEG Unconventional Resources Technology Conference, Denver, CO, USA, 12–14 August 2013; URTEC-1581931-MS. p. 10. [Google Scholar]
- Gong, J.; Rossen, W. Characteristic fracture spacing in primary and secondary recovery for naturally fractured reservoirs. Fuel 2018, 223, 470–485. [Google Scholar] [CrossRef]
- Wei, Y.; Xiaohu, H.; Malin, L.; Weihong, W. Investigation of the Effect of Natural Fractures on Multiple Shale-Gas Well Performance Using Non-Intrusive EDFM Technology. Energies 2019, 12, 16. [Google Scholar] [CrossRef]
- Gong, J.; Rossen, W. Shape factor for dual-permeability fractured reservoir simulation: Effect of non-uniform flow in 2D fracture network. Fuel 2016, 184, 81–88. [Google Scholar] [CrossRef]
- Rezaveisi, M.; Ayatollahi, S.; Rostam, B. Experimental Investigation of Matrix Wettability Effects on Water Imbibition in Fractured Artificial Porous Media. J. Pet. Sci. 2012, 86, 165–171. [Google Scholar] [CrossRef]
- Silva, R.; Maini, B. Evaluation of Gas-Assisted Gravity Drainage GAGD in Naturally Fractured Reservoirs NFR. In Proceedings of the SPE Improved Oil Recovery Conference, Tulsa, OK, USA, 11–13 April 2016; SPE-179585-MS. p. 17. [Google Scholar]
- Wan, T.; Sheng, J.; Soliman, M.; Zhang, Y. Effect of Fracture Characteristics on Behavior of Fractured Shale-Oil Reservoirs by Cyclic Gas Injection. SPE Res. Eval. Eng. 2016, 19, 350–355. [Google Scholar] [CrossRef]
- Aghabarari, A.; Ghaedi, M.; Riazi, M. Prediction of oil recovery in naturally fractured reservoirs subjected to reinfiltration during gravity drainage using a new scaling equation. Pet. Explor. Development 2020, 47, 1307–1315. [Google Scholar] [CrossRef]
- Milos, P. Mechanistic Study of Fracture Types Effect on Oil Production. Master’s Thesis, Chair of Reservoir Engineering Montanuniversitat, Leoben, Austria, 2021. [Google Scholar]


Publisher’s Note: MDPI stays neutral with regard to jurisdictional claims in published maps and institutional affiliations. |
© 2022 by the authors. Licensee MDPI, Basel, Switzerland. This article is an open access article distributed under the terms and conditions of the Creative Commons Attribution (CC BY) license (https://creativecommons.org/licenses/by/4.0/).