Article

Transition to Renewable Energy for Communities: Energy Storage Requirements and Dissipation

by
Efstathios E. Michaelides
Department of Engineering, TCU, Fort Worth, TX 76129, USA
Energies 2022, 15(16), 5896; https://doi.org/10.3390/en15165896
Submission received: 4 August 2022 / Revised: 11 August 2022 / Accepted: 12 August 2022 / Published: 14 August 2022

Abstract

:
The transition of residential communities to renewable energy sources is one of the first steps for the decarbonization of the energy sector, the reduction of CO2 emissions, and the mitigation of global climate change. This study provides information for the development of a microgrid, supplied by wind and solar energy, which meets the hourly energy demand of a community of 10,000 houses in the North Texas region; hydrogen is used as the energy storage medium. The results are presented for two cases: (a) when the renewable energy sources supply only the electricity demand of the community, and (b) when these sources provide the electricity as well as the heating needs (for space heating and hot water) of the community. The results show that such a community can be decarbonized with combinations of wind and solar installations. The energy storage requirements are between 2.7 m3 per household and 2.2 m3 per household. There is significant dissipation in the storage–regeneration processes—close to 30% of the current annual electricity demand. The entire decarbonization (electricity and heat) of this community will result in approximately 87,500 tons of CO2 emissions avoidance.

1. Introduction

Since the beginning of the Industrial Revolution, the mechanization of industry with thermal engines, the generation of electric power in thermal power plants, and the combustion of coal and hydrocarbons produced tremendous amounts of carbon dioxide (CO2). This practice has caused an increase in the atmospheric concentration of CO2 from 280 ppm to more than 415 ppm in 2022. The increase—and to a lesser extent the release of other greenhouse gases—is the cause of Global Climate Change (GCC), which is the most significant environmental concern of the 21st century [1]. It becomes increasingly apparent that a significant reduction of CO2 emissions is necessary to avoid major environmental disasters. However—and despite several U.N.-sponsored conferences, including the Paris conference and agreement of 2015—the combustion of coal (the most potent source of CO2 emissions) has increased by 2% annually in non-OECD countries [2,3]. There is a commensurate increase in global CO2 emissions, which increased by 1.7% annually [4,5] before the pandemic and, despite lofty goals and promises by several nations, do not show any signs of abatement in the post-pandemic era [6]. A recent IEA report [7] bemoans that “most pledges are not yet underpinned by near-term policies and measures”.
The electric power generation sector is the most significant contributor of CO2 emissions globally and accounts for approximately 43% of the emissions of this gas, with transportation being the second contributor. Since electricity-generation emissions primarily occur in very large and stationary sources, it is rational and realistic for policy makers to first tackle the thermal power plants for any directives and regulations applied to the national and global reduction of CO2 emissions. To keep global temperature increase to less than 2 °C, the Intergovernmental Panel on Climate Change (IPCC) recommended in 2014 that the CO2 emissions from electric power plants be reduced by 90% or more from their 2010 levels over the period of 2040–2070 [8]. The same panel recently adopted a more stringent goal for a temperature raise of 1.5 °C [9]. This is very close to the already observed average global temperature rise of 1.1 °C [10]. While these goals may appear to be lofty, their adoption—even partial adoption—globally will profoundly transform the electricity generation sectors in several nations by transitioning the electricity generation from fossil fuels to renewable energy sources (RES).
Renewable energy sources are primarily wind and solar energy, which are the most common and most abundant RES on a global scale. Adherence to the IPCC recommendations will result in wind turbines and photovoltaic (PV) cells generating most of the electricity for the increasing population of the planet, which is expected to reach 10 billion in 2040 [9]. While it is noted that a few smaller countries have significant hydroelectric resources (e.g., Norway, Nepal) and geothermal resources (e.g., El Salvador, Iceland, Nicaragua) that may supply a high fraction of their electric power demand, the vast majority of nations will have to rely primarily on the wind and the sun.
The transition from electricity generation to wind and solar energy entails a significant problem: solar power is periodically variable, and wind is intermittent, while the demand for electric power is not related to the availability of these two RES. Actually, the demand follows fairly well-known seasonal and diurnal patterns. This raises a question for the consumers: How does my air-conditioning (or my lights or my television) operate on the calm (no wind) evening (no sun) of 17 July? While currently the electric power demand fluctuations are met by bringing in line gas-turbines that quickly generate dispatchable electric power, in a future world that primarily relies on solar and wind power there will be supply–demand mismatch, which may only be met by significant energy storage. The utilization of significant energy storage systems becomes an indispensable technological component in a future where RES supplies a high fraction of electricity [11,12,13]. A second, equally compelling reason for the adoption of large-scale energy storage is the high level of PV power generation that exceeds demand during the early morning hours. This phenomenon was popularly named the “duck curve” for solar energy systems [14,15]. Similar demand–supply mismatches occur with wind power during windy time periods in the Spring and Autumn and accentuate the importance of energy storage [16,17].
Since solar and wind power are very diffuse forms of RES, it becomes apparent that the transition to renewables will not occur with the currently operating high-power thermal power plants (several coal units have ratings higher than 1000 MW and combined cycle gas turbines have reached 200 MW), but rather will require smaller and dispersed units that would locally supply communities. Significant energy storage will also be required in all transitions to RES cases. A few analytical studies on such microgrid systems have appeared for island communities in several locations, such as the archipelago of the Philippines, where the population is high and the electricity demand is significant [18,19]; islands off the coast of Ecuador, where the irradiance is high [20]; as well as islands in the North Sea (Samso and Orkney) where the irradiance is low, but wind energy is abundant [21]. A few studies have also appeared for the transition of electricity to RES in individual land-based districts of suburban communities, where retrofitting and optimization become key issues [22,23]; as well as for remote rural areas where it is not economically viable to reach them through national grids [24,25]. Similar analytical studies have also been done for the transition of national electricity grids in very large nations/states, such as Italy [26] and Texas [27]. Given the disperse nature of RES, in the latter cases the systems must be distributed in many areas, that is, they should be community- or district-based systems.
This paper presents a realistic scenario for the transformation of a medium-size residential community of houses in North Texas to zero CO2 emissions by supplying all the power demanded by the consumers with solar and wind power. The study goes a step further and analyzes the supply of renewably-generated heat for hot water and space heating during the colder days of the year. A salient characteristic of this community, which is typical of similar communities in the Southern USA and other communities globally, is that it utilizes air-conditioning during the summer months—a power-hungry system based on refrigeration cycles. The widespread use of air-conditioning significantly increases the electric power demand during the hot summer days and exacerbates the need for significant energy storage. Calculations are performed for the hourly energy demand and supply of a residential community of 10,000 houses to determine the needed rated (plate) capacity for solar and wind electricity generation units in a zero-emissions regime, the necessary energy storage capacity, and the energy dissipation associated with the energy storage-and-recovery processes. One of the salient features of this article is the inclusion of renewable heating by substituting the existing natural gas furnaces with heat pumps. The annual CO2 avoidance is also calculated and reported.

2. Electric Power Demand and Supply

The community under consideration consists of 10,000 houses and is located near the Dallas–Fort Worth (DFW) metroplex, an area rich in both solar and wind resources. At a latitude of 31.54 degrees, the average insolation in the area is 198 W/m2. Excellent wind resources with average wind velocities of 12 m/s exist within a radius of 150 km from this urban area. However, the electricity demand of the homes in this area is significant, especially during the summer. Figure 1 shows the simulated electric power demand of these homes during two days of the year, in January and July. The effect of air-conditioning on the power demand during the summer days is apparent in this Figure.
It is axiomatic that the electric power demand of the simulated community must be matched by the supply, which is derived from photovoltaic (PV) systems and wind turbines. Since the two RES are not dispatchable, energy storage systems are also needed to supply the community during the hours of low electric power generation. The schematic diagram of the proposed electric power system is shown in Figure 2, where the arrows denote the flow of electric power. Electricity is generated by an array of wind turbines and several solar farms with PV cells. Given the generated noise, the wind turbines may not be located very close to the community, but rather within a radius of 150 km. The performance of the PV systems is enhanced by maximum power point trackers (MPPT) and controllers ensure the optimum generation of solar power. Since the homes use alternating current (ac), voltage inverters convert the direct current (dc) generated in the PV cells—as well as in the fuel cells –to alternating current (ac). The instantaneously generated electric power is fed to the buildings to supply all or part of the hourly demand. When the generated power is higher than the demand, electrolytic systems utilize the excess energy and generate hydrogen, which is stored in hydrogen tanks for future use. When demand exceeds the supply, the deficit is provided by the stored hydrogen in fuel cells (direct energy conversion).
Regarding the energy storage system, the suitable utility-level storage systems are: (a) pumped-hydro systems, PHS; (b) compressed air energy systems, CAES; (c) hydrogen storage; and, possibly, (d) large battery systems. The geographical area under consideration (North Texas) does not have the features for PHS (mountains and nearby valleys for water reservoirs) and CAES (large underground caves). In addition, the required energy storage is seasonal (e.g., from winter to spring to summer), as it will become apparent in the results section, and this excludes battery storage because of their internal current drift that dissipates power at long storage timescales [13,28,29]. This leaves hydrogen as the only viable energy storage alternative. In the calculations that follow, hydrogen is stored at 50 MPa and ambient temperature. Given that there are in-the-market hydrogen-based vehicles that operate with tanks in the range of 30–70 MPa, the technology for such tanks is current.
It must be noted that the community will not utilize a single such system in a centralized location. Since wind and solar energy are highly diffuse energy sources, several (smaller) such systems will be built inside or in the proximity of the community to optimize energy generation and use and to ensure supply–demand equilibrium.

3. Governing Equations

In an entirely decarbonized community with wind and solar as the primary energy sources and hydrogen storage, when the energy sources (wind and solar) systems generate more power than the immediate demand, all the excess electricity is converted to hydrogen, which is pressurized and stored locally in tanks. When the consumer demand for power exceeds the supply, the stored hydrogen is converted in fuel cells to make up for the deficit. Of course, the storage–regeneration process for electricity entails dissipation (net energy loss). The energy dissipation of the storage–regeneration process is calculated using the system’s component efficiencies.
More than 33,600 MW of wind power units are currently installed in the entire State of Texas. The accumulated experience with wind turbines in the State is significant and sufficient data are available to calculate the hourly wind-generated electricity in the North Texas region, where this community is located. For the computations of this study, the hourly electric energy generation by wind turbines in the region, per MW installed, was used [30]. The generated power from the wind turbines was determined by pro-rating the wind turbine ratings assigned to the community using the available data for the ratio: MWh generated in a given hour to MW installed capacity.
The energy generation by the PV cells during a certain hour of the year, i, is determined by the expression:
E s i = A I ˙ i η T i i t
where E s i represents the energy generated by the solar cells during the hour, i; I ˙ i is the total solar irradiance in the region (direct and diffuse); A is the area of the PV systems in the community; η T i is the efficiency of the PV cells during the ith hour; and t is the timescale, which is 1 h (3600 s) for the calculations of this study. The irradiance data are obtained from the database of NREL [31].
It is well-known that the efficiency of the PV cells decreases at higher-than-normal ambient temperatures. For this reason, a closure equation for the efficiency of the PV system, η T i , was used, as follows:
η T i = η 25 [ 1 k S C ( T i 25 ) ]   ,   T i > 25   ° C
where η 25 is the PV cell’s efficiency at 25 °C, k S C is the temperature sensitivity coefficient for the PV cells (supplied by the manufacturer), and Ti is the ambient temperature in °C. For the calculations that follow, the value k S C = 0.002 for the sensitivity coefficient was chosen [32].
With the two primary energy sources, the hourly energy demand of the community of buildings, EDi, must be met either by the hourly energy generation of the solar and wind units or by the hydrogen storage system. During the hour, i, if the supply is higher than the demand, the excess energy, E e x is directed to the electrolysis systems to generate hydrogen, which is added to the hydrogen tanks. If the electricity demand of the community is higher than the RES generated energy, the fuel cells will use part of the stored hydrogen to supply the deficit, E d e f . Therefore, at the end of the i th hour of the year and the beginning of the (i + 1)th hour, the energy storage level, S , is calculated by one of the following expressions:
S ( i + 1 ) = S i + E e x η e l   ,   i f   E s i E D i S ( i + 1 ) = S i E d e f η f c   ,   i f   E s i E D i .
In the last equation, η e l is the efficiency of the electrolytic components and η f c is the efficiency of the fuel cells for the generation of electricity. It is apparent that the processes of energy storage and recovery entail energy dissipation. This and the round-trip efficiency of the storage–generation system depend on the efficiencies of the electrolysis systems and the fuel cells. In the calculations that follow, the values of these two efficiencies also include all the other (and lesser) losses pertaining to inverters and any transformers that may be used. Thus, the round-trip efficiency of the storage–regeneration process is equal to the product ηelηfc.
For the reliability of the electricity supply system, it was stipulated that, at all 8760 h of the year, the storage system should contain a sufficient quantity of hydrogen to supply the entire microgrid for at least 10 days (240 h). Thus, if there is a system malfunction, a local problem, or severe weather events (e.g., a tornado or a severe winter freeze) that abruptly cut or significantly reduce the renewable energy generated, the management of the electricity supply system will have sufficient time to respond. Thus, the stored energy does not reach zero at any hour during the year.
The following double iteration process is used to solve the system of governing equations and energy storage constraint [33,34,35]:
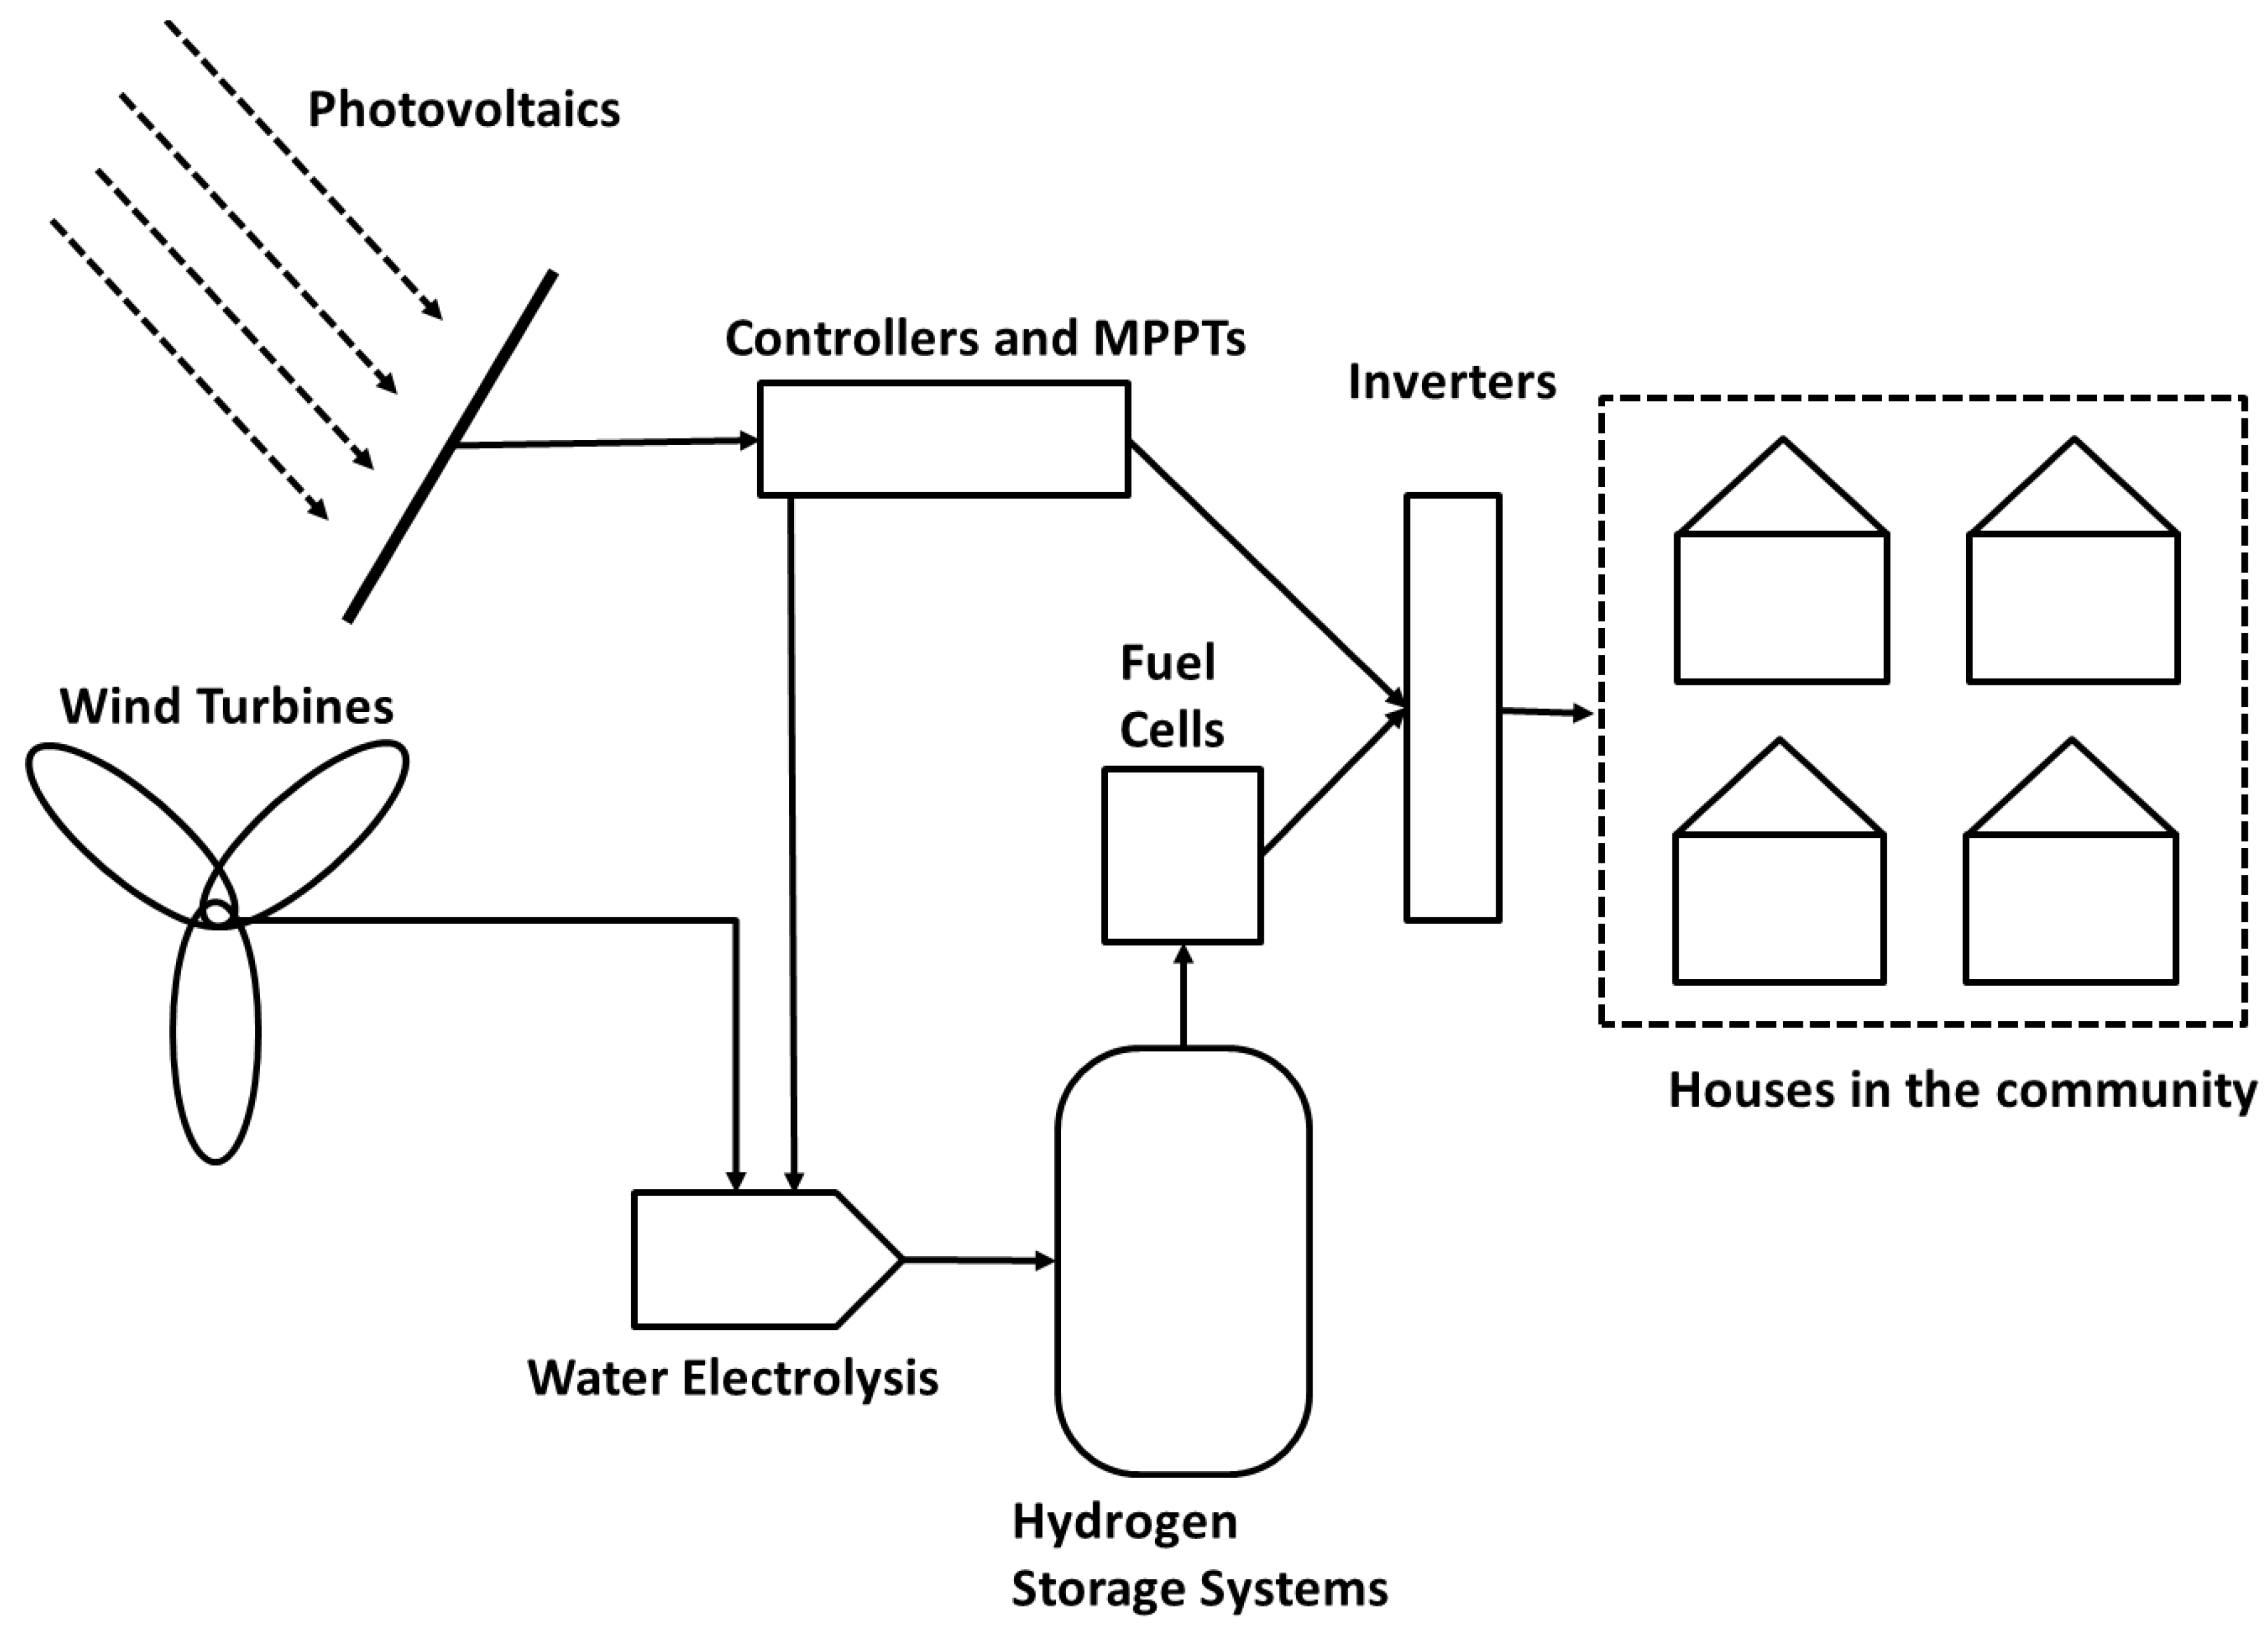
  • An installed wind capacity for the community (in MW) is prescribed.
  • An initial hydrogen quantity for the storage system on the first hour of the year, S(1), is assumed.
  • The total area of the PV system is also assumed.
  • During a given hour of the year, the solar- and wind-generated energy is computed.
  • From the total energy generated and the demand, the hourly energy surplus or deficit is calculated at every one of the 8760 h of the year.
  • The total quantities of stored energy and associated mass of hydrogen are also calculated at all hours.
  • The stored energy at the end of the year, S(8760), is calculated and compared to S(1), at the beginning of the year. If S(1) > S(8760), more energy needs to be generated. Hence, the PV area is increased and steps 4–6 are repeated. If S(1) < ES8760, the PV area is decreased and steps 4–6 are repeated until S(1) = S(8760). This first iterative process determines the correct value of the solar capacity (step 2), which supplements the prescribed wind capacity of step 1.
  • The correct value for S(1) in step 2 is determined by a second iteration, using the constraint that, on the day of the minimum hydrogen storage, the energy storage system must have enough hydrogen stored to satisfy the entire electricity demand of the community for the next 10 days (240 h).

4. Results and Discussion

This paper presents the energy scenarios for the development of a decarbonized community of 10,000 homes in the North-Central region of Texas. The community is grid independent to ensure that the effects related to the “duck curve” do not hinder the decarbonization process and power reliability. Two cases will be examined:
  • The RES provide the community its electric power demand only.
  • The RES provide the electric power demand as well as the heat needed in the winter months for domestic comfort and hot water. Heat is provided by heat pumps.

4.1. Electricity Supply Only

This is called “case A” and Figure 3 shows the necessary wind and solar power ratings that would make this community grid independent and reliant on RES. Since there are two energy sources, a suitable combination of the two will be used for this purpose. It is observed in the Figure that the addition of approximately 43 MW of wind power alone, or of 92 MW of PV power alone, or a combination of the two sources, as shown in the Figure, will ensure the continuous supply of the electric power needs in the community by the available RES.
The exact combination of wind and solar units will very likely be determined by cost considerations, which will include the additional renewable capacity as well as the annual energy dissipation and the necessary storage infrastructure. Figure 4 depicts the annual energy dissipation due to the storage–regeneration process in MWh (left axis) and the necessary energy storage in m3 of hydrogen (right axis). It must be noted that the stored chemical energy in 1 m3 of H2 at ambient temperature and 50 MPa is approximately equal to 3.6 × 10⁹ J (1 MWh).
It is observed in Figure 4 that the annual energy dissipation has a minimum of approximately 27,500 MWh (26.7% of the annual electricity demand by the community). In this case, the minimum occurs at approximately 22 MW of additional wind power. At this point, the needed PV power would be approximately 36 MW (from Figure 3) with the power combination for the complete electricity decarbonization being 22 MW wind and 36 MW solar. The computations also showed the needed hourly energy storage, in MWh, which is needed for this system to become a reality. Based on the maximum energy storage in the system, which in this case occurs in the middle of June, and the Gibbs free energy for the direct conversion of hydrogen to electricity (237,000,000 kJ/kmol), the maximum mass of hydrogen in the storage system was calculated. Since the density of hydrogen at the storage conditions (50 MPa, 310 K) is 30.662 m3/kg, [36] the required volume for the hydrogen storage was calculated to be 27,300 m3 of H2 or approximately 2.73 m3 for each home in the community.

4.2. Electricity and Heat Supply

The second part of the calculations is the substitution of the natural gas, which is locally produced and supplies all the heating needs in the North Texas region, with heat pumps operating with renewable electricity. For this reason, the hourly heating demand of the 10,000 homes was simulated from the statistical analysis of the demand for gas of 20 homes that span all the home sizes in the Fort Worth area. The heating demand was converted to electric energy demand and the new electricity demand was added to the current hourly electricity demand. This is called “case B” and the average value 4.5 was used for the COP of the heat pumps, a value commensurate with the current technology [37]. Figure 5 shows the combination of the solar and wind power that would enable both the electric and heating demand to be supplied by the available RES. A comparison of this Figure with Figure 3 shows that more renewable power is needed in this case: the addition of approximately 60.5 MW of wind power alone, or of 145.5 MW of PV power alone, or a combination of the two sources as shown in Figure 5 will ensure the continuous and reliable supply of the electric power and heating needs in the community by the available RES.
Figure 6 is the equivalent of Figure 4 and shows the annual energy dissipation and the needed hydrogen storage. Again, a minimum energy dissipation is observed. The minimum annual dissipation is 30,050 MWh and corresponds to 18.2% of the total electricity demand (this includes heat pumps) or 29.8% of the electricity demand excluding the heat pumps. The minimum occurs at approximately 50 MW installed wind power. In this case, the PV power that would be required is approximately 22 MW. The significantly higher wind power requirement is due to the fact that a great deal of power is needed for heating (both space heating and hot water) during the winter months, when the wind velocity is higher and the wind power significant.
A comparison of Figure 4 and Figure 6 shows that the dissipation in this case is approximately 12% higher in case B than in case A. However, the required hydrogen energy storage at the minimum dissipation is approximately 17% less in case B. This is due to the fact that wind generates a much higher fraction of the energy in case B and wind turbines in this region have significantly higher power operating factors (POFs) than solar PV installations (36.4% and 18.5%, respectively). The higher POF of the wind turbines ensures a lower energy storage requirement.
Figure 7 shows the hourly energy storage in the system for the entire year (8760 h). It is observed in this Figure that the minimum in case B occurs in the middle of February, when the temperatures start increasing and not a great deal of heating is required, and that a second local minimum occurs in early October, when the air-conditioning demand dissipates. A single minimum appears in case A, again in early October, when little air-conditioning is needed.

4.3. Carbon Dioxide Avoidance

It is of interest to calculate the CO2 avoidance pertaining to the transition of this community from fossil fuels to renewable energy. Case A entails an annual total of 103,523 MWh of electricity (the annual electricity demand of the 10,000 homes). With the current primary energy mix for the local generation of electricity, the average CO2 emissions per MWh are 328.6 kg CO2/MWh [38], and this implies that the CO2 annual avoidance for case A is approximately 34,021 tons of CO2—a rather significant quantity.
For case B, the total annual heating demand of the community is 998 × 106 MJ, and this is currently provided by the combustion of natural gas. The local natural gas emits, on average, 53.2 kg of CO2 per 106 Btu [39] (53.5 kg of CO2 per 109 J). Therefore, the transition to heat pumps will result in the avoidance of an additional 53,393 tons of CO2 annually. All in all, transitioning the electricity and heating supply for this community will result in 87,414 tons of CO2 avoidance annually. It must be noted that such grid-independent communities powered only by RES are not in existence. For this reason, it is impossible to provide a verification of the obtained results based on actual measurements. Since the computational results have been derived using actual demand data and realistic efficiencies of state-of-the-art technology, it is believed that the uncertainty of the results is within ±15%.

5. Conclusions

The transition of residential communities in North Texas from fossil fuels to renewable energy will be achieved with the development of combinations of wind turbines and PV systems. In addition, significant energy storage is required, which is primarily used for air-conditioning during the hot summer season. Calculations were performed for the transition of a residential community of 10,000 homes. The hourly demand of (a) electricity and (b) electricity plus heating of the community is supplied by wind and solar energy. Hydrogen is used as the energy storage medium. Matching the hourly energy demand and supply shows that significant energy storage is required—2.7 m3 per household for case A and 2.2 m3 per household for case B. The storage–regeneration processes also result in significant dissipation, which is close to 30% of the currently annual electricity demand of the houses. The entire decarbonization (electricity and heat) of this community will result in 87,414 tons of CO2 emissions avoidance.

Funding

This research received no external funding.

Informed Consent Statement

Not applicable.

Data Availability Statement

Not applicable.

Acknowledgments

This research was partly supported by the W.A. (Tex) Moncrief Chair of Engineering at TCU.

Conflicts of Interest

The author declares no conflict of interest.

References

  1. Intergovernmental Panel on Climate Change (IPCC). Climate Change 2007: Synthesis Report. Contribution of Working Groups I, II and III to the Fourth Assessment Report of the Intergovernmental Panel on Climate Change; Intergovernmental Panel on Climate Change (IPCC): Geneva, Switzerland, 2007. [Google Scholar]
  2. International Energy Agency. CO2 Emissions from Fuel Combustion—Overview; IEA-Chirat: Paris, France, 2019. [Google Scholar]
  3. Ritchie, H.; Roser, M. CO2 and Greenhouse Gas Emissions. In Our World In Data; Global Change Data Lab.: Oxford, UK, 2020; Available online: https://ourworldindata.org/co2-and-other-greenhouse-gas-emissions (accessed on 4 August 2022).
  4. International Energy Agency. Key World Statistics; IEA-Chirat: Paris, France, 2018. [Google Scholar]
  5. International Energy Agency. Key World Statistics; IEA-Chirat: Paris, France, 2020. [Google Scholar]
  6. International Energy Agency (IEA). Global Energy Review; International Energy Agency (IEA): Paris, France, 2021; Available online: www.iea.org (accessed on 20 February 2022).
  7. International Energy Agency. Net Zero by 2050—A Roadmap for the Global Energy Sector; IEA-Chirat: Paris, France, 2021. [Google Scholar]
  8. Intergovernmental Panel on Climate Change (IPCC). Climate Change 2014: Synthesis Report. Contribution of Working Groups I, II and III to the Fifth Assessment Report of the Intergovernmental Panel on Climate Change; Pachauri, R.K., Meyer, L.A., Eds.; Intergovernmental Panel on Climate Change (IPCC): Geneva, Switzerland, 2014. [Google Scholar]
  9. Intergovernmental Panel on Climate Change (IPCC). Global Warming of 1.5 °C. An IPCC Special Report on the Impacts of Global Warming of 1.5 °C above Pre-Industrial Levels and Related Global Greenhouse Gas Emission Pathways, in the Context of Strengthening the Global Response to the Threat of Climate Change, Sustainable Development, and Efforts to Eradicate Poverty; Intergovernmental Panel on Climate Change (IPCC): Geneva, Switzerland, 2019. [Google Scholar]
  10. Michaelides, E.E. Energy, the Environment, and Sustainability; CRC Press: Boca Raton, FL, USA, 2018. [Google Scholar]
  11. Argyrou, M.C.; Christodoulides, P.; Kalogirou, S.A. ES for electricity generation and related processes: Technologies appraisal and grid scale applications. Renew. Sustain. Energy Rev. 2018, 94, 804–821. [Google Scholar] [CrossRef]
  12. Mahlia, T.M.I.; Saktisahdan, T.J.; Jannifar, A.; Hasan, M.H.; Matseelar, H.S.C. A review of available methods and development on ES; Technology update. Renew. Sustain. Energy Rev. 2014, 33, 532–545. [Google Scholar] [CrossRef]
  13. Michaelides, E.E. Thermodynamics, Energy Dissipation, and Figures of Merit of Energy Storage Systems—A Critical Review. Energies 2021, 14, 6121. [Google Scholar] [CrossRef]
  14. Freeman, E.; Occello, D.; Barnes, F. ES for Electrical Systems in the USA. AIMS Energy 2016, 4, 856–875. [Google Scholar] [CrossRef]
  15. California ISO (CAISO). What the Duck Curve Tells Us about Managing a Green Grid. 2016. Available online: https://www.caiso.com/Documents/FlexibleResourcesHelpRenewables_FastFacts.pdf (accessed on 4 August 2022).
  16. Michaelides, E.E. Energy Storage and Installed Wind Capacity Requirements for the Substitution of Fossil Fuels in the Electricity Generation Sector. J. Energy Power Technol. 2021, 3, 18. [Google Scholar] [CrossRef]
  17. Headley, A.J.; Copp, D.A. Energy storage sizing for grid compatibility of intermittent renewable resources: A California case study. Energy 2020, 198, 117310. [Google Scholar] [CrossRef]
  18. Supapo, K.R.M.; Lozano, L.; Tabañag, I.D.F.; Querikiol, E.M. A Backcasting Analysis toward a 100% Renewable Energy Transition by 2040 for Off-Grid Islands. Energies 2022, 15, 4794. [Google Scholar] [CrossRef]
  19. Tarife, R.; Nakanishi, Y.; Chen, Y.; Zhou, Y.; Estoperez, N.; Tahud, A. Optimization of Hybrid Renewable Energy Microgrid for Rural Agricultural Area in Southern Philippines. Energies 2022, 15, 2251. [Google Scholar] [CrossRef]
  20. Hidalgo-Leon, R.; Amoroso, F.; Urquizo, J.; Villavicencio, V.; Torres, M.; Singh, P.; Soriano, G. Feasibility Study for Off-Grid Hybrid Power Systems Considering an Energy Efficiency Initiative for an Island in Ecuador. Energies 2022, 15, 1776. [Google Scholar] [CrossRef]
  21. Kartalidis, A.; Atsonios, K.; Nikolopoulos, N. Enhancing the self-resilience of high-renewable energy sources, interconnected islanding areas through innovative energy production, storage, and management technologies: Grid simulations and energy assessment. Int. J. Energy Res. 2021, 45, 13591–13615. [Google Scholar] [CrossRef]
  22. Zygmunt, M.; Gawin, D. Application of the Renewable Energy Sources at District Scale—A Case Study of the Suburban Area. Energies 2022, 15, 473. [Google Scholar] [CrossRef]
  23. Sandoval Aguilar, R.; Michaelides, E.E. Microgrid for a Cluster of Grid Independent Buildings Powered by Solar and Wind Energy. Appl. Sci. 2021, 11, 9214. [Google Scholar] [CrossRef]
  24. Al-Ghussain, L.; Abujubbeh, M.; Darwish Ahmad, A.; Abubaker, A.M.; Taylan, O.; Fahrioglu, M.; Akafuah, N.K. 100% Renewable Energy Grid for Rural Electrification of Remote Areas: A Case Study in Jordan. Energies 2020, 13, 4908. [Google Scholar] [CrossRef]
  25. Husein, M.; Kim, H.-J.; Chung, I.-Y. The Impact of Policy and Technology Parameters on the Economics of Microgrids for Rural Electrification: A Case Study of Remote Communities in Bolivia. Energies 2020, 13, 877. [Google Scholar] [CrossRef]
  26. Gaeta, M.; Nsangwe Businge, C.; Gelmini, A. Achieving Net Zero Emissions in Italy by 2050: Challenges and Opportunities. Energies 2022, 15, 46. [Google Scholar] [CrossRef]
  27. Leonard, M.D.; Michaelides, E.E.; Michaelides, D.N. Energy Storage Needs for the Substitution of Fossil Fuel Power Plants with Renewables. Renew. Energy 2019, 145, 951–962. [Google Scholar] [CrossRef]
  28. Trócoli, R.; Morata, A.; Erinmwingbovo, C.; La Mantia, F.; Tarancó, A. Self-discharge in Li-ion aqueous batteries: A case study on LiMn2O4. Electrochim. Acta 2021, 373, 137847. [Google Scholar] [CrossRef]
  29. Chung, S.H.; Manthiram, A. Lihium–Sulfur Batteries with the Lowest Self-Discharge and the Longest Shelf life. ACS Energy Lett. 2017, 2, 1056–1061. [Google Scholar] [CrossRef]
  30. Energy Reliability Council of Texas (ERCOT). Available online: https://www.ercot.com/gridinfo/generation (accessed on 5 August 2022).
  31. Wilcox, S. National Solar Radiation Database 1991–2010 Update: User’s Manual; Technical Report NREL/TP-5500-54824; National Renewable Energy Lab.: Golden, CO, USA, 2012.
  32. Dubey, S.; Sarvaiya, N.J.; Sheshadri, B. Temperature dependent Photovoltaic (PV) efficiency and its effect on PV production in the world—A review. Energy Procedia 2013, 33, 311–321. [Google Scholar] [CrossRef]
  33. Leonard, M.D.; Michaelides, E.E. Grid-Independent Residential Buildings with Renewable Energy Sources. Energy 2018, 148, 448–460. [Google Scholar] [CrossRef]
  34. Leonard, M.D.; Michaelides, E.E.; Michaelides, D.N. Substitution of coal power plants with renewable energy sources—Shift of the power demand and energy storage. Energy Convers. Manag. 2018, 164, 27–35. [Google Scholar] [CrossRef]
  35. Michaelides, E.E.; Michaelides, D.N. Impact of nuclear energy on fossil fuel substitution. Nucl. Eng. Des. 2020, 366, 110742. [Google Scholar] [CrossRef]
  36. REFPROP. Reference Fluid Thermodynamic and Transport Properties; Version 9.1; NIST Standard Reference Data Basis: Gaithersburg, MD, USA, 2012. [Google Scholar]
  37. US-Department of Energy. Available online: https://www.energy.gov/energysaver/heat-pump-systems (accessed on 4 August 2022).
  38. Energy Reliability Council of Texas (ERCOT). Available online: https://www.ercot.com/search?q=CO2+production&year=2022 (accessed on 4 August 2022).
  39. US Energy Information Agency. Available online: https://www.eia.gov/energyexplained/natural-gas/natural-gas-and-the-environment.php (accessed on 4 August 2022).
Figure 1. Typical electric power demand of the community during days in January and July.
Energies 15 05896 g001
Figure 2. Schematic diagram of the housing community. Solar and wind energy with hydrogen energy storage meet the electric power demand.
Energies 15 05896 g002
Figure 3. The combination of wind and solar installations power ratings.
Energies 15 05896 g003
Figure 4. Annual energy dissipation and volume of hydrogen storage needed for the storage–regeneration process.
Energies 15 05896 g004
Figure 5. The combination of wind and solar installation power ratings to supply both electricity and heat.
Energies 15 05896 g005
Figure 6. Annual energy dissipation and volume of hydrogen storage needed for the storage–regeneration process.
Energies 15 05896 g006
Figure 7. Hourly hydrogen energy storage needed in the two cases examined. Hour 1 corresponds to the first hour of the year (midnight to 1 a.m. on 1 January).
Energies 15 05896 g007
Publisher’s Note: MDPI stays neutral with regard to jurisdictional claims in published maps and institutional affiliations.

