Abstract
Whilst various new technologies for power generation are continuously being evaluated, the owners of almost-new facilities, such as combined-cycle gas turbine (CCGT) plants, remain motivated to adapt these to new circumstances and avoid the balance-sheet financial impairments of underutilization. Not only are the owners reluctant to decommission the legacy CCGT assets, but system operators value the inertia and flexibilities they contribute to a system becoming predominated with renewable generation. This analysis therefore focuses on the reinvestment cases for adapting CCGT to hydrogen (H2), synthetic natural gas (SNG) and/or retrofitted carbon capture and utilization systems (CCUS). Although H2, either by itself or as part of SNG, has been evaluated attractively for longer-term electricity storage, the business case for how it can be part of a hybrid legacy CCGT system has not been analyzed in a market context. This work compares the power to synthetic natural gas to power (PSNGP) adaptation with the simpler and less expensive power to hydrogen to power (P2HP) adaptation. Both the P2HP and PSNGP configurations are effective in terms of decarbonizations. The best results of the feasibility analysis for a UK application with low CCGT load factors (around 31%) were obtained for 100% H2 (P2HP) in the lower range of wholesale electricity prices (less than 178 GBP/MWh), but in the higher range of prices, it would be preferable to use the PSNGP configuration with a low proportion of SNG (25%). If the CCGT load factor increased to 55% (the medium scenario), the breakeven profitability point between P2HP and PSNGP decreased to a market price of 145 GBP/MWh. Alternatively, with the higher load factors (above 77%), satisfactory results were obtained for PSNGP using 50% SNG if with market prices above 185 GBP/MWh.
1. Introduction
With accelerated progress to net zero carbon intensity, through the widespread adoption of intermittent renewable resources [], the management of surplus renewable energy is becoming a crucial concern alongside the alternative need for reserve capabilities to cover periods of low renewable power outputs. Excess production of renewable energy often creates negative energy prices in which the system pays in the customers to maintain electricity production. Being able to take advantage of those periods of high production and negative prices to store part of that surplus energy is obviously attractive and efficient. In GB, for example, the estimated storage requirements [] range from 43 TWh for 100% average renewable penetration with a curtailment of 15% to 116.5 TWh if all over-generation is captured. However, the generation mix has a strong impact on the storage capacities that are required. In particular, the plight of existing combined-cycle generating turbines (CCGT) is both a problem for the owners of these legacy assets as they suffer low utilization rates and financial distress, having been displaced by the renewables, and an opportunity if adapted to burn hydrogen or synthetic gas. Surplus electricity from renewables can be used for power-to-gas (P2G) conversion, thereby providing energy storage as subsequent fuel to be used at times of low renewable outputs by the adapted CCGTs. This paper analyzes the economics and business case for adapting the legacy CCGTs in this way as part of a hybridized P2G storage and generating system.
Among the developments and advances made in P2G, those in Germany [,,] stand out, identifying P2G systems for seasonal energy storage with the following advantages and opportunities of synergy:
- Surplus renewable energy can be stored seasonally. Batteries are not suitable for long-term storage.
- The gas network can store large amounts of energy and transport it as needed. This cannot be done by the electrical infrastructure.
- By converting gas back to electricity, power-to-gas acts as an energy vector.
- Apart from storage of pure hydrogen, captured CO2 can be transformed with hydrogen into synthetic methane (SNG).
- For countries without substantial hydro-pumped storage, this P2G storage and generation cycle offers a viable alternative.
In [], it was found that among large-capacity storage methods, if the storage period exceeds half a year to one year, the use of SNG as an energy vector for large-capacity storage is technically and economically promising. In relation to other technical criteria (such as the size or the availability of the necessary materials), the use of SNG can play an important role for the seasonal or annual storage periods. The intertwining of electricity, methane and hydrogen infrastructures through P2G conversion technologies (e.g., electrolyzers), power plants (SNG and hydrogen), gas reformers and methanization units can provide the flexibility that the future energy system needs []. In [], the impacts caused by the coupling of the energy and gas networks were quantified, and the feasibility of mixing hydrogen directly into the natural gas network was investigated. Hydrogen injection can pose challenges to the pipeline network. With potentially high hydrogen penetration in the natural gas network, gas volume flow and nodal pressure can vary because of different hydrogen concentrations in pipelines. Due to the relatively lower gas demand in summer, the permitted amount of synthetic hydrogen in the gas network is quite limited. Therefore, a more reasonable option is to store synthetically generated hydrogen separately or together with natural gas in warmer seasons. In winter, the demand for gas is higher because of the higher demand for heating. Therefore, mixing hydrogen in the gas network becomes more feasible.
Notwithstanding the energy transition away from fossil fuels, the conventional thermal generation plants have benefits in systems with high renewable penetration, as they provide flexibility and inertia to the grid for power quality regulation. However, despite the fact that gas turbines powered by natural gas have relatively low emission levels (especially combined-cycle plants, CCGTs), emissions will have to be further reduced to meet the terms of the Paris Agreement, which calls for carbon neutrality by the middle of this century. The European Investment Bank (BEI) declared in its 2019 climate strategy [] that it would no longer finance new projects employing fossil fuels in power-generation plants whose emissions exceed 250 Kg CO2/MWh. This emissions limit eliminates the use of coal as a fuel (without carbon capture), along with CCGTs using natural gas. However, the possibility of having large surpluses of energy at negative prices with which to generate energy vectors, in a cycle that is carbon neutral, may provide business opportunities for those CCGT plants that are already amortized. As an aside, ref. [] observed that the large-scale use of batteries would not be a viable alternative. The approach proposed in this study does not consider any special energy policy incentives for P2G systems and takes the current UK energy policy as its framework. The analysis includes sensitivities to the high gas prices that occurred in 2021/2022.
P2G systems come in two basic configurations: H2 or SNG. The optimal capacity of a system has been studied in [], showing that reasonable conditions exist in which a power-to-gas balancing system can be economically feasible. In addition to some necessary cost reductions in the electrolysis systems, the main driving forces to promote further investment include a high ratio between the natural gas and electricity prices and a high cost of CO2 emissions. From the point of view of policy makers, the implementation of power to gas to power systems can be treated in a similar way to that of the development of renewables, either through the use of subsidies oriented toward production or support measures aimed at capacity. The difference between these two approaches has been analyzed in detail []. In [], the different pathways of power to gas were explored showing that P2G could be competitive with steam methane reform (SMR) in the future. Improvements to technologies may increase the overall efficiency of P2G by 2% to 5% in the future and this would be critical for implementation. The efficiencies of each alternative were indicated and indications from which to develop plans and strategies for the transition to an economy with low CO2 emissions are provided. Later in 2019, ref. [] provided updated information for a synthetic natural gas (SNG) generation plant on an industrial scale. Until then (2019), most of the analyses performed on SNG generation were based on laboratory studies. The efficiency was determined at 78%, greater than that indicated previously in 2017 by []. The economic viability of producing SNG on the basis of the capture and use of CO2 was analyzed in []. SNG was compared with natural gas (NG) in seven regions with favorable energy markets, with the conclusion that cost reduction should focus on improving electrolysis efficiency and methanization capital costs (CAPEX). To improve costs, it is necessary for the SNG to maximize operation at full load. An annual load factor of 80% would make SNG economically viable, and SNG costs of 40 EUR/MWh would be close to those of NG in the future. In [] the cost estimate of SNG was 0.0548 USD/kWh when the capture of CO2 was considered, and the economic sensitivity analysis of the P2G plant confirmed that this depends to a great extent on the price of electricity and the hours of operation. A reduction in the electrolyzer investment costs, combined with a higher electrolyzer efficiency and higher revenues, could, according to [], result in a profitable business case for the large-scale deployment of this P2G technology. Furthermore, when applying a time-of-use retail electricity price of approximately 10 EUR/MWh, the costs of SNG decrease to about 40 EUR/MWh, which is very close to the price of natural gas. In line with the costs reflected by [,] showed that by 2050 SNG production costs from P2G may reach values below 0.15 EUR/kWh.
The growth of variable renewable energy by 2050 will result in substantial flexibility requirements by the electricity markets. A storage system using H2 or SNG, could provide a daily (short-term) and seasonal (annual) flexibility []. The effectiveness of this cycle is highly dependent on the specific aspects of the country, which determine its actual need for long flexibility services. Renewable power fluctuations could be mitigated by employing gas pipelines, which can store up to 5% to 15% by volume of H2 []. Elsewhere, its storage in salt caves and its subsequent use in CCGT [] has been considered. In line with previous research, ref. [] indicated that the P2G system based on hybrid electricity sources has a potential competitive economic advantage when compared to processes that utilize solely renewable sources for electricity. Regarding hybridization with the use of H2 in turbines of combined-cycle power plants, ref. [] showed the feasibility of realizing a 100% renewable energy system in Germany. The results indicated a cost–benefit analysis in favor of CCGTs compared to fuel cells and gas engines. The results showed that H2-powered CCGTs had a lower cost than SNG-powered CCGTs, both in terms of long-term and short-term storage. The best feasibility results were obtained for mixtures of 30% H2 with biogas and open-cycle turbines (OCGT). In this case, the use of biogas compensated for the emission of high amounts of CO2 by using a mixture poor in H2.
Most of the studies that have appeared to date have focused on undertaking a technical-economic analysis of the new P2G technologies (with H2 or SNG), highlighting the cost predictions of the different technologies and their abilities to help integrate and manage future renewable energy surpluses. In contrast, in this research as described below, we analyze the hybridization of P2G systems with existing and adapted combined-cycle power plants. This not only offers the cost advantages of amortized CCGT investments, but also may avoid the balance sheet impairment costs as these become underutilized. For example, most of the CCGT plants in the UK installed between 1995–2010 [] have been operating with very low load factors (less than 40%) compared to those initially foreseen (>60%) []. These plants may have an opportunity of a more extended useful life with the hybridization of P2G systems.
The paper proceeds as follows. In the next section, under the generic heading “Materials and Methods”, we describe the experimental setup, the modelling framework and the UK case study.
2. Materials and Methods
2.1. Motivation: CCGT Load Factors and Large-Scale Renewable Curtailments
The analysis is based upon a hybrid renewable surplus power-to-gas-to-CCGT model. The UK market is taken as a reference owing to its potential for generating a large surplus of renewable energy by means of wind power, as well as the demise of many legacy CCGT units.
Load Factors. The UK has a large fleet of CCGT plants, most of them built between 1995 and 2010. In many cases, these plants are already, or close to being, amortized. The official data on load factors [] show distinct periods of performance: a period from 1996 to 2000 with load factors greater than 70% (with a maximum of 84% in 1999 followed by the period 2000 to 2010 in which the load factors of the CCGT plants gradually decreased but remained in the range of 70–60%); then there was a more pronounced decline until 2015 with load factors ranging from 32% to 28%. From 2015 onward, the load factors of the CCGTs have been in the range of 50% to 35%, with the result that some have been converted to OCGTs to focus upon peaking and reserve services. Figure 1 shows CCGT load factor and system load factor between 1996 and 2020.
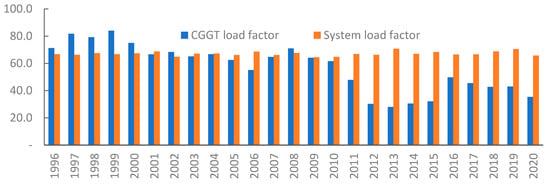
Figure 1.
CCGT average load factor (%) and System average load factor (%) in UK.
Renewable curtailment. According to [] during 2020, wind farms supplied 69 TWh of electricity for the UK, but this could have been much more; 6% of Britain’s wind output had to be curtailed because it could not be transported to consumers on the electricity network. Figure 2 shows the evolution of the wind curtailment over the period 2010–2020, and also includes a linear projection into the future until the year 2035. COVID-19 restrictions in 2020 reduced demand and increased curtailments remarkably. The wind curtailment represents a potential opportunity for power-to-gas systems.
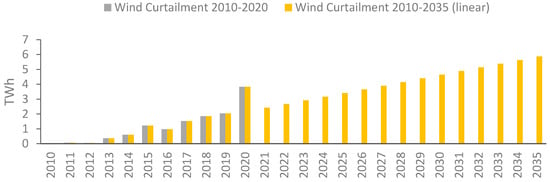
Figure 2.
Wind curtailment (TWh) between 2010–2020 and linear forecasts to 2035 (without taking into account 2020 due to COVID-19).
2.2. Model Specification
The modeling scheme is shown in Figure 3.
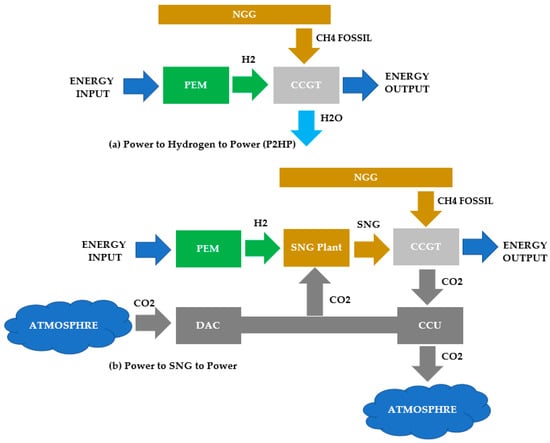
Figure 3.
Modeling scheme for (a) P2HP configuration without CCU and DAC. (b) PSNGP with CCU and DAC required for 100% of SNG CCGT.
The specification includes one green hydrogen generating plant using proton exchange technology (PEM), which can deliver H2 directly to a CCGT (P2HP configuration) or send it to the SNG generation plant based on a Sabatier reactor (PSNGP configuration). The combined-cycle plant (CCGT) produces electricity with the fuels generated by the H2 and SNG plants and can also use a proportion of natural gas. For the PSNGP configuration, the CCGT plant needs a CO2 capture and utilization plant (CCU) that captures the 90% of CO2 produced by the CCGT operation and transfers it to the SNG plant to be able to produce synthetic methane. That means that 10% of the CO2 produced by CCGT is emitted into the atmosphere. Finally, one direct CO2 capture plant will be required only when the CCGT’s ability to capture CCU does not contribute sufficient CO2 for SNG production (a setting that will be required only for the specification 100% SNG fueling the CCGT).
The productive stages of the energy vectors (H2 or SNG) are as follows. In the first step, hydrogen (P2HP) is generated. In the second step, the hydrogen generated is being transformed into synthetic methane (SNG). Synthetic methane (SNG) can also provide fuel for the CCGT. The model allows flexibility to consider partial flows of different types of fuel gas for the CCGT. The relationships among the exchange flows between the specified plants are summarized in Table 1.

Table 1.
Material and energy flows of each plant in the model.
2.3. Technology Details
The generation of H2 by means of electrolysis using PEM electrolysis is a well-known process that has been studied for several years and there are many publications on the state of the art. PEM electrolysis has the following characteristics: high efficiency at a high-power density; high product gas quality, even at partial loads; low maintenance and reliable operation; and no production of damaging chemicals or impurities. To carry out this work, the information compiled by the Department of Energy (DOE) of the US in its 2019 report [] has been used as a reference. This report contains a rigorous stakeholder-vetted, techno-economic analysis, which was performed to assess the cost of hydrogen produced using state-of-the-art polymer electrolyte membrane (PEM) electrolyzers, if manufactured to scale.
An engineering system performance model was developed from the baseline inputs so as to create a generalized electrolyzer system engineering design, notwithstanding the diverse industry inputs from the electrolyzer manufacturers. The main parameters of the H2 generation plants with PEM technology used in the model are shown in Table 2.
Table 2.
Setup of PEM Plant [].
In a PEM plant, H2 is produced by the electrolysis of water by applying an electrical current through an electrode. The inlet currents of a plant of this type are process water and electrical energy. A water treatment system and power electronics systems with transformers and rectifiers are typically included. The cell in which the electrolysis is carried out (dissociation of H2 and O2 from the H2O molecule) is composed of the electrode stack (generally platinum), sensors and a control system. There is also a management system for the gases generated (O2 and H2).
With regard to the SNG plant, several studies have been carried out. Since this work focuses on attempting to integrate P2G technologies into a CCGT, Becker, Penev and Braun (2019) [] are taken as the main reference. This reference presents an SNG plant design and a techno-economic analysis of its performance in producing SNG using a Sabatier reactor by reacting renewably generated hydrogen using low-temperature electrolysis with captured carbon dioxide. The main parameters of the SNG plant are shown in Table 3.
Table 3.
Set-up of SNG-Plant [].
For the CCGT, the information provided by the United Kingdom’s Department for Business, Energy and Industrial Strategy (BEIS) [] has been taken as a reference. The costs of planning, construction, operation and carbon emissions, reflecting the cost of building, operating and decommissioning a generic plant for each technology, has been considered for the year 2025. With regard to our study, the CCGT parameters have been taken into account without a CO2 capture-and-use system (CCU) in the P2HP configuration, and with a CO2 capture-and-use system (CCU) in the PSNGP configuration. The fundamental parameters of the types of CCGT used are shown in Table 4.
Table 4.
Setup of CCGT plants for the year 2025 [].
With regard to the investment costs in the CCGT, we start from a hybridization scenario in which the CCGT is already installed and amortized, and the investments to be made are only those necessary to allow hybridization with P2G systems as appropriate.
For the P2HP configuration, depending on the amount of H2 to be processed in the turbine, the necessary modifications may involve changing the gas turbine for high amounts of H2. In [], several simulations on hydrogen combustion in gas turbines were made. Their study showed the effects of running pure hydrogen fuels in a large-size gas turbine designed for running natural gas. The authors found three relevant effects of using hydrogen as a fuel: a variation of enthalpy drop, a variation of inlet volume flow rate and a variation of the heat-transfer coefficient on the turbine blades. A higher temperature stream from burning hydrogen caused performance decays in the cooling blades. The current state of the art from the main turbine manufacturers (Mitsubishi, General Electric, Siemens, ...) [,,,,,,,,], indicates that it possible to process close to 30% by volume of H2 in the large turbines (CCGTs greater than 1000 MW with H-class turbines) installed since 2000, and it is claimed that the operation of the turbines with 100% of H2 will be reliable by 2030. The analyzed P2HP model uses an H2 contribution of 100% and, therefore, the need to make the pertinent changes in the CCGT had to be considered, including the necessary turbine, control and regulation systems when H2 contribution is greater than 30% [,,].
The investment cost of replacing a turbine and of the control and regulation systems has been conservatively estimated at 50% of the cost of the BOP of a new construction plant in accordance with the U.S. Department of Energy [] for the construction of a CCGT of more than 1000 MW. For a CCGT hybridized with a P2HP system in which it will be necessary to change the turbine, the investment cost is estimated at 50% of the cost for a new CCGT, assessed as 600 GBP/kW []. In the PSNGP configuration, it will not be necessary to replace the CCGT turbine, but it will be necessary to install a CCU system with an investment cost of 900 GBP/kW, as inferred from the first-of-a-kind (FOAK) scenario for a CCGT with CCU []. It should also be noted that there are relevant differences in fixed O&M costs and insurance costs between the CCGT configuration with and without CCU.
The CCU system coupled to the CCGT plant in the PSNGP configuration will capture the CO2 required for the synthesis of the SNG, although, given that the efficiency ratio in CO2 capture is 90% in the full load operating scenario, the SNG plant will need an extra amount of CO2 since the CCU is not capable of providing all the necessary CO2. Only in this case (a 100% load in PSNGP), therefore, has a direct CO2 capture plant (DAC) been arranged, the main parameters of which are depicted in Table 5 [].
Table 5.
Setup of direct air capture CO2 plant [].
The cost of dismantling CCGT plants is usually modest compared to, for example, nuclear or offshore wind plants, but it is one more variable that will be analyzed before investing in hybridizing existing CCGT plants that are close to the end of their theoretical useful life. To take some references to decommissioning costs, the work carried out by Remi in 2017 [] and the IEA Projected Costs of Generating Electricity report in its 2020 edition [] have been selected. Figure 4 includes a comparative graph between the cost estimates calculated with the references [,] in three scenarios (maximum, medium and minimum). These values will serve as a reference when analyzing the opportunity cost of investment in hybridization or decommissioning of CCGT plants.
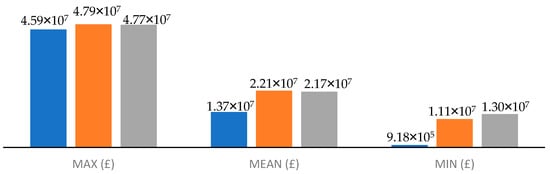
Figure 4.
Decommissioning cost (GBP) for 1200 MW CCGT plant according Remi [] and IEA Projected Costs of Generating Electricity 2020 [].
It is not the purpose of this work to address the technical limitations of the use of hydrogen and hydrogen/syngas mixtures, although they constitute a challenge for the development of the P2HP and PSNGP systems. Taking as reference the compilation of the current state of the art in the areas of large-scale transport and the end uses of hydrogen–methane gas blends by [], the configurations of the P2HP and PSNGP models were chosen. In [], some of the risks and drawbacks that hydrogen brings to the energy system were described. Long-term hydrogen embrittlement is a risk in pipelines carrying hydrogen since failures that are due to hydrogen embrittlement can be catastrophic. It must be taken into account that natural gas networks are made up of production, transmission and distribution lines, all of which differ in their age in service, operating conditions and equipment size, with different materials, compositions and impurities. These all require careful prior studies and monitoring to support the large-scale use and long-term transport of hydrogen through pipelines without embrittlement problems. For the above P2HP model, only with the use of 100% H2 in the turbine has it been considered to undertake a full replacement. The use of 100% H2 will require previous compatibility studies of the materials in the gas supply pipelines or else, to avoid this, the configuration would need to be co-located with the H2 generation plant next to the CCGT. Our study has therefore focused on this co-location. In the case of the PSNGP model, the use of mixtures of SNG and fossil natural gas does not present relevant problems, neither in the gas supply network nor in the main equipment, given the similarity of properties of both gases.
2.4. Case Studies
The case studies comprised a technical and economic analysis of the feasibility of the hybridization of P2HP and PSNGP technologies with existing CCGTs. The technical parameters selected were a reduction of CO2 emissions, the amount of energy input required in each configuration and the number of H2 and SNG generation plants required. The economic parameters studied were the investment cost and the effectiveness of the investment as regards to reducing CO2 emissions in the two configurations shown (P2HP and PSNGP).
To analyze the profitability conditions of the P2HP and PSNGP configurations, three representative scenarios of the load factors have been selected in the three different periods in which the CCGT plants have been operating, according to data provided by the British government regarding load factors []. That is, a scenario of 77% load factor representative of the years 1996–2000 (HIGH), another scenario of 55% load factor in the years 2001–2010 (MEDIUM), and a third scenario of 31% load factor corresponding to the period from 2011–2021 (LOW). A maximum load factor scenario (100%) has also been included for a CCGT to assess the maximum amount of power that could be used with the P2G hybrid systems. The IRR is not a criterion but is an economic P90 value-at-risk constraint, i.e., a 12% IRR with a probability at least 90%. To estimate this, Monte Carlo simulations have been performed with the Palisade® @Risk 8.2 software [].
The profitability analyses of the P2G models were assessed by calculating the difference in values between the market price at which it is necessary to sell the energy generated by the CCGT and the purchase price of the primary energy (surplus if it were available). This difference between the sales value to the market and the purchase of the primary energy was denominated as delta (Δ) and studying it made it possible to discover the market scenarios that offered the expected profitability in each case for the P2HP and PSNGP configurations. On occasion, negative energy prices occur in the UK, as in Germany and elsewhere, because of renewable surpluses of energy. We not only take into account negative surplus purchase price scenarios, but also non-surplus energy purchase values, even the high prices (50, 100, 150 and 200 GBP/MWh) as seen in 2021. The profitability analyses of the P2HP and PSNGP configurations established the delta (Δ) values that obtain the profitability acceptance criterion of IRR > 12% at P90.
Finally, a joint evaluation of the technical and economic parameters has been carried out, which made it possible to clarify the scenarios with the highest expectation of feasibility of both configurations. Table 6 summarizes the 80 cases analyzed (16 for P2HP and 64 for PSNGP).
Table 6.
Cases analyzed (80) according to configuration, CCGT load and fuel proportion.
From the economic-financial point of view, the setup of the adjustments required for the analysis is shown in Table 7. Conservative values have been taken for the discount rate (12%) and the investment analysis period (20 years), which are shorter than the useful life of the plants (between 25 and 40 years). The amortization period of the plants is also conservative (10 years). To favor the hybridization and integration of renewable energy, the legacy CCGTs have been assumed to have already been amortized, signifying that the investment to be made is substantially less than that for a new CCGT. The use of an already-amortized CCGT is representative of the state of a large part of the CCGTs installed in the UK and many European countries. Conservatively, no tax exemption has been considered in the model and a tax rate of 30% has, therefore, been established. However, it is possible that a scenario of energy transformation could raise possible tax incentives in new generation plants, such as the PEM plant and the SNG plant. With regard to the financing of debt, an interest rate of 10% was considered.
Table 7.
Economic setup.
The exogenous conditions are the following, as indicated in Table 8. For the estimation of the probability functions of the carbon allowances and price of natural gas, the central scenarios of the forecasts provided by OFGEM and UK BEIS have been taken for the period between 2015 and 2025.
Table 8.
Exogenous conditions, probability function and their sources.
3. Results
The following sections present the results obtained for the operation of the P2HP and PSNGP models. In the case of the P2HP configuration, the use of different mixtures of H2 with fossil natural gas and H2 with SNG have not been developed, since only with a high percentage of H2 (96.52%) does the P2HP model meet the 2030 emissions targets. It implies that its results would be very similar to those of 100% H2.
3.1. CO2 Emission Reduction
There are differences in the fuel combustion process. In PSNGP, the CO2 generated must be practically the same as that of a classic CCGT that operates with natural gas, although the CO2 emitted is lower with an additional CCU system. Overall, the CCU system allows PSNGP to have lower CO2 emissions than P2HP, except when burning 100% of alternative fuel. In that case, P2HP does not emit any CO2 because the H2 combustion reaction is carbon free and the P2HP configuration does not have a CCU system.
Only the P2HP configuration with 100% of H2 allows 100% CO2-free emissions. In no case can the configuration of the PSNGP have zero CO2 emissions, since the CCU system installed in the CCGT has an efficiency of 90%. When 100% SNG is used, the need for the CO2 required by the SNG plant is greater than the CO2 captured by the CCU system and it is necessary to have an extra supply of CO2. This can be achieved by using a direct CO2 capture plant (DAC). The use of the DAC plant makes it possible to lower the amount of the total emission intensity to 9 Kg CO2/MWh, but at a cost.
As indicated in Figure 5, the most effective configuration for CO2 emissions in CCGT production is P2HP, with 100% of H2 in the CCGT turbine, followed by the configuration of PSNGP with 9 Kg CO2/MWh. Both cases are low in the context of the objective of net zero by 2030 (50 Kg CO2/MWh) [].
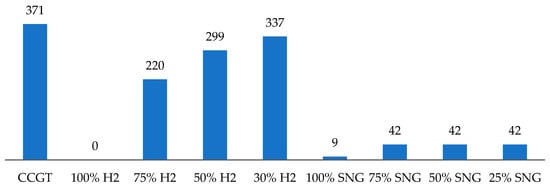
Figure 5.
CO2 emissions intensity (Kg/MWh) for different fuel proportions.
The results obtained for the total CO2 emissions of the PSNGP model with different turbine load factors for a 1200 MW CCGT and alternative fuel mixtures are shown in Figure 6. If 100% SNG is used in the CCGT, the CO2 emissions are much lower than those obtained for the rest of SNG–fossil natural gas mixtures. In the cases in which SNG–fossil natural gas mixtures are operated, it should be noted that the same emissions are obtained for all the proportions of mixtures analyzed. The reason is that the methanization plant works at a 100% load for all CCGT load levels, which implies that the size of the methanization plant determines the consumption of natural gas.
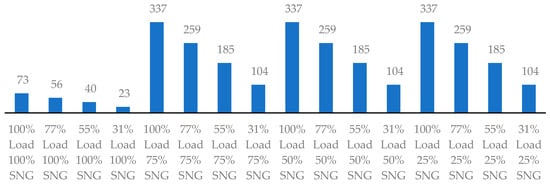
Figure 6.
CO2 emitted (Mt/year) for several load factors of 1200 MW CCGT and PSNGP. P2HP has not been included since combustion when using 100% H2 does not emit CO2.
3.2. Investment Cost Analysis
The number of H2 and SNG generation plants required (Figure 7a,b) for each configuration (P2HP and PSNGP) has been calculated based on the load factor boundary conditions in the 1200 MW CCGTs considered (100%, 77%, 55% and 31%) and the several fuel blending options. With the PSNGP configuration operating at full load requiring the installation of more than 33 PEM plants and 41 SNG plants, there would be a total of more than 74 new plants. For the rest of the operating scenarios (77%, 55% and 31% load) the number of plants is proportional to the load factor and the alternative fuel proportions used. For the P2HP configuration with 100% of H2, one new PEM plant needs to be installed for every 3.294% increase in the operating load factor. For the PSNGP configuration, the plants required for the load variation depends on the load factor and the proportion of SNG used. See Table 9.
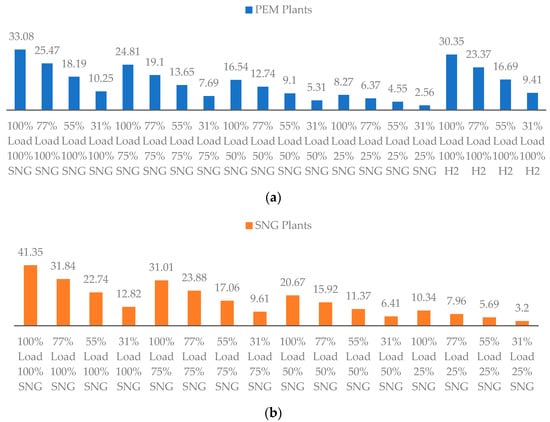
Figure 7.
(a) Number of H2 plants (PEM plants) required for P2HP and PSNGP for several load factors for a 1200 MW CCGT and fuel proportions. (b) Number of SNG plants required for P2HP and PSNGP for several load factors for a 1200 MW CCGT and fuel proportions.
Table 9.
Load (%) required for one PEM plant more in PSNGP configuration.
In Figure 8, the order of investment costs is as follows. The first four clusters (from the left) correspond to the PSNGP configurations using 100% SNG, 75% SNG and 50% SNG as fuel. The P2HP configuration that uses 100% H2 occupies the fourth position and its investment is 38% less than that required for PSNGP with 100% SNG. The last position is occupied by the PSNGP configuration that uses 25% of SNG. The differences in investment costs penalize the economic viability of the PSNGP configuration and also force us to reflect on the complexity and impact of this configuration when compared to P2HP.
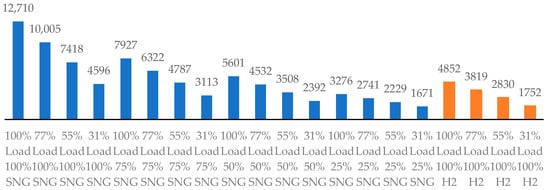
Figure 8.
Investment costs (millions GBP) for P2HP and PSNGP hybridization of a legacy facility for several load factors and fuel blendings.
When the investment costs of the proposed P2HP and PSNGP hybridizations in a legacy facility are compared to the value of the investment cost of new equivalent 1200 MW CCGT plant hybridized with P2HP or PSNGP (Figure 9), the investments are substantially greater for the new builds. To calculate the cost of investment in a new hybridized plant, the maximum costs indicated in [] (Figure 4) to decommission an old existing CCGT have also been used. For a new 1200 MW CCGT hybridized PSNGP plant operating at full load with 100% alternative fuel, the investment is about 2.5 times that required for a new hybridized P2HP plant under these conditions.
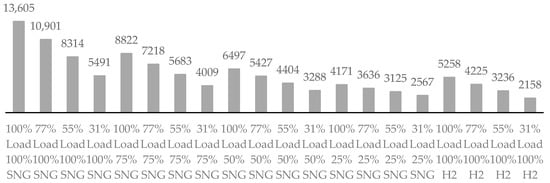
Figure 9.
Investment costs (millions GBP) for new build of 1200 MW CCGT with P2HP and PSNGP hybridization for several load factors and fuel blendings.
On the other hand, if the investment costs of hybridizing legacy facilities of 1200 MW CCGT are compared with the investment costs required for a new 1200 MW CCGT hybridized (Figure 10), it is clear that, in all the load factor cases and fuel mixtures analyzed, the investment costs are always more favorable to upgrading (hybridizing) legacy facilities.
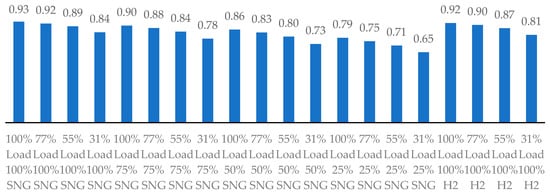
Figure 10.
Ratio of hybridization legacy facility investment costs vs. new-build facility costs for several loads and fuel blending.
3.3. Evaluation of Primary Energy Required for P2HP and PSNG Configurations
The amounts of surplus (and non-surplus) energy that can be utilized in the facilities are shown in Figure 11a,b, compared to their outputs. Recall that the total energy production in the P2HP and P2SNGP configurations is not equal, since the PSNGP has a penalty as regards the nominal power of the CCGT owing to the installation of the CCU system, which requires 144 MW. The CCGT of the P2HP configuration has a capacity of 1200 MW when compared to the 1056 MW of the PSNGP model.
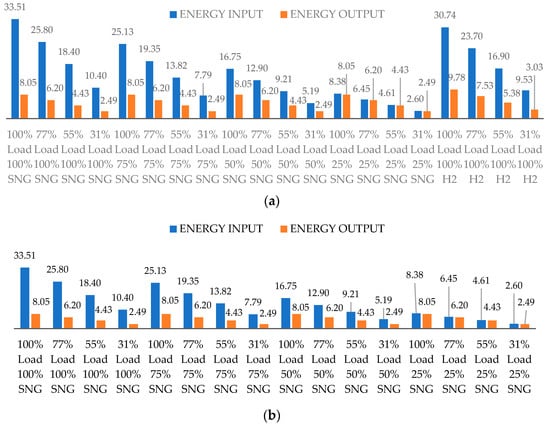
Figure 11.
(a) Primary energy input and final energy produced (TWh/year) in the CCGT for P2HP at several loads. (b) Primary energy input and final energy produced (TWh/year) in the CCGT for PSNGP at several loads.
In Figure 12, we display these as ratios. Note that they are not thermodynamic process ratios, but market ratios, that is, an assessment of using energy that is surplus at a given moment (curtailment) and returning energy to the market with reduced CO2 emissions.
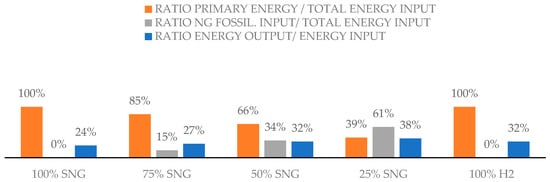
Figure 12.
Energy performance ratios in PSNGP and P2HP configurations.
If a comparison is made of the input energy required in the model (Figure 11a,b) with respect to the estimate of wind curtailment for the period 2021 to 2035 (Figure 2), it is clear that the values of wind curtailment in the years 2022, 2031 and 2032 could meet the primary power needs of the PSNGP 25%SNG@31%load, 25%SNG@55%load and 50%SNG@31%load cases. These calculations and the projections of TWh wind surplus suggest that several legacy CCGT units smaller than 1200 MW (400–600 MW) with low load factors, could continue to work with this recovered energy, particularly as its storage capability will mean that it will be most useful at seasonal peak times.
3.4. Market Conditions for the Profitability of P2HP and PSNGP Hybridizations
This section analyzes the conditions under which profitability is obtained for the H2 and SNG power-to-gas models operating at several load factors. To assess the profitability analysis of the P2G models, the difference between the values of the market price at which it is necessary to sell the energy generated by the CCGT and of the purchase price of the primary energy was calculated. This difference has been denoted as delta (Δ) and allows us to identify those market scenarios that provide profitability to each model. The analysis was carried out this way to avoid estimating the energy surplus prices. To analyze the market conditions that can provide investment profitability (established in our analysis at IRR > 12% with a probability of 90%), the behavior of the values of delta (Δ), price of primary energy (e.g., wind surplus) and cost of production of the CCGT in the P2HP and PSNGP configurations versus the variation in electricity market prices were calculated.
3.4.1. P2HP and PSNGP Configuration with Full Alternative Fuel in Turbine at Several Loads
When 100% alternative fuel is used, each model (PSNGP and P2HP) behaves homogeneously for the analysis of the delta (Δ), energy input price and CCGT production cost (Figure 13, Figure 14, Figure 15, Figure 16, Figure 17 and Figure 18) despite working at different load factor levels (100%, 77%, 55% and 31%). However, the PSNGP configuration needs a higher delta and this increases as the market prices increase. Figure 13 represents the minimum average delta values necessary for a positive operational trading profit, as distinct from an investment return greater than 12% IRR (Figure 14), as a function of the final energy sales prices. These deltas of around 100 GBP/MWh are high but not unreasonable seasonal spreads between low summer prices for wind surplus and high winter peak demand prices. In practice, the sizing of these facilities will depend upon how many TWh are available at these average spreads.
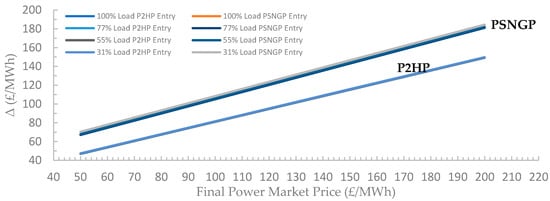
Figure 13.
Delta minimum values (Δ) necessary for a positive operational trading profit based on the market price for the P2HP and PSNGP with full alternative fuel.
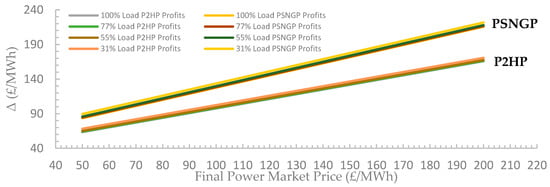
Figure 14.
Delta values (Δ) necessary to obtain the expected return based on the market price for the P2HP and PSNGP with full alternative fuel.
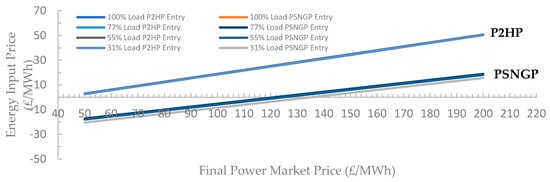
Figure 15.
Energy input price (GBP/MWh) necessary make a positive operational trading profit in the final market based on the market price for the P2HP and PSNGP with full alternative fuel.
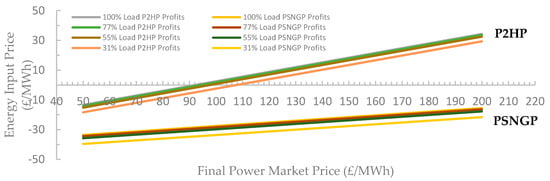
Figure 16.
Energy input price (GBP/MWh) to obtain the expected investment return based on the market price for the P2HP and PSNGP with full alternative fuel.
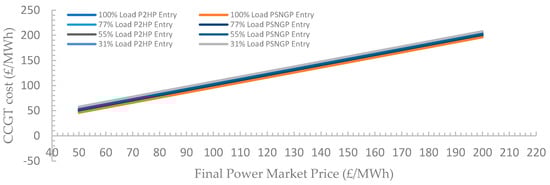
Figure 17.
CCGT production cost (GBP/MWh) necessary to sell in the final power market based on the market price for the P2HP and PSNGP with full alternative fuel.
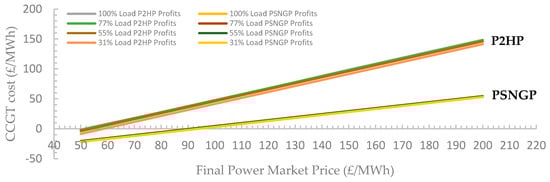
Figure 18.
CCGT production cost (GBP/MWh) to obtain the expected investment return based on the market price for the P2HP and PSNGP with full alternative fuel.
An alternative display of these results is in Figure 15 and Figure 16 in which the energy input price is compared to the output price. The need for negative input energy prices implies the need for high energy surpluses for PSNGP at low market prices. This also applies for P2HP investment profitability. It may be that our investment criterion of 12% IRR at P90 is overestimated for the first of a kind (FOAK) and we would certainly expect this to come down as these technologies become more established.
When the production costs are analyzed (Figure 17 and Figure 18), it can be observed that, as expected, the minimum necessary production costs of the CCGT (Figure 17) for operational contribution are practically the same in both configurations (PSNGP and P2HP) at the final power market selling price.
When the production costs of the CCGT are analyzed in the context of seeking to meet the target investment profitability objective (IRR > 12% at P90), significant differences are observed between the PSNGP and P2HP models (Figure 18). The P2HP configuration permits higher production costs in the CCGT, while the PSNGP configuration needs lower production costs to reach the target profitability. The differences in production costs between the two power-to-gas configurations increase as market prices increase. Evidently, the P2HP model does not have as strong a need for margins between CCGT production costs and market prices as the PSNGP configuration.
Overall, the results shown in Figure 12, Figure 13, Figure 14, Figure 15, Figure 16, Figure 17 and Figure 18 point to increased opportunities for the profitability of both the P2HP and PSNGP configurations as market prices and market volatility (deltas) increase, and these are indeed likely trends in the market dynamics.
3.4.2. PSNGP Configuration at Several Load Factors with Fuel Blending
Figure 19 summarizes the PSNGP configurations that obtain the lowest delta (Δ) based on the market price with the expected investment return for loads (100%, 77% 55% and 31%) and several SNG fuel mixtures (100%, 75%, 50% and 25%). Given that the PSNGP model operates with a number of SNG plants, granularity in the overall blending mixtures is quite possible. The detailed graphs of each case can be found in Appendix A.
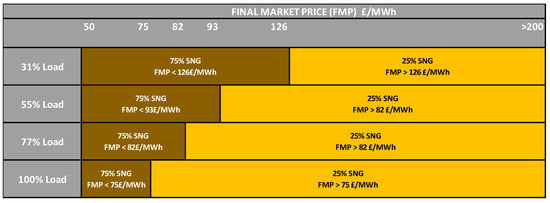
Figure 19.
Power market prices to obtain lower delta values (Δ) at different load levels of PSNGP and several SNG fuel blendings to achieve the target investment profitability.
When the input energy purchase prices are analyzed (more detail in Appendix A, Section Appendix A.2), it can be observed in Figure 20 that for a large part of the final market price range studied (50 to 200 GBP/MWh), in all load cases (100%, 77%, 55% and 31%) and for various proportions of SNG in the CCGT, it is necessary that the input energy prices be negative, that is, that the renewable energy should be surplus. However, the conditions of high final prices are markets with high energy demand in which surpluses are not usually generated; that is, in some cases the PSNGP models require two mutually exclusive conditions to be met in principle. On the one hand, they need high energy surpluses that allow them to acquire abundant input energy at negative prices and, on the other hand, they need high final market prices at which to sell the energy generated by the CCGT.
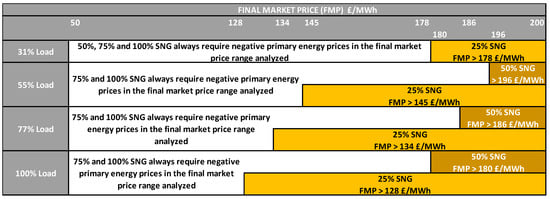
Figure 20.
Energy input price (GBP/MWh) at different load levels of PSNGP and several SNG fuel blendings to achieve the target investment profitability.
Finally, regarding the production costs for the CCGT, it is verified that they increase as the proportion of SNG used decreases (more details in Appendix A, Section Appendix A.3). For the load factor cases studied (100%, 77%, 55% and 31%), the production costs are decreasing as more alternative fuel is used. The highest production costs are obtained with 25% SNG, followed by 50%, 75% and 100% SNG.
It might have been thought that the cost of production increases with the decrease in alternative fuel used because of a penalty in CO2 emissions, but the results obtained have been calculated with the aim of obtaining the profitability criterion (IRR > 12% with 90% probability). Therefore, the values of delta (Δ), prices of primary energy and production costs obtained are conditioned by it. In other words, the delta (Δ) values obtained to be profitable imply in several cases that the input energy purchased must be surplus with a negative price low enough to mitigate the costs of generating H2 and SNG, and the production cost of the CCGT.
3.4.3. Operational Summary for P2HP and PSNGP Plants
Based on the above analysis, Figure 21 summarizes the P2HP and PSNGP configurations that could be most attractive depending on the load factors and the final selling prices of the energy produced in the market.
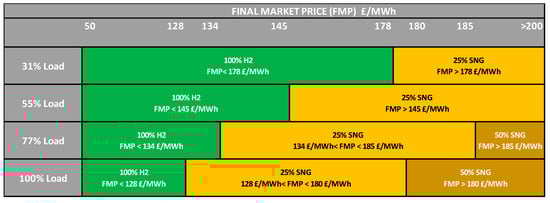
Figure 21.
Preferred operations for P2HP and PSNGP.
The P2HP configuration operating with 100% H2 would be preferable in the low price range at the four load factor levels studied (low, medium, high and full). With high market prices, the PSNGP configuration with a low proportion of alternative fuel (25%) would be preferred. Only for the case of full load (100%) and high load factor (77%) and for high energy prices would the PSNGP configuration with a higher proportion of SNG (50%) be recommended. If CCGT plants continue to operate with load factors similar to those that are most recent and market prices remain high, PSNGP hybridization could be a reasonable hybridization alternative with lower cost to integrate surpluses or curtailments of the system, and extend the life of the CCGTs, complying with the requirements of reducing CO2 emissions in the 2030 horizon (50 Kg CO2/MWh).
4. Discussion
Gas turbines that are fully or partially powered by H2 would act as cost-competitive flexibility providers through the conversion of hydrogen into electricity for 15 European countries oriented toward a zero level of emissions by the year 2050 and can be competitive when there is a strict cap on CO2 emissions []. By 2030, the emission of high amounts of CO2 would still be allowed (50 Kg CO2/MWh in the UK according to the Net Zero Strategy []), but the high percentage of H2 required (96.52%) in the P2HP model to meet the 2030 emissions targets implies that the P2HP configuration would have to be fully powered by H2. On the other hand, PSNGP hybridization can be fully or partially powered by SNG and meet the decarbonization goals set for 2030, but its investment costs are higher than those of P2HP.
The energy inputs (surplus if prices are negative) are very high for the production of H2 and SNG operating at 100% load factors with high amounts of renewable fuels (H2 and SNG). This represents a high requirement to integrate surplus energy. The cases with more capacities to integrate surplus renewable energy (or energy inputs with insufficient surpluses) logically occur when 100% of alternative fuel is used at full load in P2HP and PSNGP. For the UK, several of the legacy CCGT facilities can cover a high percentage of the projected storage needs, although it is necessary to install a high number of PEM and SNG plants. The comparison of the cases analyzed has, to this point, clearly shown the advantages of the P2HP configuration with respect to the PSNGP, as it requires less investment effort and greater simplicity in the deployment of the P2HP strategy owing to the fact that fewer power plants and less gas generation are required. However, in this analysis, some barriers that may be important have not been taken into account, one of the most important being the adaptation of the gas network [] to process high concentrations of H2. This is why the approach of the implementation of the P2HP configuration should be carried out in locations close to the CCGT plant sites. This is in line with the UK government’s strategy to deploy H2 as an energy vector, as outlined in [].
5. Conclusions
In this work, we have analyzed the hybridization of P2G systems with existing and adapted combined-cycle power plants. Our work has a different approach to that carried out in [], which also undertook a complete feasibility analysis of the potential of H2 but used biogas in open-cycle power plant turbines (OCGT). The use of OCGT allows very fast starts and helps the flexibility of operation of the electrical system. Our work focuses instead on the comparative analysis of the integration of legacy CCGTs and the new P2G systems (H2 and SNG), but without using biogas and the needs of underground sites identified in []. In [], the feasibility results were positive for the use of a mixture of 30% H2 and biogas. In our analysis, the best results were obtained for 100% H2 (P2HP) in the lower price range and, for high market price, the PSNGP configuration with a low proportion of alternative fuel (25%) would be preferred. Considering [,], the gas network may have impediments to process high amounts of H2 in certain seasons of the year depending on the concentration of natural gas and H2 present, and this may constitute another barrier for the deployment of the strategy P2HP if the H2 generation centers are far from the CCGTs.
In general, to guarantee the profitability criteria assumed, the P2G configurations require a high difference between the market selling prices and the purchase prices of primary energy if the electricity market prices are high, signifying that electricity markets with low price volatilities over the year may not be favorable. When comparing both configurations, it will be noted that the PSNGP model needs higher values of this difference than the P2HP model. It is possible that, from the point of view of production management, scenarios with negative prices could occur in a timely manner in a market with generally high prices, but only if there are very intense changes in the energy supply, with periods of high power outputs and others of high scarcity. The study carried out in this work does not directly address how adaptable the P2G configurations will be to the existing electricity market in the UK in the near future, although some basic exogenous conditions must be considered when analyzing the results. Finally, we should observe that only the P2HP that uses 100% H2 meets the UK targets under the central scenario assumptions for 2030 and 2050.
In conclusion, we observe that surplus renewable energy could be used to generate energy vectors of gas (power to gas) such as H2 and SNG. These gases could later be used in plants with known and reliable technologies, such as existing CCGTs. Furthermore, there is a business need from the owners of CCGTs working with low load factors to extend their economic viabilities. A comparative analysis of the integrations of technologies of the new P2G systems (H2 and SNG) with the CCGT plants has been carried out, which demonstrates the potential and feasibility of both the P2HP and PSNGP configurations.
The most effective configuration as regards reducing CO2 emissions from CCGT production is P2HP with 100% of H2 in the CCGT turbine with an emission intensity of 0 Kg/MWh of CO2, followed by the PSNGP configuration with 100% of synthetic methane in the turbine with 9 Kg/MWh of CO2. If the objective pursued is to emit as little CO2 as possible (100% alternative fuel in the turbine), the PSNGP configuration requires the installation of a greater number of gas generation plants (H2 and SNG), and therefore a higher investment cost than the P2HP configuration. These large differences in investment costs penalize the economic viability of the PSNGP configuration and also make it necessary to reflect on the complexity and impact of this strategy. Furthermore, the P2G hybridizations with legacy CCGTs require a lower investment effort, in general, compared to the construction of new CCGTs. We have shown that the circumstances in which there are high market prices and high spreads between periods of low or negative prices and high seasonal peak prices are most conducive to the profitability of these hybridized systems. We conjecture that indeed the future is likely to be one of high gas prices and volatility and that the longer-term seasonal storage offered by hydrogen in particular will have a role to play in the energy transition.
The work carried out in this manuscript does not analyze possible investment incentive measures from the point of view of energy policy that may constitute ways to accelerate the conversion and hybridization of legacy CCGTs to the P2HP or PSNGP models. This analysis may constitute an opportunity from the point of view of energy policy to focus on the best strategy that allows a rapid and efficient transition toward new forms of energy generation with low CO2 emissions. Some of these strategies could support investment in carbon capture, use and storage, setting up a revenue mechanism to attract private-sector investment in industrial carbon-capture and hydrogen projects. The business models identified in this research would be amenable to support these projects. Other support strategies could be the allocation of subsidies to the production of renewable gases (H2 and SNG) or subsidies to the transformation of existing CCGT plants.
Author Contributions
Conceptualization, G.D.-G., D.B. and J.I.M.-H.; methodology, G.D.-G.; software, G.D.-G. and C.J.G.-C.; validation, G.D.-G., J.I.M.-H. and C.J.G.-C.; formal analysis, G.D.-G. and C.J.G.-C.; investigation, G.D.-G. and C.J.G.-C.; resources, G.D.-G.; data curation, C.J.G.-C.; writing—original draft preparation, G.D.-G.; writing—review and editing, D.B. and J.I.M.-H.; supervision, J.I.M.-H. All authors have read and agreed to the published version of the manuscript.
Funding
This work was supported in part by the (Ministerio de Ciencia, Innovación y Universidades/Agencia Estatal de Investigación/Fondo Europeo de Desarrollo Regional, Unión Europea) under Project RTI2018-096108-A-I00 and in part by the University of Castilla-La Mancha under Grant 2021-GRIN-30952.
Institutional Review Board Statement
Not applicable.
Informed Consent Statement
Not applicable.
Data Availability Statement
Not applicable.
Conflicts of Interest
The authors declare no conflict of interest.
Abbreviations
| EIS | UK Department for Business, Energy and Industrial Strategy |
| CCU | Carbon capture and utilization |
| CCGT | Combined-cycle gas turbine |
| DAC | Direct air CO2 capture |
| FMP | Final market price |
| FOAK | First of a Kind |
| NG | Natural gas (fossil) |
| OCGT | Open-cycle gas turbine |
| OFGEM | Office of Gas and Electricity Markets—the energy regulator for Great Britain |
| PEM | Polymer electrolyte membrane |
| P2G | Power to Gas |
| P2HP | Power to hydrogen to power |
| PSNGP | Power to synthetic natural gas |
| SNG | Synthetic natural gas |
Appendix A
Appendix A.1. Delta Values for Different Load Operation (100%, 77%, 55% and 31%) of PSNGP with Several SNG Fuel Blendings (100%, 75%, 50% and 25%)
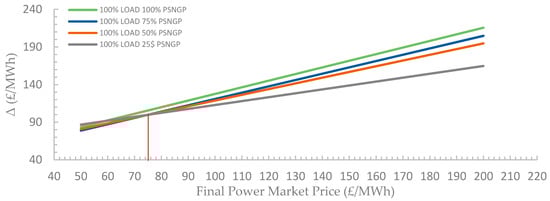
Figure A1.
Delta values (Δ) for full load operation (100%) of PSNGP with several SNG fuel blendings to obtain the expected investment profitability.
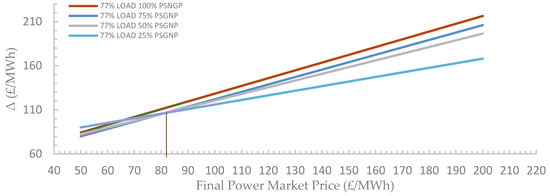
Figure A2.
Delta values (Δ) for high load operation (77%) of PSNGP with several SNG fuel blendings to obtain the expected investment profitability.
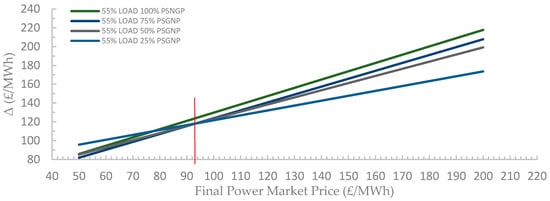
Figure A3.
Delta values (Δ) for half load operation (55%) of PSNGP with several SNG fuel blendings to obtain the expected profitability.
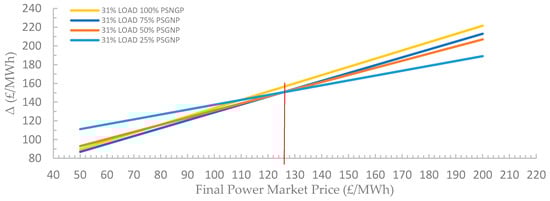
Figure A4.
Delta values (Δ) for low load operation (31%) of PSNGP with several SNG fuel blendings to obtain the expected profitability.
Appendix A.2. Energy Input Prices for Different Load Operation (100%, 77%, 55% and 31%) of PSNGP with Several SNG Fuel Blendings (100%, 75%, 50% and 25%)
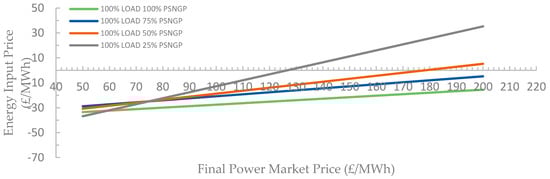
Figure A5.
Energy input price (GBP/MWh) for full load operation (100%) of PSNGP with several SNG fuel blendings to obtain the expected investment profitability.
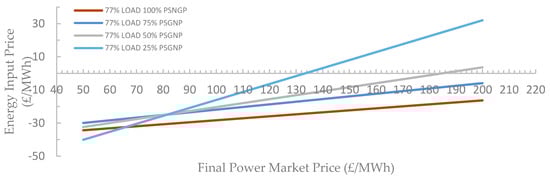
Figure A6.
Energy input price (GBP/MWh) for high load operation (77%) of PSNGP with several SNG fuel blendings to obtain the expected investment profitability.
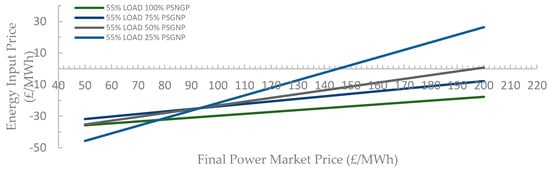
Figure A7.
Energy input price (GBP/MWh) for half load operation (55%) of PSNGP with several SNG fuel blendings to obtain the expected profitability.
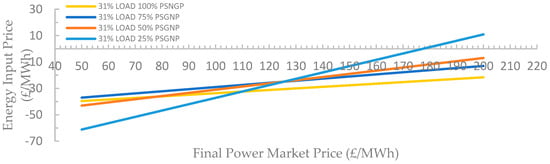
Figure A8.
Energy input price (GBP/MWh) for low load operation (31%) of PSNGP with several SNG fuel blendings to obtain the expected profitability.
Appendix A.3. CCGT Production Cost for Different Load Operation (100%, 77%, 55% and 31%) of PSNGP with Several SNG Fuel Blendings (100%, 75%, 50% and 25%)
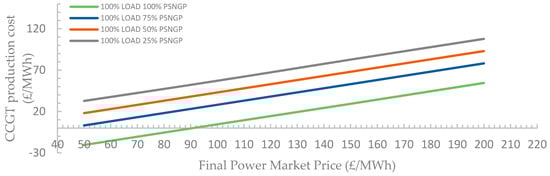
Figure A9.
CCGT production cost (GBP/MWh) for full load operation (100%) of PSNGP with several SNG fuel blendings to obtain the expected investment profitability.
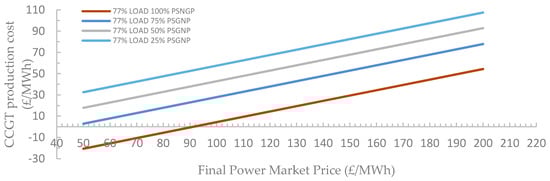
Figure A10.
CCGT production cost (GBP/MWh) for high load operation (77%) of PSNGP with several SNG fuel blendings to obtain the expected investment profitability.
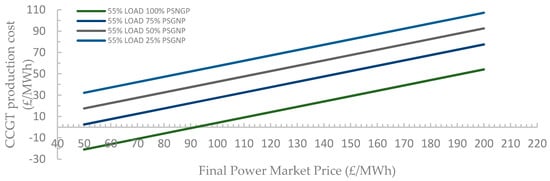
Figure A11.
CCGT production cost (GBP/MWh) for half load operation (55%) of PSNGP with several SNG fuel blendings to obtain the expected investment profitability.
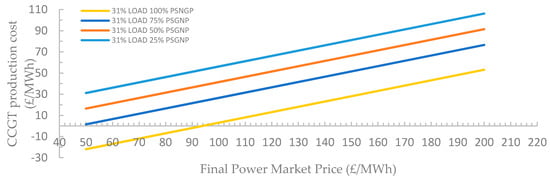
Figure A12.
CCGT production cost (GBP/MWh) for low load operation (31%) of PSNGP with several SNG fuel blendings to obtain the expected investment profitability.
References
- HM Government. Net Zero Strategy: Build Back Greener. October 2021. Available online: https://assets.publishing.service.gov.uk/government/uploads/system/uploads/attachment_data/file/1028157/net-zero-strategy.pdf (accessed on 1 November 2021).
- Cardenas, B.; Swinfen-Styles, L.; Rouse, J.; Hoskin, A.; Xu, W.; Garvey, S.D. Energy storage capacity vs. renewable penetration: A study for the UK. Renew. Energy 2021, 171, 849–867. [Google Scholar] [CrossRef]
- Sterner, M.; Specht, M. Power-to-Gas and Power-to-X—The History and Results of Developing a New Storage Concept. Energies 2021, 14, 6594. [Google Scholar] [CrossRef]
- Specht, M.; Sterner, M.; Stuermer, B.; Frick, V.; Hahn, B. Energieversorgungssystem und Betriebsverfahren. Germany Patent 10 2009 018 126.1, 9 April 2009. [Google Scholar]
- Sterner, M. Bioenergy and Renewable Power Methane in Integrated 100% Renewable Energy Systems: Limiting Global Warming by Transforming Energy Systems. Ph.D. Thesis, University of Kassel, Kassel, Germany, 2009. [Google Scholar]
- Kummer, K.; Imre, A.R. Seasonal and Multi-Seasonal Energy Storage by Power-to-Methane Technology. Energies 2021, 14, 3265. [Google Scholar] [CrossRef]
- Koiral, B.; Hers, S.; Morales-Espana, G.; Ozdemir, O.; Sijm, J.; Weeda, M. Integrated electricity, hydrogen and methane system modelling framework: Application to the Dutch Infrastructure Outlook 2050. Appl. Energy 2021, 289, 116713. [Google Scholar] [CrossRef]
- Lu, Y.; Pesch, T.; Benigni, A. Simulation of Coupled Power and Gas Systems with Hydrogen Enriched Natural Gas. Energies 2021, 14, 7680. [Google Scholar] [CrossRef]
- Willis, R. EU Bank Launches Ambitious New Climate Strategy and Energy Lending Policy, 2019-313-EN. 2019. Available online: https://www.eib.org/en/press/all/2019-313-eu-bank-launches-ambitiousnew-climate-strategy-and-energy-lending-policy (accessed on 18 July 2021).
- Martins, J.; Miles, J. A techno-economic assessment of battery business models in the UK electricity market. Energy Policy 2021, 148, 111938. [Google Scholar] [CrossRef]
- Guandalini, G.; Campanari, S.; Romano, M.C. Power-to-gas plants and gas turbines for improved wind energy dispatchability: Energy and economic assessment. Appl. Energy 2015, 147, 117–130. [Google Scholar] [CrossRef]
- Özdemir, Ö.; Hobbs, B.F.; Van Hout, M.; Koutstaal, P.R. Capacity vs energy subsidies for promoting renewable investment: Benefits and costs for the EU power market. Energy Policy 2020, 137, 111166. [Google Scholar] [CrossRef]
- Maroufmashat, A.; Fowler, M. Transition of future energy system infrastructure; through power-to-gas pathways. Energies 2017, 10, 1089. [Google Scholar] [CrossRef] [Green Version]
- Becker, W.I.; Penev, M.; Braun, R.J. Production of synthetic natural gas from carbon dioxide and renewably generated hydrogen: A techno-economic analysis of a power-to-gas strategy. J. Energy Resour. Technol. 2019, 141, 021901. [Google Scholar] [CrossRef]
- Guilera, J.; Morante, J.R.; Andreu, T. Economic viability of SNG production from power and CO2. Energy Convers. Manag. 2018, 162, 218–224. [Google Scholar] [CrossRef]
- Bassano, C.; Deianaa, P.; Vilardi, G.; Verdone, N. Modeling and economic evaluation of carbon capture and storage technologies integrated into synthetic natural gas and power-to-gas plants. Appl. Energy 2020, 263, 114590. [Google Scholar] [CrossRef]
- Chauvy, R.; Dubois, L.; Lybaert, P.; Thomas, D.; De Weirel, G. Production of synthetic natural gas from industrial carbon dioxide. Appl. Energy 2020, 260, 114249. [Google Scholar] [CrossRef]
- Böhm, H.; Zauner, A.; Rosenfel, D.C.; Tichler, R. Projecting cost development for future large-scale power-to-gas implementations by scaling effects. Appl. Energy 2020, 264, 114780. [Google Scholar] [CrossRef] [Green Version]
- Marchisio, L.; Alvaro, C.; Cerchiara, S.; Sisinni, M.; Siviero, A. The role of Power-to-Gas and electrochemical storage systems in a climate-neutral energy system. In Proceedings of the AEIT International Annual Conference (AEIT), Catania, Italy, 23–25 September 2020. [Google Scholar]
- Miao, B.; Giordano, L.; Chan, S.H. Long-distance renewable hydrogen transmission via cables and pipelimes. Int. J. Hydrog. Energy 2021, 46, 18699–18718. [Google Scholar] [CrossRef]
- Welder, L.; Stenzel, P.; Ebersbach, N.; Markewitz, P.; Robinius, M.; Emonts, B.; Stolten, D. Design and evaluation of hydrogen electricity reconversion pathways in national energy systems using spatially and temporally resolved energy system optimization. Int. J. Hydrog. Energy 2019, 44, 9594–9607. [Google Scholar] [CrossRef]
- Momeni, M.; Soltani, M.; Hosseinpour, M.; Nathwani, J. A comprehensive analysis of a power-to-gas energy storage unit utilizing captured carbon dioxide as a raw material in a large-scale power plant. Energy Convers. Manag. 2021, 227, 113613. [Google Scholar] [CrossRef]
- GOV.UK. Digest of UK Energy Statistics (DUKES): Electricity. Power Stations in the United Kingdom, May 2021 (DUKES 5.11). Available online: https://assets.publishing.service.gov.uk/government/uploads/system/uploads/attachment_data/file/1006721/DUKES_5.11.xls (accessed on 5 January 2021).
- GOV.UK. Digest of UK Energy Statistics (DUKES): Electricity. Plant Loads, Demand and Efficiency (DUKES 5.10). Available online: https://assets.publishing.service.gov.uk/government/uploads/system/uploads/attachment_data/file/1006720/DUKES_5.10.xls (accessed on 5 January 2021).
- DRAX. Electricity Insights Quaterly. October to December 2020. Available online: https://reports.electricinsights.co.uk/wp-content/uploads/2021/02/Drax-Electric-Insights-Q4-2020-Report.pdf (accessed on 5 January 2021).
- Peterson, D.; Vickers, J.; DeSantis, D. Hydrogen Production Cost from PEM Electrolysis—2019. DOE Hydrogen and Fuel Cells Program Record. 2020. Available online: https://www.hydrogen.energy.gov/pdfs/19009_h2_production_cost_pem_electrolysis_2019.pdf (accessed on 10 February 2021).
- Electricity Generation Costs 2020. Department for Business, Energy & Industrial Strategy (BEIS) of UK. Available online: https://assets.publishing.service.gov.uk/government/uploads/system/uploads/attachment_data/file/911817/electricity-generation-cost-report-2020.pdf (accessed on 10 February 2021).
- Chiesa, P.; Lozza, G.; Mazzocchi, L. Using hydrogen as gas turbine fuel. J. Eng. Gas Turbines Power 2005, 127, 73–80. [Google Scholar] [CrossRef] [Green Version]
- Cesaro, Z.; Ives, M.; Nayak-Luke, R.; Mason, M.; Bañares-Alcántara, R. Ammonia to power: Forecasting the levelized cost of electricity from green ammonia in large-scale power plants. Appl. Energy 2021, 282, 116009. [Google Scholar] [CrossRef]
- Nose, M.; Kawakami, T.; Araki, H.; Senba, N.; Tanimura, S. Hydrogen-fired Gas Turbine Targeting Realization of CO2-free Society. Mitsubishi Heavy Ind. Tech. Rev. 2018, 55, 1–7. [Google Scholar]
- Mitsubishi Hitachi Power Systems. Intermountain Power Agency Orders MHPS JAC Gas Turbine Technology for Renewable-Hydrogen Energy Hub. 10 March 2020. Available online: https://amer.mhps.com/intermountain-power-agency-orders-mhps-jac-gas-turbine-technology-for-renewable-hydrogen-energy-hub.html (accessed on 20 June 2021).
- Leading the Way to Net-Zero in Europe. 2021. Available online: https://www.ge.com/content/dam/gepower-new/global/en_US/downloads/gas-new-site/future-of-energy/whitepaper-decarbonisation-europe-may-3-%202021.pdf (accessed on 20 June 2021).
- Hydrogen as a Fuel for Gas Turbines. 2021. Available online: https://www.ge.com/content/dam/gepower-new/global/en_US/downloads/gas-new-site/future-of-energy/hydrogen-fuel-for-gas-turbines-gea34979.pdf (accessed on 20 June 2021).
- Siemens Gas and Power. HYFLEXPOWER: The World’s First Integrated Power-to-X- to-Power Hydrogen Gas Turbine Demonstrator. 29 May 2020. [Online]. Available online: https://press.siemens.com/global/en/pressrelease/hyflexpower-worlds-first-integrated-power-x-power-hydrogen-gas-turbine-demonstrator (accessed on 20 June 2021).
- Siemens Gas and Power. Hydrogen Power with Siemens Gas Turbines. 2020. Available online: https://www.infrastructureasia.org/-/media/Articles-for-ASIA-Panel/Siemens-Energy---Hydrogen-Power-with-Siemens-Gas-Turbines.pdf?la=en&hash=1B91FADA342293EFB56CDBE312083FE1B64DA111 (accessed on 20 June 2021).
- Power-to-X: The Crucial Business on the Way to a Carbon-Free World. 2021. Available online: https://www.siemens-energy.com/global/en/offerings/technical-papers/download-power-to-x.html (accessed on 20 June 2021).
- Hydrogen Gas Turbines. The Path towards a Zero-Carbon Gas Turbine. ETN Global. January 2020. Available online: https://etn.global/wp-content/uploads/2020/02/ETN-Hydrogen-Gas-Turbines-report.pdf (accessed on 20 June 2021).
- Capital Cost and Performance Characteristic Estimates for Utility Scale Electric Power Generating Technologies (2020). U.S. Energy Information Administration, an Agency of the U.S. Department of Energy. Project 13651.0051. Available online: https://www.eia.gov/analysis/studies/powerplants/capitalcost/pdf/capital_cost_AEO2020.pdf (accessed on 20 July 2021).
- Keith, D.W.; Holmes, G.; Angelo, D.S.; Heidel, K. A Process for Capturing CO2 from the Atmosphere. Joule 2018, 2, 1573–1594. [Google Scholar] [CrossRef] [Green Version]
- Daniel Remi. Decommissioning US Power Plants. Decisions, Costs, and Key Issues. 2017. Available online: https://media.rff.org/documents/RFF20Rpt20Decommissioning20Power20Plants.pdf (accessed on 20 July 2021).
- IEA. Projected Costs of Generatinf Electricity 2020 Edition. Available online: https://www.iea.org/reports/projected-costs-of-generating-electricity-2020 (accessed on 5 August 2021).
- Mahajan, D.; Tan, K.; Venkatesh, T.; Kileti, P.; Clayton, C.R. Hydrogen Blending in Gas Pipeline Networks—A Review. Energies 2022, 15, 3582. [Google Scholar] [CrossRef]
- Decision Tools Suit 8.8 Industrial Student. License from 16 August 2021. Palisade Europe UK LtdC/O KPMG LLP. One St Peters Square, Manchester, M2 3AE United Kingdom. Quote Number Q001817. Available online: https://www.palisade.com/cart/products_en.asp?cat=51&panel=0 (accessed on 16 August 2021).
- Green Book Supplementary Guidance: Valuation of Energy Use and Greenhouse Gas Emissions for Appraisal. Table 3: Carbon Prices and Sensitivities 2010–2100 for Appraisal, 2020£/t CO2e. Department for Business, Energy & Industrial Strategy (BEIS) of UK. Available online: https://www.gov.uk/government/publications/valuation-of-energy-use-and-greenhouse-gas-emissions-for-appraisal (accessed on 17 August 2021).
- Annual Report on the Operation of the Capacity Market in 2017/18. OFGEM. Available online: https://www.ofgem.gov.uk/sites/default/files/docs/2018/08/20180802_annual_report_on_the_operation_of_cm_2017-18_final.pdf (accessed on 17 August 2021).
- Report on the Operation of the Capacity Market in 2018/19. OFGEM. Available online: https://www.ofgem.gov.uk/sites/default/files/docs/2020/03/2018-19_annual_report_on_the_operation_of_cm.pdf (accessed on 17 August 2021).
Publisher’s Note: MDPI stays neutral with regard to jurisdictional claims in published maps and institutional affiliations. |
© 2022 by the authors. Licensee MDPI, Basel, Switzerland. This article is an open access article distributed under the terms and conditions of the Creative Commons Attribution (CC BY) license (https://creativecommons.org/licenses/by/4.0/).